


Abstract
The efficiency of scientific and technological achievement transformation is constrained by supply–demand matching challenges. Concurrently, Artificial Intelligence (AI) offers novel pathways for digital-intelligence service platforms to mitigate this challenge. To resolve AI investment decision problems of such platforms, this study constructs a bilateral matching model involving high-quality/low-quality technology providers and high-capability/low-capability technology seekers. Based on expected value theory and Stackelberg games, it derives optimal AI investment strategies for the Commercial Platform (platform’s expected revenue maximisation objective) and the Public Welfare Platform (social expected revenue maximisation objective). Findings indicate that higher AI investment contributes to a rise in the matching probability between high-quality providers and high-capability demanders. Owing to incomplete benefit internalization, platforms of different types show divergent willingness for AI investment. The AI investment level of the Commercial Platform is lower than that of the Public Welfare Platform, which results in losses of expected matching value. Furthermore, declines in AI technology costs and reduced external selection value of suppliers will drive platforms to raise their AI investment intensity. This research provides theoretical foundations for optimising AI strategies in online technology transfer service platforms and informing targeted government interventions.
Keywords:
technology transfer; digital-intelligence service platform; artificial intelligence; platform matching MSC:
91-00
1. Introduction
Scientific and technological innovation constitutes a core driver of national development, with the transformation of scientific and technological achievements serving as a pivotal link in the innovation chain and an indispensable stage for converting such achievements into tangible productive forces [1]. Enhancing the efficiency of matching supply and demand for scientific and technological achievements is undoubtedly a vital strategy for accelerating their transformation. Numerous online platforms for transforming scientific and technological achievements have emerged in practice. As crucial bridges connecting the supply of scientific and technological achievements to industrial demand, these online platforms directly determine the efficiency and quality of scientific and technological achievement transformation through their operational effectiveness [2]. A representative online platform in this field is the US-based Yet2, which was launched in 1999. Its operational performance remains highly commendable, with over 10,000 successful introductions delivered to clients and a success rate of 92%. Additionally, numerous online technology transfer service platforms have emerged in China in recent years, such as “Zhuan Guoguo” and “Keyi Market”. By the end of 2025, the “Zhuan Guoguo” platform had listed over 16,000 scientific and technological achievements (including 4191 high-value achievements), facilitated nearly 2300 technology requests, connected over 1000 service institutions, and served more than 2.4 million technology enterprises. These online technology transfer service platforms acquire inventions from universities or public research institutions, such as Flintbox and iBridgenetwork, while others primarily receive inventions from the private sector, including Tynax and Yet2 [3].
Recent years have witnessed breakthrough developments of Artificial Intelligence (AI) technology, which has been extensively applied in commercial contexts [4]. For instance, within the e-commerce platform sector, AI empowers platforms to implement intelligent customer service, personalised recommendations, content moderation, precision marketing, automated operations, and data analytics, significantly enhancing user experience and operational efficiency [5,6,7]. Notably, certain online technology transfer service platforms have also adopted “AI + technology transfer” strategies. For instance, China’s “Zhuan Guoguo” and “Keyi Market” pioneered the integration of AI agents, positioning themselves as AI-empowered digital-intelligence technology transfer service platforms to enhance the efficiency of matching technology supply and demand. Compared to e-commerce platforms, online digital-intelligence service platforms for technology transfer face greater challenges in matching supply and demand. This stems from the inherent complexity of transaction subjects, where achievements themselves are difficult to describe using standard scientific language, thereby creating significant natural barriers to matching [8]. For instance, as of January 2020, the Zhejiang Market had released 246,717 scientific and technological achievements and signed 47,411 contracts, representing merely 19.22% [2]. Should an online digital intelligence service platform for scientific and technological achievement transformation incorporate a dedicated AI large model, it could overcome the initial matching hurdles in the transformation process by deeply analysing multidimensional information and conducting precise compatibility assessments. AI agents possess core capabilities, including in-depth demand analysis, feasibility report generation, and precise resource matching. Supported by keyword-input interaction, they provide intelligent solutions for various needs such as achievement transformation, expert liaison, and proposal drafting. Upon user input of a technical keyword, the AI agent deeply analyses the core elements of that technology, identifies key requirements, and plays a positive role in assessing achievement quality and precise identification.
Two operational models exist for digital-intelligence-driven technology transfer platforms: The Commercial Platform is typically enterprise-led, with expected revenue maximisation as its operational objective; and the Public Welfare Platform is usually government-led, with social welfare maximisation as its operational objective. The research motivation of this paper lies in clarifying the following issues for both types of platforms: (1) Whilst AI technology can generate economic value for platforms, its deployment also incurs corresponding investment costs. After comprehensively weighing benefits against costs, is it still necessary for platforms to implement AI strategies? (2) Furthermore, under what circumstances is implementing an AI strategy a superior choice for platforms? (3) When platforms do implement AI strategies, what constitutes their optimal investment strategy? And how do the investment strategies of the two platform types differ?
To address these questions, this paper examines an online digital-intelligence service platform for technology transfer. The platform invests in AI applications to enhance its accuracy in identifying the types of entities involved in technology supply and demand, thereby improving the success rate of matching these parties. Importantly, this study does not model the internal architecture or technical implementation of AI systems; instead, AI is treated as an exogenous, accuracy-enhancing matching technology whose sole role is to improve the precision of supply–demand identification and pairing. First, this paper quantifies the accuracy of AI-driven identification of technology achievement supply and demand entities. Second, based on expected value theory and Stackelberg game theory, a three-stage optimisation model for the platform is constructed. Finally, by solving and analysing the optimal solutions, the paper identifies the preconditions for the platform to implement AI strategies, its optimal investment strategy and commission rate settings, and compares the differences in AI investment strategies between the two operational models.
The remaining sections are organised as follows. Section 2 presents the literature review, outlining the current state of research and identifying gaps relevant to this study. Section 3 establishes the analytical framework, detailing the research questions and model assumptions. Section 4 analyses the platform’s equilibrium outcomes, deriving principal conclusions. Section 5 provides a summary of the entire paper.
2. Literature Review
2.1. Mechanisms for Technology Transfer and Platform Evolution
Innovation is the primary driving force for development. Enhancing industrial vitality urgently requires the efficient advancement of the transformation of scientific and technological achievements [9]. The transformation of scientific and technological achievements refers to the process of deeply integrating scientific and technological outcomes with economic activities [10]. It constitutes a pivotal link in the national innovation system [11] and provides significant support for the high-quality development of modern economic systems [12]. However, compared to ordinary goods or services, matching the supply and demand of scientific and technological achievements inherently presents greater difficulties. Demand-side entities often struggle to translate practical problems into scientific research terminology, while supply-side entities find it challenging to grasp real-world application scenarios [8]. Moreover, the practical implementation of technology transfer frequently encounters numerous real-world challenges. These include inadequate dissemination of technology achievement information [13], insufficiently refined methods for evaluating the value of high-quality scientific and technological achievements [14], unstable collaboration due to trust deficits and conflicting interests between supply and demand entities [15], and the absence of specialised service platforms. These bottlenecks have spurred the development of technology transfer platforms [16] integrating user management, achievement display, and transaction facilitation, alongside professional social matching (PSM) systems to advance technology transfer and commercialisation [17]. Such platforms effectively facilitate resource matching by establishing a two-sided market structure connecting technology providers and demanders, significantly enhancing the efficiency and effectiveness of technology transfer [16]. Academia also refers to these platforms as Online Technology Marketplaces, positing that industries characterised by high technology search costs, significant uncertainty regarding potential applications, and greater capacity to protect inventions from encroachment are particularly in need of online marketplace services [3]. Hu et al. [18] systematically demonstrated the platformisation development of technology achievement transformation, and pointed out that digital platforms have gradually replaced decentralised offline transaction modes as the core carrier of technology commercialization.
As the primary generators of scientific and technological achievements, universities play a pivotal role in the transformation process. Research indicates that the efficiency of university technology transfer not only correlates closely with regional economic growth [10] but also positively contributes to low-carbon economic development [19]. However, existing empirical research indicates that the overall conversion performance of universities remains at a moderate level, with particularly lagging performance in developing countries or economically underdeveloped regions [20], suggesting considerable scope for optimisation in this field [21]. This reality underscores the necessity of establishing intelligent, specialised conversion platforms and provides both theoretical justification and practical motivation for subsequently introducing artificial intelligence technologies to empower platform operations.
2.2. Application of Artificial Intelligence in Online Trading Platforms
With the rapid advancement of emerging technologies such as AI, academic research into intelligent applications within online trading platforms has deepened considerably [22,23]. AI technology significantly enhances user engagement and purchasing intent through multiple pathways, including personalised recommendation systems, real-time interactive features, and intelligent customer service [24,25,26,27], while effectively reducing or mitigating consumer return behaviour [24,28,29]. Early research focused on technical implementation, such as the knowledge-based chatbot developed by Ngai et al. [30], who integrated natural language processing (NLP) and AI technologies to significantly improve customer service efficiency and interaction quality [25]. Subsequent research has deepened: Shankar et al. [31] enhanced recommendation accuracy through ensemble learning and multimodal user behaviour data; Deng et al. [32] generated personalised product responses via multi-perspective preference modelling.
Recent empirical studies further validate AI’s commercial value, demonstrating that the marginal return of AI capabilities on corporate profits increases with enhanced product matching potential [33,34] conducted a randomised field experiment revealing that deploying AI assistants in live-streaming e-commerce scenarios increased sales by 3.00% and reduced return rates by 12.55%. Concurrently, scholars began examining user cognition and trust mechanisms. Zhang et al. [35] explored the “personalisation-privacy paradox” in intelligent voice assistants, revealing emotional attachment’s pivotal role in moderating users’ privacy trade-offs and information disclosure behaviours. Chang and Hsiao [36] identified how functional and psychological barriers trigger negative emotions, thereby inhibiting users’ willingness to adopt chatbots, emphasising the need for systematic approaches to address user resistance in AI deployment.
It is noteworthy that AI applications have transcended traditional retail boundaries to expand into diverse scenarios. For instance, Song et al. [37] demonstrated in a metaverse e-commerce case study that the synergy between AI and visual design can significantly enhance user experience and drive economic growth. Furthermore, Zhou et al. [38] adopted a strategic perspective to analyse how market competition dynamics and consumer search costs influence adoption decisions for recommendation systems.
Generative artificial intelligence (GenAI) has emerged as a transformative enabler for modern supply chains, providing novel avenues for intelligent decision optimisation and operational automation [39]. Beyond supply chain optimisation, GenAI continues to reshape the ecosystem of e-commerce. Increasing numbers of platforms have deployed AI assistants to enhance user experience, and AI-powered recommendation systems have been verified to significantly strengthen consumers’ decision-making confidence [40]. In addition to boosting consumer purchase confidence on digital platforms, Lu et al. [41] identify a critical matching effect of GenAI. Specifically, AI-dominated human–machine collaboration enhances user engagement with informational content through cognitive resonance. This insight is particularly applicable to the technology achievement transformation context investigated in this study, where GenAI plays an even more essential role in facilitating and elevating user interactive efficiency.
2.3. Research Gap
In summary, existing research has made significant strides in both the transformation of scientific and technological achievements and the application of artificial intelligence to empower online platforms. Nevertheless, substantial theoretical gaps and practical blind spots persist.
On one hand, while studies on technology transfer have identified core obstacles such as information asymmetry, trust deficits, and platform gaps [13,16], and emphasised the pivotal role of specialised platforms in matching supply and demand and enhancing efficiency, their exploration of internal platform operational mechanisms remains rather cursory. Existing work predominantly focuses on institutional design, policy incentives, or organisational collaboration models (e.g., [20,21]), yet generally overlooks how digital and intelligent technologies can be deeply embedded within platform operations to systematically optimise conversion efficacy. Particularly against the backdrop of rapid AI advancement, the theoretical framework for reconfiguring the discovery, matching, and transaction processes of scientific and technological achievements through intelligent means remains underdeveloped.
Conversely, while research on AI applications within general e-commerce platforms has matured considerably—encompassing recommendation algorithms, interactive experiences, and user trust [24,31,35]—these findings primarily stem from standardised commodities or high-frequency consumption scenarios. Consequently, their conclusions prove difficult to directly transfer to the highly non-standardised, complex, low-frequency, and expert-judgement-dependent context of scientific and technological achievement transformation. More significantly, as noted by Yang et al. [24], Xu et al. [28], and Yang et al. [29], the existing literature generally treats AI as an exogenous technological tool rather than an endogenous strategic variable that platforms can actively configure and optimise. Consequently, there is a lack of mechanistic analysis examining how the level of AI investment impacts platform performance.
Crucially, research on technology transfer platforms and intelligent e-commerce systems has long remained compartmentalised: the former focuses on techno-economic integration while neglecting AI-driven empowerment, while the latter delves into AI applications yet remains detached from the specificities of high-value knowledge asset transactions. This dual disciplinary and contextual isolation has created a significant interdisciplinary research gap: within digitalised technology transfer platforms, AI should not merely serve as an auxiliary functional module but be regarded as a strategic investment requiring careful cost-benefit deliberation. Platform managers urgently need to address: under what conditions should AI deployment intensity be increased? Does the impact of varying AI capabilities on conversion efficiency and success rates exhibit heterogeneity? How can AI value be maximised?
This paper addresses this dual gap by explicitly defining AI investment as an optimisable decision variable within technology transfer platforms, systematically exploring its strategic allocation logic and economic effects. By bridging the research strands of “technology transfer mechanisms” and “platform intelligent decision-making”, this study not only expands the theoretical boundaries of digital-intelligent innovation platforms but also provides an actionable decision-making framework and practical pathway for building an efficient, trustworthy, and intelligent national technology transfer system.
3. Analytical Framework
3.1. Problem Description
This paper considers an online digital-intelligent service platform for the transformation of scientific and technological achievements. Its core function is to facilitate transactions between providers of scientific and technological achievements (such as universities, research institutes, new R&D institutions, and research teams possessing independent intellectual property rights) and demanders of such achievements (such as manufacturing enterprises, high-tech enterprises, and traditional industry enterprises seeking technological upgrades or product innovation). Providers on the platform are categorised into two types based on achievement quality: high-quality (denoted as H), accounting for ; and low-quality (denoted as L), accounting for . Similarly, demanders are classified into two types based on achievement transformation capability: high-capability (denoted as H), accounting for ; and low-capability (denoted as L), accounting for .
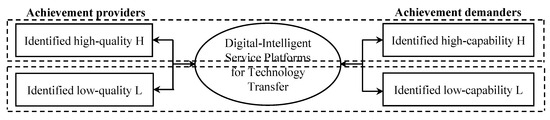
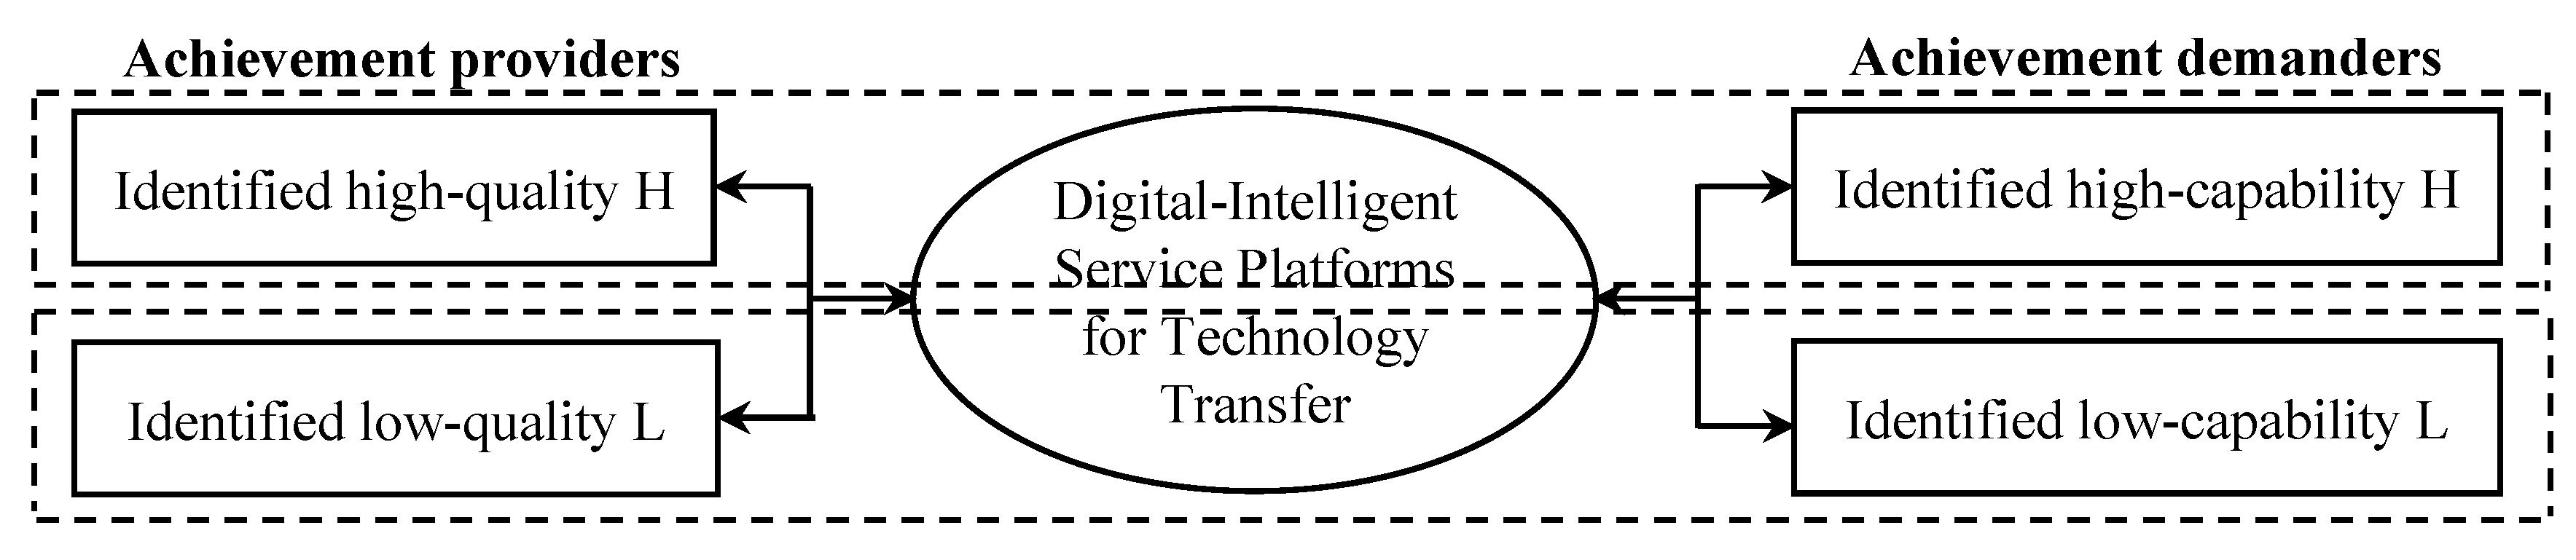
Unlike standardised commodity trading platforms, the scientific and technological achievements transacted on such platforms exhibit high heterogeneity [42]. Their ultimate value depends not only on the quality of the achievements themselves but also heavily on the absorption and conversion capabilities of the demand side. Consequently, matching quality becomes pivotal to platform efficiency. Based on the identified types of providers and demanders, the platform facilitates transactions according to the principle of matching high quality with high capability and low quality with low capability, as illustrated in Figure 1.
Figure 1.
Platform-facilitated transactions.
Leveraging AI technology, the platform can deeply comprehend the semantic meaning of descriptions of scientific and technological achievements and corporate demand texts, intelligently matching the two to ultimately enhance the accuracy of type recognition for both supply and demand sides. However, this paper does not model the internal architecture or learning dynamics of the AI system; rather, AI is abstracted as an exogenous matching technology whose accuracy level is a controllable outcome of the platform’s investment decision. The platform generates revenue by charging providers a transaction commission rate . The platform must jointly determine two key variables: (1) the level of AI investment , used to improve matching accuracy; (2) the commission rate , which affects providers’ willingness to participate.
3.2. AI-Driven Type Identification Mechanism
Our model abstracts away from discussing the internal structure of various AI systems, and the core positioning of AI in this work is an auxiliary matching tool to boost matching accuracy. Without AI assistance, the platform may attempt to identify participants’ true types through non-AI means such as manual verification or information reporting checks. However, constrained by efficiency, cost, or subjective judgement bias, it struggles to achieve comprehensive, precise, and scalable identification of participants’ true types. At this stage, type identification accuracy stands at 50% (i.e., the optimal performance achievable through random guessing). By investing -level AI resources, the platform can enhance its capability to identify the true types of both supply and demand sides. This can be interpreted as the platform improving the precision of outcome information [43] or user profiling accuracy [44]. This paper employs the following function to characterise identification accuracy:
this function satisfies the following reasonable properties:
- (1)
- Baseline accuracy: , corresponding to random matching without AI;
- (2)
- Monotonic increase: , where greater AI investment yields higher identification accuracy;
- (3)
- Diminishing marginal returns: , reflecting the AI engineering principle that “improvements become increasingly difficult to achieve”;
- (4)
- Asymptotically perfect yet unattainable: , yet for any finite , holds, reflecting the limitations of digital intelligence technologies.
While is general, it accurately captures the economic characteristic of AI investment in practice. In real-world scenarios (especially for Technology Transfer Platforms), deploying AI (such as semantic recognition models) requires significant capital. The function reflects the reality that while AI can surpass the “random matching” baseline (50%), achieving perfect accuracy is asymptotically difficult and costly—a feature highly relevant to current AI applications like Large Language Models which are powerful but not error-proof.
3.3. Matching Value and Expected Matching Value
When a transaction occurs between supply and demand parties with a true type of , the resulting matching value (i.e., societal value) is , defined as follows:
where represents the benchmark value for technology transfer transactions; denotes the synergy premium arising from the matching of high-quality outcomes with high-capability enterprises. The value of (L, H) is set lower than the benchmark. This scenario refers to low-quality technological achievements matched with high-capability enterprises. Restricted by the inherent inferior quality of achievements, its transformation value remains limited even paired with competent firms. In contrast, (H, L) represents high-quality technologies matched with low-capability enterprises, which still deliver considerable transformation value. denotes the value disparity between them. reflect the value depreciation resulting from low enterprise capabilities; assuming , this ensures even the worst-case match (low quality–low capability) still generates positive value.
embodies a positive matching preference: high-quality providers prefer collaborating with high-capability enterprises (due to ), while high-capability enterprises also favour acquiring high-quality achievements (due to ).
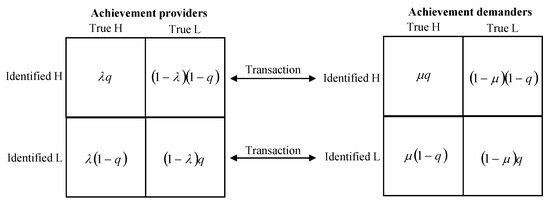
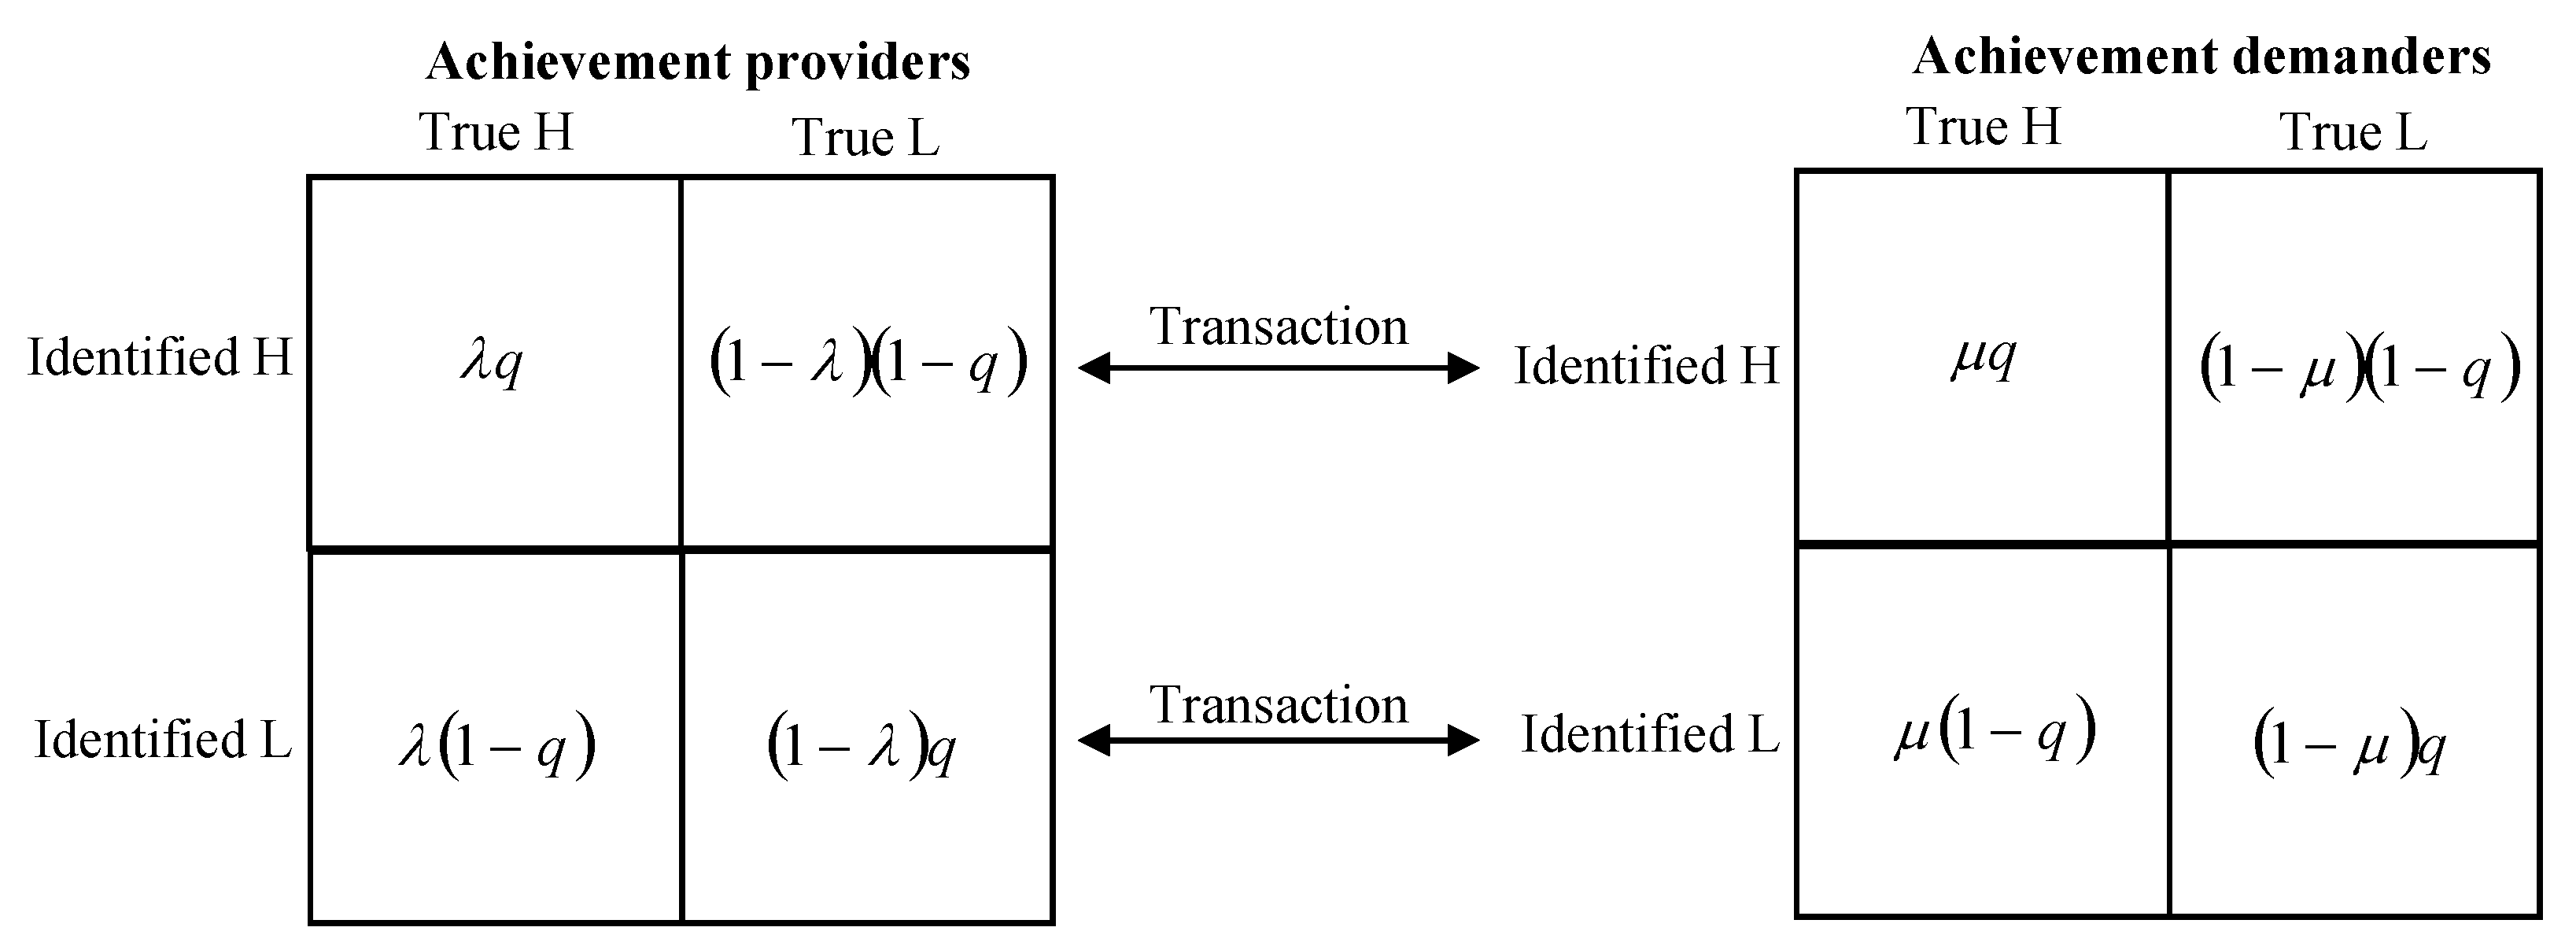
This paper assumes that once a match is successful, the transaction price equals the matching value generated by that match , meaning the demand side pays the full benefit received. This aligns with the common practice of “value-based pricing” in B2B technology transactions. The platform extracts a transaction commission at a rate , yielding a per-transaction revenue of . To calculate the platform’s expected revenue, we must derive the expected matching value when the AI’s true type identification accuracy is (regardless of whether the true type is H or L). Assuming the identification errors of both parties are mutually independent. Due to AI identification inaccuracies, the platform’s recommended matches may be based on erroneous types. Crucially, however, once a transaction occurs, its value remains determined by the actual type regardless of the identification outcome. Whether a match occurs depends solely on whether the AI places both parties within the same recommendation pool. Consequently, eight actual transaction scenarios exist on the platform: four high-quality matches with high capability recognition (HH, HL, LH, LL) and four low-quality matches with low capability recognition (HH, HL, LH, LL). The specific matching structure is illustrated in Figure 2.
Figure 2.
Supply–demand matching structure.
Based on Equation (2) and incorporating the matching structure depicted in Figure 2, through derivation and simplification, the expected matching value is expressed as follows (see Appendix A for the main result proofs in this paper):
where , .
3.4. Platform Revenue and Provider Participation Constraints
The platform’s expected revenue per match is . The platform’s investment cost in AI is modelled as a quadratic function of the target accuracy level, i.e., , where e denotes the AI investment level. This functional form captures the empirically observed phenomenon of increasing marginal costs associated with improving AI accuracy: as the platform seeks higher precision in matching, it must incur disproportionately larger expenditures on high-quality labelled data, computational resources for model training and fine-tuning, specialized human expertise in model development, and system integration for real-world deployment. These factors collectively render each incremental gain in accuracy increasingly costly, justifying the use of a convex—specifically quadratic—cost structure. This specification has been widely adopted in supply chain management research [45,46]. Hence the platform’s expected revenue is:
To ensure reasonable economic implications, we assume (the detailed explanation is provided in Appendix A.2). When , the expected matching value stays constant. When , the expected matching value attains its maximum at . This means matching accuracy improves with increased investment , yet the expected matching value strictly decreases, which conflicts with practical economic facts. Furthermore, providers possess external options (such as independently connecting with enterprises or applying for government grants), with a retention utility of . Since the provider’s revenue from using the platform is , to ensure their participation, the following must be satisfied: . Let , then .
3.5. Sequence of Games
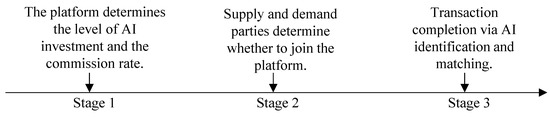
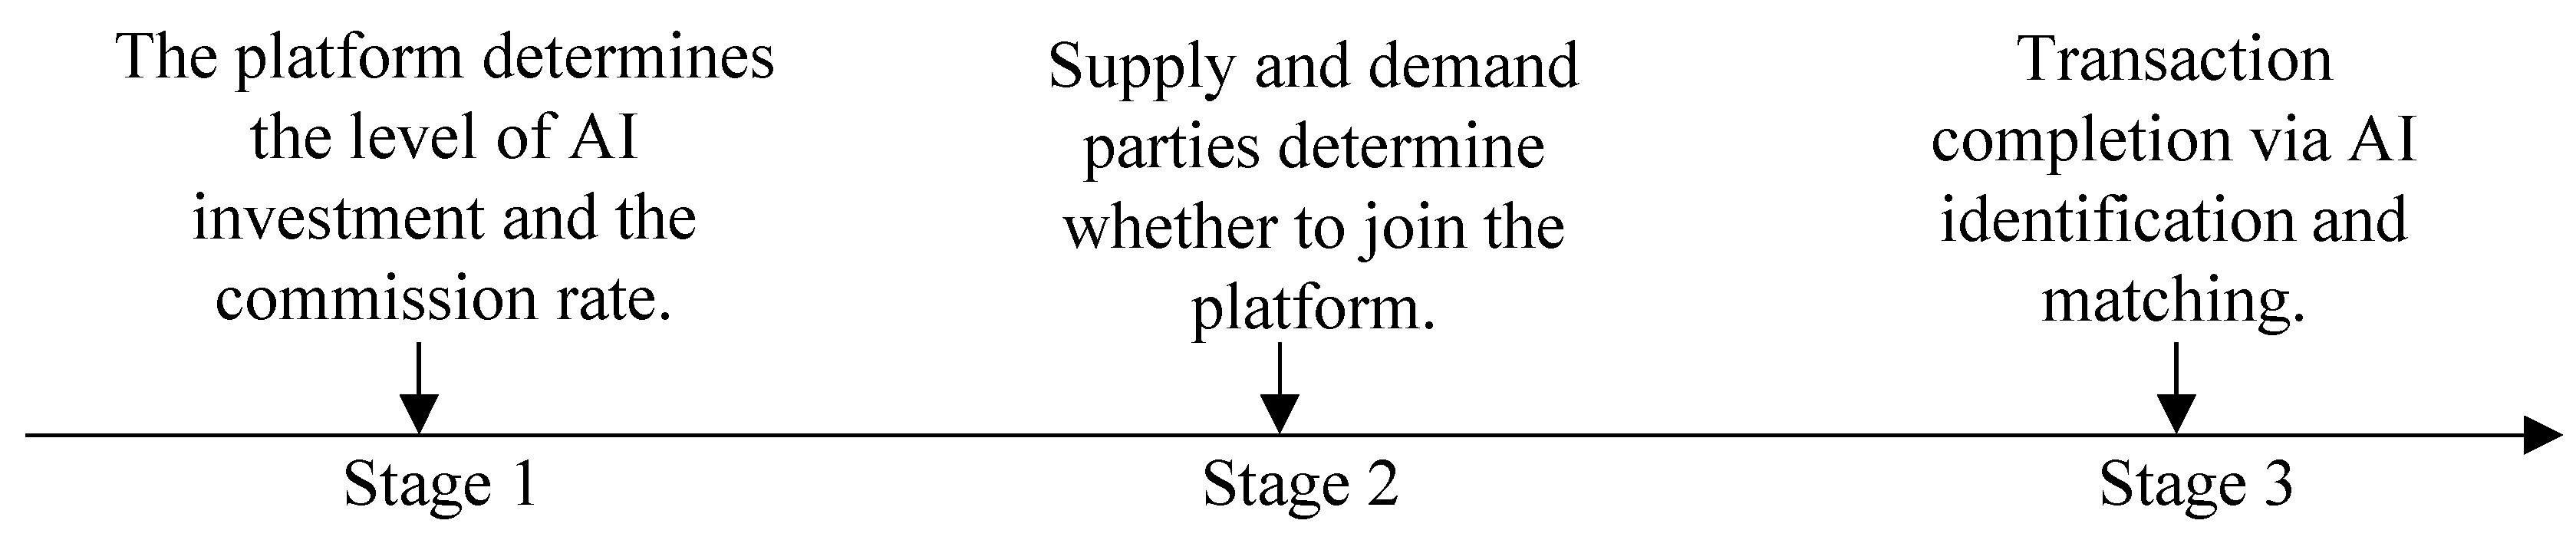
This paper employs a three-stage Stackelberg game to characterise the interaction between the platform and market participants, as illustrated in Figure 3.
Figure 3.
Game sequence.
- (1)
- Stage 1: Platform Selection
- (2)
- Stage 2: Both supply and demand sides decide whether to join the platform (assuming all participation constraints are satisfied, full participation occurs);
- (3)
- Stage 3: AI identification, matching execution, and transaction completion.
3.6. Symbols and Definitions
The model symbols and their meanings used in this paper are summarised in Table 1.
Table 1.
Symbols and definitions for models.
4. Platform Equilibrium Outcome Analysis
Considering the existence of two operational models for platforms in the market: one constructed under corporate leadership (e.g., Keyi Market), pursuing maximisation of economic profit, and the other constructed under government leadership (e.g., Zhejiang Market), pursuing maximisation of social welfare, this paper designates the former as the Commercial Platform and the latter as the Public Welfare Platform. Given their fundamentally divergent operational objectives, examining their differing AI strategies warrants attention. The equilibrium outcomes of both platform types are analysed in the following to derive practical insights.
4.1. Commercial Platform (Model p)
Based on the preceding model description, the optimisation problem for the Commercial Platform can be expressed as
Solving this optimisation problem yields Proposition 1.
Proposition 1.
The optimal commission rate for the Commercial Platform is; the optimal level of AI investment is
; the optimal expected revenue is
.
Proposition 1 indicates the existence of a critical cost coefficient that determines whether the platform should invest in AI. If the cost coefficient falls below this threshold (), the platform should invest in AI; conversely, it should not. This illustrates from another perspective that not all platforms are suited for AI investment. AI only becomes economically viable when implementation costs are low. This explains why some online technology transfer service platforms (e.g., Keyi Market, Zhuan Guoguo) are enthusiastic about AI, while others (e.g., Yet2, Innovation China) adopt a wait-and-see approach.
Proposition 2.
The optimal decision for the Commercial Platform and satisfies the following relationships: (1) ; (2) is a continuous function of c; (3) when , it holds that and .
Proposition 3.
The optimal expected revenue
of the Commercial Platform satisfies the following relations: (1) is a continuous function of c; (2) when , it holds that and ; (3) when , it holds that .
From Propositions 2 and 3, it follows that the optimal AI investment decision and optimal expected revenue for the Commercial Platform are jointly shaped by both technological costs and market conditions. Firstly, rising AI technological costs directly elevate marginal investment costs, suppressing the platform’s willingness to invest in AI and reducing expected returns. When technological costs reach a certain threshold, the platform abandons AI investment, resulting in minimal expected revenue. This demonstrates the constraining effect of technological feasibility on digitalisation strategies. Secondly, when the external option value offered by technology providers increases, platforms must reduce commission rates to retain provider participation. This diminishes the revenue share derived from precise matching, ultimately lowering AI investment levels and reducing expected revenue. This outcome reveals that when building intelligent matching capabilities, platforms must not only balance technological gains against costs but also coordinate profit distribution with technology providers within a two-sided market structure.
4.2. Public Welfare Platform (Model soc)
This section examines the government-led Public Welfare Platform to explore the optimal AI investment level from a social planner’s perspective, that is, the AI investment corresponding to maximised social expected revenue (the sum of the platform’s expected revenue, provider revenue, and consumer revenue). Consequently, the optimisation problem for the Public Welfare Platform can be expressed as:
Solving this optimisation problem yields Proposition 4.
Proposition 4.
The optimal AI investment level for the Public Welfare Platform is; the optimal expected revenue is .
Proposition 4 indicates that the Public Welfare Platform will adopt AI when the implementation cost . A comparison with Proposition 1 reveals a lower threshold for socially optimal AI investment, demonstrating the Public Welfare Platform’s greater willingness to bear risks and costs to achieve long-term societal benefits. It follows that the Public Welfare Platform should serve as a “testing ground” for AI applications, pioneering the use of cutting-edge AI technologies (such as intelligent matching, automated assessment, and patent recommendation). After accumulating experience, it can then feed insights back to the Commercial Platform.
Proposition 5.
The optimal decision for the Public Welfare Platform satisfies the following relations: (1) is a continuous function with respect to c; (2) when , then holds.
Proposition 6.
The optimal expected revenue of the Public Welfare Platform satisfies the following relations: (1) is a continuous function of c; (2) when , then holds.
From Propositions 5 and 6, it follows that the Public Welfare Platform’s optimal AI investment decisions and total social benefits are profoundly shaped by technological costs. Firstly, rising AI technological costs directly elevate the societal threshold for technology adoption, suppressing the platform’s level of AI investment and leading to a decline in total social benefit. When technological costs reach a certain threshold, the platform abandons AI investment, causing total social benefit to fall to its lowest level. This demonstrates the fundamental constraining effect of technological accessibility on the efficacy of public technology services. Secondly, despite platforms possessing public welfare objectives, their optimal decisions still adhere to cost-benefit trade-offs. Both investment and returns exhibit continuous, smooth variations with cost changes, indicating that public platforms are not idealised entities capable of “unlimited investment” but rather rational decision-makers constrained by practical resource limitations. This outcome reveals that in facilitating the online transaction and transformation of achievements, governments must not only provide guidance but also enhance technological affordability by reducing AI implementation costs (e.g., through subsidies, shared infrastructure development, and open-source tool promotion) to maximise overall societal benefits.
4.3. Comparative Analysis of AI Investment Levels for Both Platforms
Based on the equilibrium results for the two platform types discussed earlier, the optimal AI investment levels under different conditions are summarised in Table 2.
Table 2.
Comparative analysis of optimal AI investment levels for both platforms.
Comparing the optimal AI investment levels for both platforms in Table 2 yields the following propositions.
Proposition 7.
When , the optimal AI investment level for the Commercial Platform (
) is strictly less than that for the Public Welfare Platform ().
Proposition 7 reveals a classic case of underinvestment stemming from positive externalities. The Commercial Platform can only capture a portion of the matching value through commission rates , meaning their private marginal benefit from improving AI accuracy falls short of the social marginal benefit. From the economic perspective, the Commercial Platform maximises expected revenue and sets AI investment at the equilibrium where private marginal benefit equals private marginal cost. By contrast, the Public Welfare Platform accounts for positive spillovers of matching activities, yielding a higher social marginal benefit. As the Commercial Platform fails to fully internalise total matching value, its privately optimal investment falls below the social optimum, resulting in inadequate AI input. Such incomplete benefit internalization weakens investment incentives, and market-oriented decisions of the Commercial Platform tend to undervalue AI’s impact on technological transformation efficiency. This conclusion provides theoretical justification for government intervention: for instance, subsidising AI R&D costs, establishing public semantic repositories to reduce platform recognition costs, or rewarding high-value matches could all correct this efficiency loss.
Example 1.
Let
,
,
,
,
,
,
,
. Table 2 indicates that the optimal AI investment level under the Social Welfare Platform is , while that under the Commercial Platform is
, with the latter being approximately 7.3% lower than the former. The corresponding expected percentage loss in matching value is
. This indicates that the Commercial Platform’s AI investment falls below that of the socially optimal level, resulting in a certain degree of loss in the system’s expected matching value. This finding reveals a minor market failure in the allocation of intelligent matching resources, highlighting the importance of government guidance or intervention by the Public Welfare Platform.
Proposition 8 (AI investment’s promoting effect on high-quality matching).
Let
denote the probability that a genuine high-quality technology provider and a high-capability enterprise are successfully matched by the platform in a single matching instance (i.e., a genuine HH match) when the AI investment level is e. Then: (1) strictly increases with, i.e., ; (2) this promoting effect intensifies as the proportion of high-quality providers or high-capability enterprises increases.
Proposition 8 indicates that in real-world scenarios where both supply and demand types are unobservable, AI investment significantly increases the probability of correct matching between high-quality entities by simultaneously improving identification accuracy for both technology providers and demanders. As matching relies on both parties being correctly identified, the HH matching probability grows at a rate of , demonstrating a multiplier effect of recognition precision. This also implies that if high-quality providers () or high-capability enterprises () are scarce in the market, the absolute number of HH matches remains limited even with high AI precision. Conversely, in niche markets dense with high-quality factors, the matching value of AI is significantly amplified. This result provides theoretical justification for platforms to deploy AI resources differentially across different technological domains.
4.4. Relationship Between AI Investment, Platform Returns, and Relevant Parameters
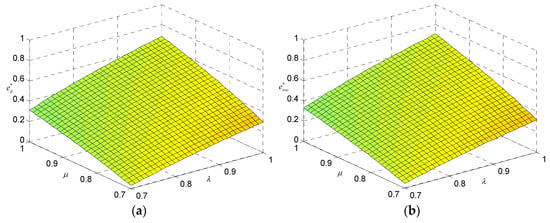
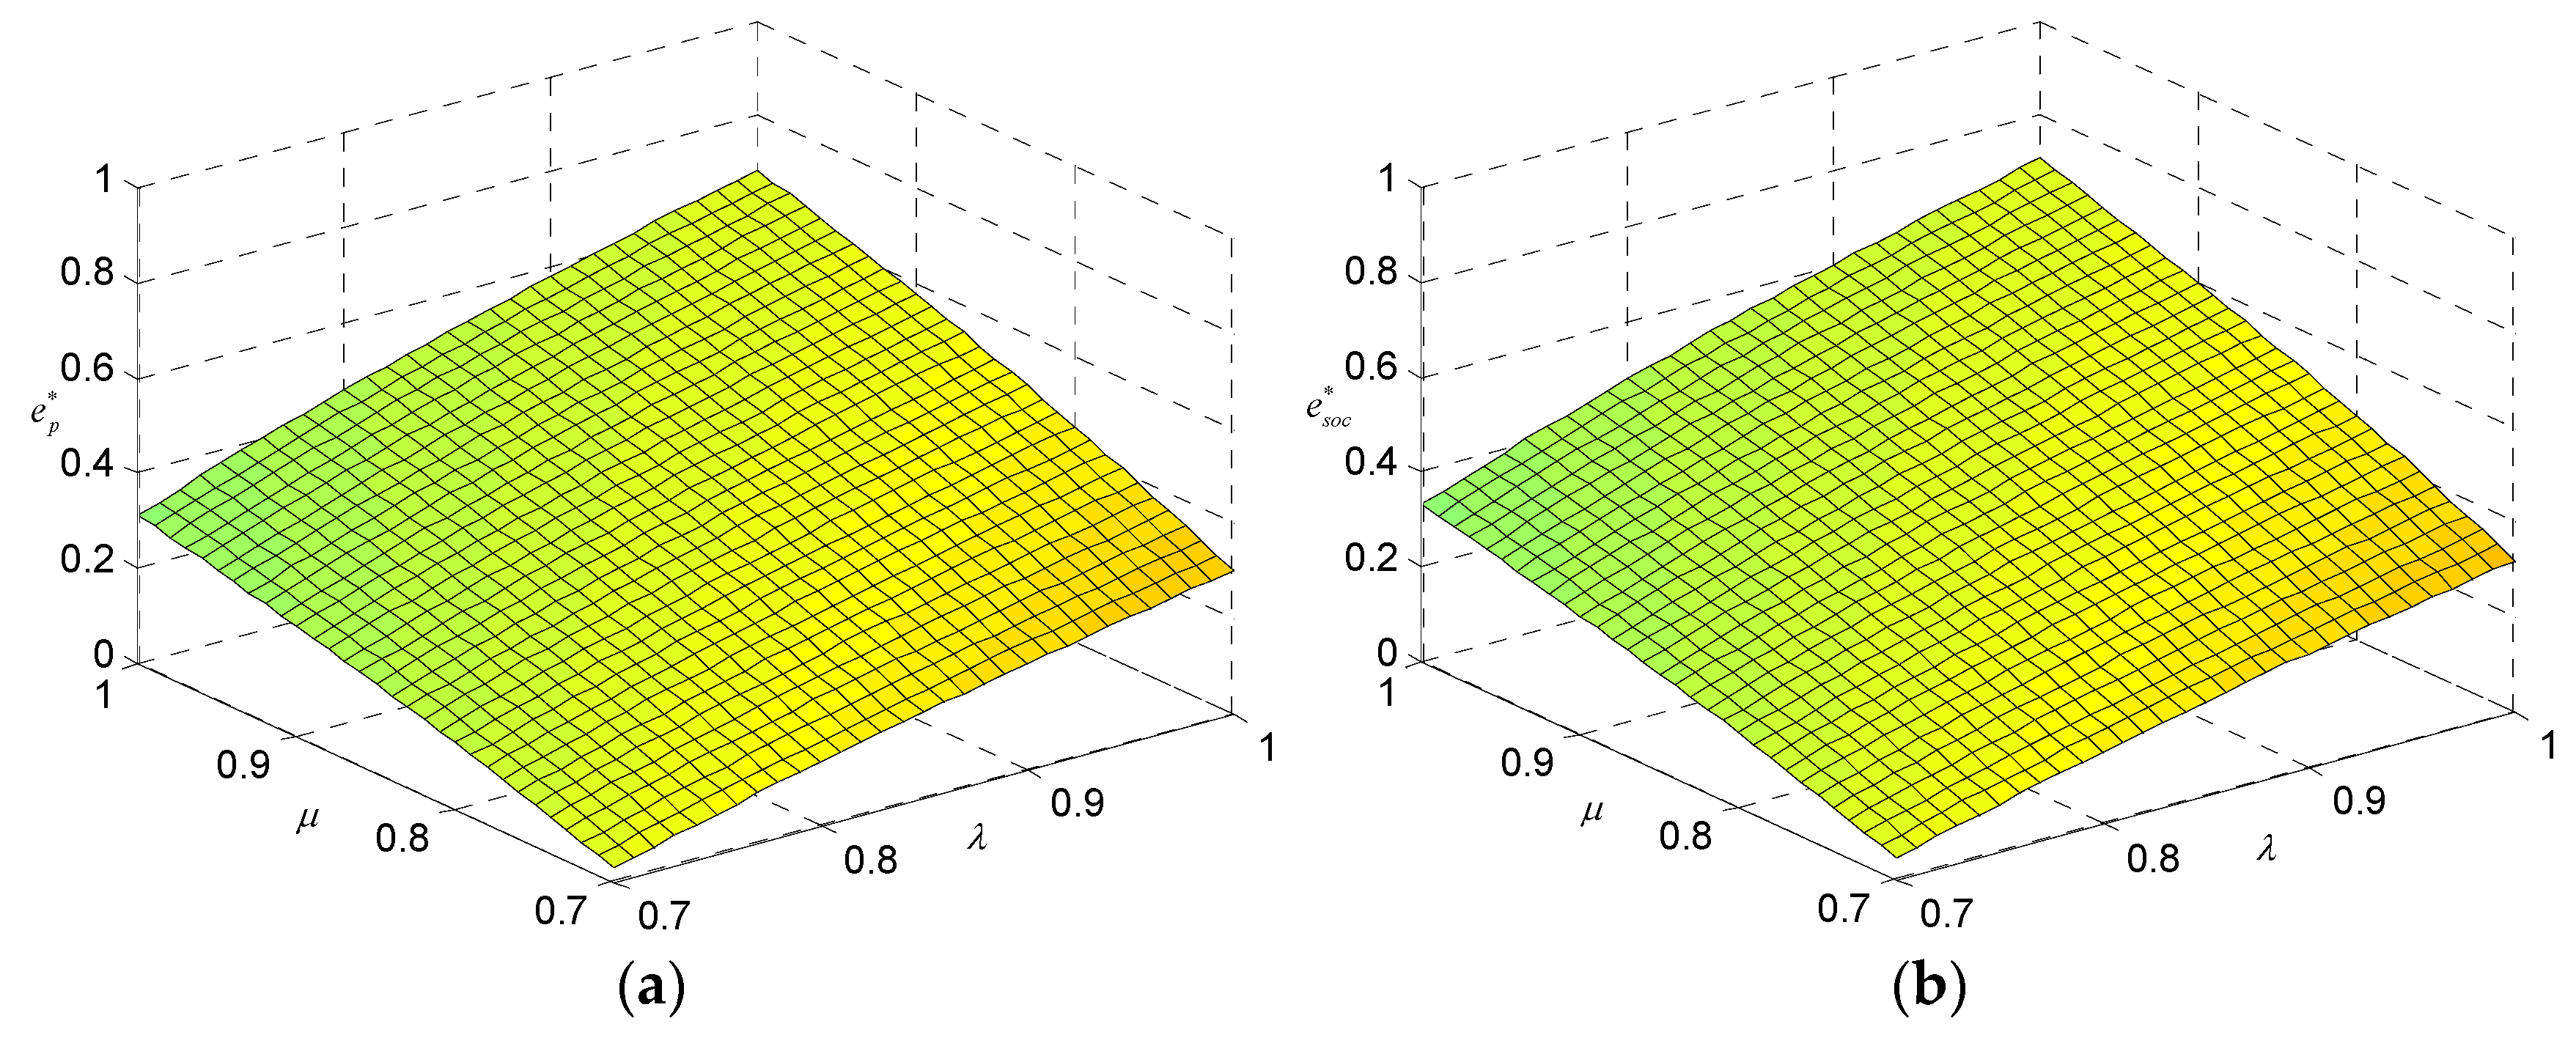
To determine the relationship between AI investment levels, platform revenue, and the proportions (high-quality providers) and (high-capability demanders), numerical simulation is employed in this section due to the complexity of the expressions. Base parameter values are set as follows:, , , , , (consistent with the numerical examples in the preceding text). The fundamental conditions , , and are maintained. Using MATLAB 7.0.1 software, the optimal AI investment level for the platform is plotted against and , as shown in Figure 4.
Figure 4.
Relationship between optimal AI investment and proportions of high-quality providers and high-capability demanders. (a) Optimal AI for the Commercial Platform; (b) Optimal AI for the Public Welfare Platform.
Figure 4 visually depicts the optimal AI investment level across a three-dimensional surface, illustrating its variation with the proportion of high-quality technology providers and the proportion of high-capability demand parties. Figure 4a corresponds to the expected revenue-maximising Commercial Platform, while Figure 4b corresponds to the social expected revenue-maximising Public Welfare Platform. AI investment for both platform types monotonically increases with rising values of and , indicating that the quality of market supply and demand constitutes the core structural driver of platform digitalisation investment. However, differences emerge in response intensity: under identical and combinations, the Public Welfare Platform consistently exhibits higher AI investment levels than the Commercial Platform (consistent with Proposition 7), with a slightly steeper surface gradient signifying heightened sensitivity to improvements in supply–demand quality.
This finding carries significant policy implications. Relying solely on market mechanisms may underestimate AI’s societal value in technology commercialisation, leading to insufficient technological investment. Particularly during the initial phase when high-quality supply and demand entities remain insufficiently aggregated, The Commercial Platform exhibits lower AI adoption willingness, risking entrapment in a negative cycle of low quality, low investment, and low efficiency. At this juncture, the government-led or supported Public Welfare Platform can serve as “disruptors”, accelerating the identification and matching of high-quality resources through proactive deployment of AI capabilities, thereby catalysing market maturation. A long-term, a dual-track mechanism should be established where the Commercial Platform and the Public Welfare Platform evolve synergistically, the former focusing on efficiency and scaled operations, the latter emphasising foundational capability building and ecosystem cultivation, jointly propelling the technology transfer system towards advanced digital-intelligence transformation.
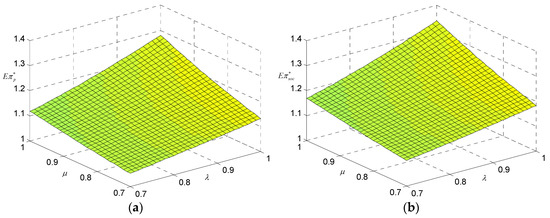
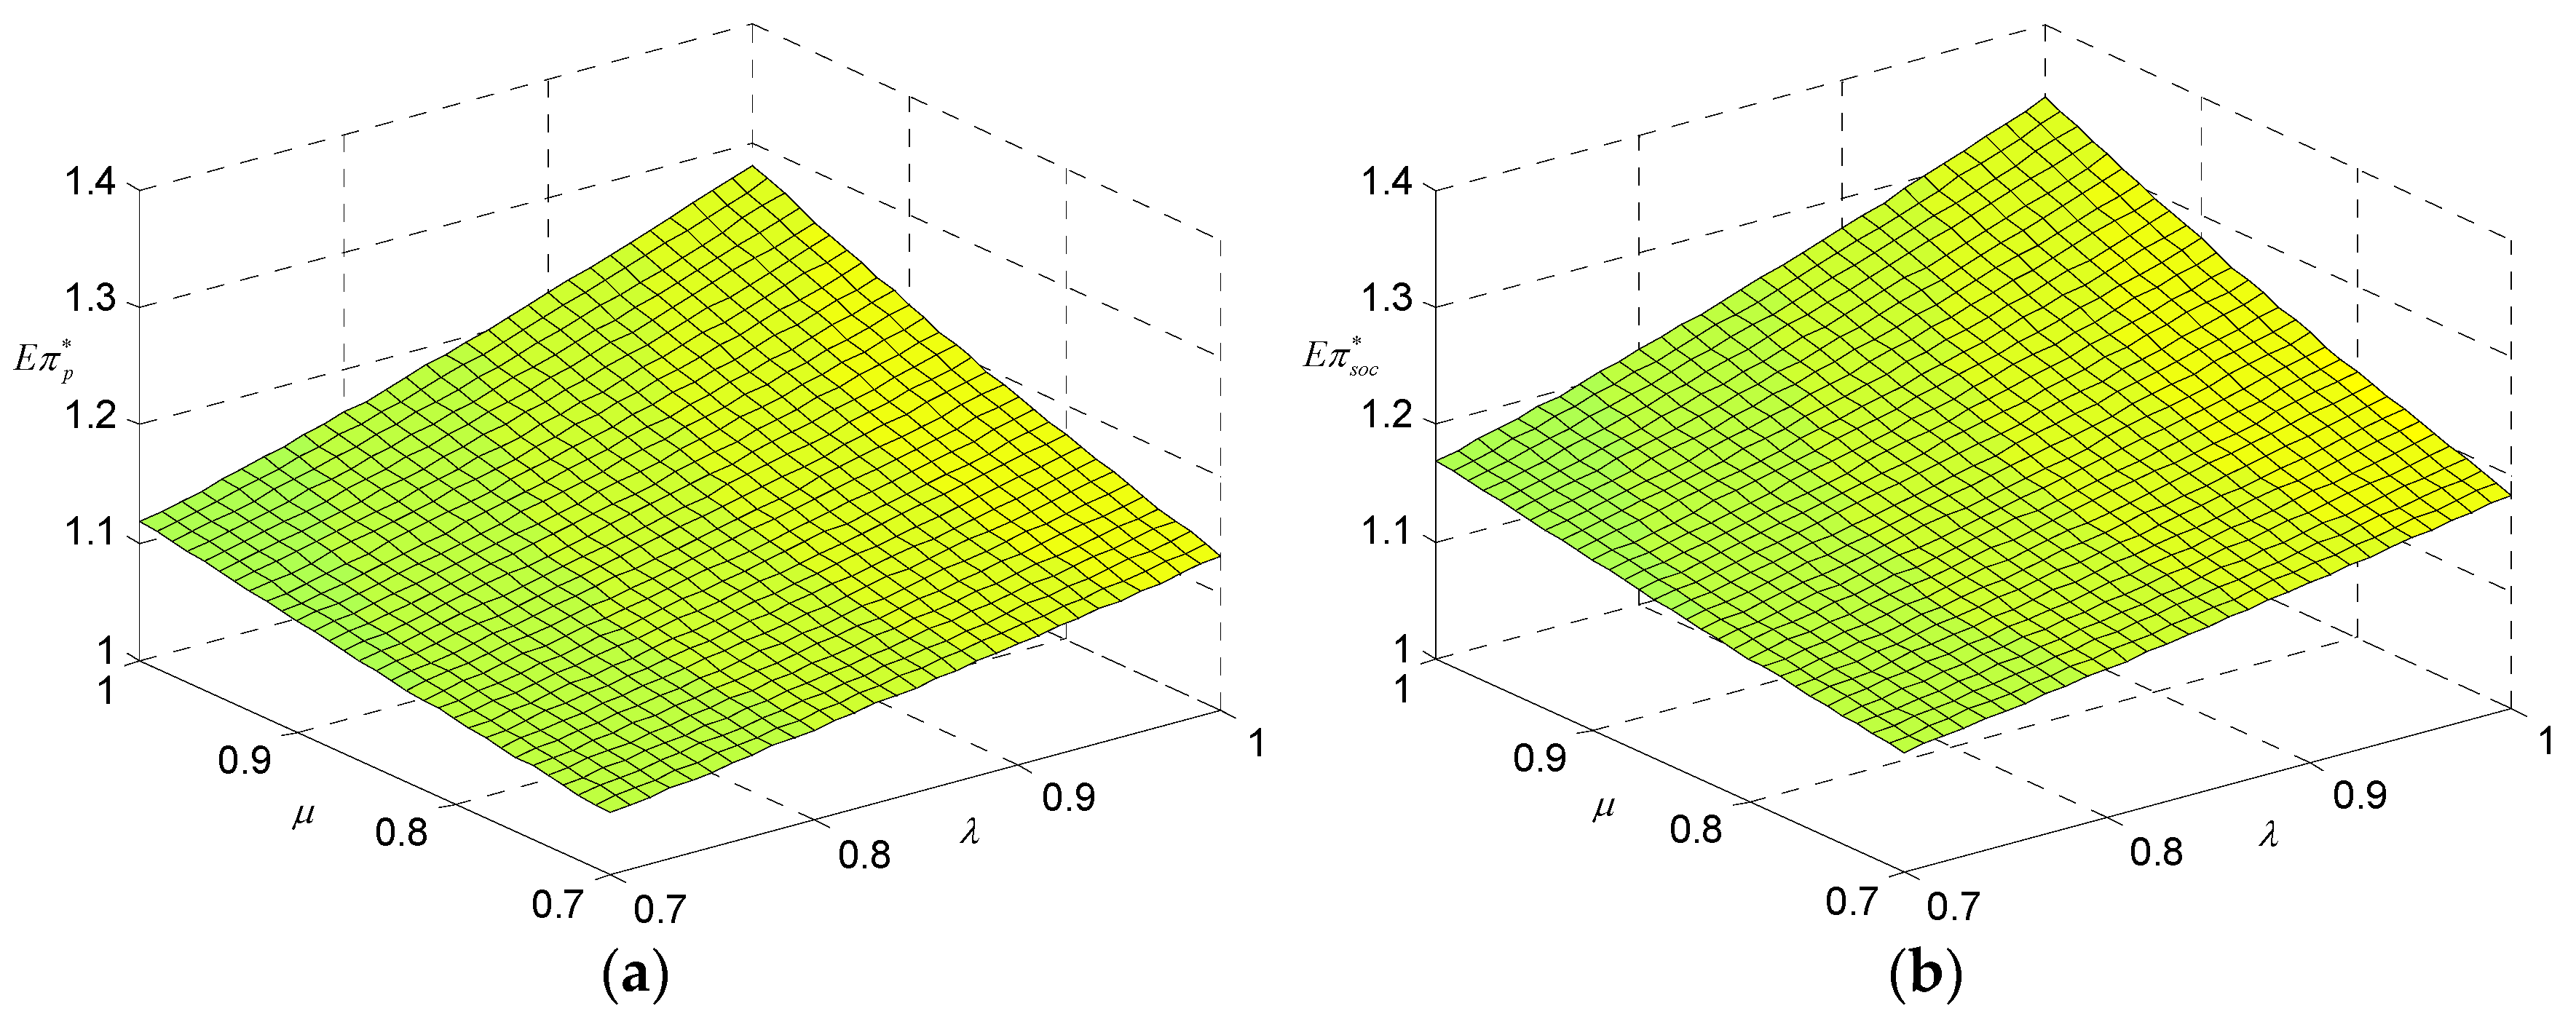
Furthermore, plotting the expected revenue of the platforms as functions of λ and μ yields Figure 5.
Figure 5.
Relationship between the platform’s expected revenue and the proportion of high-quality providers and high-capability demanders. (a) Expected revenue of the Commercial Platform; (b) Social expected revenue of the Public Welfare Platform.
As shown in Figure 5, the platform’s expected revenue exhibits a significant positive correlation with the proportion of high-quality scientific and technological achievement providers and the proportion of high-capability demand parties. Specifically, Figure 5a demonstrates that the expected revenue of the Commercial Platform increases steadily with rising values of and , reflecting its dependence on structural market advantages. Figure 5b further reveals that the Public Welfare Platform achieves higher expected revenue under equivalent market conditions, with its return function exhibiting greater sensitivity to changes in the quality of supply and demand. This outcome indicates that a platform’s value creation depends not only on its own digital and intelligent capabilities but is also deeply rooted in the structural characteristics of its market. Therefore, in promoting the online transaction and conversion of scientific and technological achievements, the government should focus on cultivating high-quality scientific research output entities and enterprises with technological absorption capacity. By optimising the market supply and demand structure, it can provide a solid foundation for platform development. Concurrently, the Public Welfare Platform should be encouraged to pioneer intelligent matching systems to enhance overall resource allocation efficiency. This will subsequently drive the coordinated upgrading of the Commercial Platform, ultimately forming a virtuous cycle system grounded in high-quality technology supply and high-capacity market demand, linked by intelligent matching mechanisms, and oriented towards value realisation.
5. Conclusions and Implications
This paper constructs a bilateral matching model for AI-empowered online technology transfer service platforms, examining optimal AI investment and commission rate decisions under constraints on the bargaining power of achievements providers. It further compares optimal AI investment levels from a social planner’s perspective. Analytical results show that, firstly, technological costs exert a significant negative influence on AI investment, wherein rising AI technical expenses elevate marginal investment costs, thereby suppressing the platform’s propensity for AI investment. Should technological costs become excessively high, the platform may entirely abandon AI investment, resulting in profits reaching their lowest point. Secondly, the external option value of achievements providers influences the platform’s pricing power. An increase in providers’ external option value compels the platform to reduce commission rates to retain their participation. This diminishes the platform’s share of profits derived from precise matching, ultimately causing both the platform’s AI investment level and expected returns to decline simultaneously. Thirdly, as platforms capture only a portion of the total matching value, their marginal returns fall below the societal marginal returns. This creates insufficient incentive for platforms to elevate their AI investment to the socially optimal level, resulting in significant efficiency losses. Fourthly, AI investment effectively enhances the probability of matching high-quality achievements providers with high-capability enterprises, with this facilitating effect being more pronounced in specialised markets rich in high-quality factors.
These conclusions offer significant implications for refining mechanisms for the commercialisation of scientific and technological achievements.
From the perspective of platforms, when undertaking technological AI investments, they must rigorously assess economic viability. This requires a comprehensive evaluation of technological costs, projected accuracy improvements, and marginal returns to scientifically establish a “technological feasibility threshold”. Should investment costs exceed this critical point, strategies should be suspended or adjusted to prevent resource wastage. With the rapid advancement of AI technology and declining investment costs, platforms should seize opportunities to deploy AI resources. Moreover, platforms should strengthen interest alignment mechanisms with technology providers by designing more flexible collaboration models (such as revenue-sharing arrangements, joint R&D initiatives, and data-sharing agreements) to enhance provider retention. Co-creating value reduces sensitivity to external alternatives and bolsters the platform’s bargaining power in bilateral negotiations.
In view of government considerations, it is recommended that science and technology authorities establish a dedicated “AI-empowered technology transfer” support programme. This should provide targeted post-grant subsidies for platforms’ R&D investments in core algorithms such as technical semantic recognition and demand profiling. This scheme can motivate platforms to scale up AI investment, especially in the early development stage of this field. Subsidy levels should be linked to performance metrics like high-quality matching rates and mismatch rates to correct underinvestment caused by positive externalities. Furthermore, it is advisable to accelerate the establishment of a national-level high-quality scientific achievements database. Integrate transferable outcomes from universities and research institutions, opening access to compliant platforms. This approach reduces individual providers’ bargaining power while supplying high-quality training data for AI models, thereby reducing the investment cost of AI. In view of the matching value generated by pairing high-quality technological achievements with high-capability enterprises, AI-powered intelligent matching systems should be piloted first in sectors where high-quality suppliers and competent enterprises are highly concentrated, such as biomedicine, advanced equipment manufacturing, and next-generation information technology. Support should be provided for local governments to collaborate with leading enterprises in building domain-specific ontology repositories, thereby amplifying AI’s catalytic role in transforming high-value scientific achievements.
This research not only expands the theoretical boundaries at the intersection of platform economics and achievement transformation but also provides actionable pathways for deepening the integration of “AI + technology services” and addressing bottlenecks in technology transfer. However, certain limitations exist. The platform supply–demand matching model simplifies assumptions by pairing high-quality with high-capability entities and low-quality with low-capability entities, whereas real-world scenarios may involve mismatches between quality and capability, warranting further exploration. Additionally, the unique role of AI in online platforms for technological achievement transformation requires further elaboration. Meanwhile, AI investment strategies of platforms amid market competition also deserve deeper exploration.
Author Contributions
Conceptualization, Q.H. and X.J.; methodology, Q.H.; software, Q.H.; validation, X.J., T.L. and G.Z.; formal analysis, X.J.; investigation, X.J.; writing—original draft preparation, Q.H.; writing—review and editing, T.L. and G.Z.; visualization, Q.H.; supervision, Q.H.; project administration, Q.H.; funding acquisition, Q.H., X.J., T.L. and G.Z. All authors have read and agreed to the published version of the manuscript.
Funding
This research was funded by the Humanities and Social Sciences Youth Foundation of Ministry of Education of China (No. 23YJC630054; No. 24YJC630286); the Philosophy and Social Science Planning Project of Zhejiang Province of China (No. 25NDJC021YBMS); the Scientific Research Foundation of Zhejiang Provincial Education Department of China (No. Y202353212); the Development Foundation of Shanghai University of Finance and Economics Zhejiang College (No. 2024FZJJ14; No. 2025FZJJ21).
Data Availability Statement
The original contributions presented in this study are included in the article. Further inquiries can be directed to the corresponding author.
Acknowledgments
The authors would like to appreciate the editors and the anonymous reviewers for their insightful suggestions to improve the quality of this paper. We also sincerely thank Xuemei Zhang for her professional support throughout the revision process. She took part in discussions on responses to the reviewers’ comments and offered valuable advice to refine the academic expression and linguistic standardisation of the manuscript.
Conflicts of Interest
The authors declare no conflicts of interest.
Appendix A
Appendix A.1. Derivation of Expected Matching Value
Substituting , , , and yields the simplified expression:
Appendix A.2. Explanation of the Assumption of
where , . (1) When , then , stays constant. (2) When , , decreases monotonically with respect to and reaches its maximum value at . These two scenarios conflict with practical economic facts.
Appendix A.3. Proof of Proposition 1
The platform’s expected revenue function is a bivariate function of and . Applying the criterion for extrema of bivariate functions, the function has no local extrema within its domain. Therefore, the maximum value occurs at the boundary of the domain. (1) When , . (2) When , . (3) When , . Based on the second derivative , the following cases are considered: (i) When , holds, so the function is monotonically decreasing on . Therefore, attains its maximum value of at . (ii) When , and , the second derivative , attains its maximum value at . The function is monotonically increasing on and monotonically decreasing on . Combining (1), (2), and (3) yields ; when , and ; when , and .
Appendix A.4. Proof of Proposition 2
(1) Compute ; (2) Compute , yielding the conclusion; (3) When , then and .
Appendix A.5. Proof of Proposition 3
(1) Compute ; the conclusion holds. (2) When , ; . (3) When , .
Appendix A.6. Proof of Proposition 4
The expected utility function is a unary function of . Applying the theorem on the extremes of unary functions, we set the first derivative to zero and solve for . Based on the second derivative , we consider the following cases: (1) When , . Hence, the function is monotonically decreasing on . Consequently, attains its maximum value at . (2) When , and , the second derivative , and attains its maximum value of at . The function is strictly increasing on and strictly decreasing on .
Appendix A.7. Proof of Proposition 5
(1) Computing confirms the conclusion. (2) When , .
Appendix A.8. Proof of Proposition 6
(1) Compute ; the conclusion holds. (2) When , .
Appendix A.9. Proof of Proposition 7
(1) When , we have ; (2) When , we have .
Appendix A.10. Proof of Proposition 8
- (1)
- Construct the expression for . A genuine HH pairing is successfully matched if and only if: the provider’s true type is H (with proportion ) and is correctly identified as H (with probability ); the demander’s true type is H (with proportion ) and is correctly identified as H (with probability ). Since the identification process is independent and the type of sampling is independent, we have: . We now prove monotonicity. Taking the derivative with respect to : , Since and , we have
- (2)
- Interaction effect analysis. Calculate the interaction partial derivatives: , . Therefore, as or increases, the marginal contribution of AI investment to HH matching strengthens.
References
- Guan, X.; Fan, Y.; Qin, Q.; Deng, K.; Yang, G. Construction of science and technology achievement transfer and transformation platform based on deep learning and data mining technology. J. Intell. Fuzzy Syst. 2020, 39, 1843–1854. [Google Scholar] [CrossRef] [Scilit]
- He, X.; Meng, X.; Wu, Y.; Chan, C.S.; Pang, T. Semantic matching efficiency of supply and demand texts on online technology trading platforms: Taking the electronic information of three platforms as an example. Inf. Process. Manag. 2020, 57, 102258. [Google Scholar] [CrossRef] [Scilit]
- Dushnitsky, G.; Klueter, T. Which industries are served by online marketplaces for technology? Res. Policy 2017, 46, 651–666. [Google Scholar] [CrossRef] [Scilit]
- Lari, H.A.; Vaishnava, K.; Manu, K.S. Artificial intelligence in E-commerce: Applications, implications and challenges. Asian J. Manag. 2022, 13, 235–244. [Google Scholar] [CrossRef] [Scilit]
- Jackson, I.; Ivanov, D.; Dolgui, A.; Namdar, J. Generative artificial intelligence in supply chain and operations management: A capability-based framework for analysis and implementation. Int. J. Prod. Res. 2024, 62, 6120–6145. [Google Scholar] [CrossRef] [Scilit]
- Mohiuddin Babu, M.; Akter, S.; Rahman, M.; Billah, M.M.; Hack-Polay, D. The role of artificial intelligence in shaping the future of agile fashion industry. Prod. Plan. Control 2024, 35, 2084–2098. [Google Scholar]
- Kapoor, A.; Kumar, M. Frontiers: Generative AI and personalized video advertisements. Mark. Sci. 2025, 44, 733–747. [Google Scholar] [CrossRef] [Scilit]
- Zhao, X.; Liu, Y.; Lang, X. Study on the Technological Innovation Supply–Demand Matching Mechanism for Major Railway Projects Based on a Tripartite Evolutionary Game. Systems 2025, 13, 434. [Google Scholar] [CrossRef] [Scilit]
- Xu, M. Performance evaluation of financial support for transformation of military scientific and technological achievements based on machine learning and PCA. Wirel. Commun. Mob. Comput. 2022, 2022, 1043855. [Google Scholar] [CrossRef] [Scilit]
- Cheng, H.; Huang, S.; Yu, Y.; Zhang, Z.; Jiang, M. The 2011 collaborative innovation plan, university-industry collaboration and achievement transformation of universities: Evidence from China. J. Knowl. Econ. 2023, 14, 1249–1274. [Google Scholar]
- Song, Y.W.; Zhang, J.R.; Song, Y.K.; Fan, X.R.; Zhu, Y.Q.; Zhang, C. Can industry-university-research collaborative innovation efficiency reduce carbon emissions? Technol. Forecast. Soc. Change 2020, 157, 120094. [Google Scholar]
- Fang, Q.; Sheng, Y. Study on the relationship between modernized economic system construction and transfer and transformation of scientific and technological achievements. In Proceedings of the Thirteenth International Conference on Management Science and Engineering Management, St. Catharines, ON, Canada, 5–8 August 2019. [Google Scholar]
- Zhang, L.H.; Lu, W.; Zhang, C.Q. Study on online demand-supply matching of electric power technology based on technical field feature. J. Comput. Methods Sci. Eng. 2022, 22, 2343–2357. [Google Scholar] [CrossRef] [Scilit]
- Deng, N.; Zhang, J. HMFM: A Method for Identifying High-Value Patents by Fusing Multiple Features. Comput. Mater. Contin. 2025, 82, 2235–2254. [Google Scholar] [CrossRef] [Scilit]
- Li, L.; Chen, W.; Song, B.; Cui, C. How to effectively promote the transformation of ecological and environmental scientific and technological achievements? A case study from China. Clean. Technol. Environ. Policy 2025, 27, 1349–1371. [Google Scholar]
- Song, J.B.; Cai, J.H.; Li, R.; Li, Y.N. Design and implementation of scientific research achievement transformation system. In Proceedings of the 2023 IEEE/ACIS 21st International Conference on Software Engineering Research, Management and Applications (SERA), Orlando, FL, USA, 23–25 May 2023. [Google Scholar]
- Spinazzola, M.; Scuotto, V.; Pironti, M. Professional social matching for innovation and technology transfer in multiscalar innovation ecosystems: A conceptual framework and first exploratory results. J. Technol. Transf. 2025, 51, 1289–1314. [Google Scholar] [CrossRef] [Scilit]
- Qiang, H.; Lou, T.; Zhang, G.; Zuo, W.; Li, J.; Zhang, X. Charging model of scientific and technological achievements transformation platform considering platform system attractiveness. Front. Eng. Manag. 2025, 12, 1058–1078. [Google Scholar] [CrossRef] [Scilit]
- Li, W.; Zhang, P. Developing the transformation of scientific and technological achievements in colleges and universities to boost the development of low-carbon economy. Int. J. Low Carbon Technol. 2021, 16, 305–316. [Google Scholar]
- Li, Z.B.; Xu, Y.D. Construction and evaluation of transformation mode of the achievements in science and technology in colleges under the background of artificial intelligence. Math. Probl. Eng. 2022, 2022, 9982871. [Google Scholar] [CrossRef] [Scilit]
- Wu, L.R.; Chen, W. Technological achievements in regional economic development: An econometrics analysis based on DEA. Heliyon 2023, 9, e17023. [Google Scholar] [CrossRef] [Scilit] [PubMed]
- He, X.; Liu, Y. Knowledge evolutionary process of artificial intelligence in e-commerce: Main path analysis and science mapping analysis. Expert Syst. Appl. 2024, 238, 121801. [Google Scholar]
- Cheng, X.; Mou, J.; Wang, Y.; Zarifis, A. Development of AGI in e-commerce. J. Electron. Commer. Res. 2025, 26, 163–169. [Google Scholar]
- Yang, G.; Ji, G.; Tan, K.H. Impact of artificial intelligence adoption on online returns policies. Ann. Oper. Res. 2022, 308, 703–726. [Google Scholar]
- He, P.; Wang, T.Y.; Mardani, A.; Wang, X.J.; Chen, Z.S. Selling mode selection and AI service strategy in an e-commerce platform supply chain. Comput. Ind. Eng. 2024, 197, 110560. [Google Scholar] [CrossRef] [Scilit]
- Mei, L.; Tang, N.; Zeng, Z.; Shi, W. Artificial intelligence technology in live streaming e-commerce: Analysis of driving factors of consumer purchase decisions. Int. J. Comput. Commun. Control 2025, 20, 6871. [Google Scholar] [CrossRef] [Scilit]
- Luo, Y.R.; Kumar, N.; Yazdanmehr, A. AI nudging and decision quality: Evidence from randomized experiments in online recommendation setting. Decis. Support Syst. 2026, 200, 114565. [Google Scholar]
- Xu, X.; Hong, Z.; Chen, Y.; Cheng, T.C.E. When is it wise to use artificial intelligence for platform operations considering consumer returns? Eur. J. Oper. Res. 2023, 308, 1188–1205. [Google Scholar]
- Yang, L.; He, J.; Shi, W. Application of artificial intelligence: Equilibrium analysis of e-commerce platform supply chain sales formats. Electron. Commer. Res. 2025. [Google Scholar] [CrossRef] [Scilit]
- Ngai, E.W.; Lee, M.C.; Luo, M.; Chan, P.S.; Liang, T. An intelligent knowledge-based chatbot for customer service. Electron. Commer. Res. Appl. 2021, 50, 101098. [Google Scholar] [CrossRef] [Scilit]
- Shankar, A.; Perumal, P.; Subramanian, M.; Ramu, N.; Natesan, D.; Kulkarni, V.R.; Stephan, T. An intelligent recommendation system in e-commerce using ensemble learning. Multimed. Tools Appl. 2024, 83, 48521–48537. [Google Scholar]
- Deng, Y.; Li, Y.; Zhang, W.; Ding, B.; Lam, W. Toward personalized answer generation in e-commerce via multi-perspective preference modeling. ACM Trans. Inf. Syst. 2022, 40, 1–28. [Google Scholar]
- Choi, W.J.; Liu, Q.; Shin, J. Predictive analytics and ship-then-shop subscription. Manag. Sci. 2024, 70, 1012–1028. [Google Scholar]
- Wang, L.; Huang, N.; He, Y.; Liu, D.; Guo, X.; Sun, Y.; Chen, G. Artificial intelligence (AI) assistant in online shopping: A randomized field experiment on a livestream selling platform. Inf. Syst. Res. 2025, 36, 2358–2374. [Google Scholar] [CrossRef] [Scilit]
- Zhang, L.; Zaki, H.O.; Hashim, S.; Omar, N.A. The role of personalization and emotional attachment on privacy calculus: An empirical study of intelligent voice assistant. Asia Pac. J. Mark. Logist. 2025, 37, 3113–3129. [Google Scholar] [CrossRef] [Scilit]
- Chang, T.S.; Hsiao, W.H. Understand resist use online customer service chatbot: An integrated innovation resist theory and negative emotion perspective. Aslib J. Inf. Manag. 2025, 77, 962–989. [Google Scholar]
- Song, F.; Xia, T.; Tang, Y. Integration of artificial intelligence technology and visual communication design in metaverse e-commerce and its potential opportunities. Electron. Commer. Res. 2024. [Google Scholar] [CrossRef] [Scilit]
- Zhou, C.; Xu, Y.; Ren, Y.; Yu, J. Strategic adoption of the recommender system under online retailer competition and consumer search. Electron. Commer. Res. Appl. 2024, 64, 101376. [Google Scholar] [CrossRef] [Scilit]
- Boone, T.; Fahimnia, B.; Ganeshan, R.; Herold, D.M.; Sanders, N.R. Generative AI: Opportunities, challenges, and research directions for supply chain resilience. Transp. Res. Part E Logist. Transp. Rev. 2025, 199, 104135. [Google Scholar] [CrossRef] [Scilit]
- Zhang, Y.; Huang, C.Y.; Zhang, L.Y.; Tian, X.Y.; Shuai, Q.H.; Jin, Y.H. The confidence boost: How generative artificial intelligence nudges consumer decisions through preference matching. J. Consum. Behav. 2026. [Google Scholar] [CrossRef] [Scilit]
- Lu, X.Y.; Guo, W.; Wang, Y.Z.; Zhang, H. Who should lead and what to say? Exploring AI-dominant vs. human-dominant content creation for informational and emotional marketing. Int. J. Hum.-Comput. Interact. 2026, 42, 1334–1350. [Google Scholar]
- Suominen, A.; Seppänen, M.; Dedehayir, O. A bibliometric review on innovation systems and ecosystems: A research agenda. Eur. J. Innov. Manag. 2019, 22, 335–360. [Google Scholar] [CrossRef] [Scilit]
- Bergemann, D.; Pesendorfer, M. Information structures in optimal auctions. J. Econ. Theory 2007, 137, 580–609. [Google Scholar] [CrossRef] [Scilit]
- Ichihashi, S. Online privacy and information disclosure by consumers. Am. Econ. Rev. 2020, 110, 569–595. [Google Scholar] [CrossRef] [Scilit]
- Raj, A.; Modak, N.M.; Kelle, P.; Singh, B. Analysis of a dyadic sustainable supply chain under asymmetric information. Eur. J. Oper. Res. 2021, 289, 582–594. [Google Scholar] [CrossRef] [Scilit]
- Kumar, D.; Agrawal, S.; Singh, R.K.; Singh, R.K. Coordination of circular supply chain for online recommerce platform in industry 4.0 environment: A game-theoretic approach. Oper. Manag. Res. 2023, 16, 2081–2103. [Google Scholar] [CrossRef] [Scilit]

Disclaimer/Publisher’s Note: The statements, opinions and data contained in all publications are solely those of the individual author(s) and contributor(s) and not of MDPI and/or the editor(s). MDPI and/or the editor(s) disclaim responsibility for any injury to people or property resulting from any ideas, methods, instructions or products referred to in the content. |
© 2026 by the authors. Licensee MDPI, Basel, Switzerland. This article is an open access article distributed under the terms and conditions of the Creative Commons Attribution (CC BY) license.