Article

In-Plane Strain in Thin Film Peeling: A Numerical Study and a Unified Criterion for Stage Transition

1
School of Microelectronics, Shanghai University, Shanghai 201800, China
2
Sino-Swiss Institute of Advanced Technology, Shanghai University, Shanghai 201800, China
3
Information Science Academy of China Electronics Technology Group Cooperation, Beijing 100042, China
4
National Key Laboratory of Integrated Circuits and Microsystems, Beijing 100042, China
*
Authors to whom correspondence should be addressed.
Mathematics 2026, 14(11), 1869; https://doi.org/10.3390/math14111869
Submission received: 21 April 2026 / Revised: 19 May 2026 / Accepted: 26 May 2026 / Published: 27 May 2026

Abstract

Releasing a thin film adhered to a rigid substrate by peeling is a fundamental issue in interfacial mechanics and is of practical significance in many fields including flexible electronics, heterogeneous integration, and advanced packaging. While classical peeling theories have established the relationship between peeling force and interfacial adhesion, the in-plane strain evolution that governs film deformation and possible damage remains underexplored. This paper presents a numerical investigation of the in-plane strain in thin film peeling using an energy-variational framework. The results show that the strain response cannot be inferred solely from the peeling force response. Moreover, the dependence of the global maximum strain on film thickness h , Young’s modulus E , interfacial adhesion energy γ , peeling angle θ F , and the characteristic length l of the cohesive zone is systematically examined. To distinguish between two-stage and three-stage strain responses, a unified classification criterion is established based on these parameters. A closed-form polynomial decision boundary is obtained, which enables direct identification of the applicable regime and facilitates appropriate strain estimation in peeling processes.

1. Introduction

The peeling of a thin film from a rigid substrate is a classic problem in interfacial mechanics that finds relevance across a wide range of scientific and engineering disciplines. With the rapid development of flexible electronics [1], heterogeneous integration [2], and advanced packaging [3], the demand for controllable, damage-free film release has grown dramatically, making peeling mechanics increasingly important in modern manufacturing. In microelectronics manufacturing, peeling processes are encountered in the transfer of thin film devices from growth substrates to target platforms. This process enables heterogeneous integration and advanced packaging architectures [4,5]. In flexible electronics, the controlled release of functional films from rigid carriers is a critical step in the fabrication of bendable and wearable devices [6,7]. In materials science, peel tests are routinely employed to quantify the adhesion energy at film–substrate interfaces, providing essential data for quality control and process optimization [8,9]. Beyond these applications, peeling phenomena are also commonly observed in biomedical devices [10], energy storage systems [11], micro-electro-mechanical systems (MEMS) [12], optical film assembly [13], and load-bearing adhesive joints in mechanical structures [14], where interface failure can compromise structural integrity. This broad range of applications underscores the fundamental importance of understanding the mechanics of film detachment across multiple engineering domains.
The wide applications of thin film–substrate systems have motivated various research efforts toward a better understanding of the film adhesion. The theoretical foundation for understanding film peeling was established by Rivlin and Kendall [15,16]. Rivlin’s seminal work introduced the energy balance framework that forms the basis of modern peeling theory. Kendall extended this analysis to incorporate film deformation, deriving the classic relationship between steady-state peeling force, peeling angle, and interfacial adhesion energy. This elegant expression, validated by numerous experiments, forms the cornerstone of the standard peel test for interfacial adhesion measurement. Over the past decades, it has been widely adopted as the fundamental theoretical basis for interpreting peel test data and optimizing interface design.
Subsequent studies have extended the Kendall model to capture more complex material behaviors and geometric configurations. Kim incorporated elastic–plastic film behavior, enabling analysis of metal films that undergo plastic deformation during peeling [17]. Williams provided a comprehensive treatment of various peel test configurations, including considerations of bending stiffness and large deformations [18]. The role of viscoelasticity was examined by Peng et al. and Yin et al. [19,20]. Their works reveal rate-dependent peeling behavior in polymeric films. Substrate compliance has been addressed by Shen et al. and Menga et al. [21,22], who extend the analysis to cases where the substrate cannot be considered rigid. Interfacial heterogeneity [23,24] and surface roughness [25,26,27] have also been incorporated into peeling models. More recently, peeling analyses have been extended to two-dimensional kirigami materials at the nanoscale [28]. These theoretical developments have significantly advanced our understanding of peeling mechanics under various conditions. However, they have predominantly focused on the force response rather than the strain evolution within the film, which is a fundamental mechanical quantity that directly governs film deformation and integrity during peeling.
Recently, several studies have noted the importance that understanding and controlling the strain is paramount in applications where film integrity is critical, such as the transfer of functional devices or the handling of fragile materials. For example, Chen et al. [29] developed a chip peeling model and introduced a health index to reveal the relationship between the maximum tensile stress and the energy release rate in peeling. Shin et al. [30] demonstrated a damage-free dry transfer printing strategy based on stress control of deposited metal bilayer films, enabling the fabrication of flexible and stretchable electronic devices. Li et al. [31] proposed an electro-capillary peeling method that achieves ultra-low-strain detachment of thin films from rigid substrates by driving an electrolyte solution into the film–substrate interface. However, these studies do not systematically characterize the evolution of the in-plane strain field during peeling, and its dependence of the key technical parameters, including peeling angle, film thickness, Young’s modulus, and interfacial adhesion. Therefore, a systematic characterization of how strain depends on these key parameters is still needed.
The present study aims to fill this gap by focusing specifically on the in-plane strain as the primary quantity of interest. A peeling model is developed based on the energy-variational framework, and the strain is expressed as a function of peeling angle θ F , film thickness h, Young’s modulus E, and interfacial adhesion energy γ . Building upon this model, the analysis systematically characterizes the variation in peak strain with each parameter and quantifies the parametric dependencies through sensitivity analysis. The evolution of strain during peeling is compared with the load response to reveal their inherent differences, and the coupled effects of tensile stiffness, bending stiffness, and peeling angle are clarified. Together, these efforts establish a comprehensive framework for predicting and understanding strain levels in peeling processes, with emphasis on the strain magnitude, parametric dependencies, and governing physical mechanisms. The theoretical model assumes linear elasticity, small membrane-type strain, and a rigid substrate, which are appropriate for the ultra-thin films and rigid substrates typical of flexible electronics.

2. Theory and Model

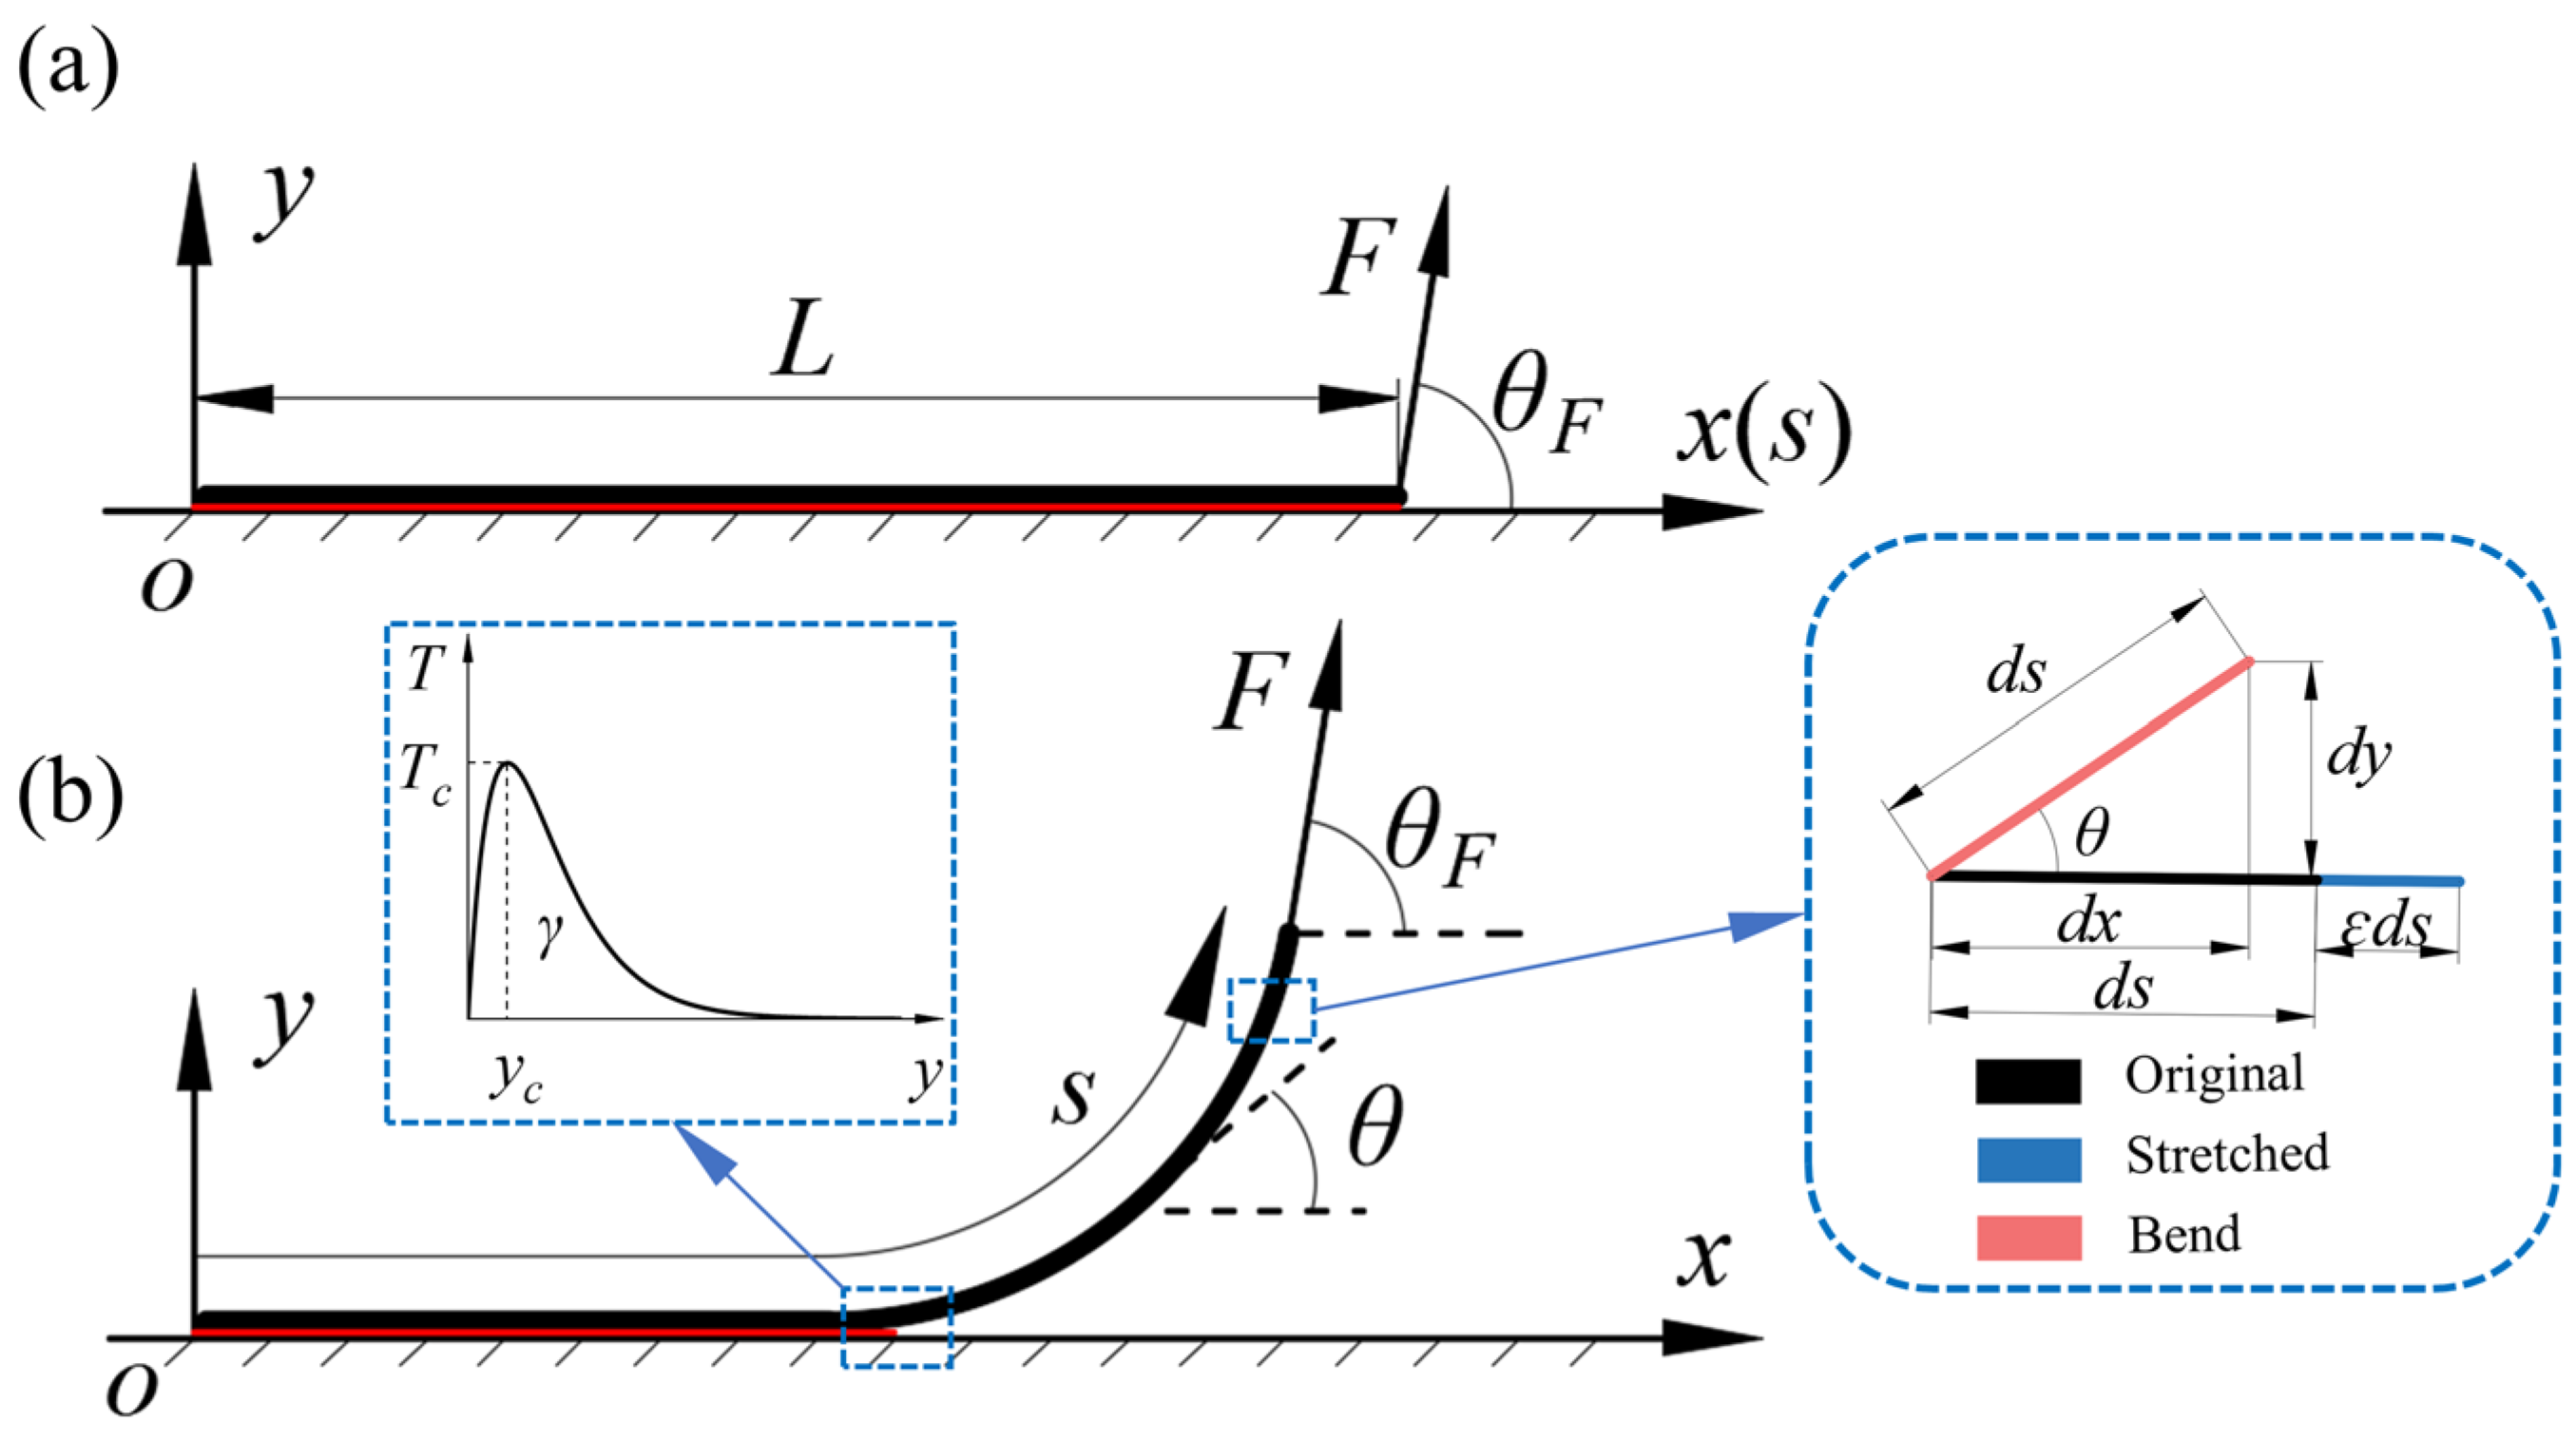
As shown in Figure 1a, a thin elastic film of thickness h and length L is perfectly adhered to a rigid, flat substrate. The red region between the thin film and the substrate denotes the adhesion zone, and their interaction potential is described by the Needleman potential [32], i.e.,
φ y = γ 1 1 + e T c y γ exp e T c y γ ,
where γ is the adhesion energy, T c is the interfacial strength, and y is the separation between the film and substrate.
The corresponding traction–separation law, derived by differentiating this potential with respect to y, is expressed as
T y = φ y = e 2 T c 2 y γ exp e T c y γ ,
as shown in Figure 1b. The adhesion energy γ is defined as the area under the traction–separation curve, and the adhesion strength T c corresponds to peak traction. In peeling models, the spatial extent of the cohesive interaction plays an important role [33]. We therefore define the characteristic length l of the cohesive zone as the separation distance over which the interfacial traction decays to a negligible value. Specifically, l is taken as the distance encompassing 99% of the total adhesion energy γ . From the traction–separation law in Equation (2), this yields l     6.64 γ / ( e T c ) .
The film is homogeneous, isotropic and linearly elastic with E denoting the Young’s modulus. A peeling force F is applied to the free end of the film at an angle θ F measured from the substrate surface. As the peeling force F increases, the elastic film will gradually detach from the rigid substrate, as shown in Figure 1b. We introduce two coordinate systems, i.e., a Cartesian frame (x, y) and a curvilinear frame (s, θ), both with origin o at the left end of the film, where x and y denote the length and thickness directions, respectively, and s and θ represent the arc length and deflection angle of the film. The differential relationships between the two coordinate systems are given by d x / d s     =     c o s θ and d y / d s   =   s i n θ .
The potential energy of the film/substrate system can be expressed as
U = 0 L 1 2 D θ 2 d s + 0 L 1 2 E ε 2 h d s F u F 0 L F ε cos θ θ F d s + 0 L φ ( y ) d s .
The first term represents the bending elastic energy stored in the film, where D = ( E h 3 ) / 12 is the bending stiffness of the film and θ′ is the local curvature.
The second term is the tensile strain energy. For a linearly elastic film, we define the in-plane strain ε as the membrane-type strain arising from the projected component of the peeling force. It is taken as uniform through the film thickness and is governed by the tensile stiffness Eh. The bending-induced surface strain (which scales with θ′h/2) is not included in this definition. This simplification is justified for the ultra-thin films targeted in this study (typical thicknesses on the order of 10 μm), where the bending-induced strain is negligible compared to the membrane strain. Following the approach of Peng and Chen [34], the in-plane strain can be expressed as
ε s = F cos θ θ F E h ,
where θ F is the applied peeling angle.
The third term represents the work done by the external force due to the displacement of the loading point, without considering film extension. Here, u F denotes the projection of the displacement of the loading point onto the direction of the applied force F, and can be expressed as
u F = x L cos θ F + y L sin θ F = 0 L cos θ 1 cos θ F d s + 0 L sin θ sin θ F d s = 0 L cos θ θ F d s 0 L cos θ F d s
The fourth term is the work done by the external force due to tension of the film. In this expression, 0 L ε d s is the total elongation of the film, and the factor cos ( θ θ F ) projects this elongation onto the direction of the applied force F.
The fifth term is the interaction potential between the film and the substrate, where φ ( y ) is the Needleman potential given in Equation (1).
The profile of the film is described by the geometric relations x   =     c o s θ and y     =   s i n θ , where x′ and y′ denote derivatives with respect to s. To account for the coupling between x (or y) and θ, two Lagrange multipliers λ 1 and λ 2 are introduced. The potential energy can then be rewritten with these constraints.
U = 0 L 1 2 D θ 2 ( s ) d s 0 L F 2 cos 2 ( θ θ F ) 2 E h d s 0 L F cos ( θ θ F ) d s + 0 L F cos θ F d s + 0 L λ 1 ( s ) ( y sin θ ) d s + 0 L λ 2 ( s ) ( x cos θ ) d s + 0 L φ ( y ) d s .
Applying the principle of minimum potential energy, the first variation in the total energy with respect to θ is set to zero.
δ U = 0 L F 2 cos ( θ θ F ) sin ( θ θ F ) E h + F sin ( θ θ F ) λ 1 cos θ + λ 2 sin θ D ( s ) θ ( s ) δ θ d s + 0 L ( y sin θ ) δ λ 1 d s + 0 L ( x cos θ ) δ λ 2 d s + 0 L ( λ 2 ) δ x d s + 0 L ( φ ( y ) λ 1 ) δ y d s + ( D θ δ θ 2 + λ 2 δ x 2 + λ 1 δ y 2 ) | s = L ( D θ ( s ) δ θ 1 + λ 2 δ x 1 + λ 1 δ y 1 ) | s = 0 = 0 .
This yields the equilibrium equations and boundary conditions.
D θ ( s ) + λ 1 cos θ F 2 cos ( θ θ F ) sin ( θ θ F ) E h F sin ( θ θ F ) = 0 y = sin θ , x = cos θ , λ 1 = T ( y ) , λ 2 = 0 , λ 1 ( 0 ) = 0 , λ 1 ( L ) = 0 ,   θ ( 0 ) = 0 , θ ( L ) = 0 .
By substituting F ¯ and θ ( s ) into Equation (4), the in-plane strain field is obtained as a nonlinear function of the dimensionless arc length s, which is also strongly dependent on the peeling progress.
As the maximum local tensile strain dictates the onset of peeling-induced damage, we define two characteristic strains, i.e., the peak strain along the film at a certain peeling height ( ε p ( H ¯ ) ) and the global maximum of ε p throughout the entire peeling process ( ε m ). They are given respectively by
ε p H ¯ = max s 0 , L ε s ; H ¯ ,
ε m = max H ¯ 0 , H ¯ L ε p H ¯ ,
where ε ( s ;   H ¯ ) denotes the strain field at a given peeling height H ¯ , and H ¯ L is the peeling height when the film is fully released from the substrate.
The problem described by Equation (8) constitutes a typical boundary value problem of nonlinear ordinary differential equations. Analytical solutions are not readily attainable, and the shooting method is generally employed to solve these equations. The key steps of the shooting procedure are provided in Appendix A, and the results of which are given in Section 3.

3. Results and Discussion

In this section, we first validate the theoretical model against the finite element method (FEM) results and then quantitatively analyze the strain evolution during peeling. For the purpose of validating the theoretical model and conducting the parametric analysis, a set of material and geometric parameters is adopted. The film length is taken as L   =   100   m m , the film thickness as h 0     =   0.01   m m , Young’s modulus as E 0   =   3000   M P a , and interfacial adhesion energy as γ 0   =   1   m J / m m 2 . The baseline parameters are adopted from Peng [35]. E 0   =   3000   M P a and h 0 = 0.01   m m represent polyimide (PI), a common flexible substrate. γ 0   =   1   m J / m m 2 is typical for the PI–silicon interface [36]. L   =   100   m m is sufficient to ensure steady-state peeling.

3.1. Validation with Finite Element Method (FEM)

A peeling model is established in the commercial FEM software ABAQUS 2022. As shown in Figure 2, a thin film is mounted on a substrate fixed at the bottom. The interfacial interaction is described by a cohesive zone model (CZM) with a bilinear traction–separation law in which the cohesive element follows an explicit traction–separation law. Although various forms of CZM exist [18], previous studies indicate that the key parameters governing interfacial debonding are the interfacial strength Tc and the adhesion energy γ , while the specific shape of the curve has a negligible effect [37]. Accordingly, a bilinear traction–separation law is adopted for simplicity. The interfacial strength and adhesion energy are set to T c   =   0.2   M p a and γ   =   γ 0   =   1   m J / m m 2 , respectively, consistent with the theoretical model. The FEM model follows the standard approach for ABAQUS-based peeling simulations [38,39]. The film is meshed with CPE4R elements, a 4-node bilinear plane strain element with reduced integration. The plane strain formulation is appropriate because the film is wide relative to its thickness, constraining deformation along the width direction. Reduced integration with hourglass control alleviates shear locking, which is critical for the bending-dominated deformation during peeling. The interface is meshed with COH2D4 elements, a 4-node cohesive element designed in ABAQUS for the cohesive zone model framework. This element directly computes the normal and shear relative displacements across the interface, enabling accurate evaluation of the traction–separation relationship that governs adhesive failure. The substrate bottom is fully fixed, and a displacement-controlled load is applied at the film right edge. The model is solved using the static/general solver with geometric nonlinearity enabled. Geometric parameters follow Figure 1 and are consistent with Section 2.
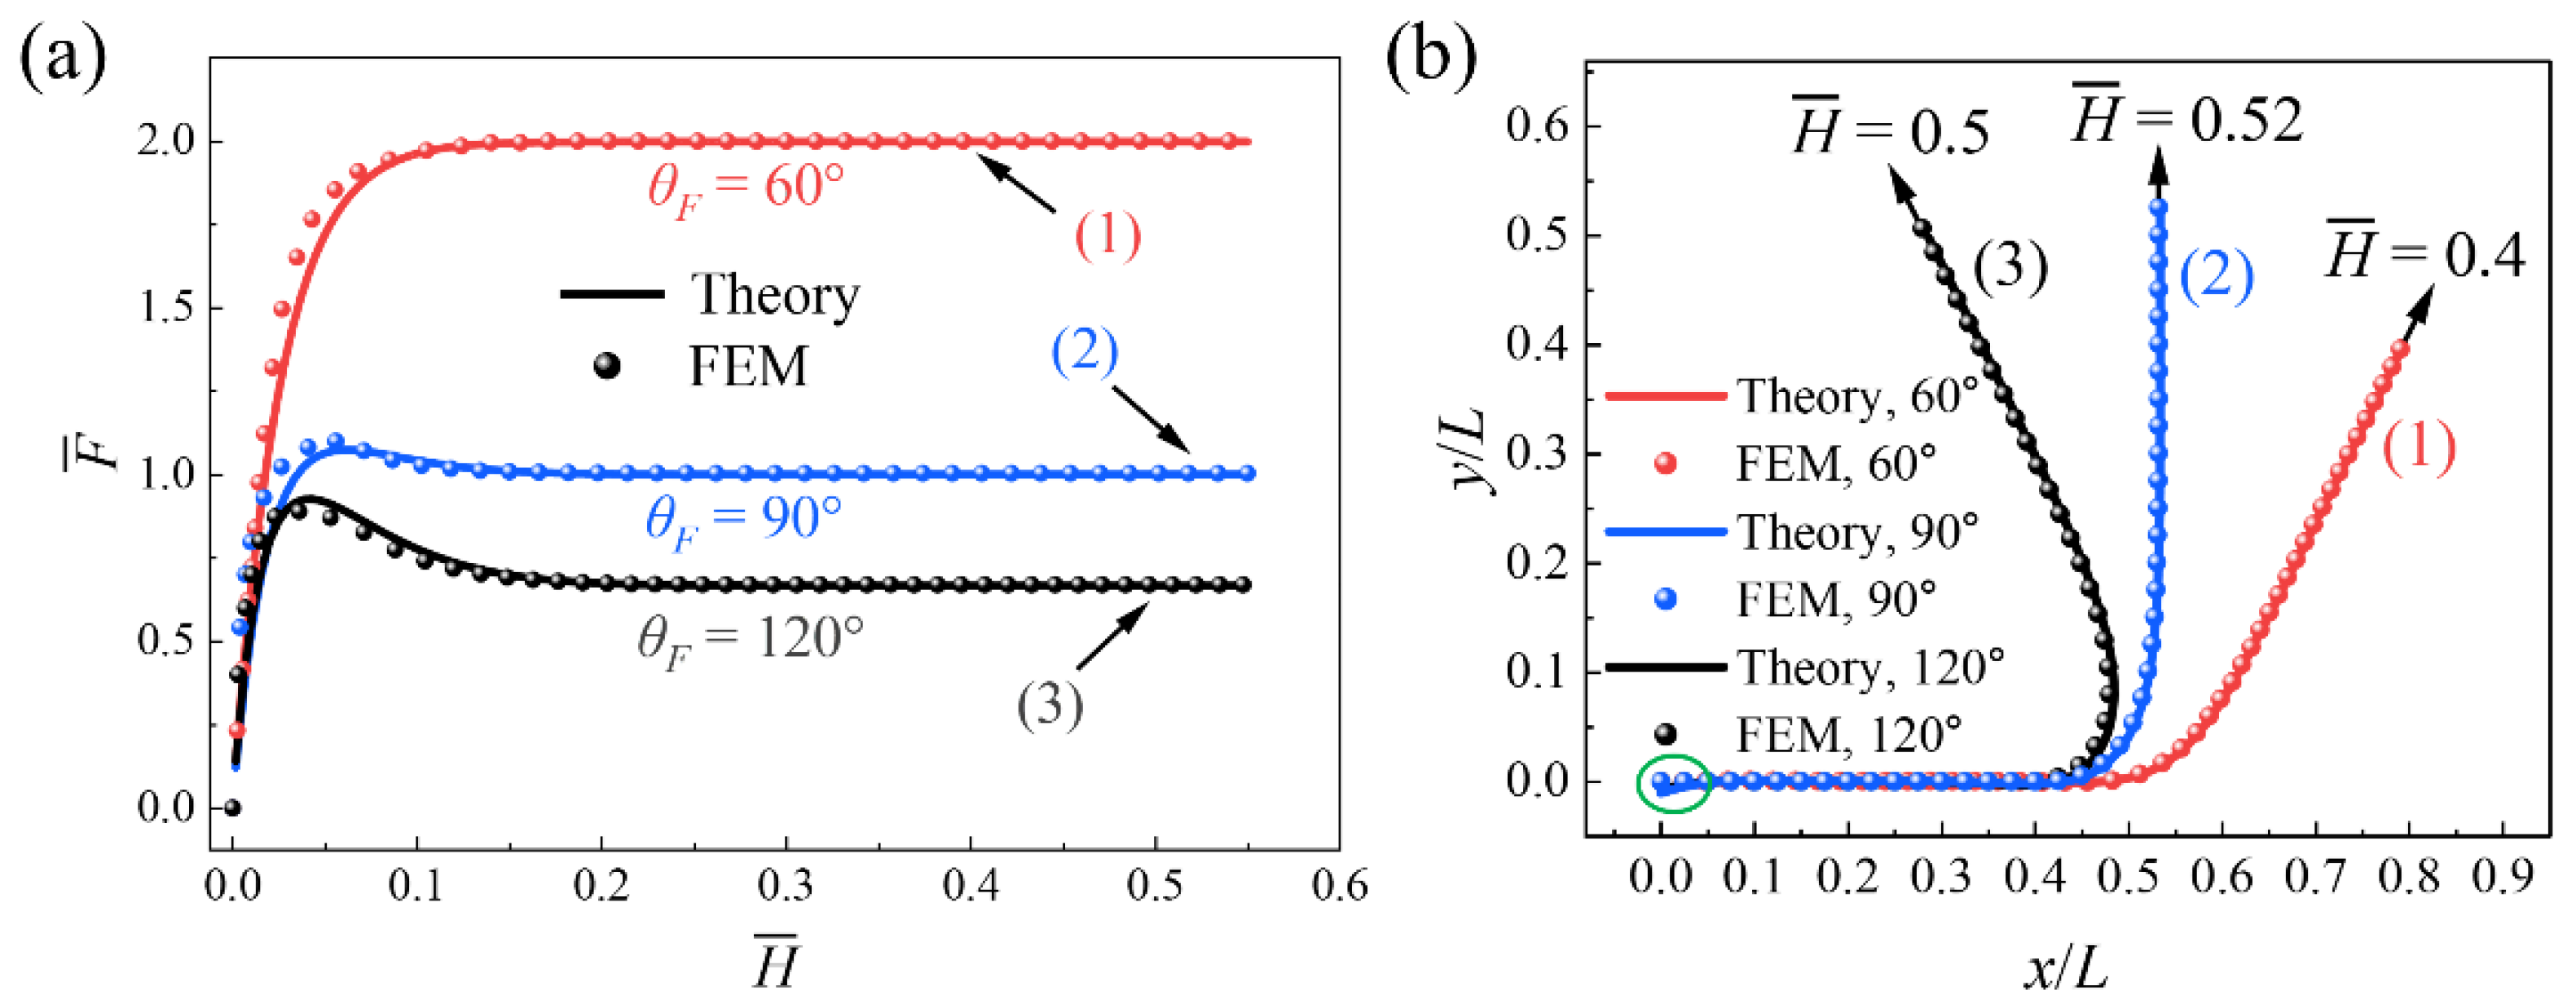
For convenience, the dimensionless peeling height H ¯ and dimensionless peeling force F ¯ are introduced. Specifically, H ¯   =   y ( L ) / L is the dimensionless vertical position at the right edge of the film, and F ¯   =   F / γ is the peeling force F normalized by the interfacial adhesion energy γ . Figure 3a shows F ¯ as a function of H ¯ for peeling angles θ F   =   60 ° , 90°, and 120°. The present results are in excellent agreement with the FEM simulations for all three peeling angles, confirming the validity of the theoretical model. For θ F   =   90 ° and 120°, the peeling force exhibits three stages (initial stage, transition stage and steady-state stage) [40,41], depending on the peeling angle. The peeling force first increases to a maximum F ¯ m during the initial stage and then decreases gradually during the transition stage before attaining a constant value, called the steady-state peeling force F ¯ s , at the steady-state stage. For θ F   =     60 ° , however, the peeling force increases monotonically with the peeling displacement during the initial stage until it reaches a constant value F s ¯ . In this case, F ¯ m   =   F ¯ s . For all angles, F ¯ s is consistent with the classical Kendall model, i.e., F / γ   =   1 / ( 1 c o s θ F ) [16].
Figure 3b shows the thin film profiles at the steady-state stage for each peeling angle, plotted as vertical position y versus horizontal position x. The selected peeling heights H ¯   =   0.4 ( θ F   =   60 ° ), 0.52 ( θ F   =   90 ° ), and 0.5 ( θ F   =   120 ° ) correspond to the stage at which approximately half of the film has been peeled off and the peeling process has reached steady state. At this stage, the peeling force has reached its plateau, and the rotation angle at the right end of the film satisfies θ ( L )   =   θ F . The theoretical predictions also agree well with FEM results. A small discrepancy appears near x = 0 (marked by a circle), where the theoretical model yields a non-zero rotation angle while the FEM model gives zero. This discrepancy arises because the energy-variational framework imposes a homogeneous Neumann boundary condition θ ( 0 )   =   0 (free rotation) at the left edge, whereas in FEM, cohesive elements constrain rotation until local debonding occurs. This local difference is confined to the vicinity of the left edge and has a negligible effect on the overall peeling behavior. Since both the peeling force and the film profile are validated, and the strain is a function of F and θ via Equation (4), a separate strain validation is not performed here. A direct strain validation approach can be found in [41].

3.2. Comparison Between Strain Evolution and Load Response

Before a detailed comparison, it is necessary to establish an objective rule for classifying the stages of strain evolution. A strain response is formally defined as exhibiting a “three-stage” behavior if it possesses a distinct local peak that exceeds the subsequent steady-state value by a certain margin. Otherwise, it is classified as “two-stage”. To implement this, we adopt a tolerance criterion based on the ratio of the global maximum strain, ε m , to the steady-state peak strain,   ε s . A response is considered three-stage if it satisfies ε m / ε s   >   1   +   τ (Here, τ = 0.04), where τ is a small tolerance to avoid numerical noise triggering a false three-stage classification. Consequently, a “two-stage” response is defined by ε m / ε s     1   +   τ , indicating the global maximum strain is reached in the steady state without a pronounced intermediate peak. This definition allows for a quantitative and consistent distinction throughout the following analysis.
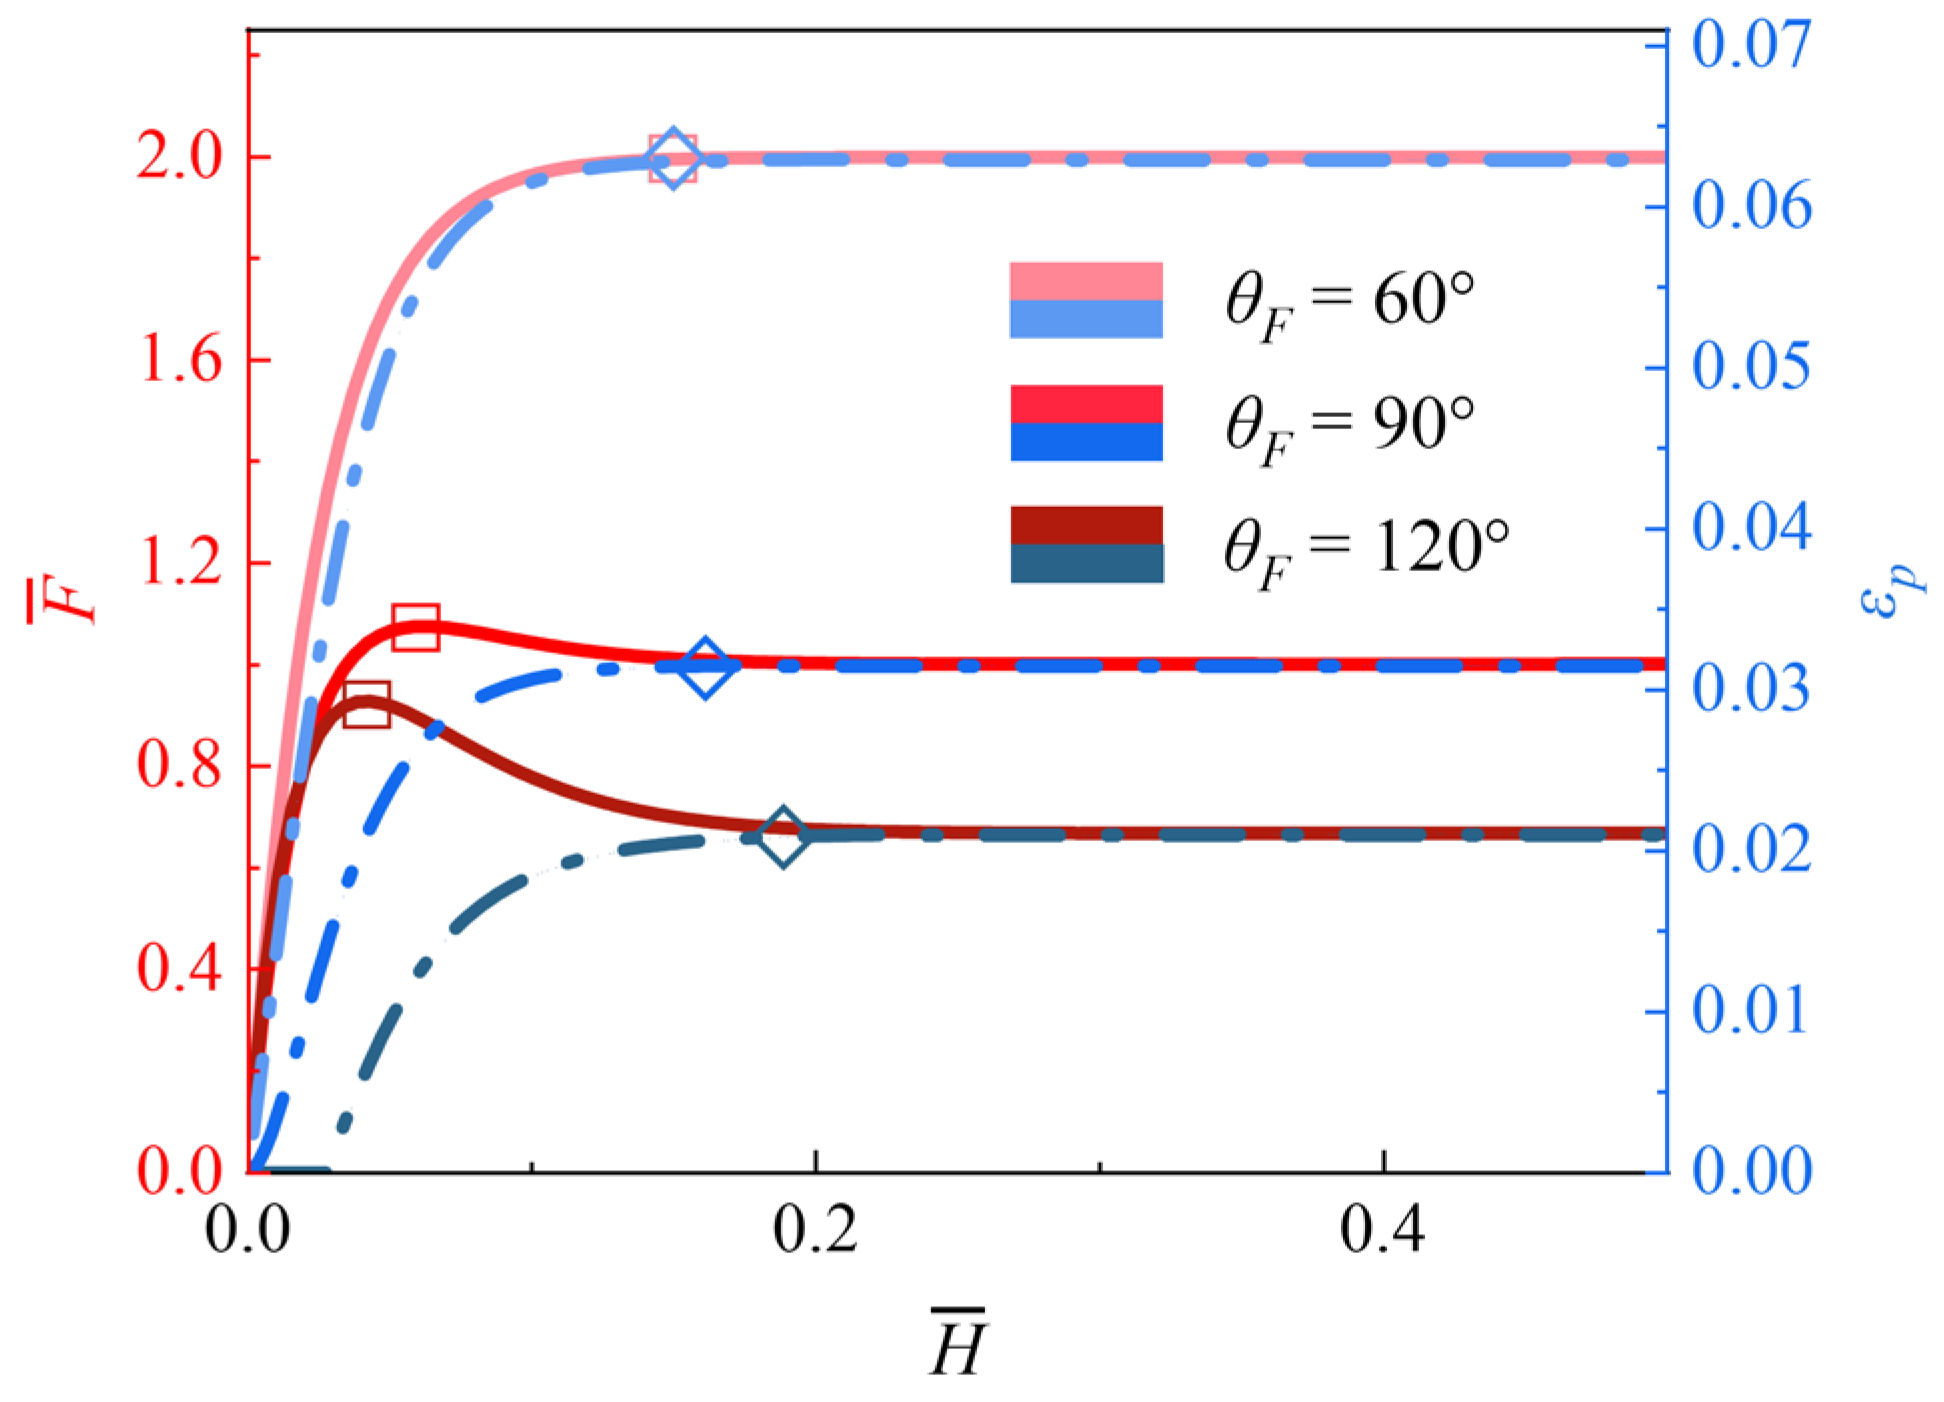
Having validated the theoretical model in terms of both the film profile and the load response, we now use it to study the key parameters governing film damage risk, i.e., the peak strain ε p and the global maximum strain ε m . Figure 4 illustrate F ¯ and ε p as functions of H ¯ for θ F   =   60 ° , 90°, and 120°. It can be seen that the evolution of ε p with H ¯ exhibits a similar trend to that of F ¯ . For the 60° peeling angle, both F ¯ and ε p increase with increasing H ¯ in the initial stage. They simultaneously reach their respective steady-state values, F ¯ s and ε s , without forming a distinct intermediate peak. Consequently, F ¯ m and ε m are equal to F ¯ s and ε s , respectively. According to the established criterion ( ε m / ε s     1   +   τ ), this response is rigorously classified as a two-stage evolution.
However, since ε p depends on the deflection angle θ, its evolution does not always follow the same trend as F ¯ . For example, at the 90° peeling angle, the evolution of F ¯ with H ¯ clearly shows three distinct stages. In contrast, the evolution of ε p increases monotonically with H ¯ and eventually plateaus at a constant value. Since ε m is reached in the steady state and no prior peak exceeds this value by the margin τ , the strain response is objectively classified as two-stage, differing fundamentally from the force response. Furthermore, F ¯ reaches its maximum value F ¯ m at H ¯   =   0.056 , while ε p attains its peak at a different H ¯ value ( H ¯   =   0.16 ). This discrepancy arises because the strain also depends on the deflection angle θ through cos ( θ θ F ) (Equation (4)). In three-stage peeling, F ¯ peaks before the steady-state stage begins. At this point, the maximum of θ at the right edge of the film ( s   =   L ) has not been reached, so the peeling force and deflection angle cannot contribute their maximum values to the strain simultaneously. For θ F   =   90 ° , cos ( θ θ F ) at s   =   L is close to zero, greatly weakening the peak force’s contribution and removing the strain peak. Thus, the load response shows three stages while the strain response only shows two.
For θ F = 120 ° , at the onset of peeling, the local deflection angles along the film are sufficiently small such that θ θ F < 90 ° , rendering cos ( θ θ F ) negative and producing compressive strain ( ε < 0 ). However, as peeling-induced damage is primarily governed by tensile rather than compressive strain [42], the present analysis is restricted to the tensile strain regime ( ε > 0 ). It should be noted that compressive strain could potentially induce local wrinkling or buckling, but these failure modes are beyond the scope of the present damage criteria. Since the compressive strain at small H ¯ is not considered here, the ε p H ¯ curve for θ F   =   120 ° does not originate from the coordinate origin. Once tensile strain emerges, its evolution follows two-stage criterion, analogous to those observed in the θ F   =   90 ° case, so F ¯ m and ε m occur at different H ¯ values. This marked discrepancy between strain evolution and load response underscores the necessity of direct strain analysis rather than relying solely on force measurements.

3.3. Influence of System Parameters on Strain

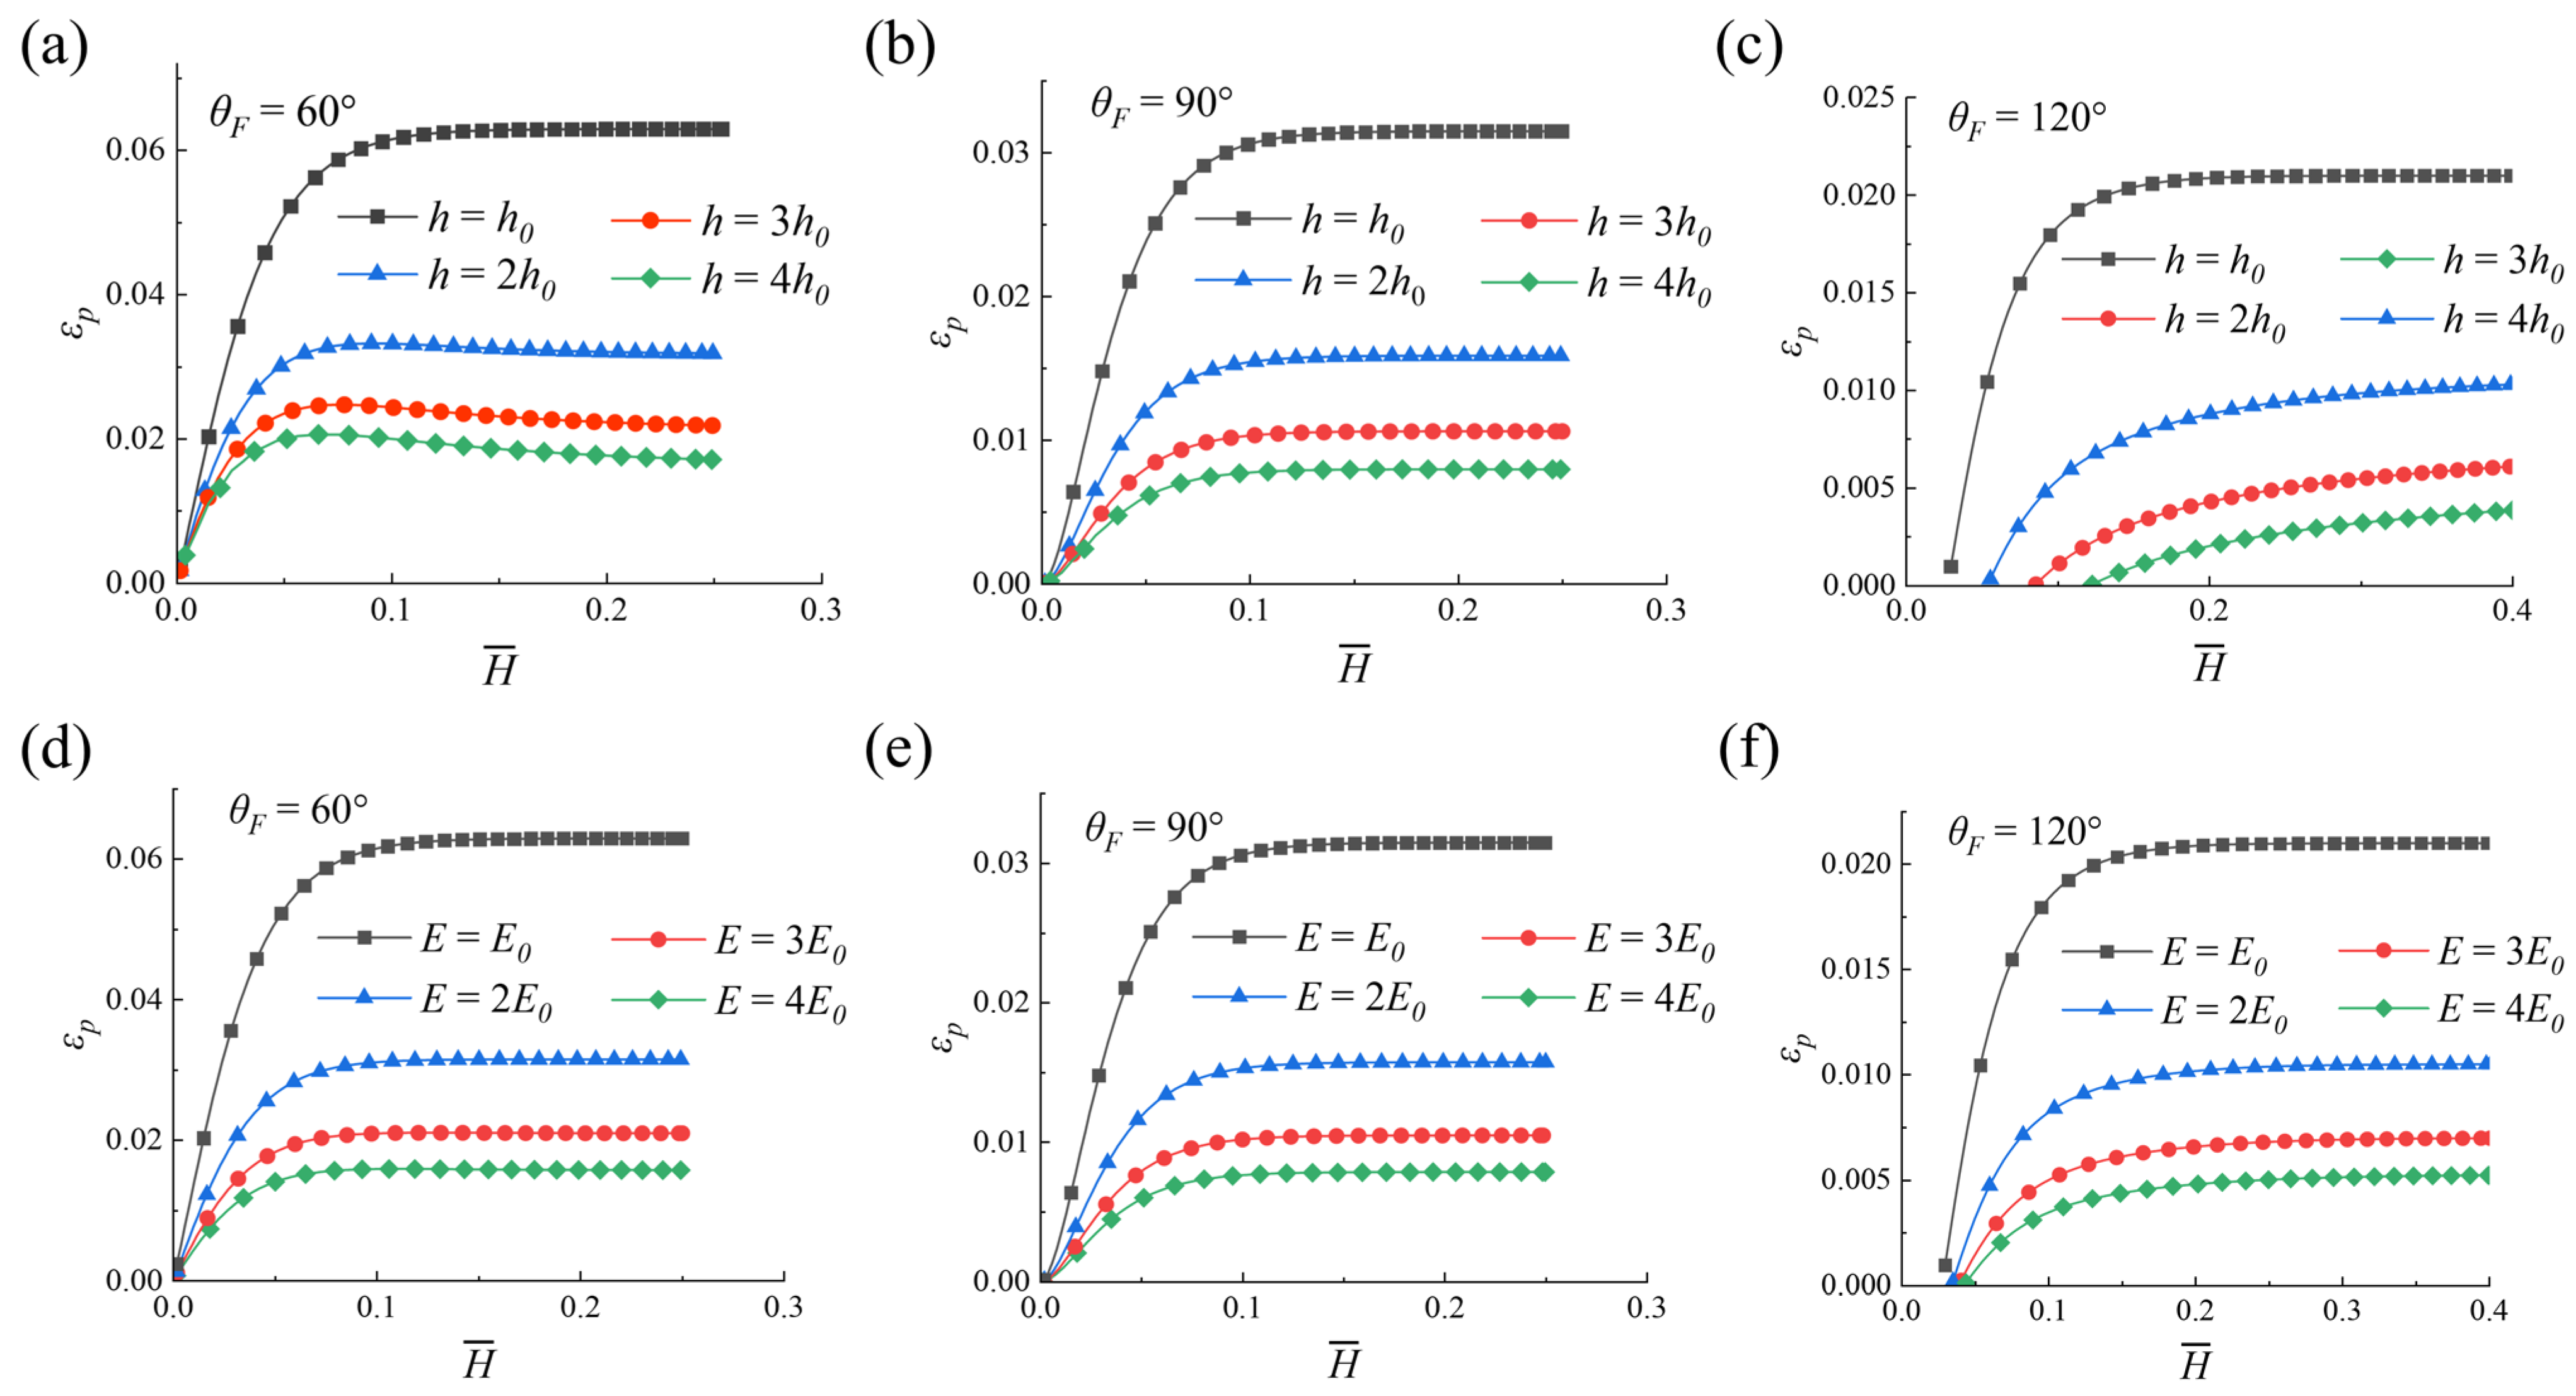
The influence of system parameters, such as Young’s modulus E, film thickness h and interfacial adhesion energy γ , on the peak strain ε p and the global maximum strain ε m are examined. Figure 5 presents ε p as functions of H ¯ for thickness ratios h / h 0 ∈ [1,4] (Figure 5a–c) and Young’s modulus ratios E / E 0 ∈ [0.5, 3] (Figure 5d–f) at peeling angles θ F   =   60 ° ,   90 ° , and 120 ° , respectively. The compressive strain for θ F   =   120 ° are excluded from all plots, consistent with the analysis scope defined earlier. For all θ F , ε p decreases monotonically with increasing h / h 0 or E / E 0 . This behavior is attributed to the fact that the tensile stiffness of the film is directly proportional to both h and E. An increase in tensile stiffness reduces the resulting strain during peeling, as described by Equation (4). Although increasing h or E also enhances the bending stiffness, which in turn increases the maximum peeling force during the transition stage and thereby contributes to a higher maximum strain, the present results demonstrate that the strain reduction due to increased thickness or modulus far outweighs this enhancing effect.
Notably, all curves in Figure 5b–f and the h / h 0   =     1 curve in Figure 5a exhibit a two-stage evolution. Only the curves for h / h 0     =   2 ,     3 ,     4 in Figure 5a show a three-stage response. This discrepancy arises from the combined effects of peeling angle and stiffness scaling. First, at θ F   =   60 ° , the term cos ( θ θ F ) has the largest magnitude among the three angles, making the contribution of the peeling force peak to the total strain the most significant. Second, film bending stiffness scales with h 3 , while tensile stiffness scales linearly with h. For h / h 0       2 at 60 ° , the dramatic increase in bending stiffness leads to a much higher peak peeling force F ¯ m , whose contribution to strain finally exceeds the strain reduction caused by increased tensile stiffness. This creates a distinct peak in the ε p H ¯ curve and thus a three-stage response. In contrast, for h / h 0   =     1 at 60 ° , the bending stiffness is too low to generate a sufficiently strong force peak effect. For θ F   90 ° , the cos ( θ θ F ) term is inherently small, and for modulus variation, bending stiffness only scales linearly with E. In all these cases, the force peak contribution cannot overcome the tensile stiffness effect, resulting in only two-stage strain evolution.
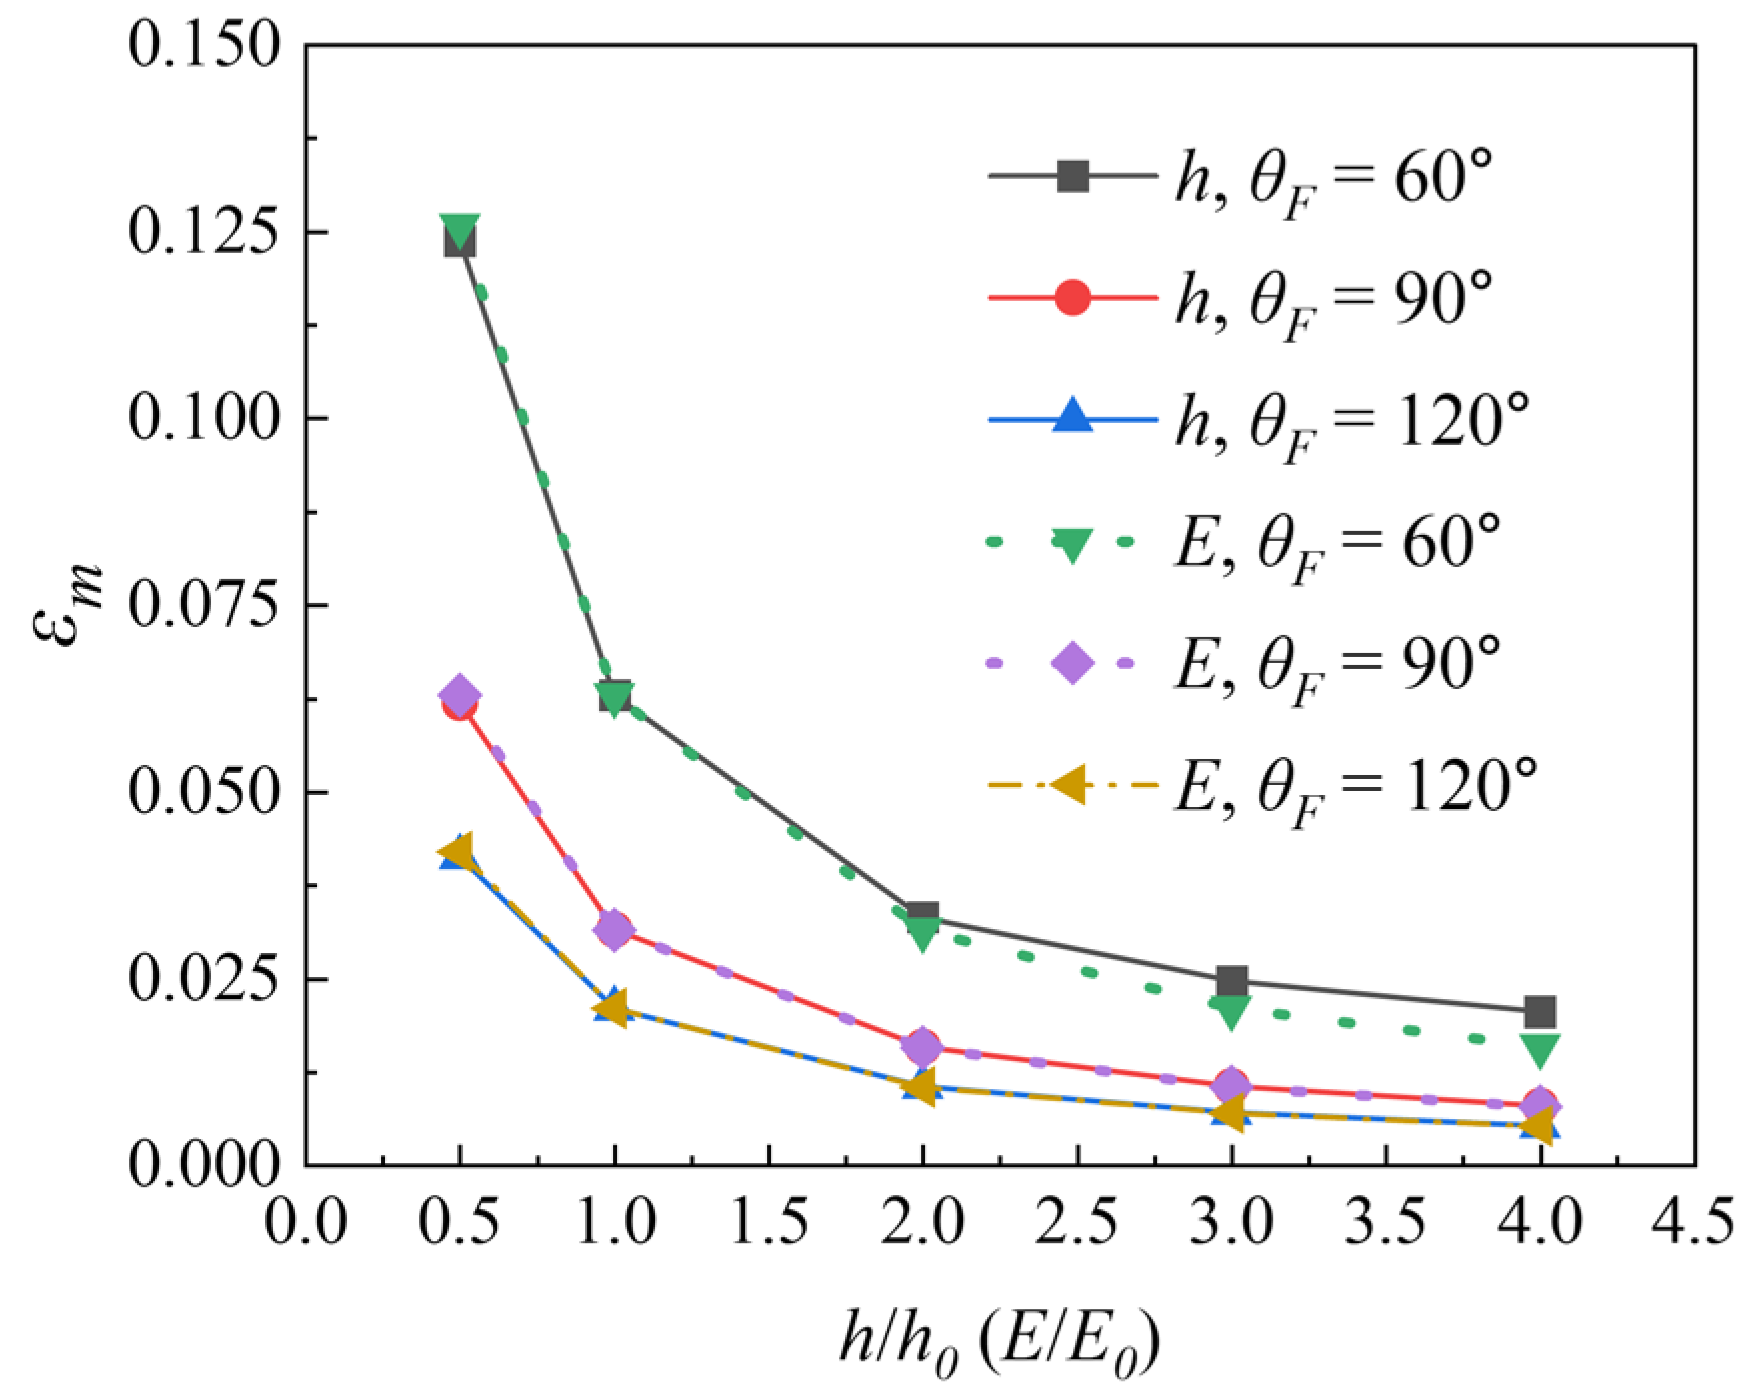
To further quantify the influence of the film properties on the most critical strain during the peeling, Figure 6 presents the global maximum strain ε m as functions of the thickness ratio h / h 0 and modulus ratio E / E 0 for θ F = 60 ° ,   90 ° , and 120 ° , respectively. Other parameters remain the same as those in Figure 5. It is evident that ε m decreases with increasing h / h 0 or E / E 0 . For peeling angles of 90° and 120°, the effect of thickness on strain is similar to that of Young’s modulus. However, at θ F = 60°, the effects of thickness and modulus deviate in the right range of the horizontal axis. The strain-reducing effect of thickness is weaker than that of Young’s modulus. This occurs because the maximum strain at 60° occurs during the transition stage, where the peeling force is governed by bending stiffness. Since increasing thickness contributes more to bending stiffness than increasing Young’s modulus, the strain remains higher for thickness variations than for modulus variations in this regime.
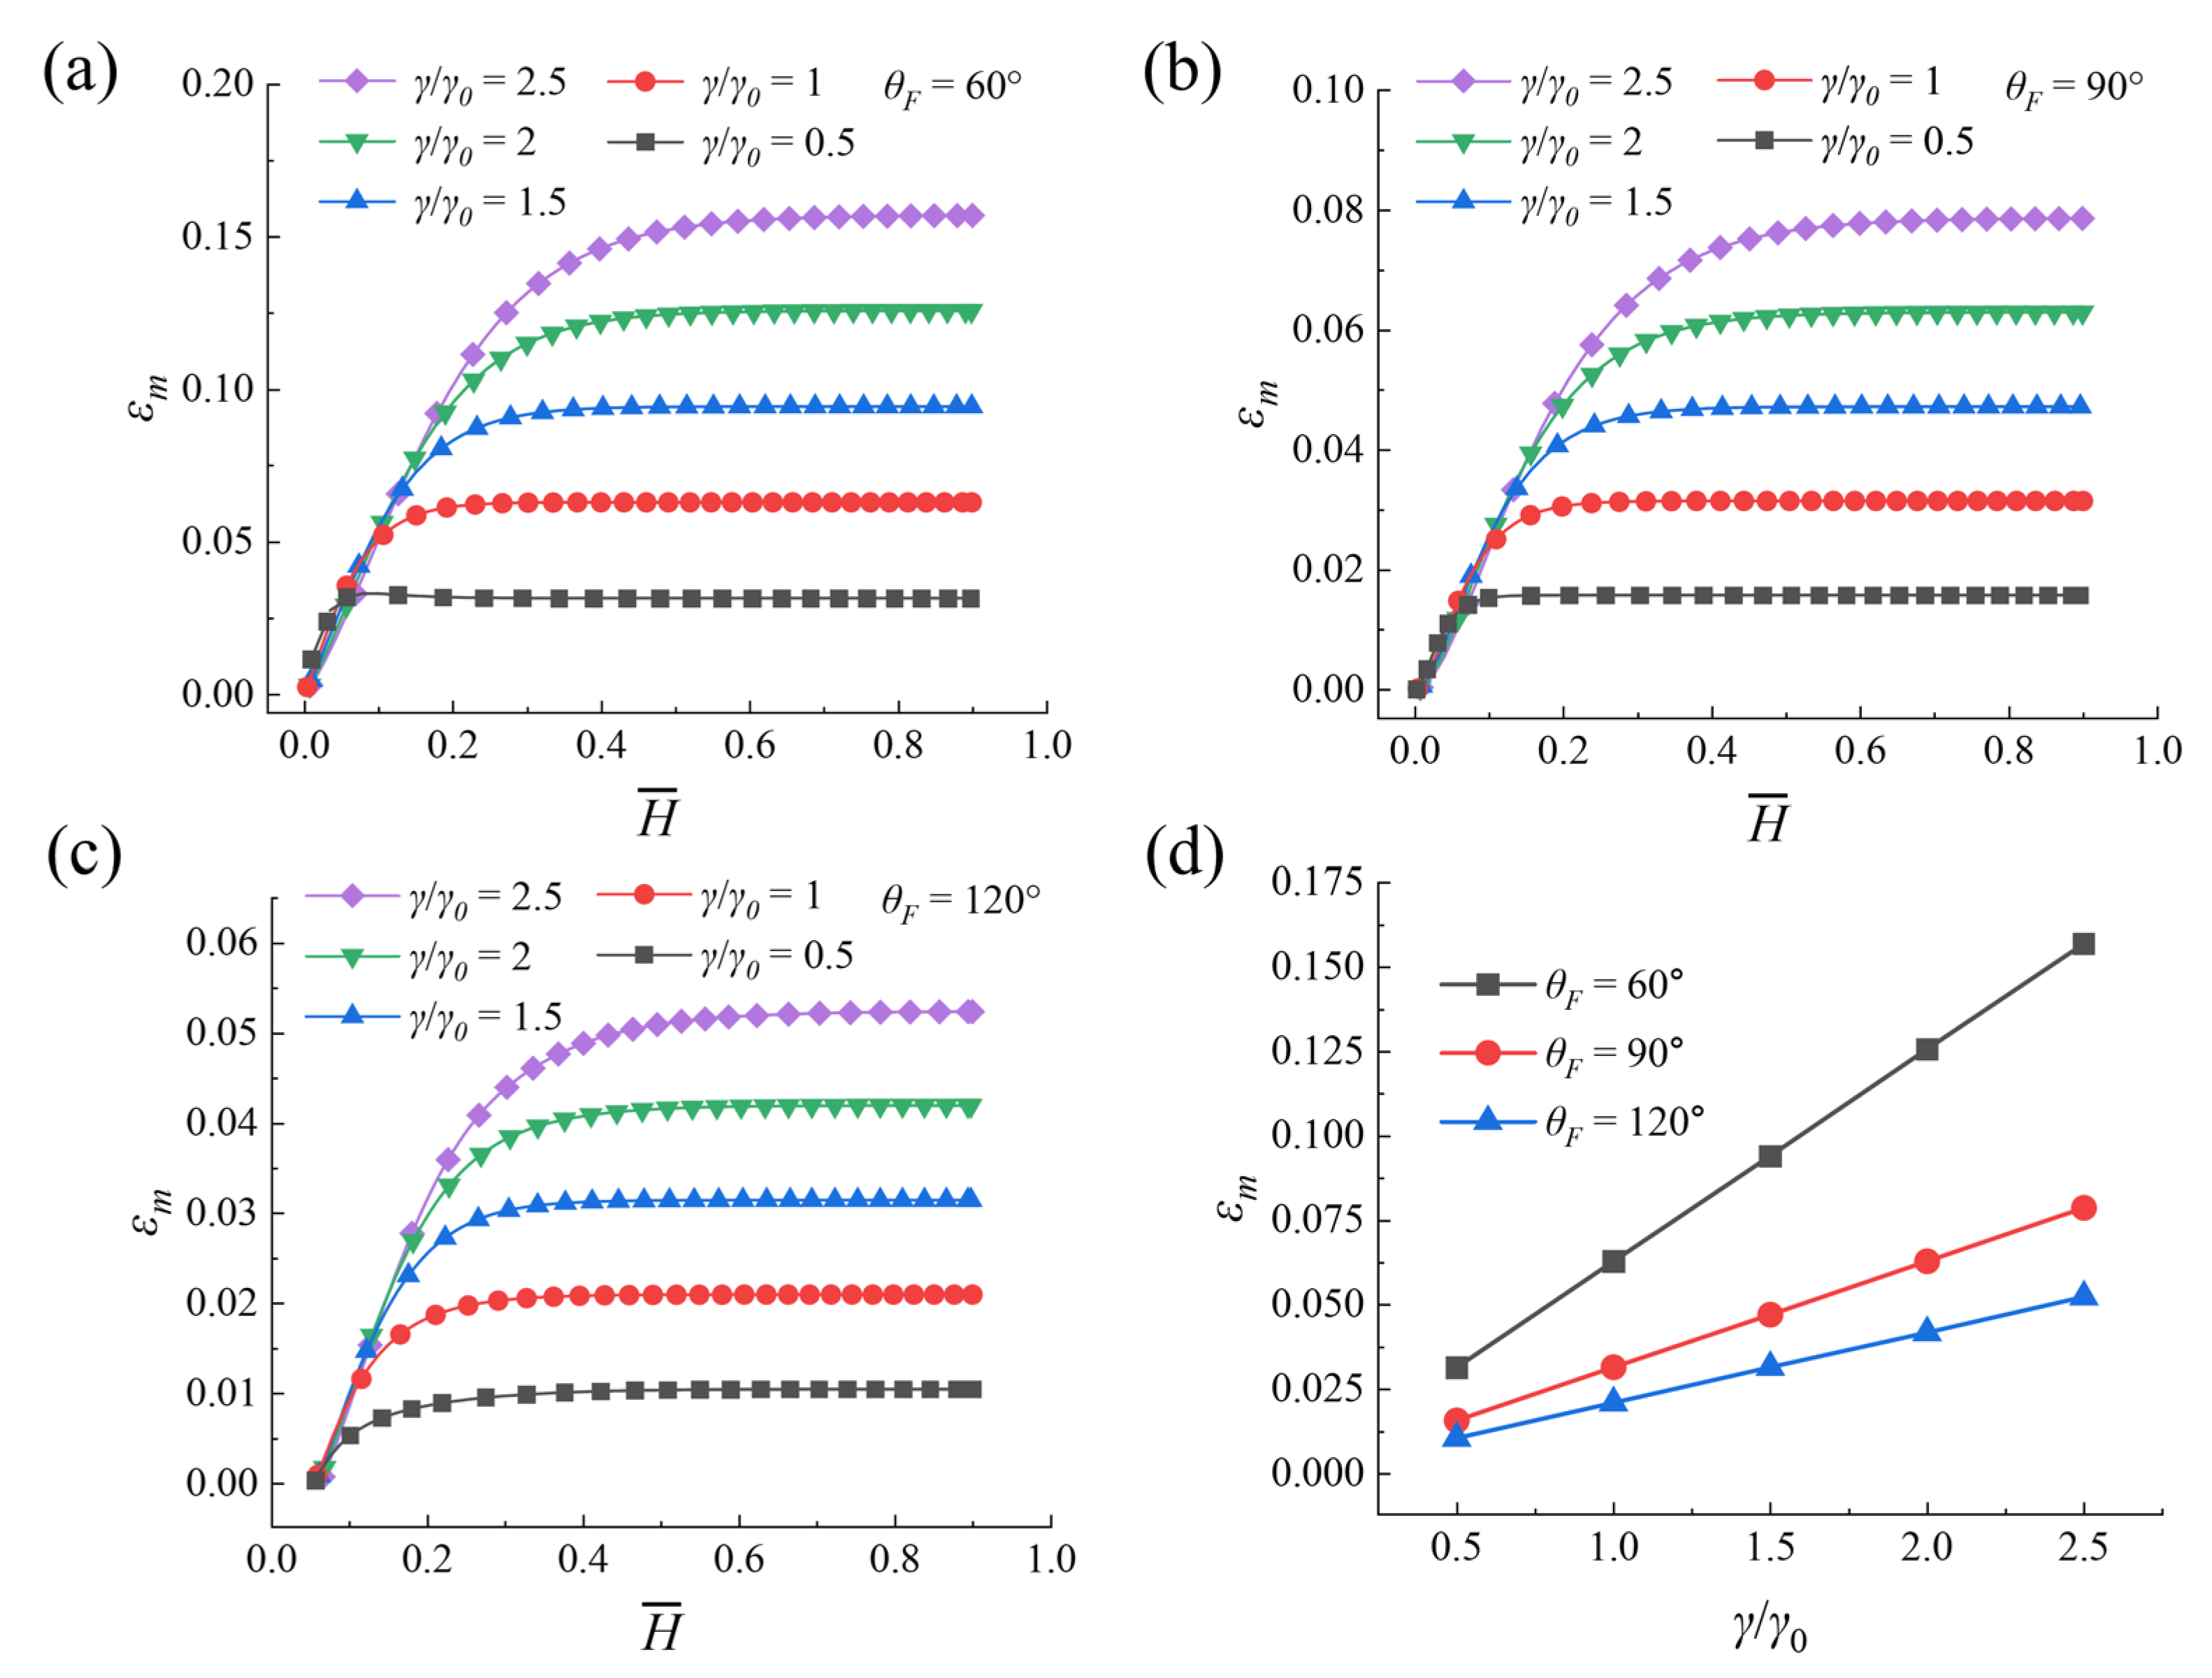
Figure 7 presents the peak strain ε p as a function of the peeling height H ¯ for different interfacial adhesion energies γ / γ 0 ∈ [0.5, 2.5] at peeling angles θ F   =   60 ° ,   90 ° , and 120 ° , respectively. Figure 7a–c show that, for all peeling angles, the strain increases monotonically with the adhesion energy. This behavior is expected, as a larger adhesion energy requires a greater peeling force to detach the film from the substrate, and the in-plane strain is directly proportional to the peeling force (see Equation (4)). The monotonic relationship holds across the entire range of peeling heights, from the initial stage to the steady-state stage.
Figure 7d presents the global maximum strain ε m as a function of the dimensionless adhesion energy γ / γ 0 for the three peeling angles. The results reveal that ε m is approximately proportional to γ / γ 0 for all angles, with the slope increasing as the peeling angle decreases. The proportionality constant can be derived from the Kendall model and is determined by the peeling angle, film thickness, and Young’s modulus. It is expressed as
ε m = ε s = γ E h 1 cos θ F .
These findings have practical implications for strain control. Since the strain is directly proportional to the adhesion energy, reducing γ through surface treatments (e.g., applying release layers or anti-stiction coatings) offers a direct and predictable way to lower the strain during peeling. For example, reducing the adhesion energy by half would halve the peak strain. This linear relationship makes adhesion engineering a particularly attractive strategy for mitigating strain-related issues, especially when film thickness or material selection is constrained by other design requirements.
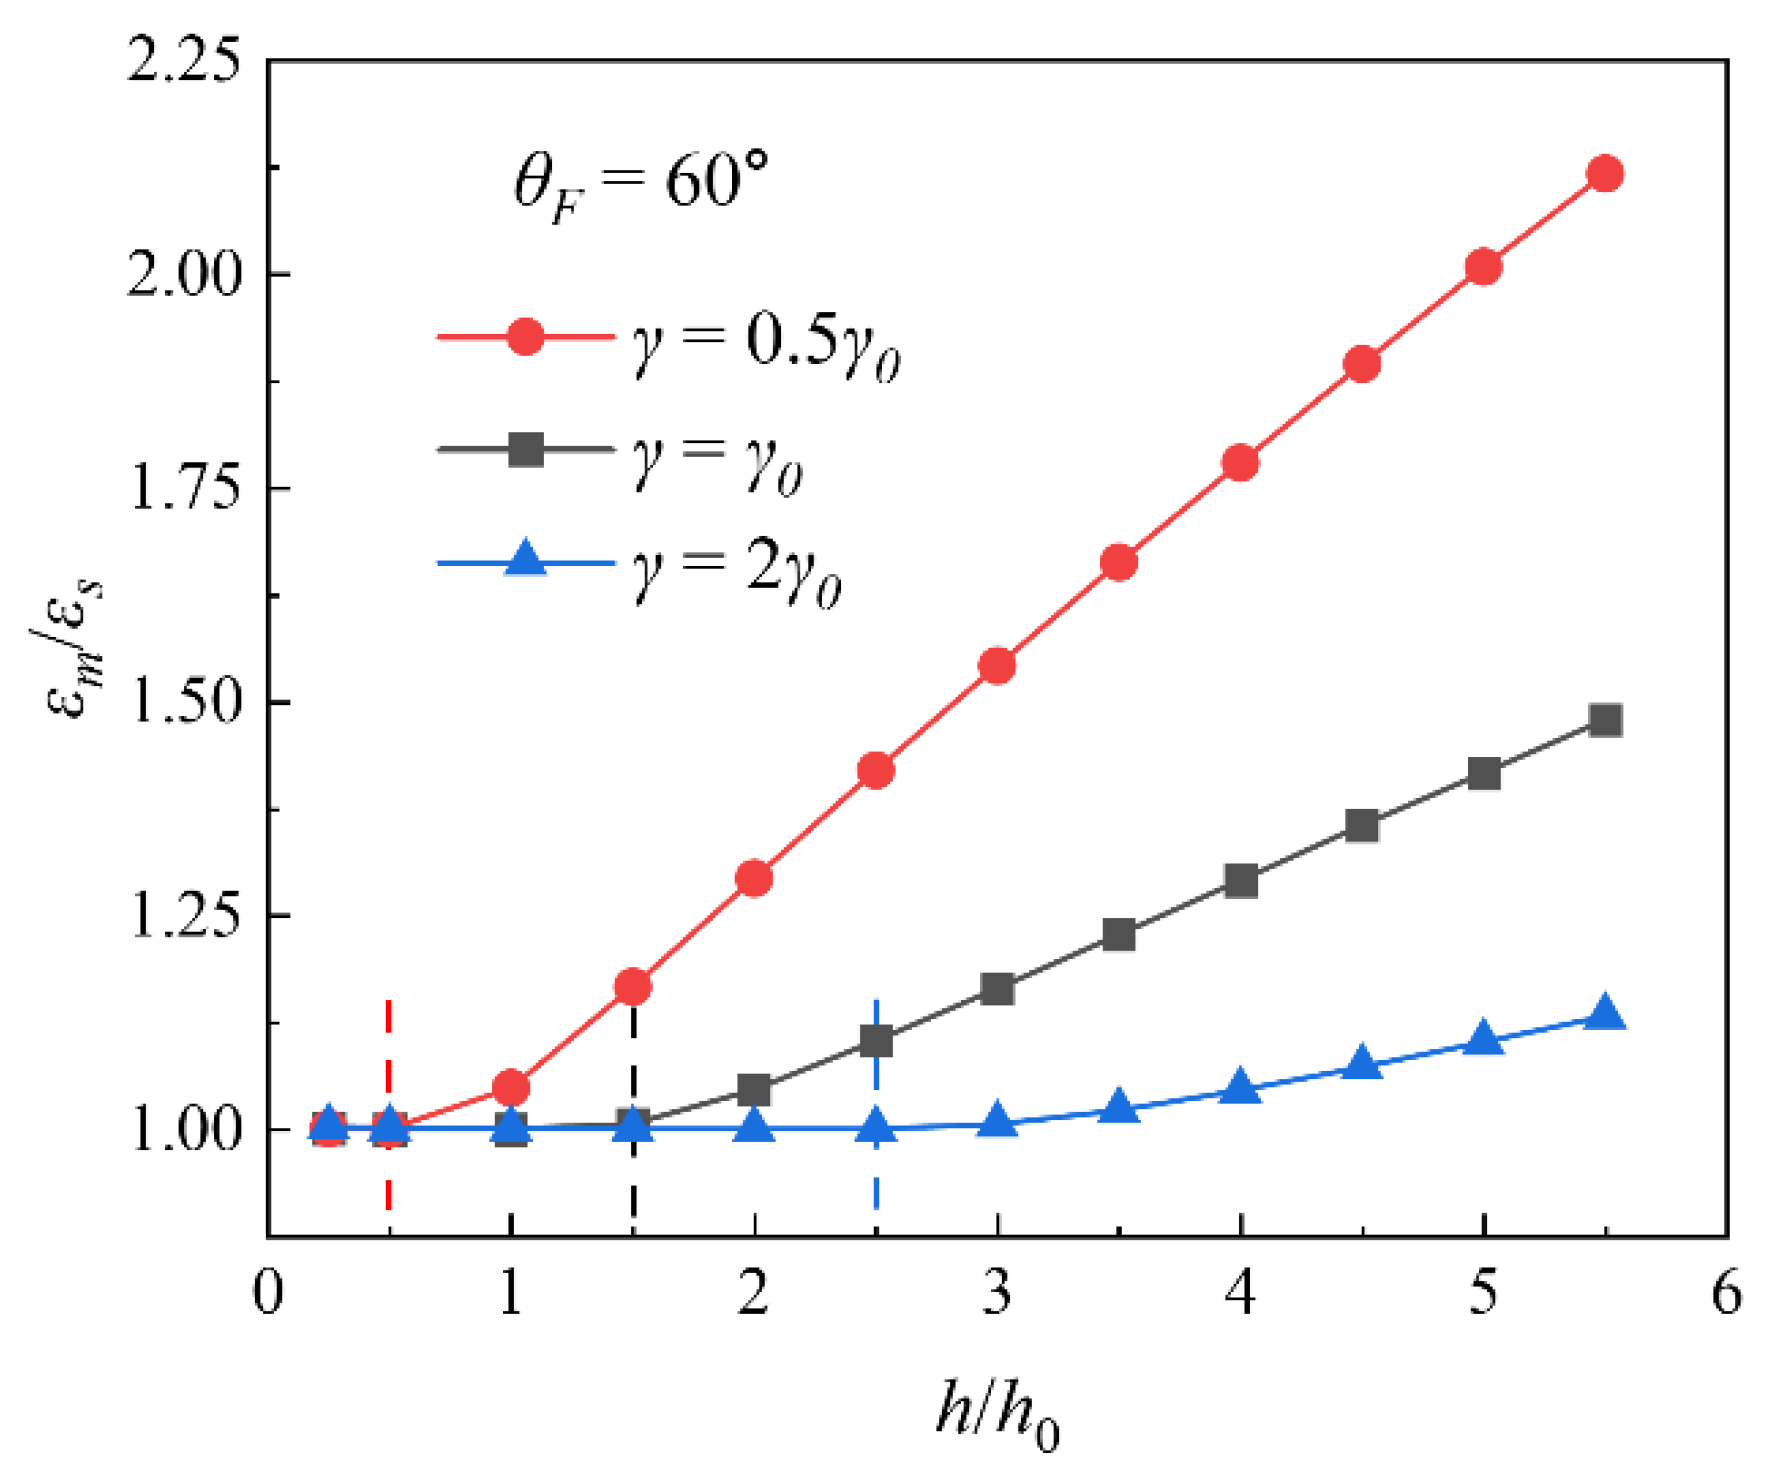
From the above analysis, the strain evolution is more sensitive to the peeling angle and film thickness parameters. In particular, at a peeling angle of 60°, the three-stage strain response is more likely to emerge with increasing film thickness. To further reveal the underlying transition mechanism, we examine the dimensionless global maximum strain ε m / ε s , defined as the ratio of the global maximum strain to the steady-state peak strain, as a function of the dimensionless film thickness h / h 0 at 60°, as shown in Figure 8. The dashed lines represent the transition boundary between two-stage and three-stage strain evolution, which shifts to the right with increasing adhesion energy γ . ε m / ε s   =   1 denotes two-stage evolution, while values greater than 1 denote three-stage evolution.
As can be seen from the figure, when h / h 0 lies to the left of the transition boundary, ε m / ε s remains constant at 1, and the global maximum strain can be accurately predicted using Equation (11), as in the cases where the peeling angle is greater than or equal to 90°. This indicates that the bending effect is negligible and the tensile deformation dominates. When h / h 0 lies to the right of the boundary, ε m / ε s exceeds 1 and exhibits an approximately linear relationship with h / h 0 , with the slope decreasing as γ increases. In this regime, the bending stiffness becomes sufficiently large to induce a prominent peak in the peeling force, which further leads to an extra peak in the strain evolution. As a result, the strain can no longer be described by the Kendall model, which ignores the bending effect. Instead, it can be accurately captured by the theoretical model.

3.4. A Unified Classification Criterion for Strain Response Regimes

The analysis in Section 3.2 and Section 3.3 reveals that the strain evolution may follow either a two-stage or a three-stage response, depending on the interplay between film properties and peeling conditions. In the two-stage regime, the global maximum strain equals the steady-state peak strain ( ε m   =   ε s ), and the strain can be accurately estimated using the classical Kendall model (Equation (11)). In the three-stage regime, however, ε m   >   ε s due to bending-induced force overshoot, the theoretical model (Equations (8)–(10)) must be solved to obtain the correct strain. Therefore, in practical applications it is advantageous to determine in advance which regime a given system belongs to, without resorting to the full variational solution. To this end, we formulate a binary classification problem based on the primary physical parameters E , h , θ F , and γ .
A dataset is constructed by evaluating the model across the ranges E / E 0       [ 0.5 ,     5 ] , h / h 0       [ 0.1 ,     5 ] , θ F     [ 20 ,   85 ] , and γ / γ 0     [ 0.5 ,     2 ] . For each parameter combination, the ratio z = ε m / ε s is computed. A sample is labeled as two-stage if z 1 + τ   (i.e., the global maximum strain equals the steady-state value) and as three-stage if z > 1 + τ , where a small tolerance τ   =   0.04 accounts for numerical precision.
Dimensional analysis and the physics of the peeling process motivate the choice of two dimensionless features. As demonstrated in Section 3.3, the transition between two-stage and three-stage behavior is governed by the competition between bending stiffness and interfacial adhesion. To capture this competition, we introduce the characteristic length l. The two dimensionless features are then defined as
x = log γ l E h 2 , y = log 1 cos θ F .
To mitigate scale differences and improve numerical efficiency, both features are standardized to zero mean and unit variance according to
x ˜ = x μ x σ x , y ˜ = y μ y σ y ,
where μ x , σ x and μ y , σ y are the mean and standard deviation of x and y over the dataset, respectively. A regression model is employed with a polynomial basis up to third order in the standardized variables. The feature vector comprises ten terms given by
Φ x , y = 1 , x ˜ , y ˜ , x ˜ 2 , y ˜ 2 , x ˜ y ˜ , x ˜ 2 y ˜ , x ˜ y ˜ 2 , y ˜ 3 , x ˜ 3 .
The weight vector w R 10 is determined by minimizing the regularized cross-entropy loss
L w = 1 n i = 1 n t i log σ η i + 1 t i log 1 σ η i + λ 2 j = 2 10 w j 2 ,
where η i   =   w T Φ ( x i , y i ) , σ ( u )   =   1 / ( 1 + e u ) ,   t i { 0 ,   1 } denotes the class label (0 for three-stage, 1 for two-stage), and the bias weight w 1 is excluded from regularization. The optimization is performed via full-batch gradient descent with backtracking line search until convergence.
To rigorously assess the classifier performance and select the regularization strength, a 10-fold cross-validation is conducted over a grid of λ values. The classifier achieves a cross-validation accuracy of 95.62% ± 3.14% with an Area Under the Curve (AUC) of 0.996, both of which reflect excellent discriminative performance. The training accuracy is 96.78% and the train-test gap is only 1.16%, which confirms that the classifier generalizes well without overfitting. The optimal regularization parameter is found to be λ = 0, indicating that the dataset is sufficiently large relative to the model complexity.
Once trained, the boundary separating the two regimes is determined by a single discriminant given by a dot product of w and Φ ( x , y ) , i.e.,
η = w T Φ x , y .
The fitted parameters obtained from the dataset are μ x   =   0.51 , σ x   =   2.04 , μ y   =   1.23 , σ y   =   0.86 , and the weight vector w =   [ 2.65 ,   16.33 ,   7.59 ,   3.00 ,   4.10 ,   0.04 ,   1.51 ,   6.12 ,   5.24 ,   3.06 ] T . With these parameters, the discriminant η determines the strain response regime. A positive value of η ( > 0 ) predicts a two-stage response, whereas a negative value ( η   <   0 ) predicts a three-stage response.
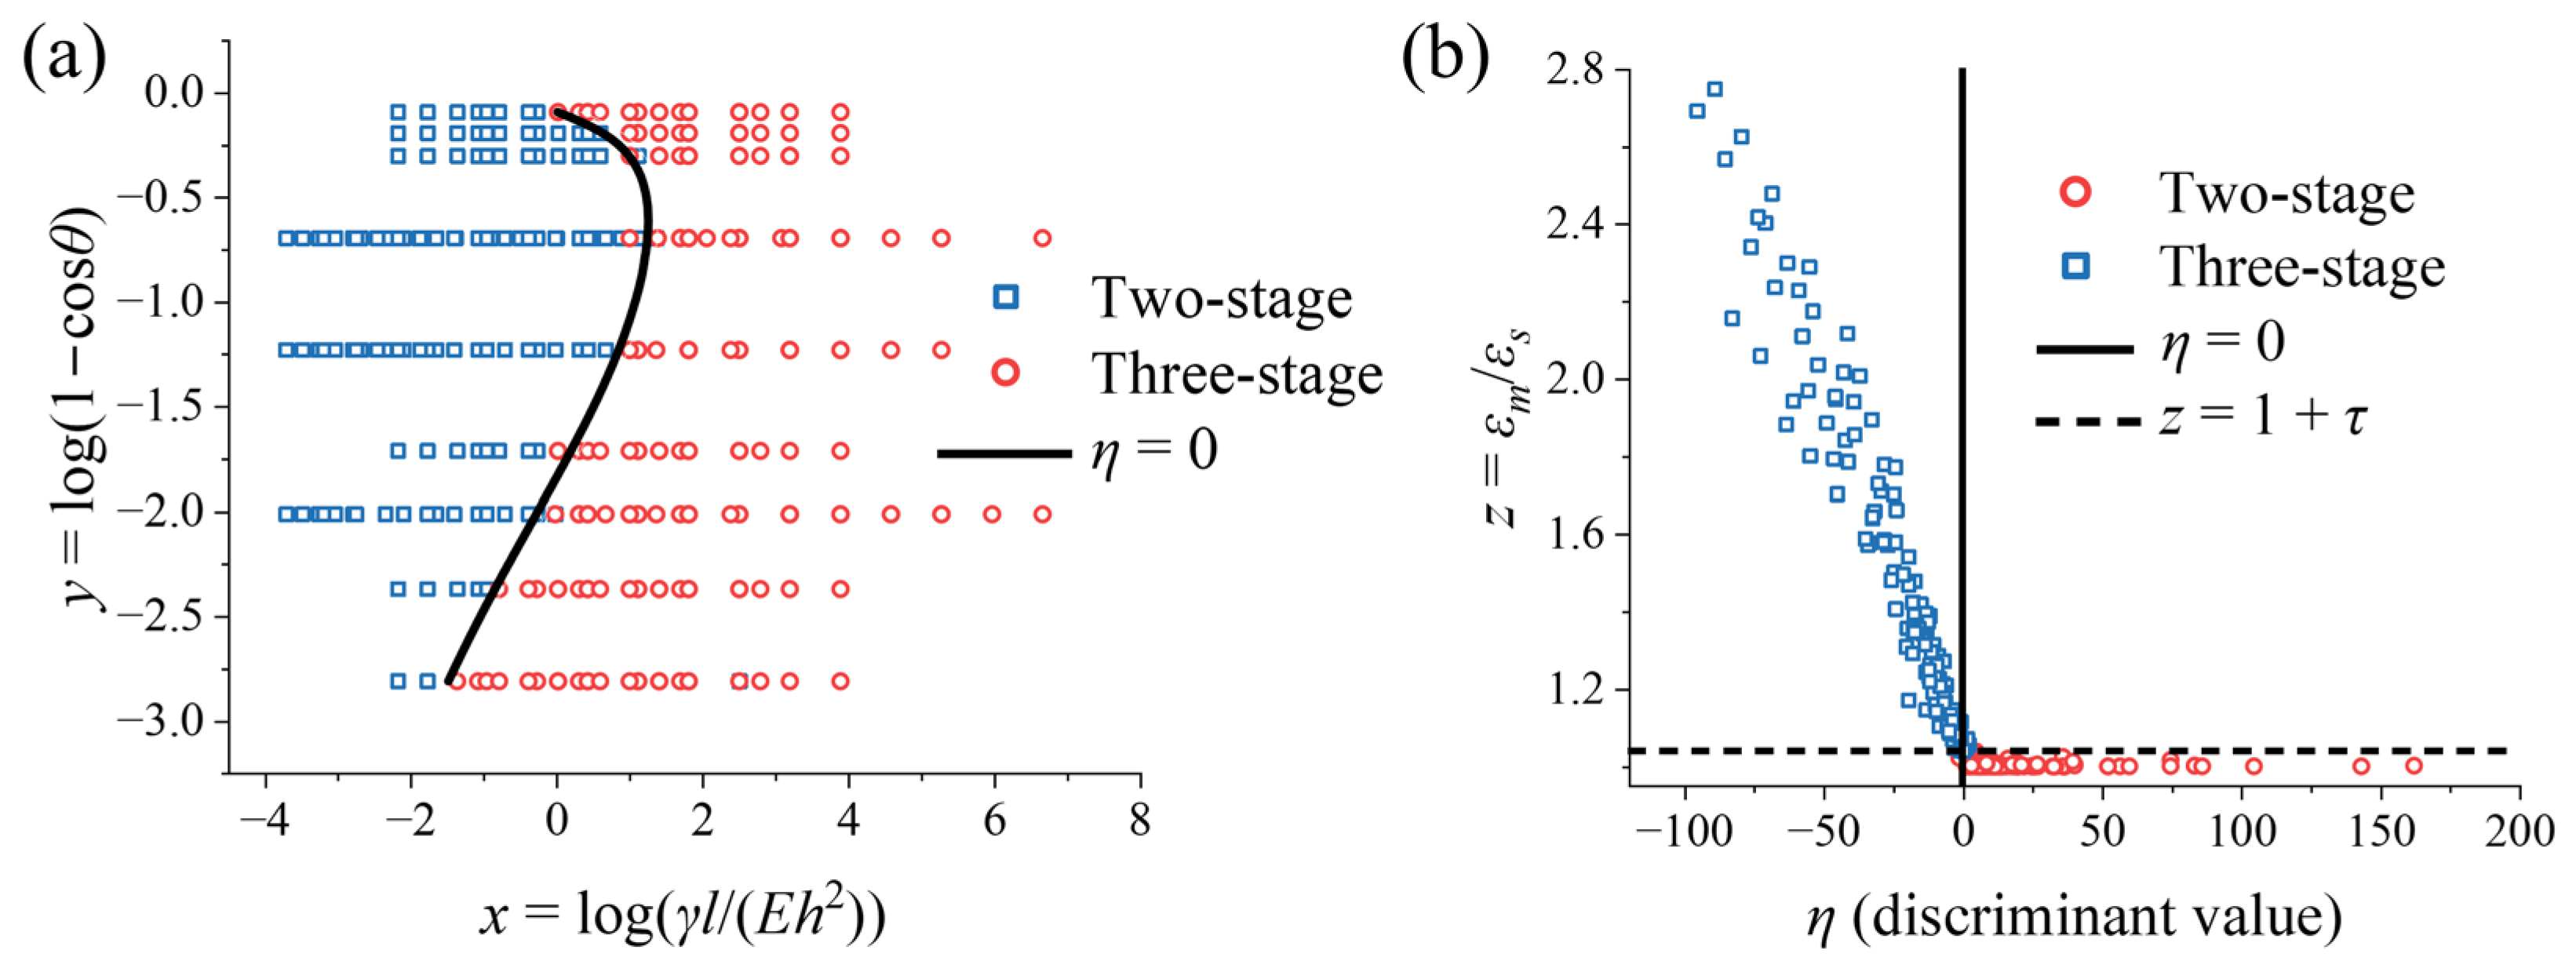
Figure 9a displays the two-dimensional decision boundary η   =   0 in the standardized feature space, where the two-stage and three-stage data points are clearly separated. Figure 9b shows the strain ratio z   =   ε m / ε s plotted against the discriminant value η for all samples, where the vertical dashed line at η   =   0 marks the classification boundary. For the two-stage regime within acute angles (i.e., η   > 0 ), as well as for all right-angle ( θ F = 90 ° ) and obtuse ( θ F > 90 ° ) cases in which the steady-state strain is always the global maximum strain, the Kendall-based model (Equation (11)) provides an accurate estimate of the global maximum strain ε m . In contrast, for acute angles with η < 0 (three-stage regime), the theoretical model (Equations (8)–(10)) must be solved. Equation (16) therefore provides a simple criterion to determine, without solving the full peeling equations, whether the Kendall model suffices or the theoretical model is necessary for an accurate strain estimate.


4. Conclusions

This paper presents a systematic parametric analysis of the in-plane strain experienced by a thin elastic film during peeling from a rigid substrate. Using an energy-variational framework validated against finite element simulations, we investigate how peeling angle θ F , film thickness h , Young’s modulus E , interfacial adhesion energy γ , and the characteristic length l of the cohesive zone govern the peak strain and the global maximum strain, both of which are critical for assessing film damage risk. The results show that the evolution of peak strain with peeling height does not always match the load response. While the peeling force may exhibit a clear peak during the transition stage, the peak strain can continue to increase monotonically, particularly for peeling angles of 90° and above. For peeling angles greater than 90°, compressive strain may arise at small peeling heights, but once tensile strain emerges, the strain response usually follows a two-stage evolution. These findings confirm that relying solely on force measurements is insufficient for predicting strain, while a quantitative analysis of the in-plane strain is essential.
Parametric studies further demonstrate that the peak strain and global maximum strain decrease with increasing film thickness and Young’s modulus and increase proportionally with interfacial adhesion energy. For a peeling angle of 60°, thickness and modulus exhibit different influences due to their distinct contributions to bending stiffness. In contrast, for angles of 90° and 120°, their effects are similar, and the dimensionless strain ratio remains unified. To provide a practical tool for regime identification, a unified classification criterion was developed. Using logistic regression with polynomial features up to third order, a closed-form decision boundary expressed in terms of E ,   h , θ F , and γ was obtained. This criterion can effectively identify whether a given system exhibits a two-stage or three-stage strain response, thereby guiding the appropriate choice of estimation method, i.e., Kendall-based or the theoretical model.
Collectively, the parametric dependencies established in this work provide a quantitative framework for predicting the in-plane strain in thin film peeling. While the theoretical model is limited to linear elasticity, small strain, and rigid substrates, these assumptions are appropriate for the ultra-thin films typical of flexible electronics. The insights obtained are particularly relevant for applications requiring high film integrity, such as flexible electronics manufacturing, device transfer, and fragile material handling. Future work may extend the current framework to viscoelastic or plastic film behaviors, non-rigid substrates, or more complex interfacial traction laws.

Author Contributions

Conceptualization, K.L. and H.H.; methodology, K.L. and M.X.; software, L.J.; validation, Y.G. and H.H.; formal analysis, K.L.; investigation, H.H.; resources, H.H. and Y.G.; data curation, K.L.; writing—original draft preparation, K.L.; writing—review and editing, H.H.; supervision, H.H.; project administration, H.H. All authors have read and agreed to the published version of the manuscript.

Funding

This research was funded by the Natural Science Foundation of China, grant numbers 52305607, 52575662, and 52527808.

Data Availability Statement

The original contributions presented in this study are included in the article. Further inquiries can be directed to the corresponding authors.

Acknowledgments

This work was supported by the Natural Science Foundation of China.

Conflicts of Interest

Author Lu Jia and Yuan Gao was employed by the company Information Science Academy of China Electronics Technology Group Cooperation. The remaining authors declare that the research was conducted in the absence of any commercial or financial relationships that could be construed as a potential conflict of interest.

Appendix A

The boundary value problem described by Equation (8) is solved using the shooting method. By introducing the auxiliary variable α = /ds, the governing equations are rewritten as a system of first-order ordinary differential equations for the unknowns θ(s), α(s), x(s), y(s), and the Lagrange multiplier λ1(s). At the left edge (s = 0), the known conditions are α(0) = 0, x(0) = 0, λ1(0) = 0, and λ2 = 0. The unknown initial values θ(0) and y(0) serve as the shooting parameters, which are iteratively adjusted to satisfy the target conditions θ(L) = θF and y(L) = H ¯ L at the right edge (s = L).
The dimensionless peeling height H ¯ is increased from 0 to 1 with a step size H ¯ = 0.002. At H ¯ = 0, the initial guess is θ(0) = 0, y(0) = 0. For each subsequent step, the converged solution from the previous step is used as the initial guess. At each iteration, the first-order ODE system is integrated from s = 0 to s = L using the 4th-order Runge–Kutta method with N = 200 uniform segments. The residual vector R = [θ(L) − θF, y(L) − H ¯ L ]ᵀ is evaluated, and the shooting parameters θ(0) and y(0) are updated via Newton iteration using a numerically computed Jacobian matrix. The iteration terminates when the L2 norm of R falls below 10−6. Once the solution is obtained, the peak strain ε p and global maximum strain ε m are computed from Equations (9) and (10).

References

  1. Wang, H.Z.; Li, Z.; Liu, Z.Y.; Fu, J.K.; Shan, T.Y.; Yang, X.Y.; Lei, Q.Y.; Yang, Y.J.; Li, D.H. Flexible capacitive pressure sensors for wearable electronics. J. Mater. Chem. C 2022, 10, 1594–1605. [Google Scholar] [CrossRef]
  2. Carlson, A.; Bowen, A.M.; Huang, Y.; Nuzzo, R.G.; Rogers, J.A. Transfer printing techniques for materials assembly and micro/nanodevice fabrication. Adv. Mater. 2012, 24, 5284–5318. [Google Scholar] [CrossRef]
  3. Wang, H.Y.; Ma, J.S.; Yang, Y.D.; Gong, M.L.; Wang, Q.H. A Review of System-in-Package Technologies: Application and Reliability of Advanced Packaging. Micromachines 2023, 14, 1149. [Google Scholar] [CrossRef]
  4. Gupta, S.; Navaraj, W.T.; Lorenzelli, L.; Dahiya, R. Ultra-thin chips for high-performance flexible electronics. npj Flex. Electron. 2018, 2, 8. [Google Scholar] [CrossRef]
  5. Chalaki, H.R.; Seesi, E.; Suber, A.; Nam, S.H.; Suh, Y.H.; Lee, D. Scalable, epitaxy-preserving transfer of freestanding perovskite and layered oxide membranes with tunable strain. Mater. Adv. 2026, 7, 2727–2737. [Google Scholar] [CrossRef]
  6. Huang, Y.F.; Deng, Y.J.; Yi, P.Y.; Peng, L.F. Highly Fatigue-Resistant Stretchable Electrodes Based on Regular Stripe-Shaped Platinum Nanofilm. ACS Appl. Mater. Interfaces 2025, 17, 25839–25848. [Google Scholar] [CrossRef] [PubMed]
  7. Deng, Y.J.; Arafa, H.M.; Yang, T.Y.; Albadawi, H.; Fowl, R.J.; Zhang, Z.F.; Kandula, V.; Ramesh, A.; Correia, C.; Huang, Y.G.; et al. A soft thermal sensor for the continuous assessment of flow in vascular access. Nat. Commun. 2025, 16, 38. [Google Scholar] [CrossRef] [PubMed]
  8. Bartlett, M.D.; Case, S.W.; Kinloch, A.J.; Dillard, D.A. Peel tests for quantifying adhesion and toughness: A review. Prog. Mater. Sci. 2023, 137, 101086. [Google Scholar] [CrossRef]
  9. Song, R.; Chiang, M.; Crosby, A.; Karim, A.; Amis, E.J.; Eidelman, N. Combinatorial peel tests for the characterization of adhesion behavior of polymeric films. Polymer 2005, 46, 1643–1652. [Google Scholar] [CrossRef]
  10. Wei, W.; Petrini, L.; Altomare, L.; Farè, S.; Tremamunno, R.; Zhentao, Y.; Migliavacca, F. Modeling and experimental studies of peeling of polymer coating for biodegradable magnesium alloy stents. Rare Met. Mater. Eng. 2014, 43, 2877–2882. [Google Scholar] [CrossRef]
  11. Vogel, J.E.; Sederholm, J.G.; Shumway, E.M.; Abello, G.J.; Trask, S.E.; Wheeler, D.R.; Mazzeo, B.A. Li-ion battery electrode contact resistance estimation by mechanical peel test. J. Electrochem. Soc. 2022, 169, 080508. [Google Scholar] [CrossRef]
  12. Zhu, J.X.; Liu, X.M.; Shi, Q.F.; He, T.Y.Y.; Sun, Z.D.; Guo, X.G.; Liu, W.X.; Bin Sulaiman, O.; Dong, B.W.; Lee, C. Development Trends and Perspectives of Future Sensors and MEMS/NEMS. Micromachines 2020, 11, 7. [Google Scholar] [CrossRef] [PubMed]
  13. Oh, K.-S.; Cho, S.-H.; Choi, J.-Y.; Lee, K.-J.; Chan, S.-I. Improved reliability PERC PV modules with moth-eye nanostructured optical films using nano imprint lithography. Microelectron. Reliab. 2021, 126, 114320. [Google Scholar] [CrossRef]
  14. Calabrese, A.S.; Vassilopoulos, A.P. On the fatigue behavior of thin and thick adhesively bonded composite joints. Int. J. Fatigue 2025, 199, 109065. [Google Scholar] [CrossRef]
  15. Rivlin, R.S. The Effective Work of Adhesion. In Collected Papers of R.S. Rivlin; Barenblatt, G.I., Joseph, D.D., Eds.; Springer: New York, NY, USA, 1997; Volume I and II, pp. 2611–2614. [Google Scholar]
  16. Kendall, K. Thin-film peeling-the elastic term. J. Phys. D Appl. Phys. 1975, 8, 1449–1452. [Google Scholar] [CrossRef]
  17. Kim, B.J.; Liebau, M.; Huskens, J.; Reinhoudt, D.N.; Brugger, J. A self-assembled monolayer-assisted surface microfabrication and release technique. Microelectron. Eng. 2001, 57–58, 755–760. [Google Scholar] [CrossRef]
  18. Williams, J.G.; Hadavinia, H. Analytical solutions for cohesive zone models. J. Mech. Phys. Solids 2002, 50, 809–825. [Google Scholar] [CrossRef]
  19. Peng, Z.L.; Wang, C.; Chen, L.; Chen, S.H. Peeling behavior of a viscoelastic thin-film on a rigid substrate. Int. J. Solids Struct. 2014, 51, 4596–4603. [Google Scholar] [CrossRef]
  20. Yin, H.B.; Ma, Y.J.; Feng, X. Rate-dependent peeling behavior of the viscoelastic film-substrate system. Int. J. Solids Struct. 2024, 286, 112588. [Google Scholar] [CrossRef]
  21. Shen, C.S.; Wang, H.F.; Du, C.L. Peeling of a film from a flexible cantilever substrate. Mech. Res. Commun. 2022, 119, 103833. [Google Scholar] [CrossRef]
  22. Menga, N.; Dini, D.; Carbone, G. Tuning the periodic V-peeling behavior of elastic tapes applied to thin compliant substrates. Int. J. Mech. Sci. 2020, 170, 105331. [Google Scholar] [CrossRef]
  23. Xia, S.; Ponson, L.; Ravichandran, G.; Bhattacharya, K. Toughening and Asymmetry in Peeling of Heterogeneous Adhesives. Phys. Rev. Lett. 2012, 108, 196101. [Google Scholar] [CrossRef]
  24. Yuan, X.B. Finite-deflection peeling of elastic films with adhesive heterogeneity. Int. J. Solids Struct. 2026, 327, 113803. [Google Scholar] [CrossRef]
  25. Peng, Z.L.; Chen, S.H. Peeling behavior of a thin-film on a corrugated surface. Int. J. Solids Struct. 2015, 60–61, 60–65. [Google Scholar] [CrossRef]
  26. Ceglie, M.; Menga, N.; Carbone, G. The Interplay of Viscoelasticity and Friction in Thin Tape Peeling. In Proceedings of the 5th International Tribology Symposium of IFToMM (ITS-IFToMM); Springer: Cham, Switzerland, 2024; pp. 387–394. [Google Scholar]
  27. Hu, H.; Tian, H.M.; Gao, Y.; Wan, Z.G.; Wang, L.; Xu, H.L.; Wang, C.H.; Shao, J.Y.; Zheng, Z.J. Revisiting the contact splitting hypothesis: An effective route for enhancing adhesion on rough surface. J. Mech. Phys. Solids 2023, 170, 105121. [Google Scholar] [CrossRef]
  28. Han, Y.K.; Chen, P.J.; Liu, H.; Zhao, Y.C.; Yang, W.M. Peeling behavior of two-dimensional kirigami materials on substrates at the nanoscale. J. Appl. Phys. 2026, 139, 014303. [Google Scholar] [CrossRef]
  29. Chen, S.; Shi, K.; Kong, Z.; Ma, Y.; Feng, X. Mechanics analysis and experimental study of ultra-thin chip peeling from pre-stretching substrates. Int. J. Solids Struct. 2025, 308, 113161. [Google Scholar] [CrossRef]
  30. Shin, Y.; Hong, S.; Hur, Y.C.; Lim, C.; Do, K.; Kim, J.H.; Kim, D.-H.; Lee, S. Damage-free dry transfer method using stress engineering for high-performance flexible two-and three-dimensional electronics. Nat. Mater. 2024, 23, 1411–1420. [Google Scholar] [CrossRef]
  31. Li, P.; Huang, X.; Zhao, Y.-P. Electro-capillary peeling of thin films. Nat. Commun. 2023, 14, 6150. [Google Scholar] [CrossRef] [PubMed]
  32. Needleman, A. An analysis of decohesion along an imperfect interface. Int. J. Fract. 1990, 42, 21–40. [Google Scholar] [CrossRef]
  33. Yin, H.; Liang, L.; Wei, Y.; Peng, Z.; Chen, S. Determination of the interface properties in an elastic film/substrate system. Int. J. Solids Struct. 2020, 191, 473–485. [Google Scholar] [CrossRef]
  34. Peng, Z.L.; Chen, S.H. Effect of bending stiffness on the peeling behavior of an elastic thin film on a rigid substrate. Phys. Rev. E 2015, 91, 042401. [Google Scholar] [CrossRef] [PubMed]
  35. Yin, H.; Peng, Z.; Chen, S. The peeling behavior of a heterogeneous elastic film on a rigid substrate. Int. J. Solids Struct. 2023, 285, 112529. [Google Scholar] [CrossRef]
  36. Zhang, Y.; Tan, K.; Liaw, B.; Liaw, D.; Kang, E. Thermal imidization of poly (amic acid) precursors on glycidyl methacrylate (GMA) graft-polymerized Si (100) surface. Thin Solid Films 2000, 374, 70–79. [Google Scholar] [CrossRef]
  37. Xu, W.; Wei, Y. Strength and interface failure mechanism of adhesive joints. Int. J. Adhes. Adhes. 2012, 34, 80–92. [Google Scholar] [CrossRef]
  38. Yin, H.B.; Peng, Z.L.; Yao, Y.; Chen, S.H.; Gao, H.J. A general solution to the maximum detachment force in thin film peeling. Int. J. Solids Struct. 2022, 242, 111546. [Google Scholar] [CrossRef]
  39. Yin, H.B.; Chen, S.H.; Liang, L.H.; Peng, Z.L.; Wei, Y.G. Quantitative Prediction of the Whole Peeling Process of an Elastic Film on a Rigid Substrate. J. Appl. Mech. 2018, 85, 091004. [Google Scholar] [CrossRef]
  40. Peng, Z.L.; Yin, H.B.; Yao, Y.; Chen, S.H. Effect of thin-film length on the peeling behavior of film-substrate interfaces. Phys. Rev. E 2019, 100, 032804. [Google Scholar] [CrossRef]
  41. Yuan, X.B. Angle-dependent peeling behavior of compliant nanofilms on planar substrates. Int. J. Solids Struct. 2025, 316, 113380. [Google Scholar] [CrossRef]
  42. Hu, H.; Zhang, C.; Ding, Y.C.; Chen, F.; Huang, Q.Y.; Zheng, Z.J. A Review of Structure Engineering of Strain-Tolerant Architectures for Stretchable Electronics. Small Methods 2023, 7, 2300671. [Google Scholar] [CrossRef]
Figure 1. (a) Schematic of an elastic thin film with a length L peeling from a rigid substrate with a peeling force F and a peeling angle θ F at the right end of the film. A curvilinear coordinate (s, θ) and a rectangular one (x, y) are attached to the film–substrate system with the origin o at the left end of the film. (b) An intermediate state.
Mathematics 14 01869 g001
Figure 2. Schematic of finite element model showing mesh configuration and boundary conditions used for peeling simulation.
Mathematics 14 01869 g002
Figure 3. Comparison of peeling behavior between theory and FEM results. (a) Dimensionless force ( F ¯ ) versus dimensionless peeling height ( H ¯ ) at 60°, 90°, and 120° peeling angles. (b) The thin film profiles at a representative moment during the steady-state stage at 60°, 90°, and 120° peeling angles, respectively. In both panels, (1)–(3) mark the moment when roughly half of the film has been peeled off.
Mathematics 14 01869 g003
Figure 4. Variations in dimensionless peeling force ( F ¯ ) and peak strain ( ε p ) with dimensionless peeling height ( H ¯ ) for 60°, 90° and 120° peeling angles ( θ F ). Blue and red curves represent ε p and F ¯ , respectively. Light, medium, and dark shades denote peeling angles of 60°, 90°, and 120°, respectively.
Mathematics 14 01869 g004
Figure 5. Peak strain ( ε p ) versus dimensionless peeling height ( H ¯ ) at 60°, 90°, and 120° peeling angles ( θ F ) for different (ac) thicknesses and (df) Young’s moduli of film.
Mathematics 14 01869 g005
Figure 6. Global maximum strain ( ε m ) as functions of dimensionless film thickness ( h / h 0 ) and Young’s modulus ( E / E 0 ) for different peeling angles ( θ F ).
Mathematics 14 01869 g006
Figure 7. (ac) Peak strain ( ε p ) versus dimensionless peeling height ( H ¯ ) for different dimensionless adhesion energies ( γ / γ 0 ) at peeling angles of 60°, 90°, and 120°. (d) Global maximum strain ( ε m ) during peeling versus dimensionless adhesion energy ( γ / γ 0 ) for different peeling angles.
Mathematics 14 01869 g007
Figure 8. Dimensionless global maximum strain ε m / ε s versus dimensionless film thickness ratio h / h 0 for different adhesion energies γ   =   0.5 γ 0 , γ 0 and 2 γ 0 at peeling angles of 60°.
Mathematics 14 01869 g008
Figure 9. Classification of strain response regimes. (a) Decision boundary η   =   0 in the feature space. Two-stage and three-stage samples are shown as red circles and blue squares, respectively. (b) Strain ratio z   =   ε m / ε s versus discriminant η. The vertical line at η = 0 separates two-stage ( η   >   0 ) and three-stage ( η   <   0 ) regimes.
Mathematics 14 01869 g009
Disclaimer/Publisher’s Note: The statements, opinions and data contained in all publications are solely those of the individual author(s) and contributor(s) and not of MDPI and/or the editor(s). MDPI and/or the editor(s) disclaim responsibility for any injury to people or property resulting from any ideas, methods, instructions or products referred to in the content.