1. Introduction
The current phase of industrial transformation is commonly associated with the transition towards Industry 4.0, understood as the increasing integration of digital technologies, interconnected production systems, and data-driven decision processes within industrial environments [
1,
2,
3,
4,
5,
6]. Although the concept is often linked to the German industrial agenda, its analytical relevance goes beyond its policy origin. Industry 4.0 describes a broader productive shift in which cyber-physical systems, connectivity, data exploitation, smart products, and intelligent coordination progressively reshape the internal logic of firms and the organisation of industrial activity [
2,
3,
4,
5,
6,
7].
In this sense, the present wave of industrial change may also be situated within a longer sequence of technological and productive transformations, from earlier industrial transitions to the digital and network-based reconfiguration of economic activity [
8,
9,
10,
11].
This broader perspective is useful because the current industrial environment is inseparable from the development of digital infrastructures and information networks. The expansion of the web, the progressive digitisation of information management, and the consolidation of data-intensive systems have altered not only communication processes but also the way firms organise knowledge, coordinate operations, and embed information into production and decision-making structures [
12,
13]. Within industrial settings, these changes have been reinforced by the rise of cyber-physical systems, the Internet of Things, big data, cloud computing, and data-driven maintenance and monitoring approaches, all of which have become central to the contemporary understanding of Industry 4.0 [
6,
14,
15,
16,
17,
18]. In the Spanish context, this transformation has also been linked to strategic concerns related to competitiveness, sustainability, and the capacity of firms to absorb technological enablers in an effective and coherent way [
19]. Recent evidence further shows that progress in this field remains territorially uneven, with marked regional differences in digital maturity and in the practical deployment of smart manufacturing strategies [
20].
From an economic perspective, the importance of this transformation lies in its potential effects on firm performance. Persistent productivity differentials across firms remain one of the central stylised facts of modern economies and explaining them requires identifying how technology is effectively incorporated into production rather than simply observing its nominal presence [
21]. This perspective is also consistent with earlier work showing that economic performance is not explained solely by visible productive resources but is also associated with hidden wealth linked to knowledge-based and intangible assets [
22]. In this sense, the productive implications of digital transformation should be interpreted within a broader framework in which technological adoption interacts with organisational capabilities, knowledge accumulation, and less visible sources of value creation.
The literature on innovation and productivity has consistently shown that both technological and non-technological innovation can improve firm performance, often through complementarities rather than isolated channels [
23]. In parallel, recent empirical evidence indicates that digital adoption is positively associated with firm-level productivity, with stronger effects in manufacturing and in routine-intensive activities [
24]. Other contributions have underlined the role of business strategies designed to cope with uncertainty under Industry 4.0 conditions, especially in sectors where digital transformation affects coordination, operational planning, and competitive behaviour [
18]. More generally, the expansion of big data, machine learning, and artificial intelligence has reinforced the relevance of quantitative and predictive approaches in industrial environments, from classification and learning techniques to reliability, maintenance, and industrial risk management [
15,
16,
17,
25,
26,
27,
28,
29]. Altogether, this literature suggests that digital transformation should not be reduced to the simple possession of advanced technologies but should instead be analysed as a structured process of implementation with potentially differentiated effects across firms.
Despite these advances, two limitations remain particularly relevant in the empirical literature on Industry 4.0 and productivity. Firstly, digitalisation and automation are often treated as closely related or even interchangeable manifestations of technological upgrading, although they may capture different mechanisms of productive change. Secondly, much of the available evidence focuses on national aggregates, broad sectoral patterns, or large firm environments, while less attention has been paid to regional SME settings in which technological adoption is more uneven, constrained by resources, and organisationally heterogeneous. This paper addresses this gap by distinguishing between digitalisation, automation, and firm maturity in a firm-level productivity model applied to SMEs in Castilla-La Mancha.
Within this framework, a key distinction must be made between digitalisation and automation. Automation is one of the most visible and frequently cited components of Industry 4.0, but its economic effects are not necessarily equivalent to those associated with digital transformation in a broader sense. A firm may automate isolated tasks without developing an integrated digitalisation process, just as it may strengthen digital capabilities through data use, strategic coordination, training, and organisational adaptation without reaching advanced levels of physical automation. Treating both dimensions as interchangeable may therefore conceal relevant differences in their relationship with productivity and may blur the interpretation of empirical results. This distinction is especially relevant in SMEs, where financial constraints, limited scale, and heterogeneous internal capabilities can affect both the pace and the form of technological adoption.
The Spanish case is particularly suitable for examining this problem because the progress of Industry 4.0 is territorially uneven, with regional differences in digital maturity and in the effective deployment of smart manufacturing strategies [
20]. Within this national context, Castilla-La Mancha provides a distinct empirical contribution rather than merely a regional application. Its productive structure is strongly characterised by SMEs and manufacturing firms, which makes it an appropriate setting for analysing digital transformation outside environments dominated by large companies or highly advanced industrial ecosystems. In such contexts, technological change is shaped by scale limitations, resource constraints, uneven internal capabilities, and different degrees of organisational readiness. For this reason, this Spanish region offers a useful empirical environment in which to examine whether labour productivity is more closely associated with effective technological implementation than with automation considered in isolation.
From an analytical perspective, firm-level labour productivity can be understood as a function of technological, organisational, and firm-specific factors, that is
where
denotes labour productivity for firm
,
captures technology-related factors,
reflects organisational capabilities, and
groups other structural characteristics affecting productive performance. Since the functional form
is not directly observable, the empirical analysis approximates this relationship through an econometric representation of the form:
where
denotes the vector of explanatory variables,
is the parameter vector to be estimated, and
is an idiosyncratic error term. This general formulation provides the analytical basis for the alternative specifications estimated in the empirical analysis.
Against this background, this study examines the relationship between innovation-oriented digitalisation and labour productivity in SMEs in Castilla-La Mancha within the Industry 4.0 framework. The empirical analysis combines primary survey information with firm-level accounting and financial data and estimates alternative cross-sectional specifications to compare the explanatory behaviour of digitalisation, automation, and maturity. The results show that digitalisation, particularly when proxied through indicators of effective technological adoption, maintains a positive and statistically robust association with productivity, whereas automation does not retain a stable effect across specifications. In addition, firm maturity is not significant in linear form, but its quadratic specification reveals a non-linear pattern consistent with cumulative learning and organisational consolidation. The study therefore contributes to the empirical literature by addressing a specific measurement and interpretation gap in the analysis of Industry 4.0 and productivity. Its analytical contribution lies in formalising Industry 4.0 transformation as a set of differentiated channels, rather than as a single technological adoption variable. It distinguishes digital transformation as an operative and implementation-based productivity factor from automation as only one possible component of that process. It also provides firm-level evidence from a regional SME and manufacturing environment, where the effects of digital adoption are especially relevant because technological upgrading does not necessarily follow the same pattern observed in large firms or more consolidated industrial ecosystems.
2. Materials and Methods
The empirical strategy combined a focused documentary review with a firm-level econometric analysis. The conceptual delimitation of Industry 4.0, digitalisation, automation, innovation, and productivity was informed by targeted searches in Scopus (Elsevier, Amsterdam, The Netherlands), ProQuest (Clarivate, London, UK), Google Scholar (Google LLC, Mountain View, CA, USA), and official institutional repositories. These searches were used to identify the main explanatory dimensions discussed in the literature and to support the operationalisation of the variables incorporated into the empirical model. The core of the study, however, was based on original firm-level information and on the estimation of alternative econometric specifications.
From a modelling perspective, the empirical specification is built on a distinction between three channels of Industry 4.0 transformation: effective technological implementation, digital predisposition, and internal automation. These dimensions are not treated as equivalent. Effective implementation refers to the realised adoption of specific technologies, digital predisposition captures organisational readiness through strategy and training, and automation reflects the presence of automated processes in production and engineering. The analytical contribution of the model therefore lies in separating implementation-based digitalisation from automation as different mechanisms potentially associated with labour productivity. Formally, firm-level labour productivity can be represented as a function of these differentiated channels:
where
denotes log labour productivity,
captures effective technological implementation,
denotes digital predisposition or readiness,
represents internal automation,
denotes firm maturity, and
groups other firm-specific factors not directly observed in the model. The empirical specification approximates this relationship by means of bounded indicators derived from the survey and firm-level accounting data. In this framework, the aggregate digitalisation indicator combines implementation and readiness, whereas automation remains a separate explanatory dimension.
The empirical dataset combined two sources. The first was a structured business survey administered by the
Industrial Technology Centre of Castilla-La Mancha (ITECAM) to firms located in Castilla-La Mancha. The questionnaire collected information on digitalisation, technological adoption, automation practices, innovation-related activities, organisational characteristics, and human resources. Fieldwork was conducted between January 2024 and March 2025. After data cleaning and the exclusion of non-sample records, the descriptive survey dataset comprised 141 firm-level responses. The unit of analysis was the individual firm, and each record was identified through its tax identification number, which made it possible to ensure internal traceability and to match survey responses with external accounting information. The second source was firm-level accounting and financial information obtained from
SABI (
Sistema de Análisis de Balances Ibéricos), a commercial database widely used for company-level financial information in Spain, for the 2023 financial year [
30].
The econometric analysis was based on the subset of firms for which the survey information could be consistently linked to SABI records and for which the variables required for estimation were available and comparable. After this matching process, the working sample was reduced from 141 to 123 firms. A further data quality check was then applied to the survey-based indicators used to construct the technological variables. As a result, four additional observations were excluded because they did not allow homogeneous and traceable coding of key derived variables related to digitalisation and automation. The final effective sample used in the main econometric estimations therefore comprised 119 firms. The empirical design was cross-sectional, with the firm as the unit of analysis.
The empirical analysis is based on a private business survey administered by ITECAM. The survey is not publicly available. General technical information on the survey source is summarised in
Appendix A. For reproducibility purposes, the article relies on an analytical dataset containing the variables effectively used in the estimations. Consequently, the reproducible material associated with the article is limited to the derived variables used in the model and to the transformation rules employed to construct them.
The dependent variable was the logarithm of labour productivity. For each firm
, labour productivity was computed as the ratio between operating revenue and the number of employees,
where
denotes operating revenue obtained from
SABI for 2023 and
denotes the number of employees declared by the firm in the survey. The logarithmic transformation was then applied,
to reduce asymmetry in the distribution and to facilitate interpretation within a regression framework.
The technological dimension of the model was operationalised in two complementary ways. The first captured effective technological implementation. It was constructed from the survey question asking whether the firm used Industry 4.0 technologies to improve production processes and from the associated open-ended field in which firms specified the technologies employed. Only explicit evidence of implementation was coded as effective adoption. Five binary implementation variables were constructed, corresponding to robots, sensors, machine vision, data analytics, and artificial intelligence.
Let
denote whether firm
implemented technology family
. The implementation-based sub-index was defined as follows:
where the weights
were proportional to the observed implementation frequencies in the analytical sample. The resulting indicator was bounded between 0 and 1 and reflected the relative intensity of effective technological implementation. The weights used in this sub-index were defined from the observed implementation frequencies in the analytical sample. Formally, if
denotes the number of firms that implemented technology family
, the weight assigned to that technology was defined as
. This criterion was adopted because all the underlying variables were binary and referred to effective adoption. The weighting scheme therefore reflects the empirical structure of implemented technologies in the sample and avoids imposing external weights that could not be directly derived from the survey instrument. Alternative codings were explored during the construction of the variables, including equal weighting and more disaggregated response-based scores. However, these alternatives did not provide a clearer empirical or interpretative advantage. The final specification was retained because it was more transparent, reproducible, and directly linked to the information effectively observed in the questionnaire.
The second technological dimension captured digital predisposition or enabling readiness. It was based on two survey items: the existence of a cross-cutting digitalisation strategy and the implementation of training actions aimed at preparing workers for new technologies. Two binary variables were defined from these items, one for strategy and one for training. The digital predisposition sub-index was then constructed as follows:
where the weights were proportional to the frequency of affirmative responses in the sample. Both sub-indices were normalised on the [0, 1] interval. The predisposition sub-index followed the same logic of traceability. It was restricted to two dimensions that could be identified consistently in the survey, namely the existence of a digitalisation strategy and the implementation of training actions aimed at preparing workers for new technologies. Other possible response categories were reviewed during the coding stage, but only those that provided clear and homogeneous evidence across firms were retained. This decision reduced ambiguity in the construction of the indicator and ensured comparability within the estimation sample.
To synthesise both dimensions into a single firm-level measure of digitalisation, a composite indicator was defined as the simple average of the implementation and predisposition sub-indices:
This specification ensured that neither effective implementation nor enabling readiness dominated the indicator by construction. The aggregate digitalisation indicator was constructed as the simple average of the implementation and predisposition sub-indices. This choice was made for mathematical and substantive reasons. Both components were normalised on the same interval, [0, 1], so the simple average preserved the scale of the indicator and avoided an artificial dominance of one dimension over the other. From a substantive perspective, the aim was to represent digitalisation as a combined process involving both actual technological implementation and enabling organisational readiness. During the construction of the empirical dataset, alternative weighting schemes were considered, but they did not improve the interpretability or stability of the resulting measure. For this reason, the parsimonious specification was retained. In addition, the robustness analysis later replaces the aggregate indicator with the implementation sub-index to examine whether the main result depends on the broader composite measure.
Automation was treated as a distinct explanatory dimension. It was built from two survey questions referring to the existence of automation in productive processes and in engineering-related processes. From these items, two binary variables were defined
), which took the value 1 when the firm reported effective automation in production processes, and
, which took the value 1 when the firm reported effective automation in engineering-related processes. Responses expressing interest or future intention were coded as 0 because they did not reflect implemented automation. An integrated automation indicator was then constructed as follows:
so that the variable took the value 0 when no automation was present, 0.5 when automation was observed in only one of the two domains, and 1 when both forms of automation were simultaneously present. The automation indicator was also constructed as a simple average because the two underlying dimensions captured complementary domains of internal automation, namely productive processes and engineering processes. Since both variables were binary, the resulting indicator has a direct interpretation. It takes the value 0 when no automation is observed, 0.5 when automation appears in only one domain, and 1 when both domains are simultaneously present. More complex weighting schemes were considered during the coding process, but they did not provide a more robust or clearer measure given the available survey information. The final coding was therefore selected because it preserved the structure of the questionnaire, minimised discretionary assumptions, and allowed the automation variable to be compared with the digitalisation indicators in a transparent way.
Firm maturity was incorporated as a control variable to capture structural differences related to accumulated experience, organisational learning, and business trajectory. For each firm
, maturity was proxied by firm age, computed from the year of incorporation recorded in
SABI. In general form:
where 2026 is the reference year adopted in the empirical dataset. Since the effect of age on productivity may not be linear, the quadratic term
was also considered in the empirical specifications. The squared maturity term was introduced to capture the possibility that firm age is not proportionally associated with productivity across all firms. In SME contexts, accumulated experience, organisational routines, and learning effects may become more relevant after a certain degree of consolidation, whereas a simple linear age term may not capture this pattern. The quadratic specification is therefore interpreted as a restricted test of accumulation related to maturity, not as a complete model of the firm life cycle.
In addition to these variables, all reported estimations incorporated a binary control for atypical observations. This variable was introduced after the exploratory analysis of the dependent variable and the initial regression diagnostics identified a small group of firms with unusually high labour productivity and visible influence on the estimated coefficients. The atypical observation control takes the value 1 for five firms and 0 otherwise. These cases were not removed from the main estimation sample because they corresponded to valid firm records and did not result from coding, matching, or data entry errors. The purpose of the control was therefore not to exclude observations, but to isolate their specific effect while preserving the information contained in the full estimation sample. This decision improved coefficient stability and interpretability without artificially reducing the dataset.
The empirical strategy was based on a family of alternative cross-sectional specifications. The baseline linear formulation can be expressed as follows:
where
denotes the logarithm of labour productivity,
is the composite digitalisation indicator,
is the automation indicator,
is firm maturity,
is the control for atypical observations, and
is an idiosyncratic error term. More parsimonious linear variants were obtained by excluding regressors that did not improve explanatory performance.
To evaluate whether maturity operated through a non-linear relationship and whether the results were sensitive to the measurement of digitalisation, an alternative specification was also estimated in the form:
where
denotes the digitalisation measure adopted in each specification, represented by the aggregate index
in the first non-linear model and by the implementation-based indicator
in the final robustness exercise. This formulation therefore provided the analytical basis for the non-linear and measurement robustness estimations reported in
Section 3.
The parameters were estimated by ordinary least squares using ordinary least squares and a White heteroskedasticity-consistent covariance matrix. The sequence of models was designed to move from a broader baseline specification to more parsimonious and alternative formulations, allowing the contribution of each explanatory dimension to be evaluated progressively. Special attention was paid to the sign, statistical significance, and robustness of the coefficients associated with digitalisation, automation, and maturity. Preliminary data processing, recoding, and indicator construction were carried out using spreadsheet-based procedures, whereas econometric estimation was implemented in EViews 7 (Quantitative Micro Software, LLC, Irvine, CA, USA).
The empirical model relies on the standard assumptions of cross-sectional linear regression, including linearity in parameters, absence of perfect multicollinearity, finite error variance, and a correctly specified conditional relationship between the dependent variable and the regressors. Given the observational and cross-sectional nature of the data, the estimated coefficients are interpreted as conditional associations rather than causal effects. The main variables are based on observable proxies. Labour productivity is proxied by operating revenue per employee, digitalisation by indicators of implementation and predisposition derived from the survey, automation by reported automation in productive and engineering processes, and maturity by firm age. These proxies are traceable to the survey and SABI data, but they approximate broader theoretical concepts. Therefore, the interpretation of the results remains bounded by the measurement structure of the dataset.
3. Results
This section presents the empirical results of the study. It begins with a concise descriptive overview of the survey evidence, aimed at characterising the firms analysed and contextualising the construction of the explanatory variables. It then reports the econometric estimates for labour productivity and, finally, examines the robustness of the results across alternative specifications, including the non-linear treatment of firm maturity.
3.1. Descriptive Evidence
Unless otherwise indicated, the descriptive evidence reported in this section refers to the 141 valid firm-level survey responses. The econometric estimations presented in the following subsections are based on the matched and cleaned estimation sample described in
Section 2. This descriptive overview serves two purposes. Firstly, it provides a compact empirical profile of the firms covered by the survey. Secondly, it contextualises the construction of the technological indicators used in the productivity models.
Table 1 summarises both the sample structure and the successive sample selection stages.
The survey evidence shows a marked concentration in SMEs and manufacturing activities. By province, the largest share of observations corresponds to Ciudad Real, with 70 firms (49.65%), followed by Albacete with 30 (21.28%), Cuenca with 23 (16.31%), and Toledo with 18 (12.77%), while no observations were recorded for Guadalajara. Since the study is regional in scope and is not designed as a provincially balanced survey, the absence of observations from Guadalajara does not alter the regional focus of the empirical analysis, although it requires caution in any province-specific interpretation.
By firm size, small firms predominate, with 74 observations (52.48%), followed by micro firms with 42 (29.79%), medium-sized firms with 24 (17.02%), and only one large firm (0.71%). The sectoral composition is strongly dominated by manufacturing, which accounts for 108 firms (76.60%) of the total sample. Trade appears in second place with 16 firms (11.35%) and construction with nine (6.38%), whereas the remaining sectors have only a marginal presence. This structure is consistent with the productive profile targeted by the survey and confirms that the empirical analysis is primarily anchored in SME and manufacturing environments.
The descriptive indicators also point to an intermediate level of organisational formalisation and technological development. Defined and documented production processes were reported by 78 firms (55.32%), while 63 firms (44.68%) did not report this feature. Productive process automation was declared by 62 firms (43.97%), compared with 79 (56.03%) that reported no automation. Industrial design tasks were present in 79 firms (56.03%) and absent in 62 (43.97%). In addition, 71 firms (50.35%) reported that they needed to consult technical standards to manufacture, whereas 69 (48.94%) did not, and one observation fell into the “do not know” category. Taken together, these figures describe a productive environment in transition, where a substantial share of firms already displays organisational and technical capabilities, but where a substantial proportion still operates without a consolidated pattern of formalisation or automation.
The evidence on Industry 4.0 technologies is particularly informative for the construction of the digitalisation variables used in the econometric analysis. In the original survey responses, 32 firms (22.70%) declared effective use of Industry 4.0 technologies, 60 (42.55%) declared no use, 42 (29.79%) reported that they did not use such technologies but would like to do so, and seven (4.96%) did not answer the question. When this information is recoded in binary form to capture effective implementation only, 32 firms are classified as users and 109 as non-users.
This shows that confirmed adoption remains a minority pattern in the regional sample, although the sizeable proportion of firms expressing interest in adoption also indicates a relevant latent demand for technological upgrading.
Table 2 reports the main descriptive indicators related to organisational formalisation, automation, and Industry 4.0 adoption.
Overall, the descriptive evidence supports the empirical relevance of the modelling strategy adopted in this study. The sample is dominated by SMEs operating in a predominantly manufacturing environment, the effective implementation of Industry 4.0 technologies remains limited but non-negligible, and the observed variation in formalisation, automation, and technological adoption provides sufficient heterogeneity to justify the alternative econometric specifications reported in the following subsections.
3.2. Econometric Results
Since the empirical design is cross-sectional, the estimated coefficients are interpreted as conditional associations rather than causal effects. Accordingly, the percentage interpretations derived from the logarithmic specification should be read as expected differences in labour productivity associated with changes in the explanatory variables, holding the remaining regressors constant. They should not be interpreted as causal impacts.
Table 3 reports the main linear specifications for labour productivity. All models were estimated by ordinary least squares with
White heteroskedasticity-consistent standard errors and were based on the same effective sample of 119 firms. The sequence moves from a broader baseline specification to more parsimonious formulations to assess whether the association between digitalisation and labour productivity remains stable as statistically uninformative regressors are excluded. The differences between Models 1 to 3 correspond to a nested sequence of linear specifications. Model 1 is the baseline model and includes digitalisation, automation, linear maturity, and the atypical observation control. Model 2 removes the automation indicator, while Model 3 further removes the linear maturity term. This sequence allows the stability of the digitalisation coefficient to be assessed as non-informative regressors are progressively excluded. In this way, the section evaluates the behaviour of the aggregate digitalisation indicator (
), the automation variable (
), firm maturity in linear form (
), and the control for atypical observations (
).
Model 1 constitutes the baseline linear specification. It includes the aggregate digitalisation indicator, the integrated automation measure, firm maturity, and the atypical observation control. The model is jointly significant, with and , and yields a moderate explanatory fit . Within this specification, the coefficient associated with digitalisation is positive and reaches marginal significance . Since the dependent variable is expressed in logarithms and is bounded between 0 and 1, the coefficient can be interpreted as a semi-elasticity.
More specifically, a 0.1-point higher value of DIG is associated with an expected difference in labour productivity of approximately , that is, about 7.30%, ceteris paribus. By contrast, the automation indicator is positive but not statistically significant (, which implies that, in this baseline formulation, automation does not explain productivity differentials with the required statistical precision. Firm maturity also displays a small positive coefficient , but remains clearly insignificant . The control for atypical observations is positive and highly significant , confirming that the dimension captured by this variable is strongly associated with the observed heterogeneity in productivity.
Model 2 removes the automation variable, as its contribution in Model 1 is neither statistically significant nor substantively informative. The resulting specification remains jointly significant , while the explanatory fit remains practically unchanged . Moreover, the information criteria improve slightly relative to Model 1, which supports the parsimonious reformulation. The most important change concerns the digitalisation coefficient, which becomes more precisely estimated and clearly significant .
Interpreted in the same way as above, a 0.1-point higher value of DIG is associated with an expected productivity difference of approximately 9.0%. This result suggests that part of the uncertainty affecting the digitalisation coefficient in Model 1 may be linked to the simultaneous inclusion of , whose explanatory content does not appear to be robust in the sample. The linear maturity term remains positive but non-significant , whereas the atypical observation control continues to display a strong and highly significant positive coefficient .
To complement the interpretation of the coefficients in original units,
Table 4 reports the standardised coefficients and elasticities at means for Model 2. In relative terms,
shows the largest standardised coefficient
, clearly above
and
. This indicates that, within this specification, the variation in labour productivity is more strongly aligned with the dimension captured by
than with firm maturity, while digitalisation still retains a relevant positive contribution. By contrast, the comparatively low relative weight of
is consistent with its lack of statistical significance in linear form.
Model 3 provides a further parsimonious reduction by excluding firm maturity in linear form. The model remains jointly significant , and the goodness of fit remains very similar to that of the previous specifications . Most importantly, the coefficient on digitalisation remains positive and statistically significant , confirming the stability of the main result. In this specification, a 0.1-point higher value of DIG is associated with an expected productivity difference of approximately 8.90%. The magnitude of the coefficient is therefore very close to that obtained in Model 2, which reinforces the interpretation that digitalisation retains explanatory power even after simplifying the linear formulation. The control remains positive and highly significant , again pointing to a strong productivity differential associated with the atypical cases identified during the exploratory stage.
Table 5 complements this interpretation by reporting the standardised coefficients and elasticities at means for Model 3. The relative pattern remains stable. The standardised coefficient of
continues to exceed that of
, which confirms that the atypical observation control captures an important share of the productivity heterogeneity in the sample. At the same time, the persistence of a positive and significant coefficient for
confirms that digitalisation remains the only technological variable with a stable explanatory role across the linear sequence.
Taken together, Models 1, 2 and 3 display a coherent pattern. Firstly, digitalisation is the only technological variable that retains a positive and statistically meaningful association with labour productivity throughout the linear sequence, and its coefficient becomes more precisely estimated as the model is simplified. Secondly, the automation indicator does not show a stable contribution in the baseline specification and is therefore not retained in the more parsimonious formulations. Thirdly, firm maturity, when introduced in linear form, does not provide robust explanatory content.
These results justify moving beyond the purely linear baseline and motivate the robustness exercises reported in the following subsection, where attention shifts to the non-linear treatment of maturity and to an alternative, implementation-based measure of digitalisation.
3.3. Robustness and Non-Linear Specification
Table 6 reports the robustness exercises centred on the non-linear treatment of firm maturity and on an alternative measurement of digitalisation. All specifications were estimated by ordinary least squares with
White heteroskedasticity-consistent standard errors and were based on the same effective sample of 119 firms. The purpose of this subsection is twofold.
Firstly, it evaluates whether the role of firm maturity becomes more informative once a non-linear form is allowed. This treatment follows the interpretation of firm maturity as a cumulative process linked to experience, learning, and organisational consolidation, rather than as a purely proportional age effect. Secondly, it examines whether the positive association between digitalisation and labour productivity remains stable when digitalisation is measured through its implementation-based component rather than through the aggregate indicator.
Model 4 introduces a non-linear treatment of maturity by replacing the linear age term with its quadratic form, while retaining the aggregate digitalisation indicator and the atypical observation control. The model remains jointly significant, with and , and slightly improves the overall fit relative to the previous linear specifications .
The coefficient associated with digitalisation remains positive and statistically significant , confirming that the main productivity result is stable even when the maturity term is specified in non-linear form. Interpreted as a semi-elasticity, a 0.1-point higher value of is associated with an increase of approximately , that is, about 8.7%, ceteris paribus. The coefficient of also remains positive and highly significant .
By contrast, the quadratic maturity term is positive but not statistically significant at conventional levels . This implies that, under the aggregate digitalisation measure, the data do not provide sufficiently strong evidence of a robust non-linear relationship between firm age and productivity.
Model 5 constitutes a further robustness exercise in which the aggregate digitalisation indicator is replaced by its implementation-based component, , while the non-linear maturity term and the atypical observation control are retained. This specification also serves as a measurement sensitivity check, since it tests whether the main result depends on the aggregate digitalisation index or remains stable when only the effective implementation component is used.
The model is again jointly significant and shows a slight improvement in fit relative to Model 4 . The most relevant result is that the implementation-based digitalisation measure remains positive and statistically significant .
Given that
) is also normalised on the [0, 1] interval, a 0.1-point higher value of this variable is associated with an expected productivity difference of approximately
, that is, about 12.40%, holding the remaining regressors constant. This coefficient is larger than the one obtained for the aggregate digitalisation indicator, which suggests that the implementation-oriented component provides a sharper empirical signal in relation to productivity. The coefficient of
remains positive and highly significant
, while the quadratic maturity term is again positive and now reaches marginal significance
.
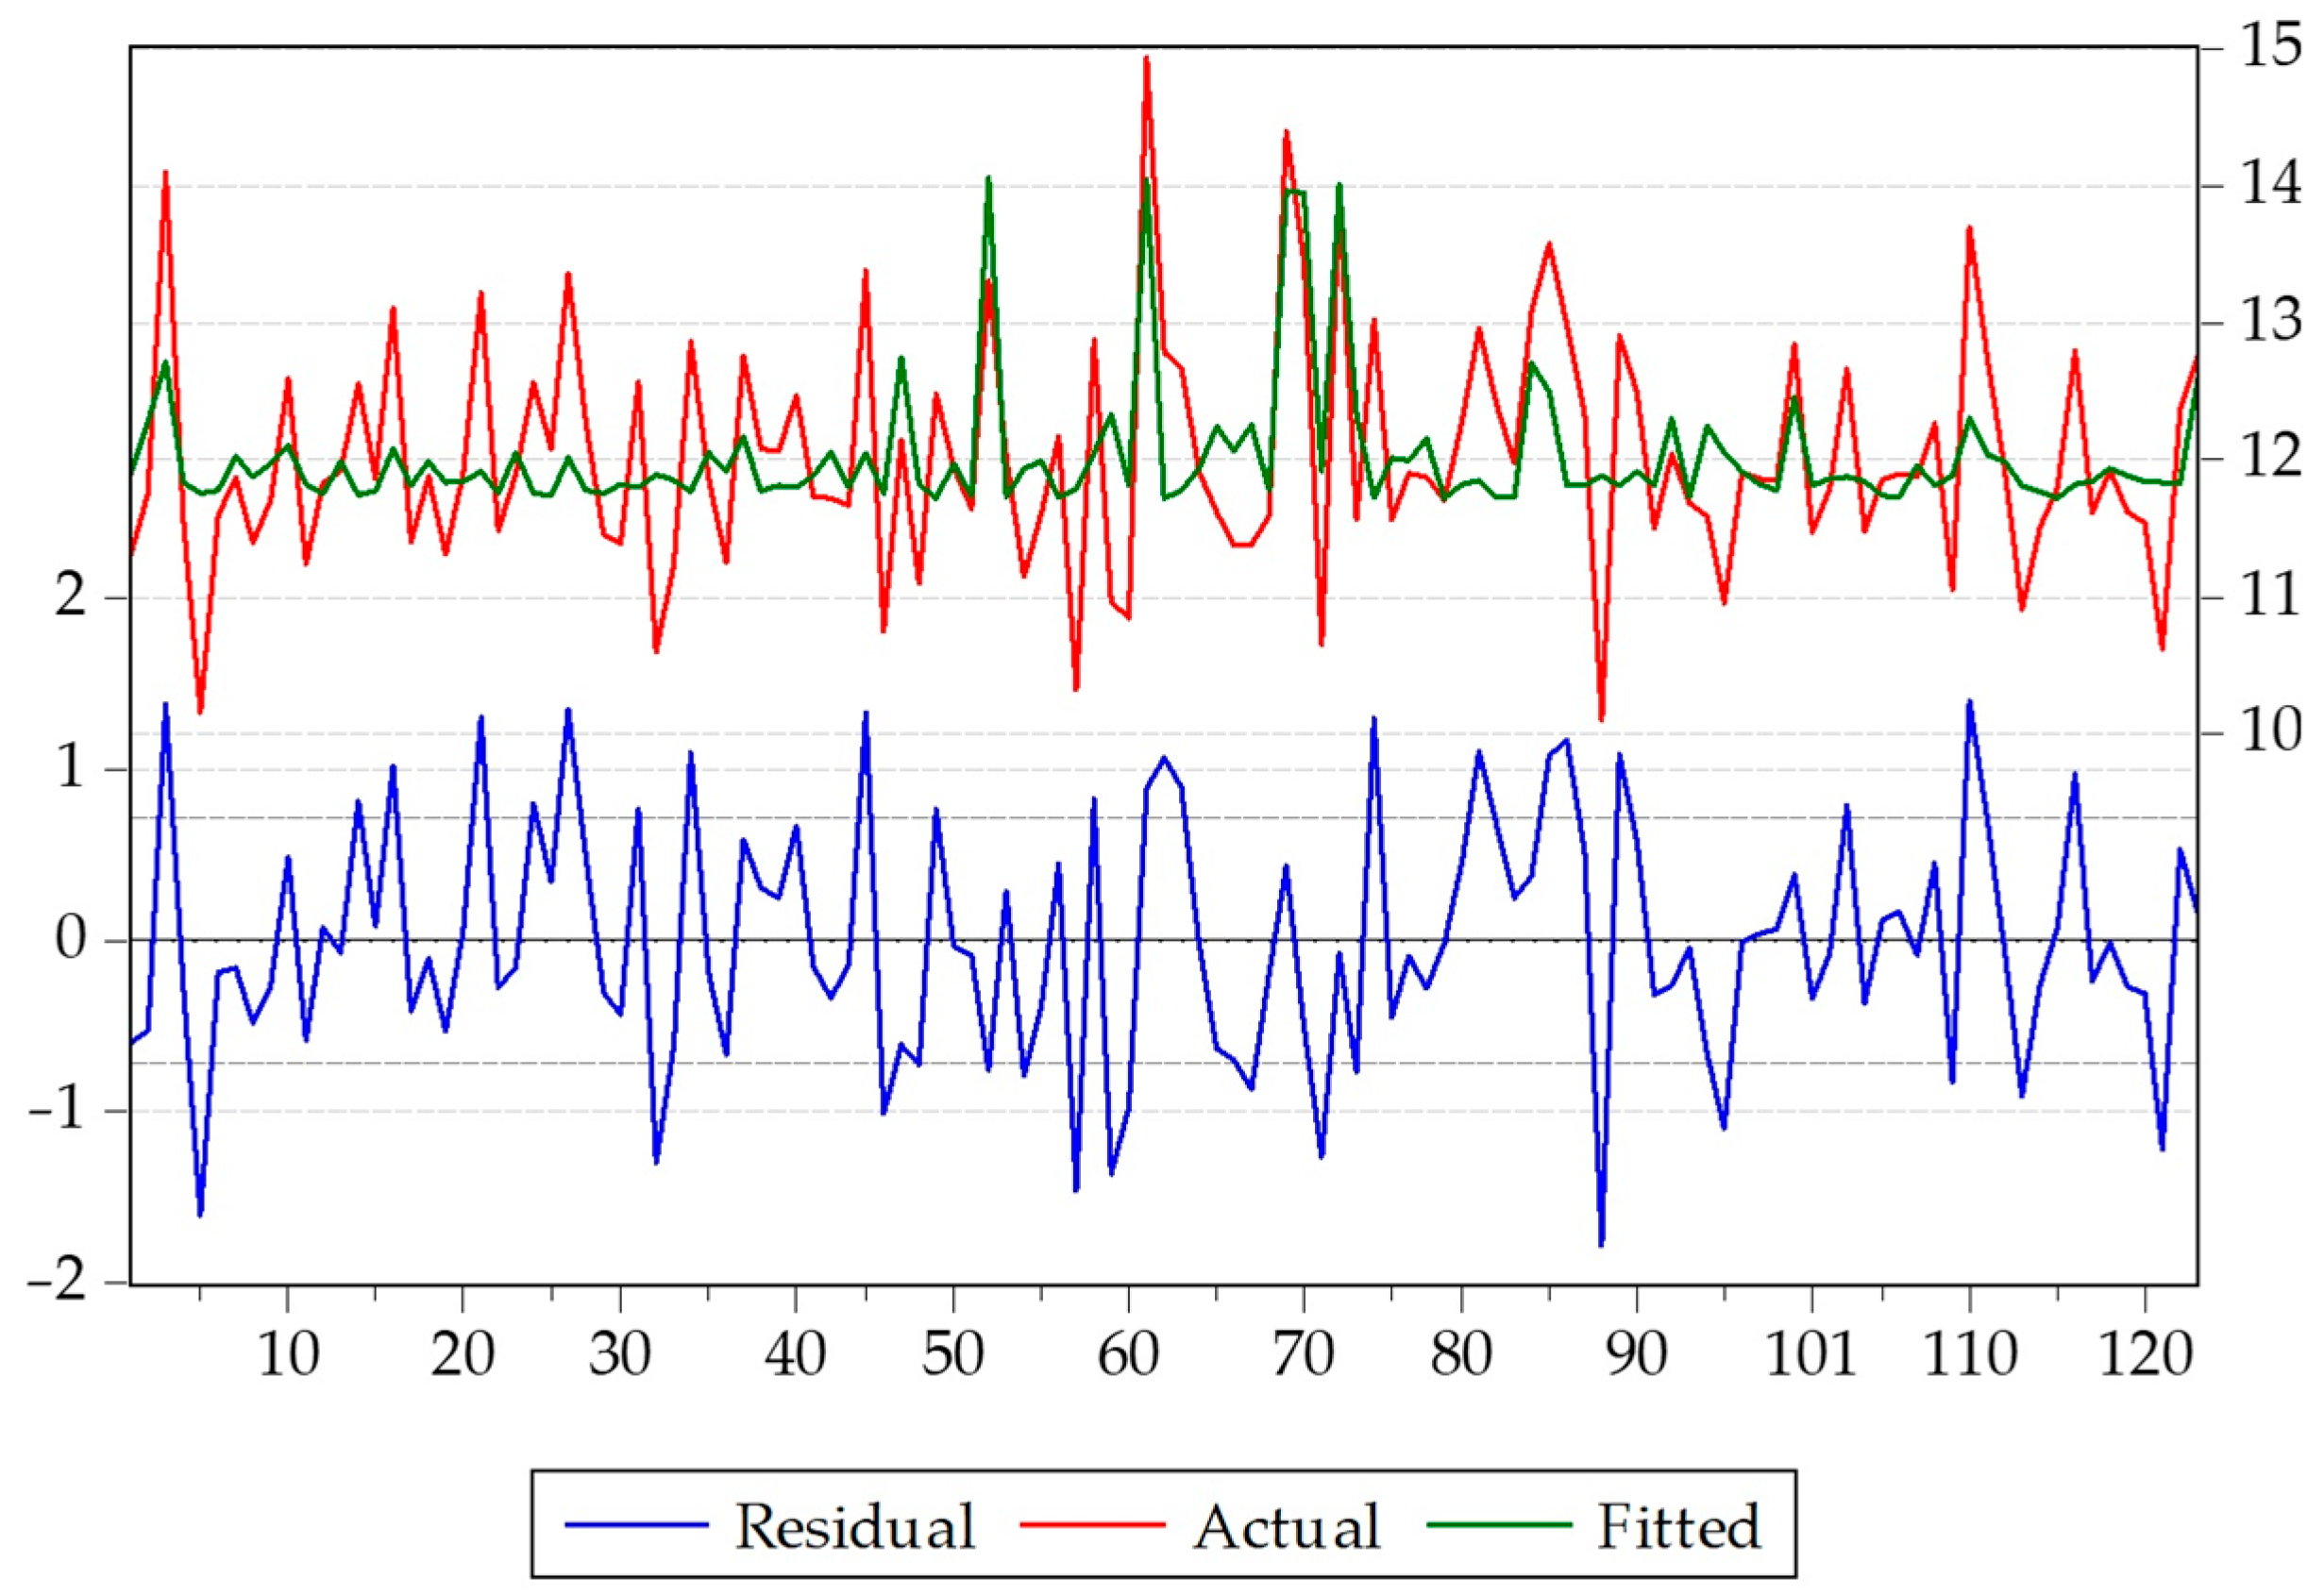
Figure 1 provides a visual summary of Model 5 by comparing the actual and fitted values of labour productivity together with the associated residuals.
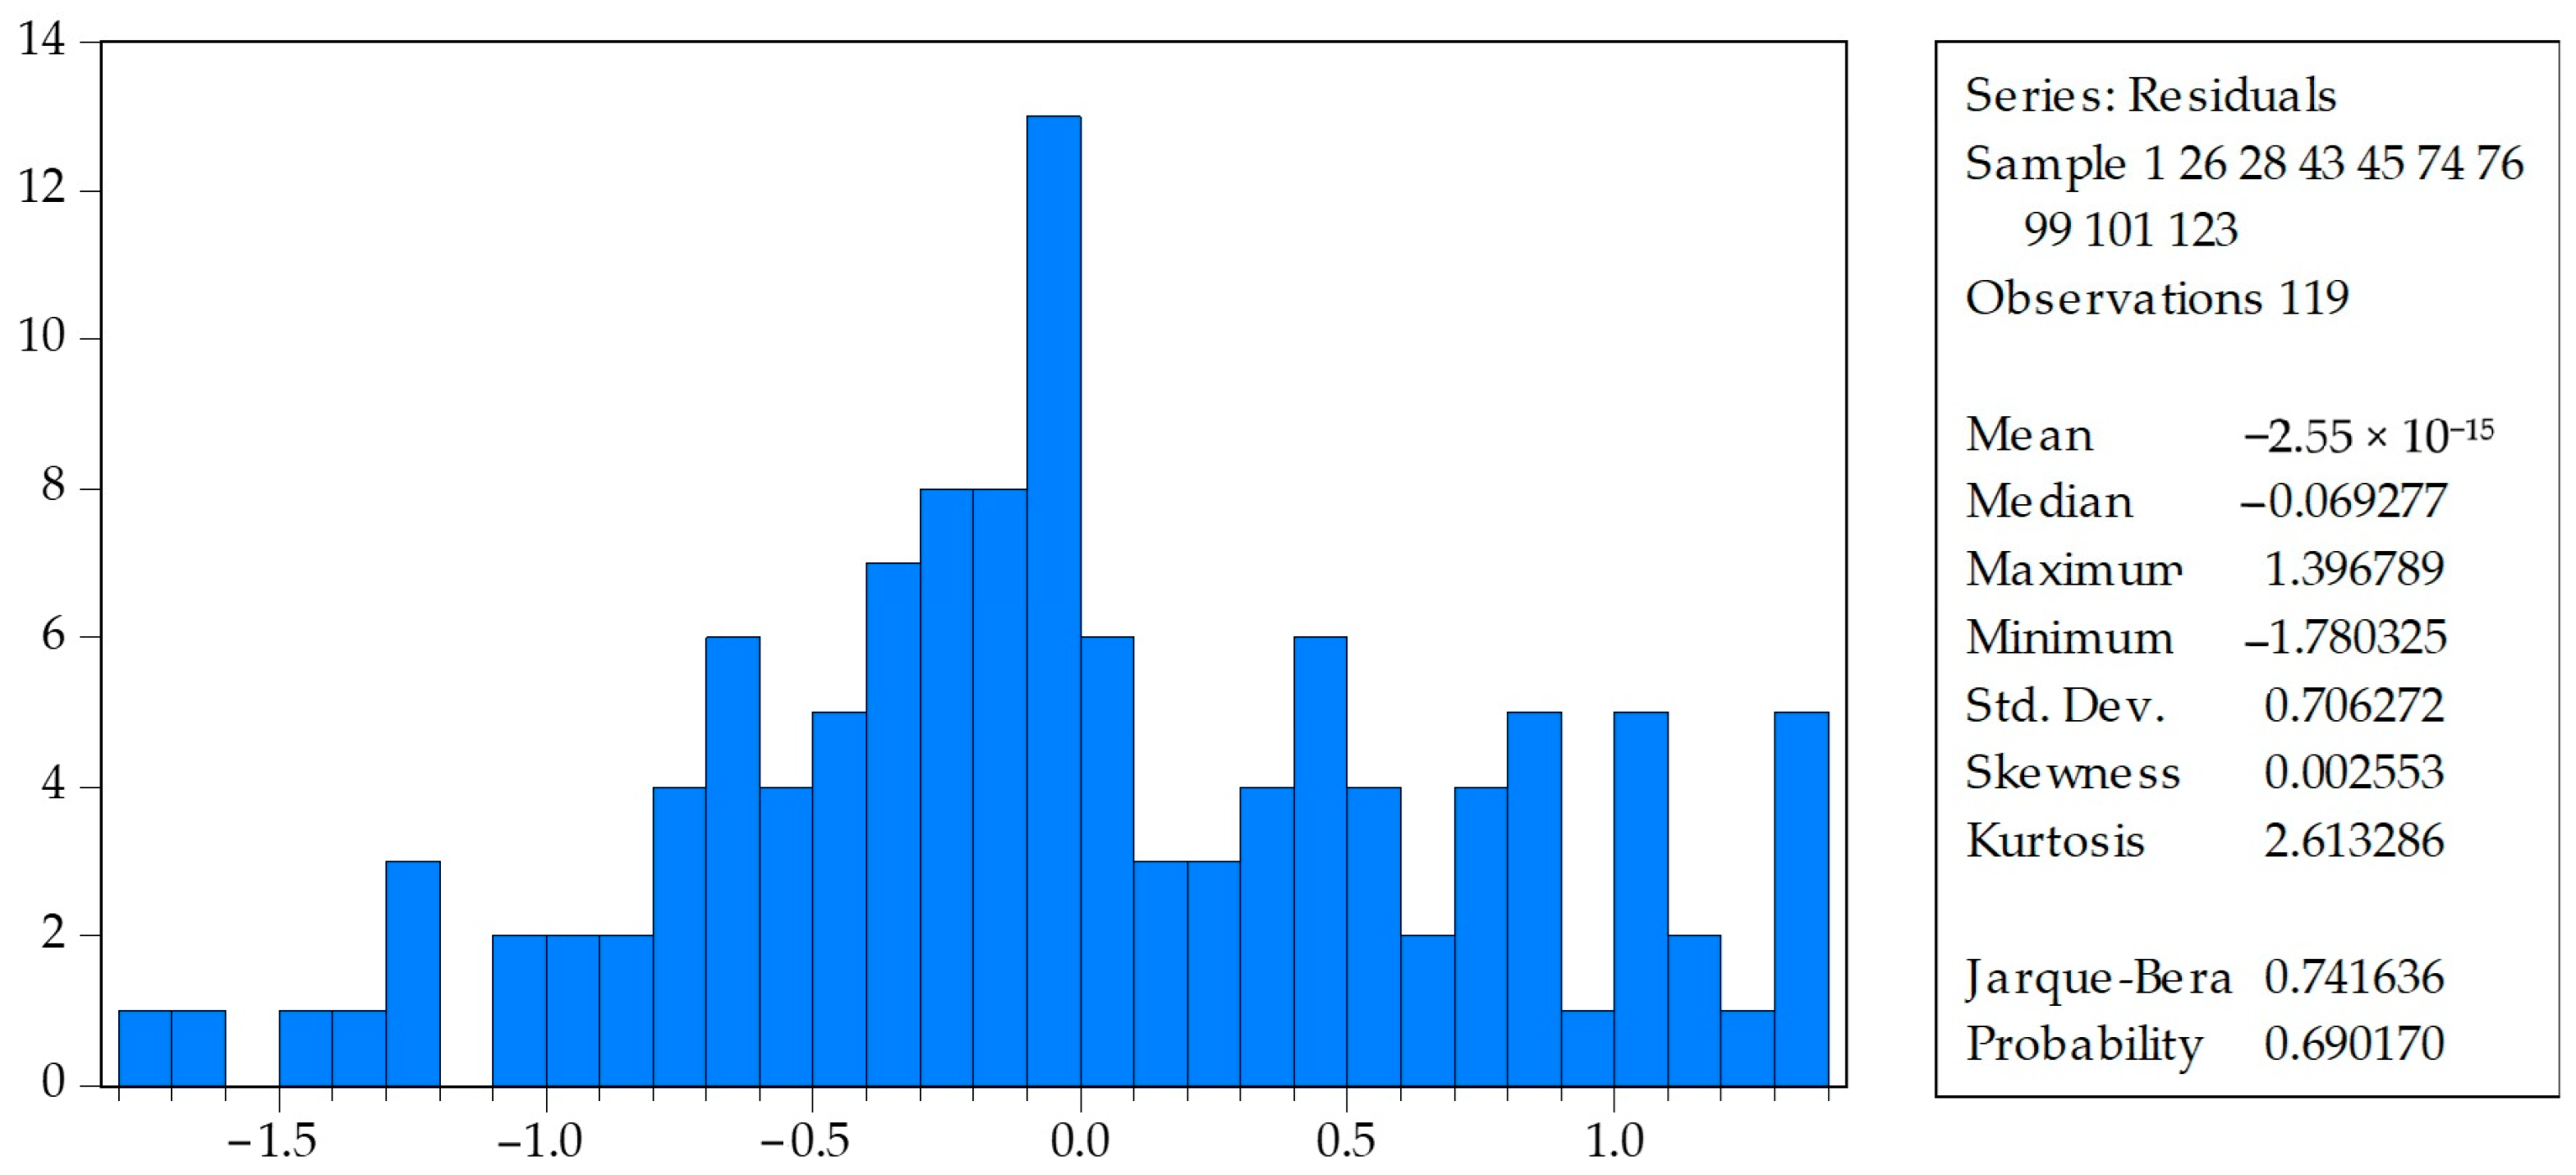
To complement the visual assessment of Model 5,
Figure 2 reports the distribution of the residuals. The Jarque-Bera test does not reject normality at conventional significance levels
, which indicates that the residual distribution does not show a severe departure from normality.
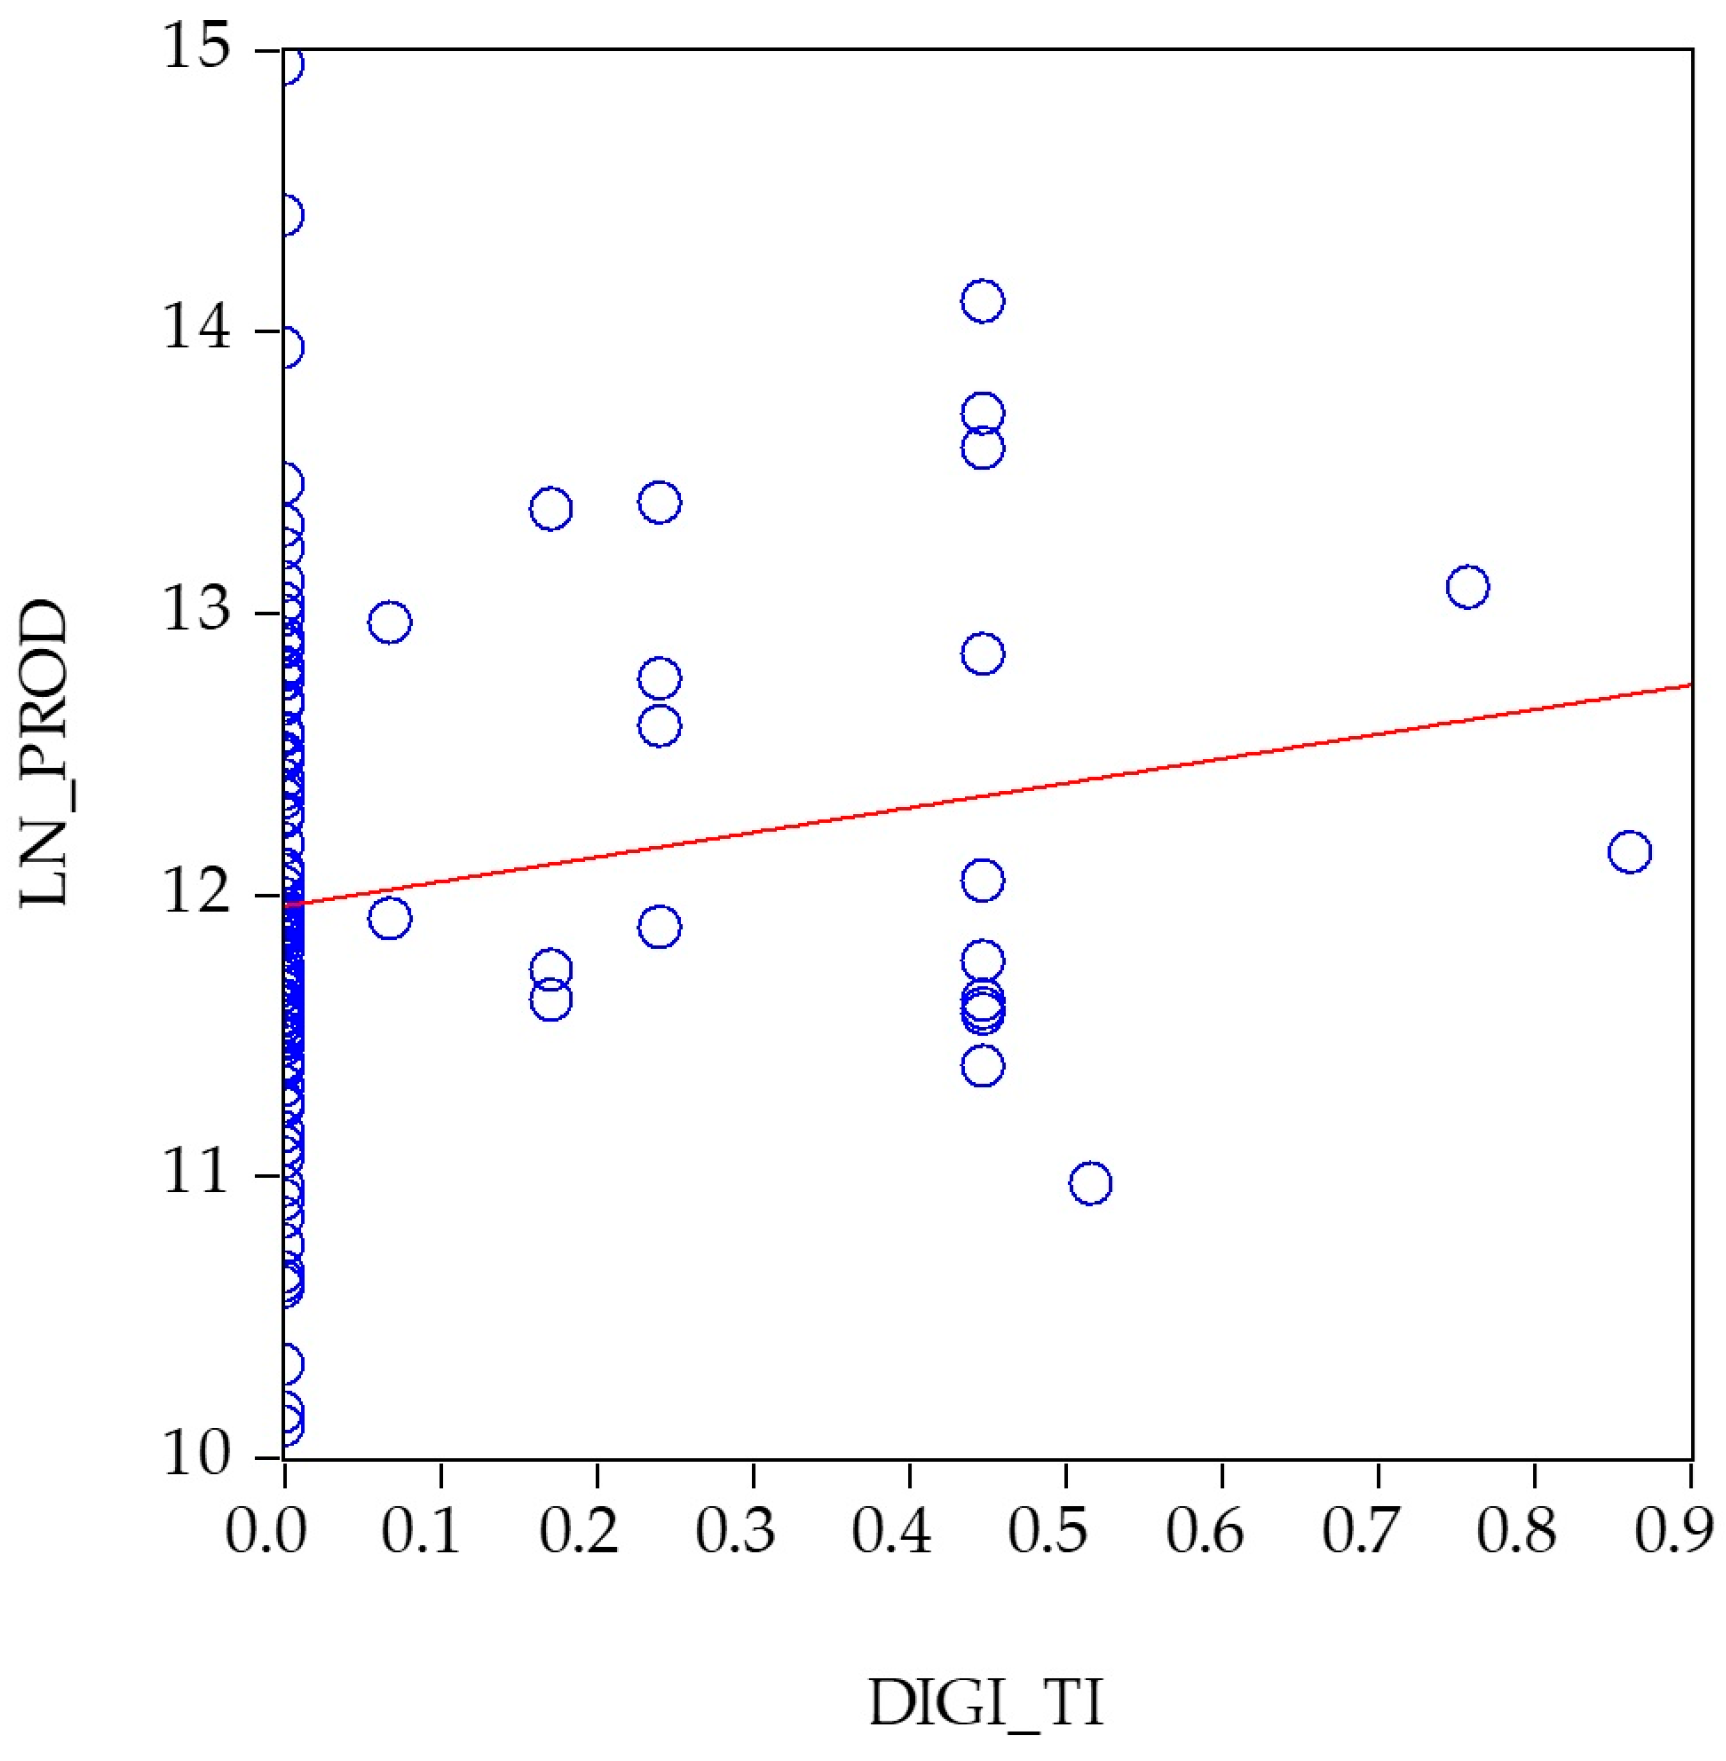
Figure 3 complements the residual diagnosis by showing the relationship between labour productivity and the implementation-based digitalisation indicator. Since this indicator is constructed from binary implementation variables, observations are concentrated around a limited number of values on the horizontal axis. The scatterplot and fitted regression line provide a visual representation of the positive association identified in Model 5 between effective technological implementation and labour productivity. The fitted line is included only as a visual aid, while the multivariate econometric result is reported in Model 5.
As an additional robustness check, Model 5 was estimated again after excluding the five firms identified as atypical observations. The restricted sample therefore included 114 firms. The results remained consistent with the main interpretation of the paper. The implementation-based digitalisation measure remained positive and statistically significant , while the quadratic maturity term remained positive and marginally significant . The model was also jointly significant . This confirms that the positive association between effective technological implementation and labour productivity is not driven by the atypical observations included in the main specifications.
Taken together, Models 4 and 5 refine the interpretation of the earlier results. Firstly, the positive relationship between digitalisation and labour productivity remains stable when firm maturity is treated non-linearly.
Secondly, the use of an implementation-based measure of digitalisation yields a more clearly estimated and larger coefficient than the aggregate indicator, which is consistent with the broader interpretation advanced throughout the paper: productivity differences are more closely linked to effective technological implementation than to broader or more declarative dimensions of digital readiness.
Thirdly, the maturity variable does not appear to exert a robust linear effect, but its quadratic formulation points to a more nuanced pattern. In particular, the positive and marginally significant coefficient obtained in Model 5 suggests that the role of firm age may become more relevant when digitalisation is measured through actual technological implementation rather than through a broader composite indicator. This does not provide definitive evidence of a strong non-linear maturity effect, but it does indicate that the relationship may be more complex than a simple linear formulation would suggest.
Overall, the robustness exercises strengthen the main empirical conclusion of the study. The positive association between digitalisation and labour productivity does not disappear when the specification is modified, and it becomes more clearly identifiable when digitalisation is approximated through a measure that is more directly linked to technological implementation. By contrast, automation does not display a stable effect in the linear baseline sequence, and firm maturity only becomes weakly informative when a non-linear formulation is allowed. This pattern is consistent with a productive environment in which effective digital transformation already differentiates firms in terms of productivity, whereas other dimensions still display a less consolidated or more gradual influence.
4. Discussion
The empirical results identify a clear pattern for the firms analysed in Castilla-La Mancha. Digitalisation is positively associated with labour productivity, and this relationship becomes stronger when digitalisation is measured through variables that capture effective technological implementation. This is the central result of the study. In the linear specifications, the aggregate digitalisation indicator remains positive and gains precision as the model is simplified. In the robustness exercise, the implementation-based measure delivers a larger and more significant coefficient. The productive relevance of digital transformation in the sample therefore lies in the effective incorporation of technology into business operations.
This result defines what digital transformation means in this empirical setting. Not all broad or declarative dimensions of digital readiness have the same explanatory content. The dimensions directly linked to actual implementation are the ones that differentiate productivity levels across firms. The descriptive evidence already showed that confirmed adoption of Industry 4.0 technologies is limited in the sample, whereas broader enabling conditions are more widespread. The productivity differential therefore comes from implementation rather than from general technological disposition.
Automation does not show the same empirical behaviour. Although the coefficient of is positive in the baseline model, it is not statistically significant and does not remain in the more parsimonious linear specifications. In this sample and with the available measure, automation does not operate as a robust differentiating factor of labour productivity once digitalisation and the atypical-observation control are considered. The survey evidence already showed that productive-process automation is present in a relevant but still minority share of firms and that its deployment is uneven across the sample. Under these conditions, automation does not generate a stable independent coefficient.
The results for firm maturity also follow a clear pattern. When introduced in linear form, the age of the firm does not explain productivity differences. Age, by itself, is not a direct determinant of performance in the estimated models. However, the non-linear specifications provide a different result. The quadratic maturity term is positive in both Model 4 and Model 5 and reaches marginal significance when digitalisation is measured through the implementation-based indicator. The role of maturity therefore operates through accumulated learning, organisational consolidation, and the capacity to transform experience into productive routines rather than through a simple linear age effect. Older firms are not more productive because they are older. They perform better when accumulated experience is translated into technology absorption and organisational use.
Another relevant result is the persistent role of the atypical observation control. The variable is positive and highly significant in all reported specifications, and its relative weight is also large in the standardised coefficient comparisons. From a methodological point of view, this validates the decision to retain these observations through a specific control, since it preserves the sample while isolating highly influential cases. From a substantive point of view, the result shows that part of the heterogeneity in labour productivity is associated with dimensions not fully captured by the observed technological and structural variables. The estimated relationships therefore explain an important part of the productivity structure of the sample, but not its full complexity.
The explanatory power of the models must be interpreted in accordance with the nature of the data and the objective of the empirical analysis. The study is based on a cross-sectional sample of firms and does not seek to build a predictive model of labour productivity. Its purpose is to examine whether different dimensions of Industry 4.0 are conditionally associated with productivity in a regional SME sample. In this type of firm data, productivity is affected by many managerial, organisational, market, financial, and technological factors that are not fully observed in the available dataset. Therefore, moderate values are not unusual and do not invalidate the empirical contribution, provided that the specifications are theoretically grounded, jointly significant, and the main coefficients remain stable across alternative models. The robustness checks reported in the paper, including the specification based on effective implementation, the residual diagnosis, and the exclusion of atypical observations, support the consistency of the main result.
Taken as a whole, the results describe a productive environment in transition. The sample is dominated by SMEs operating in a predominantly manufacturing setting, and the descriptive evidence already identified an intermediate position in terms of formalisation, automation, and Industry 4.0 implementation. The econometric evidence confirms that profile. Digitalisation already functions as a factor of productive differentiation, but not all dimensions of technological change have the same explanatory intensity. Effective implementation has a stronger role than automation, and maturity becomes informative only when non-linearity is introduced. The productive effect of technology therefore depends on the way it is integrated into the internal functioning of the firm.
The discussion must nevertheless remain within the empirical scope of the study. The models are cross-sectional, the explanatory variables are partly survey-based, and part of the observed heterogeneity remains outside the specification. For this reason, the coefficients are interpreted as partial associations and not as direct causal parameters. Within that scope, however, the analysis leads to a clear conclusion. In the firms analysed, digitalisation is the technological dimension most systematically associated with labour productivity, especially when it is approximated through effective technological implementation. Automation has a positive but non-robust coefficient. Firm maturity becomes informative only when a non-linear formulation is introduced.
The main message of the study is therefore precise, because technology matters, but implementation matters more than declaration. That is the conclusion established by the full sequence of estimations and robustness exercises.
5. Conclusions
This study examined the relationship between digitalisation and labour productivity in SMEs in Castilla-La Mancha within the Industry 4.0 framework. The empirical analysis combined firm-level survey information with accounting and financial data and estimated a sequence of alternative cross-sectional specifications. The results establish a conclusion, that digitalisation is positively associated with labour productivity, and this relationship becomes stronger when digitalisation is measured through variables that capture effective technological implementation. The central empirical contribution of the paper lies in demonstrating that productivity differences across firms are linked above all to implementation-oriented digitalisation rather than to broader or more declarative dimensions of technological readiness.
The sequence of linear models identifies a stable result. The aggregate digitalisation indicator remains positive throughout the estimations and gains precision as the specification is simplified. Automation, by contrast, does not retain a statistically robust role in the baseline sequence, even though its coefficient is positive in the initial model. This means that automation, as measured in the study, does not differentiate labour productivity in a systematic way once digitalisation and the atypical observation control are incorporated. The non-linear specifications strengthen the main result. When digitalisation is measured through the implementation-based component, the coefficient increases in magnitude and significance, and the relationship with productivity becomes more clearly defined.
The study also places firm maturity in a more precise empirical context. In linear form, age does not account for productivity differences across firms. When non-linearity is introduced, the maturity term gains explanatory content and reaches marginal significance in the specification that uses the implementation-based digitalisation indicator. This result clarifies the empirical position of maturity. Age does not operate as a direct linear determinant of productivity. Its role is linked to accumulated learning, organisational consolidation, and the capacity to integrate technology into the productive structure of the firm. The paper therefore identifies digitalisation as the main factor of productive differentiation, assigns automation a weaker and non-robust role, and locates maturity in a secondary but more nuanced position.
The study also provides a concrete applied finding. The firms analysed belong to a business structure dominated by SMEs and strongly concentrated in manufacturing activities. In that context, digital transformation already produces observable productivity differences, but these differences are not explained by every technological dimension in the same way. The strongest productivity signal comes from effective implementation. This gives the paper a precise message for the empirical study of Industry 4.0 in regional SME environments. Technology is not associated with performance through declaration alone. It affects performance through operational incorporation, organisational use, and measurable implementation inside the firm.
The paper also defines a clear research agenda. The first priority is to improve the measurement of digitalisation and automation through a survey instrument capable of capturing intensity, scope, and internal integration with greater precision. The second is to incorporate a temporal dimension to identify trajectories of adoption, learning, and productivity more accurately. The third is to examine heterogeneity in greater detail through firm groupings by size, sector, and technological profile. These three lines follow directly from the empirical behaviour of the variables estimated in the study and provide a concrete basis for future research.
Within its current cross-sectional and regional scope, the paper establishes a bounded empirical conclusion. For the 119 firms included in the final estimation sample in Castilla-La Mancha, digitalisation is the technological dimension most systematically associated with labour productivity, and this relationship is strongest when digitalisation is measured through effective technological implementation. This conclusion should therefore be interpreted within the specific context of the analysed regional SME and manufacturing environment. It should not be extrapolated without caution to other territories, sectors, or firm populations.