5.2. Evaluation of Candidate Solution Approaches
Set the confidence level to 1 and the
value of objective function (2) to 0.5. Use two algorithms to perform 10 calculations on the seven randomly generated test questions, and obtain the results in
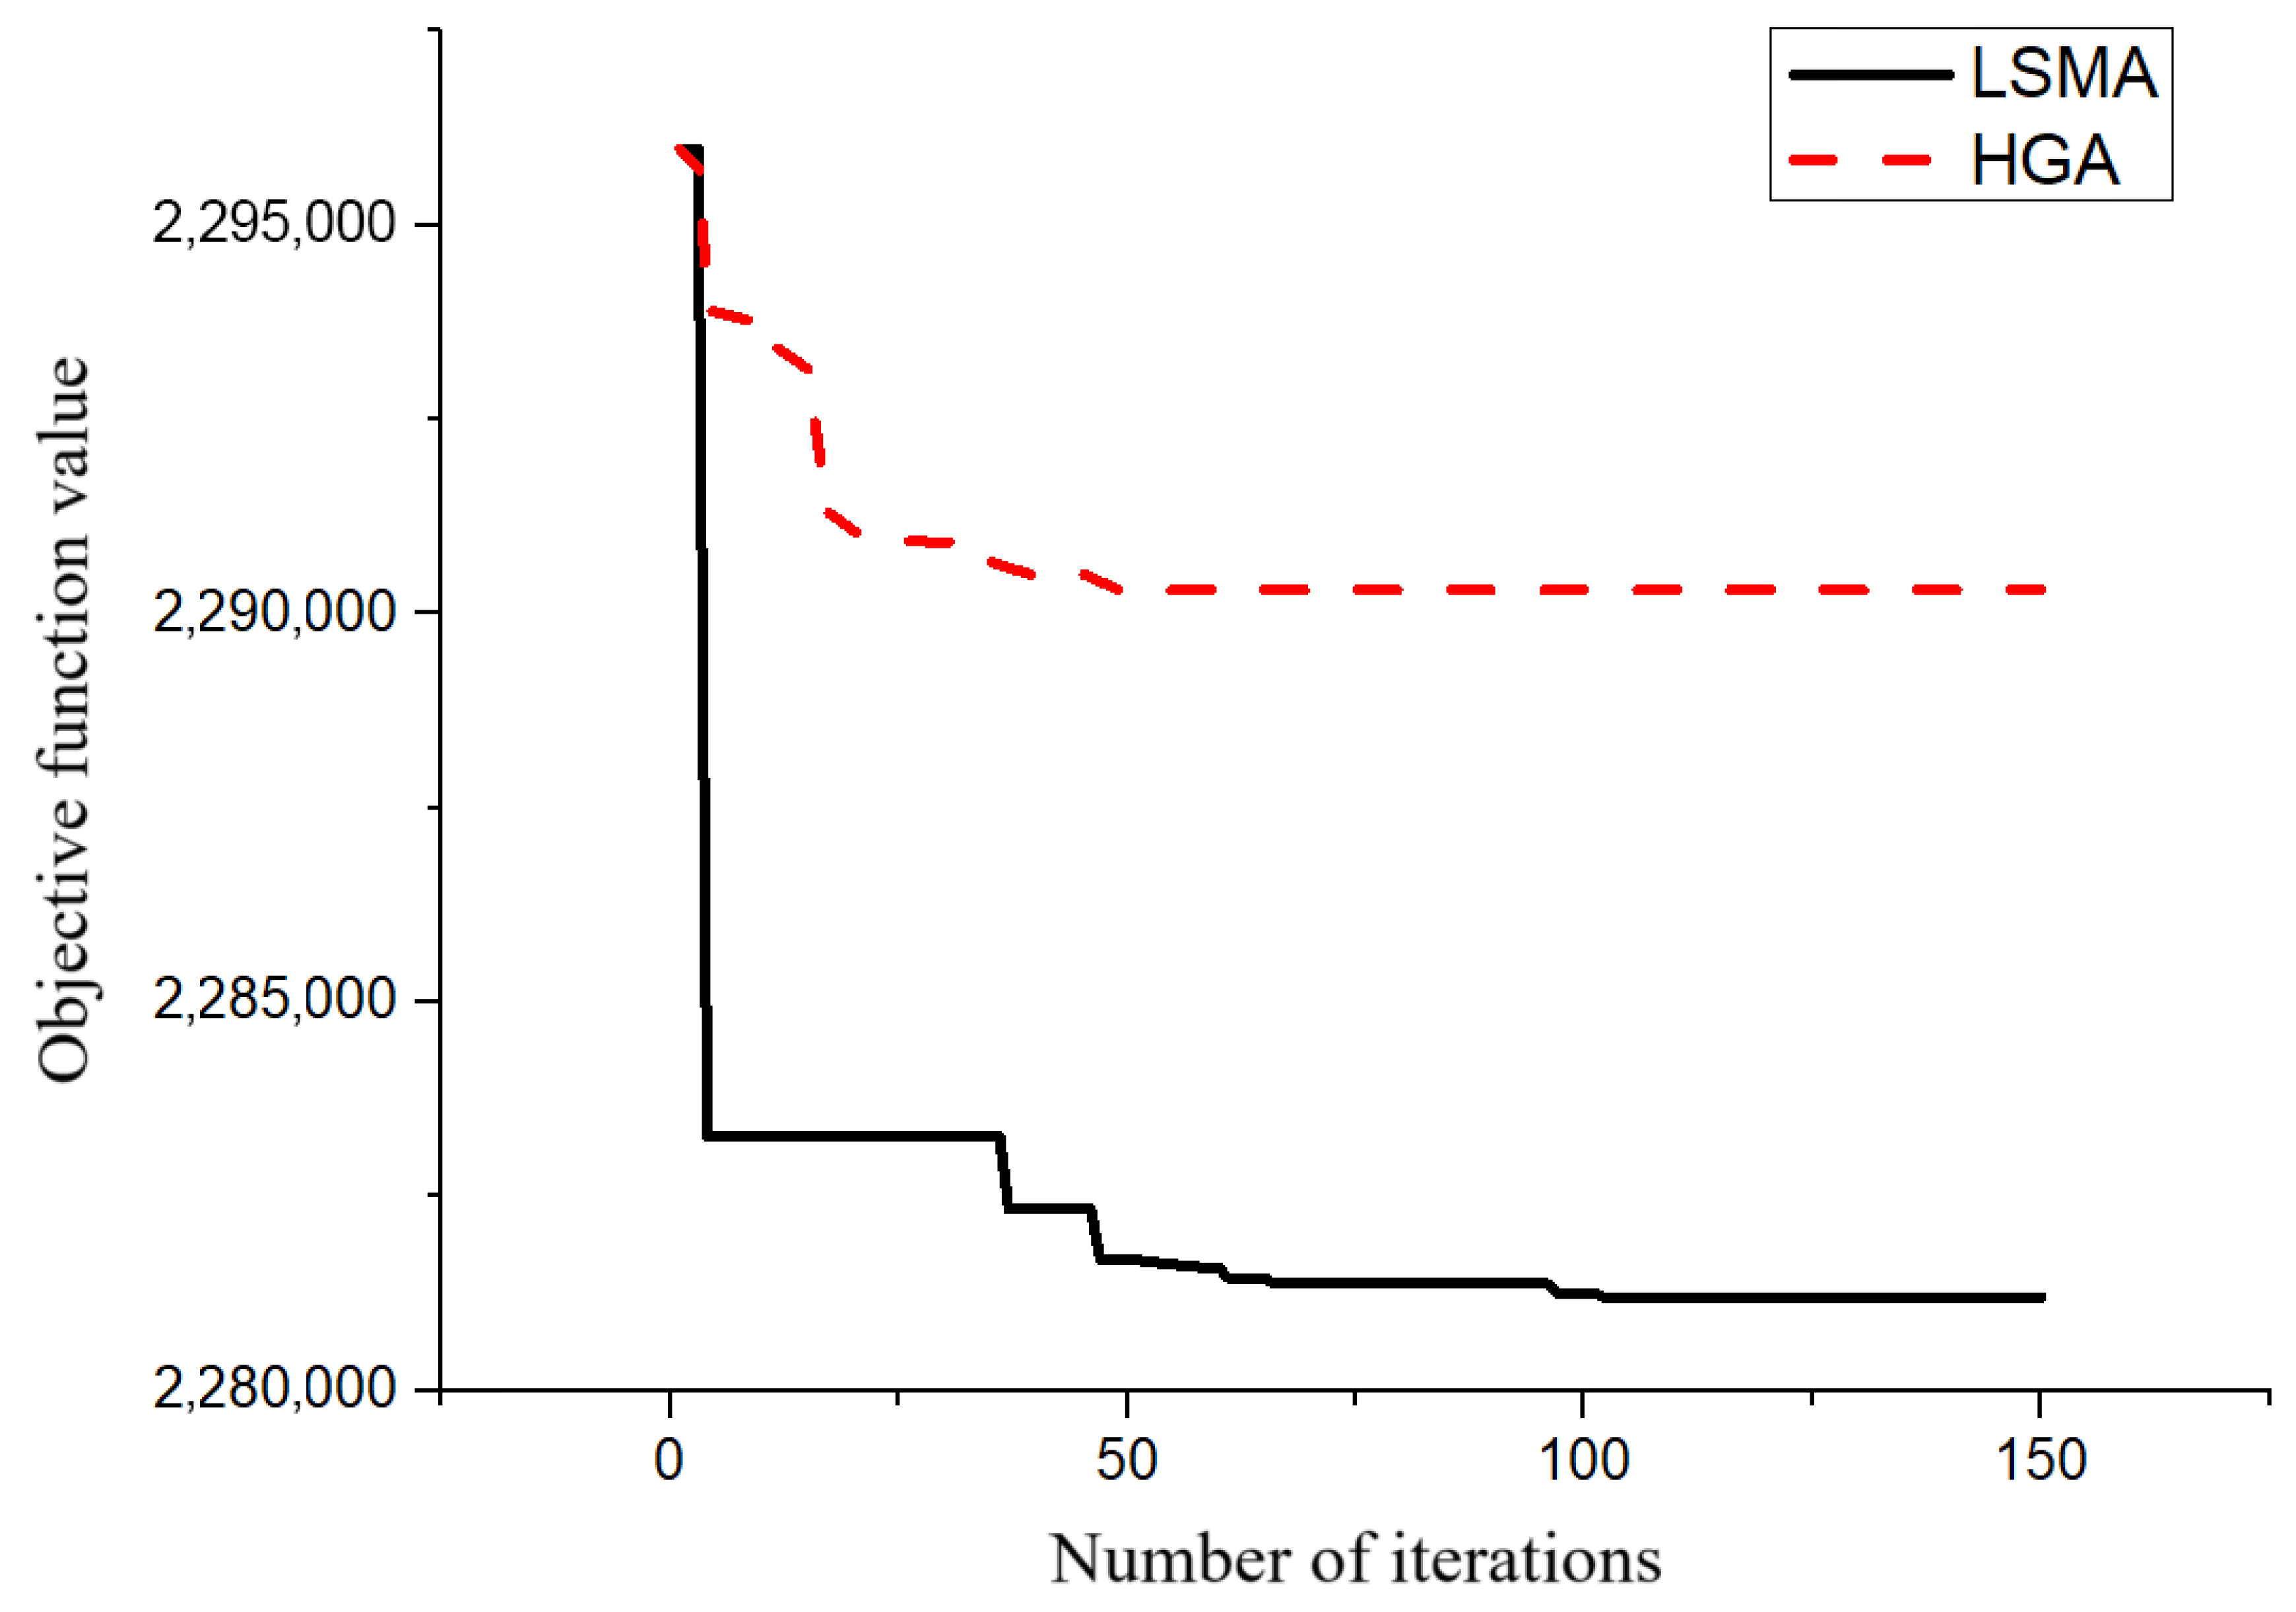
Table 6 (the algorithm parameters (population size, number of iterations) are adjusted as the problem size increases to ensure the quality of the solution). Plot the iterative convergence curve for test question 3 in
Table 6 (
Figure 2).
Table 6 shows that for test questions 1 and 2, the objective function values obtained by CPLEX and LSMA are the same, but CPLEX takes longer than LSMA, indicating that the LSMA is suitable for solving small-scale problems, but its efficiency is not high. For test questions 3 and 4, compared with CPLEX, the LSMA achieves a higher objective function value while reducing the running time, indicating that it is less accurate but more efficient in solving medium-sized test problems. For test question 5, the objective function value obtained with the LSMA is lower than that obtained with CPLEX, and its running time is much shorter than that of the HGA. Regarding test questions 6 and 7, CPLEX does not provide effective feasible solutions, while the LSMA solves them relatively quickly with good results. These results demonstrate the efficiency of the LSMA.
Table 6 also compares the LSMA and the HGA. For test problem 1, the target values obtained with both algorithms are the same, while for test problems 2 and 7, the target values obtained with the LSMA are lower than those obtained with the HGA. When comparing the running time, for all test problems, the LSMA is much slower than the HGA. Furthermore, as the problem size increases, the running time of the LSMA also increases, because it incorporates dynamic neighbourhood search to enhance its local search capability. Although this process increases the running time, it allows the algorithm to obtain better quality solutions. As shown in
Figure 2, with the same encoding method, the LSMA provides better solution results than the HGA and is more likely to jump out of local optimisation solutions. This proves that the LSMA has some advantages. The quality of its results is higher than that of the HGA, demonstrating the high accuracy of the LSMA.
The comparison with the Universal Precision Solver (CPLEX) and the Classic Heuristic Algorithm (HGA) shows that LSMA exhibits unique advantages in solving the fuzzy mixed integer programming model proposed in this study. It should be emphasized that for traditional deterministic site selection coverage problems, there are a large number of specialized and efficient algorithms that utilize the special structure of the problem. However, the M3 model in this article has a more complex structure due to the transformation of fuzzy constraints and endogenous incentive decisions. The value of LSMA as a general heuristic framework that does not rely on specific problem structures lies in its ability to effectively address the solving challenges brought about by innovative modeling. As shown in
Table 6, LSMA has validated its ability to find the optimal solution for small-scale problems that CPLEX can still efficiently solve; LSMA provides a better ‘time quality’ trade-off for solving medium to large-scale problems with significantly reduced efficiency in CPLEX; In the case of large-scale problems where CPLEX cannot provide effective solutions within a reasonable time, LSMA has become a feasible and superior solution approach compared to traditional heuristic methods (HGA). Therefore, the core contribution of LSMA is to provide a reliable solution tool for the large-scale application of this new type of fuzzy programming model, rather than aiming to replace all specialized algorithms in classical scenarios.
To further scrutinize the superiority of the algorithms, the facility location solutions obtained by CPLEX and the proposed LSMA within a 600 s time limit for Test Problems 4, 5, 6, and 7 are presented in
Table 7. As shown in
Table 7, the solutions generated by CPLEX consistently involve a larger number of selected facilities, with some also assigned higher capacity grades compared to those from LSMA. This observation, however, underscores the superiority in optimization efficacy of the LSMA. The LSMA successfully identifies network configurations with significantly lower total costs while satisfying all constraints, including coverage requirements, capacity credibility, and the recovery rate target. This indicates that the LSMA, through its more refined global search, can pinpoint efficient network structures that operate effectively without necessitating over-construction (i.e., fewer facilities with moderate grades). Consequently, it avoids the resource redundancy and capital overinvestment potentially present in the CPLEX solutions. This capability directly demonstrates the effectiveness of the dynamic local search mechanism embedded within the LSMA, proving that it provides a more economically competitive and preferable solution for strategic investment planning.
5.3. Sensitivity Analysis and Managerial Insights
The reverse logistics network model constructed in this article contains fuzzy parameters. To explore their impact, test problem 1 is used for analysis. Suppose that there are 30 disposal points, 10 candidate recycling stations, and 4 recycling station levels in the network, with
and
being 21% and 22%, respectively.
is (2, 3, 4, 5),
is (90, 100, 110, 120), and
is (40, 50, 60, 70). The fuzzy operating costs of recycling stations for express packaging are cardboard boxes (2, 3, 4, 5), plastic bags (0.9, 1.5, 2, 2.6), woven bags (1, 2, 3, 4), and internal buffers (3, 4, 5, 6), respectively. The values of
follow the range shown in
Table 3, and the remaining data are shown in
Table 8,
Table 9 and
Table 10.
Take a confidence level between 50% and 100%, set
between 50% and 90%, and use the LSMA to solve the model. The calculation results are shown in
Table 11 and
Table 12, and
Figure 3 is based on
Table 10.
As shown in
Table 11 and
Table 12, the overall trend of network changes is as follows: at constant
and increasing confidence level, or at a constant confidence level and increasing
, the location of recycling stations in the network differs, the total number of selected recycling stations increases, and their levels improve. The number of times enterprises pay additional recycling fees for discarded express packaging and the government allocates subsidies to recycling stations increases (due to the lack of specific data in the article), and the target value (total cost) increases. Indeed, increasing the confidence level increases the amount of express packaging reliably recycled and ensures that express packaging whose recycling is uncertain (i.e., not systematic) is recycled. Alternatively, increasing the
value may require recycling a sufficient amount of express packaging to meet the required recycling rate, increasing the network’s logistics volume and transportation costs. Furthermore, improving the level of recycling stations or increasing their number can meet this part of the logistics volume, increasing their fixed and operating costs and ultimately increasing the target value.
In
Table 11 and
Table 12, the bold numbers indicate that for the same
value, the target values for adjacent confidence levels and the selection of recycling bins are identical. When the
value is the same, and the target values for adjacent confidence levels are different, the selection of recycling bins is the same, such as a value of 55% and confidence levels of 75% and 80%. In the case of the same
value and different target values of adjacent confidence levels, although the number of recycling stations is the same, their location differs, and their levels are reduced. For example, when the
value is 80%, a confidence level of 85% selects seven level 4 recycling stations and one level 3 recycling station, while a confidence level of 90% selects seven level 4 recycling stations and one level 1 recycling station. Although the overall trend indicates that for the same
value, the total number and level of recycling stations decrease with decreasing confidence level, there may be situations where stations are not affected by the confidence level. Therefore, the above results indicate that in this paper, the confidence level has no systematic impact on the structure of the reverse logistics network for express packaging.
Furthermore, in
Table 11 and
Table 12, as the value of confidence level increases, the target value (total cost) strictly increases. The location of recycling stations in the network differs, the total number of selected recycling stations strictly increases, and their levels increase. The number of times that enterprises pay additional recycling fees for discarded express packaging and the government allocates subsidies to recycling stations also strictly increases. These results indicate that the level of achievement of the limited total recycling rate has a significant impact on the reverse logistics network for express packaging.
In
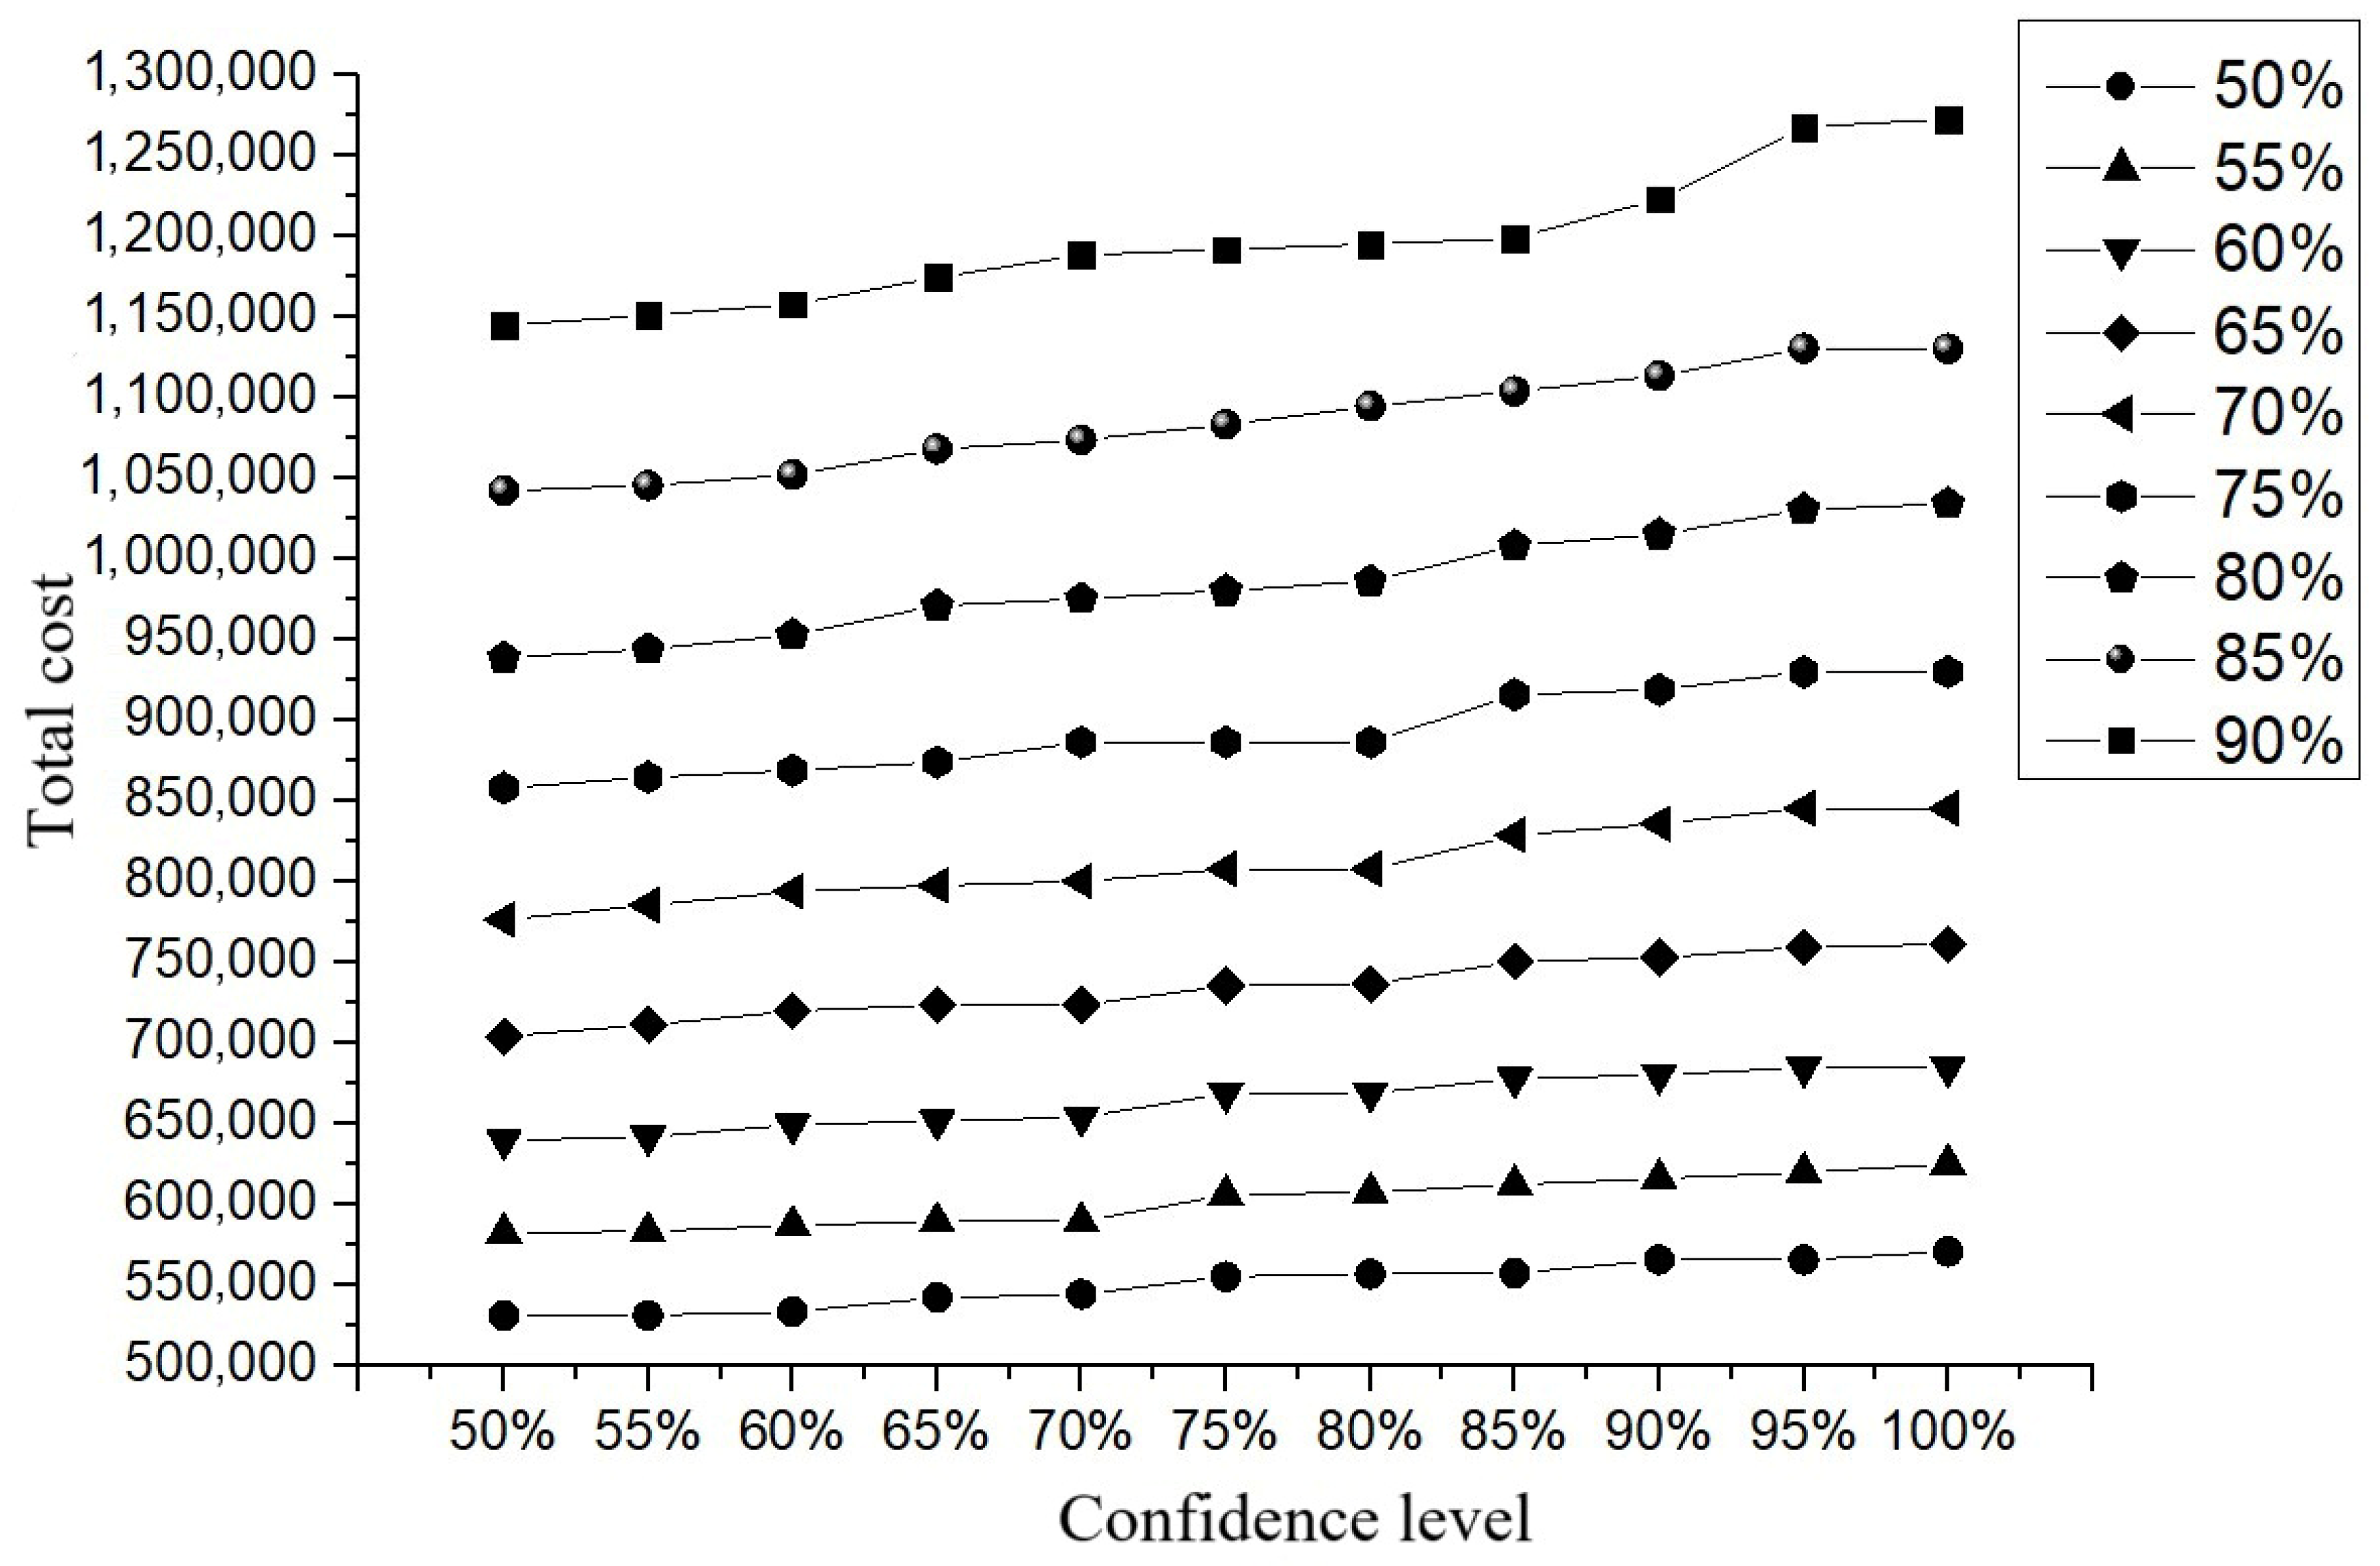
Figure 3, for the same
value, as the confidence level increases, the total cost also increases. Moreover, the confidence level within a certain range is relatively close to the magnitude of the increase in total cost, showing an approximately linear proportional relationship. For the same
value, the total cost increases with the value of
, and the increase rate varies. The above explanation shows that changes in the confidence level and overall recycling rate can significantly affect the target values, and that the magnitude of this increase is irregular, indicating that there is a certain degree of risk associated with changes in the confidence level.
Table 11 shows that under a fixed recycling rate threshold, increasing the confidence level leads to a systematic rise in total cost. A note in
Table 11 clarifies that this cost increase is partly attributable to the “increased frequency of government subsidy allocations to recycling stations.” This reveals a core relationship: when decision-makers pursue higher system robustness, they not only need to construct more and more expensive facilities but also require both the government and enterprises to provide greater incentives (subsidies and refunds) to “activate” and secure the expected recovery volume.
Table 12 demonstrates how the number, level, and location of recycling stations change under different combinations of the recycling rate threshold and confidence level. Since the disbursement of subsidies is directly linked to whether a facility is selected and processes recyclables (Constraints (8) and (9)), the implied intensity of the subsidy policy (embedded within the model optimization) directly influences which levels and locations of facilities are incorporated into the optimal network. A system anticipating subsidy support is more likely to justify the construction of higher-level, more widely covering, yet costlier facilities.
Figure 3 and the associated analysis indicate that the total cost increases in an “approximately linear” yet “irregular” manner as the confidence level (α) rises. This irregularity stems partly from the discrete decision-making nature of the incentive policies (subsidies and refunds). The introduction of subsidies means that, when responding to uncertainty, cost increases are not smooth and continuous. Instead, upon reaching certain thresholds, costs exhibit a piecewise jump triggered by the activation of subsidy payments.
Based on the aforementioned analysis, integrated with practical logistics management, policy formulation, and corporate decision-making, the following managerial insights are provided:
(1) Confidence Level Serves as a Core Management Lever for Quantifying the “Risk-Cost” Trade-off.
Sensitivity analysis results indicate that, under a fixed recycling rate target, the total network cost increases approximately linearly with the confidence level (see
Figure 3 and
Table 11 in the document). For instance, when the recycling rate threshold (ε) is 80%, the total cost increases significantly as the confidence level rises from 75% to 90%. This provides managers with a clear decision-making tool: quantifying “the additional marginal cost required to improve system operational robustness (i.e., reliability) by one percentage point.” Decision-makers (e.g., logistics network planners or policymakers) can adjust this intuitive parameter—the confidence level—based on their organization’s risk tolerance (e.g., how much extra budget they are willing to allocate for “90% assurance” versus “75% assurance”) to generate corresponding optimized network investment plans. This transforms strategic decision-making from the vague notion of “improving robustness” into a precise “cost–risk” exchange.
(2) Network Facility Layout Should Possess “Resilience” Aligned with Strategic Objectives.
Results from
Table 12 show that different combinations of confidence levels and recycling rate targets lead to entirely different facility locations, quantities, and level configurations. This implies that a network pursuing low cost with acceptable risk (low confidence level) is fundamentally different in physical form from one pursuing high assurance and a high recycling rate (high confidence level and/or high ε value). The managerial implication is that enterprises should not seek a single “optimal” static network but should plan for a portfolio of solutions with “resilience.” In the early investment stage, managers can use the model to evaluate optimal layouts under different development scenarios, thereby making more forward-looking infrastructure decisions. It also clarifies the specific pathways and costs for network upgrades or adjustments when future objectives change.
(3) Algorithmic Tools Enable a Shift in Decision-Making Paradigm from “Cost Center” to “Value Investment.”
Algorithm comparison results (
Table 6) demonstrate that the proposed LSMA algorithm can generate high-quality solutions for large-scale, complex problems within a reasonable timeframe. Its performance is superior to traditional heuristic algorithms and remains effective even when exact solvers fail. This provides significant managerial tool value: it enables enterprises to conduct rapid, systematic “simulation-optimization” analysis of reverse logistics networks. Managers can use this tool to evaluate the effects of different incentive policies (refunds, subsidies), calculate the minimum cost to comply with new environmental regulations, or compare the benefits of building their own recovery network versus third-party cooperation. Consequently, packaging recycling operations can be transformed from a passive, hard-to-quantify “cost center” into a “strategic investment component” that can be proactively managed and its value assessed through optimization models.
(4) Subsidy Policies Require Coordinated Design with Network Planning.
The findings indicate that “where to locate facilities” and “how much subsidy to provide” are inseparable decisions requiring joint optimization. The optimal subsidy strategy is highly dependent on the specific network layout. Consequently, an effective policy should not rely on setting a uniform subsidy rate. Instead, it should formulate differentiated subsidy schemes based on optimization simulations of the integrated network (encompassing facility location and consumer incentives) to maximize funding efficiency.
Overall, the impact of changes in recycling rate thresholds (i.e., values) and confidence levels on the location of express packaging logistics networks is significant. Managers should objectively evaluate their enterprise’s recycling level and other relevant information regarding express packaging to determine whether the enterprise should invest in recycling and whether it can benefit from government subsidies to improve the recycling rate of express packaging. They should also consider the level of risk (i.e., choose a reasonable confidence level) and develop a feasible express packaging recycling plan. The model and algorithm proposed in this study provide managers with a data-driven decision support system. Its core managerial value lies in: quantifying “risk” and “environmental targets” and incorporating them into cost accounting; revealing how the network structure evolves with strategic objectives, thereby supporting resilient planning; and offering an efficient computational tool that makes the optimization of complex sustainable logistics networks an actionable decision-making process.