Review

A Review of Explainable Machine Learning in Medical Thermography for Interpretable Thermal Feature Analysis and Biomarker Discovery


1
Department of Mechanical, Robotics and Energy Engineering, Dongguk University-Seoul, 30 Pildong-ro 1-gil, Jung-gu, Seoul 04620, Republic of Korea
2
KAIST InnoCORE PRISM-AI Center, Korea Advanced Institute of Science and Technology (KAIST), Daejeon 34141, Republic of Korea
*
Author to whom correspondence should be addressed.
Mathematics 2026, 14(10), 1666; https://doi.org/10.3390/math14101666
Submission received: 10 April 2026 / Revised: 6 May 2026 / Accepted: 12 May 2026 / Published: 13 May 2026
(This article belongs to the Special Issue Advances in Machine Learning and Intelligent Systems)

Abstract

Medical thermography is a noninvasive, contactless imaging technique that captures spatial temperature distributions across the human body, providing insights into vascular function, inflammation, metabolism, physiological regulation, and aging. Recently, machine learning has been increasingly utilized to analyze thermographic data for disease screening, functional assessment, and biomarker identification. However, the existing literature is fragmented, with varied clinical applications, feature-engineering strategies, and predictive modeling frameworks, often lacking a focus on interpretability and the reliable identification of clinically relevant thermal markers. This review offers a structured overview of explainable machine learning in medical thermography, emphasizing thermal feature representation, model interpretability, and biomarker discovery. It categorizes thermographic features into pixel-based representations, region-wise statistical descriptors, texture measures, and deep latent features. Additionally, it evaluates conventional machine learning and deep learning methods for classification, regression, and risk assessment tasks. The review pays special attention to interpretable learning strategies, such as feature importance analysis, surrogate explanation models, saliency-based visualization, and Shapley-value-based methods, which can enhance transparency and confidence in model outputs. Key challenges are critically discussed, including imaging variability, limited dataset sizes, weak protocol standardization, class imbalance, generalizability, and the gap between predictive performance and clinical trust. Overall, this review synthesizes current advancements, identifies major research gaps, and outlines future directions for developing trustworthy machine learning frameworks in medical thermography and enhancing interpretable thermal biomarker discovery.

1. Introduction

Medical imaging is increasingly used not only for visual diagnosis but also for the extraction of quantitative biomarkers that reflect biological and pathological processes. In clinical practice, such biomarkers can support disease detection, screening, staging, risk stratification, prognosis, monitoring of disease progression, and assessment of treatment response [1]. Quantitative imaging biomarkers are image-derived numerical measures that can represent structural, functional, metabolic, or physiological information in a reproducible form [2,3]. Examples include lesion size or volume, standardized uptake values in positron-emission tomography (PET), and diffusion-related magnetic resonance imaging (MRI) measures, as well as temperature-derived descriptors in thermographic imaging [4,5]. For these measures to be clinically useful, they should be technically reliable, repeatable, reproducible, biologically meaningful, and clinically relevant rather than merely predictive within a single dataset [6]. Imaging-biomarker development, therefore, requires careful technical-performance assessment [7]. Moreover, biomarker translation depends on both technical validation and biological or clinical validation before a marker can be considered useful for research or clinical decision-making [4,8].
Thermography-derived temperature measures may therefore be considered candidate quantitative imaging biomarkers when measured under controlled conditions, because they provide numerical information about body-surface temperature and its spatial or temporal variation, which can reflect physiological and disease-related changes [5]. Infrared thermography is regarded as a fast, passive, non-contact, and non-invasive method for monitoring body-surface temperature [9,10], with current medical applications in diagnosis, screening, and disease monitoring across diverse clinical settings [11]. Since skin temperature is influenced by blood perfusion, metabolism, inflammation, autonomic regulation, and heat transfer through tissue, thermography provides a predominantly functional view of physiological state rather than a purely structural depiction of anatomy. Medical thermography has therefore been investigated in breast cancer diagnosis [12], early diabetes diagnosis [13], vascular disorders [14], fever screening [15], rheumatologic conditions [16], dermatologic disease [17], and ocular disease [18]. Despite these advantages, thermography has not achieved the same level of routine clinical integration as more established imaging modalities, in part because thermographic measurements are highly sensitive to acquisition conditions such as room temperature, humidity, airflow, acclimatization time, camera characteristics, and protocol design [19,20]. Ring et al. emphasized the importance of emissivity, instrumentation, and controlled measurement conditions in medical thermography [21], whereas Kesztyüs et al. documented substantial heterogeneity in devices, protocols, and use cases across recent thermography studies [22]. This heterogeneity makes it difficult to compare findings across studies and to determine whether a reported thermal signature reflects a true physiological effect or merely the specific measurement conditions used in that study, thereby limiting their clinical utility [7].
As thermal cameras and computational tools have improved [23], the field has shifted from visual inspection and simple temperature comparison toward quantitative thermographic analysis. Recent studies increasingly represent thermograms using structured numerical descriptors such as regional temperature statistics, asymmetry indices, texture measures, and learned deep features [24,25,26]. This transition is evident in breast thermography, where Acharya et al. used texture features derived from co-occurrence and run-length matrices with a support vector machine to classify normal and malignant thermograms [27]. Similarly, Khandakar et al. developed machine-learning approaches for identifying diabetic-foot risk from plantar thermogram images [28]. Accordingly, machine learning has become an increasingly important layer in thermographic image analysis, with applications in thermal-image denoising, artifact reduction, segmentation, localization, classification, and diagnostic support [29]. However, much of the available literature remains application-specific rather than organized around a unified physiological or biomarker framework. Breast thermography, for example, has generated many computer-aided diagnosis studies focused on abnormality detection and classification. Representative examples include the deep-learning review by Tsietso et al. [30], the fully automated U-Net and convolutional neural network (CNN)-based framework proposed by Mohamed et al. [31], and the Mask R-CNN-based unified pipeline introduced by Civilibal et al. [32]. Diabetic-foot thermography has similarly developed as a distinct subfield focused on ulcer-risk detection, severity assessment, and early-warning analysis, including the feature-based AdaBoost model by Khandakar et al. [28], and the region-wise severity analysis proposed by Sharma et al. [33]. While these studies are valuable, they often emphasize diagnostic performance within specific tasks more than interpretable thermal physiology or long-term biomarker robustness.
Although AI-based thermographic studies often report high predictive performance, the literature remains fragmented and still pays limited attention to model interpretability and real-world generalizability [34]. However, predictive performance alone is insufficient to establish a thermal biomarker; it must also demonstrate repeatability, reproducibility, physiological plausibility, and generalizability across populations and conditions [4,6,7]. In thermography, where thermal patterns are sensitive to environmental conditions, imaging protocols, and subject preparation [35,36], interpretability is essential for clinician trust, regulatory acceptance, and the identification of biologically meaningful thermal features [29,37]. The present literature accordingly suggests that interpretable thermographic AI remains less developed than performance-driven classification work. Establishing reliable thermal aging biomarkers also requires strict protocol control and proven feature stability over time. For instance, Yu et al. (2024) established ThermoFace, which aligns thermal and 2D facial data to quantify aging hallmarks across 897 triangular regions of interest (ROIs) and maps age-specific signatures to DNA repair and metabolism, providing an externally validated tool for predicting biological age and disease [5]. Thus, the long-term value of thermographic AI likely depends not only on achieving high performance in isolated prediction tasks, but also on identifying interpretable and quantitatively robust markers of physiology, pathology, and ageing.
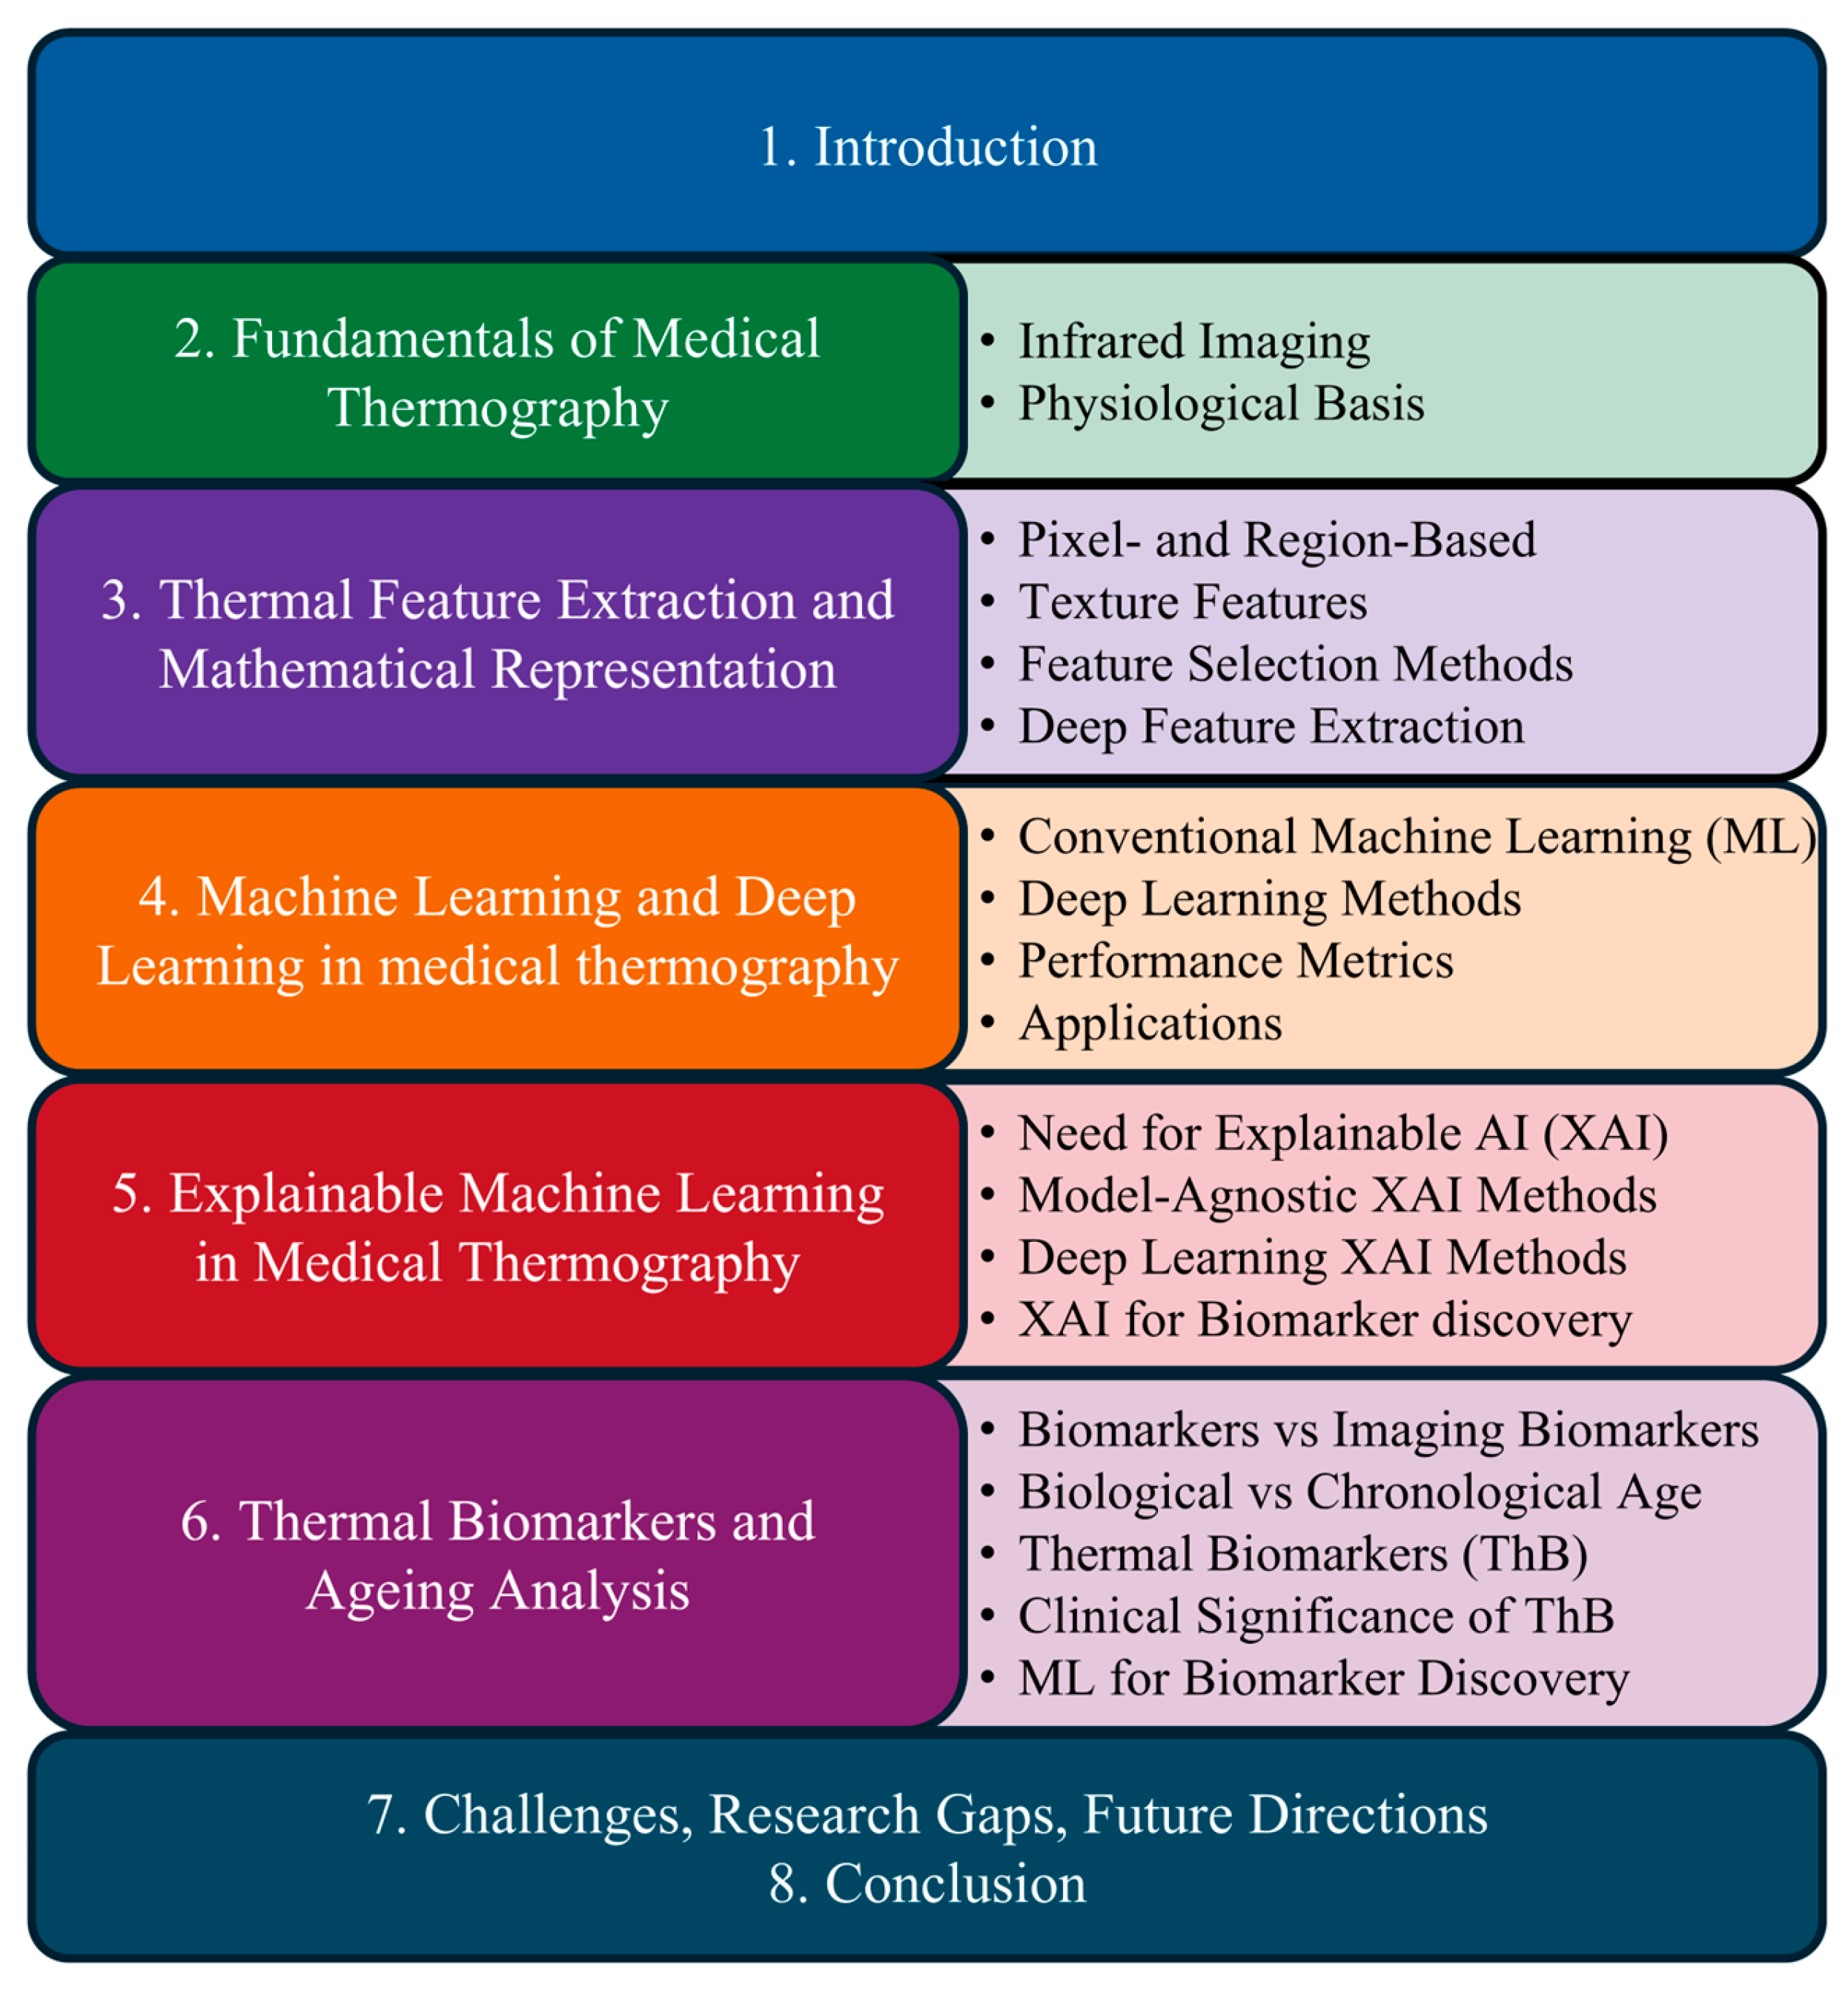
Figure 1 presents the overall structure of the review and shows the relationships among its main sections and subsections, while Table 1 summarizes representative reviews in medical thermography and related fields. Overall, previous reviews have mainly focused on general thermography, AI-based analysis, or disease-specific applications, while the combined perspective of feature representation, explainability, and thermal biomarker discovery remains limited. The present review addresses this gap, and its main contributions are summarized below.
  • Medical thermography is framed as a source of candidate quantitative imaging biomarkers, with physiological plausibility, repeatability, and reproducibility considered as key evaluation criteria.
  • A mathematically grounded taxonomy of thermographic feature representations is provided, with emphasis on interpretability and suitability for biomarker-oriented modeling.
  • Conventional machine-learning and deep-learning methods are evaluated for thermographic analysis in terms of both predictive performance and clinical interpretability.
  • Explainable AI methods, including feature importance, surrogate models, saliency visualization, and Shapley-value methods, are reviewed in the specific context of medical thermography.
  • Explainable machine learning is connected to thermal biomarker discovery by linking model interpretability to candidate thermal markers.
  • Key challenges, including protocol variability, dataset limitations, generalizability, and the gap between predictive performance and clinical trust, are critically discussed with structured future directions.
The remainder of this paper is organized as follows. Section 2 introduces the fundamentals of medical thermography. Section 3 reviews thermal feature extraction and mathematical representations. Section 4 summarizes machine-learning and deep-learning methods used in thermographic analysis. Section 5 discusses explainable machine-learning approaches. Section 6 examines thermal biomarkers and ageing-related thermographic analysis. Section 7 highlights current challenges, research gaps, and future directions. Section 8 concludes the paper.

2. Fundamentals of Medical Thermography

2.1. Infrared Radiation and Thermal Imaging Principles

Infrared thermography is based on the detection of infrared radiation naturally emitted by objects as a function of their temperature. All objects above absolute zero emit infrared radiation as a function of temperature. In medical thermography, infrared cameras measure the radiation emitted from the skin surface and convert it into temperature maps, thereby providing a non-contact representation of body-surface thermal distribution [36]. The spectral distribution of radiation emitted by a body at temperature T is described by Planck’s law [38]:
E ( λ , T ) = 2 h c 2 λ 5 ( 1   e h c λ k B T   1 )    
where h is Planck’s constant, c is the speed of light, k B is Boltzmann’s constant, λ is wavelength, and T is absolute temperature. This law shows that emitted radiation depends on both temperature and wavelength. Human skin primarily emits radiation in the long-wave infrared region, approximately 8–14 μ m [39], which corresponds to the spectral range used by most medical thermal cameras. The total radiative energy emitted by a surface is commonly described by the Stefan–Boltzmann law [40]:
E = σ T 4
where σ is the Stefan–Boltzmann constant. This relation indicates that the total emitted radiation increases with the fourth power of absolute temperature, which explains why small temperature differences on the skin surface can be detected by modern thermal imaging systems. Since real biological surfaces do not behave as ideal black bodies [41], emissivity must also be considered. The radiative emission of a real surface is expressed as:
E = ε σ T 4
where ε is the emissivity. Human skin has a high emissivity, typically close to 0.98 [42], which makes it particularly suitable for accurate thermal imaging because the measured radiation closely reflects the actual surface temperature. In bioheat modeling, this process is commonly described by the Pennes bioheat equation [43]:
ρ t c t T t = k t 𝛻 2 T + ρ b ω b c b ( T b T ) + Q m
where ρ t is tissue density, c t is tissue specific heat, k t is tissue thermal conductivity, ρ b is blood density, ω b is the blood perfusion rate, c b is blood specific heat, T b is arterial blood temperature, T is tissue temperature, and Qm represents metabolic heat generation. This equation shows that tissue temperature distribution depends on heat conduction, blood flow, and metabolic activity, which together determine the skin temperature patterns observed in thermographic images. Therefore, thermographic images do not directly measure internal body temperature; rather, they represent surface temperature patterns that arise from underlying physiological activity and heat transfer mechanisms. For this reason, understanding infrared radiation physics, emissivity, and tissue heat transfer is essential before thermal images can be interpreted quantitatively or used for feature extraction and biomarker-oriented analysis.

2.2. Physiological Basis of Skin Temperature

Skin temperature distribution is governed by physiological processes such as blood perfusion. Blood acts as a heat transfer medium that transports heat from the body’s core to peripheral tissues [44], so increased blood flow generally elevates local skin temperature, whereas reduced perfusion lowers it. This process is regulated by vasodilation and vasoconstriction under autonomic control, which helps maintain thermal balance under varying internal and external conditions [45]. In addition to blood flow, metabolic heat production also contributes to regional temperature variation, particularly in tissues with higher physiological activity [46,47]. Inflammatory processes further modify these patterns by increasing blood flow, metabolic activity, and localized heat generation, which often appear in thermographic images as hot spots or temperature asymmetry [48,49]. For this reason, clinical thermography applications, including musculoskeletal injury assessment, vascular abnormality detection, and inflammation monitoring, rely on identifying localized thermal disturbances associated with altered physiological activity.
A further important concept in medical thermography is thermal symmetry. In healthy individuals, corresponding regions on the left and right sides of the body generally exhibit similar temperature distributions because vascular supply, metabolic activity, and autonomic regulation are normally balanced bilaterally [50]. Thermal asymmetry may therefore indicate physiological abnormalities such as vascular dysfunction, nerve impairment, inflammation, or localized pathology. Ageing adds another layer of variation to these thermal patterns [51]. With increasing age, peripheral circulation may decline, vasomotor responses may become less efficient, and thermoregulatory capacity may be altered, leading to measurable differences in regional skin temperature and overall thermal distribution [5]. Age-related changes in muscle mass, subcutaneous tissue composition, and metabolic activity may also influence heat production and heat transfer to the skin surface. At the same time, skin temperature remains sensitive to skin condition and environmental factors as well [52,53]. Consequently, standardized acquisition protocols are essential in medical thermography to ensure that observed thermal variations primarily reflect physiological status rather than environmental disturbance. Therefore, thermal images represent spatial temperature distributions influenced by physiological and heat transfer processes. These temperature distributions can be analyzed quantitatively through feature extraction methods, statistical analysis, and machine learning models, which are discussed in the following sections.

3. Thermal Feature Extraction and Mathematical Representation

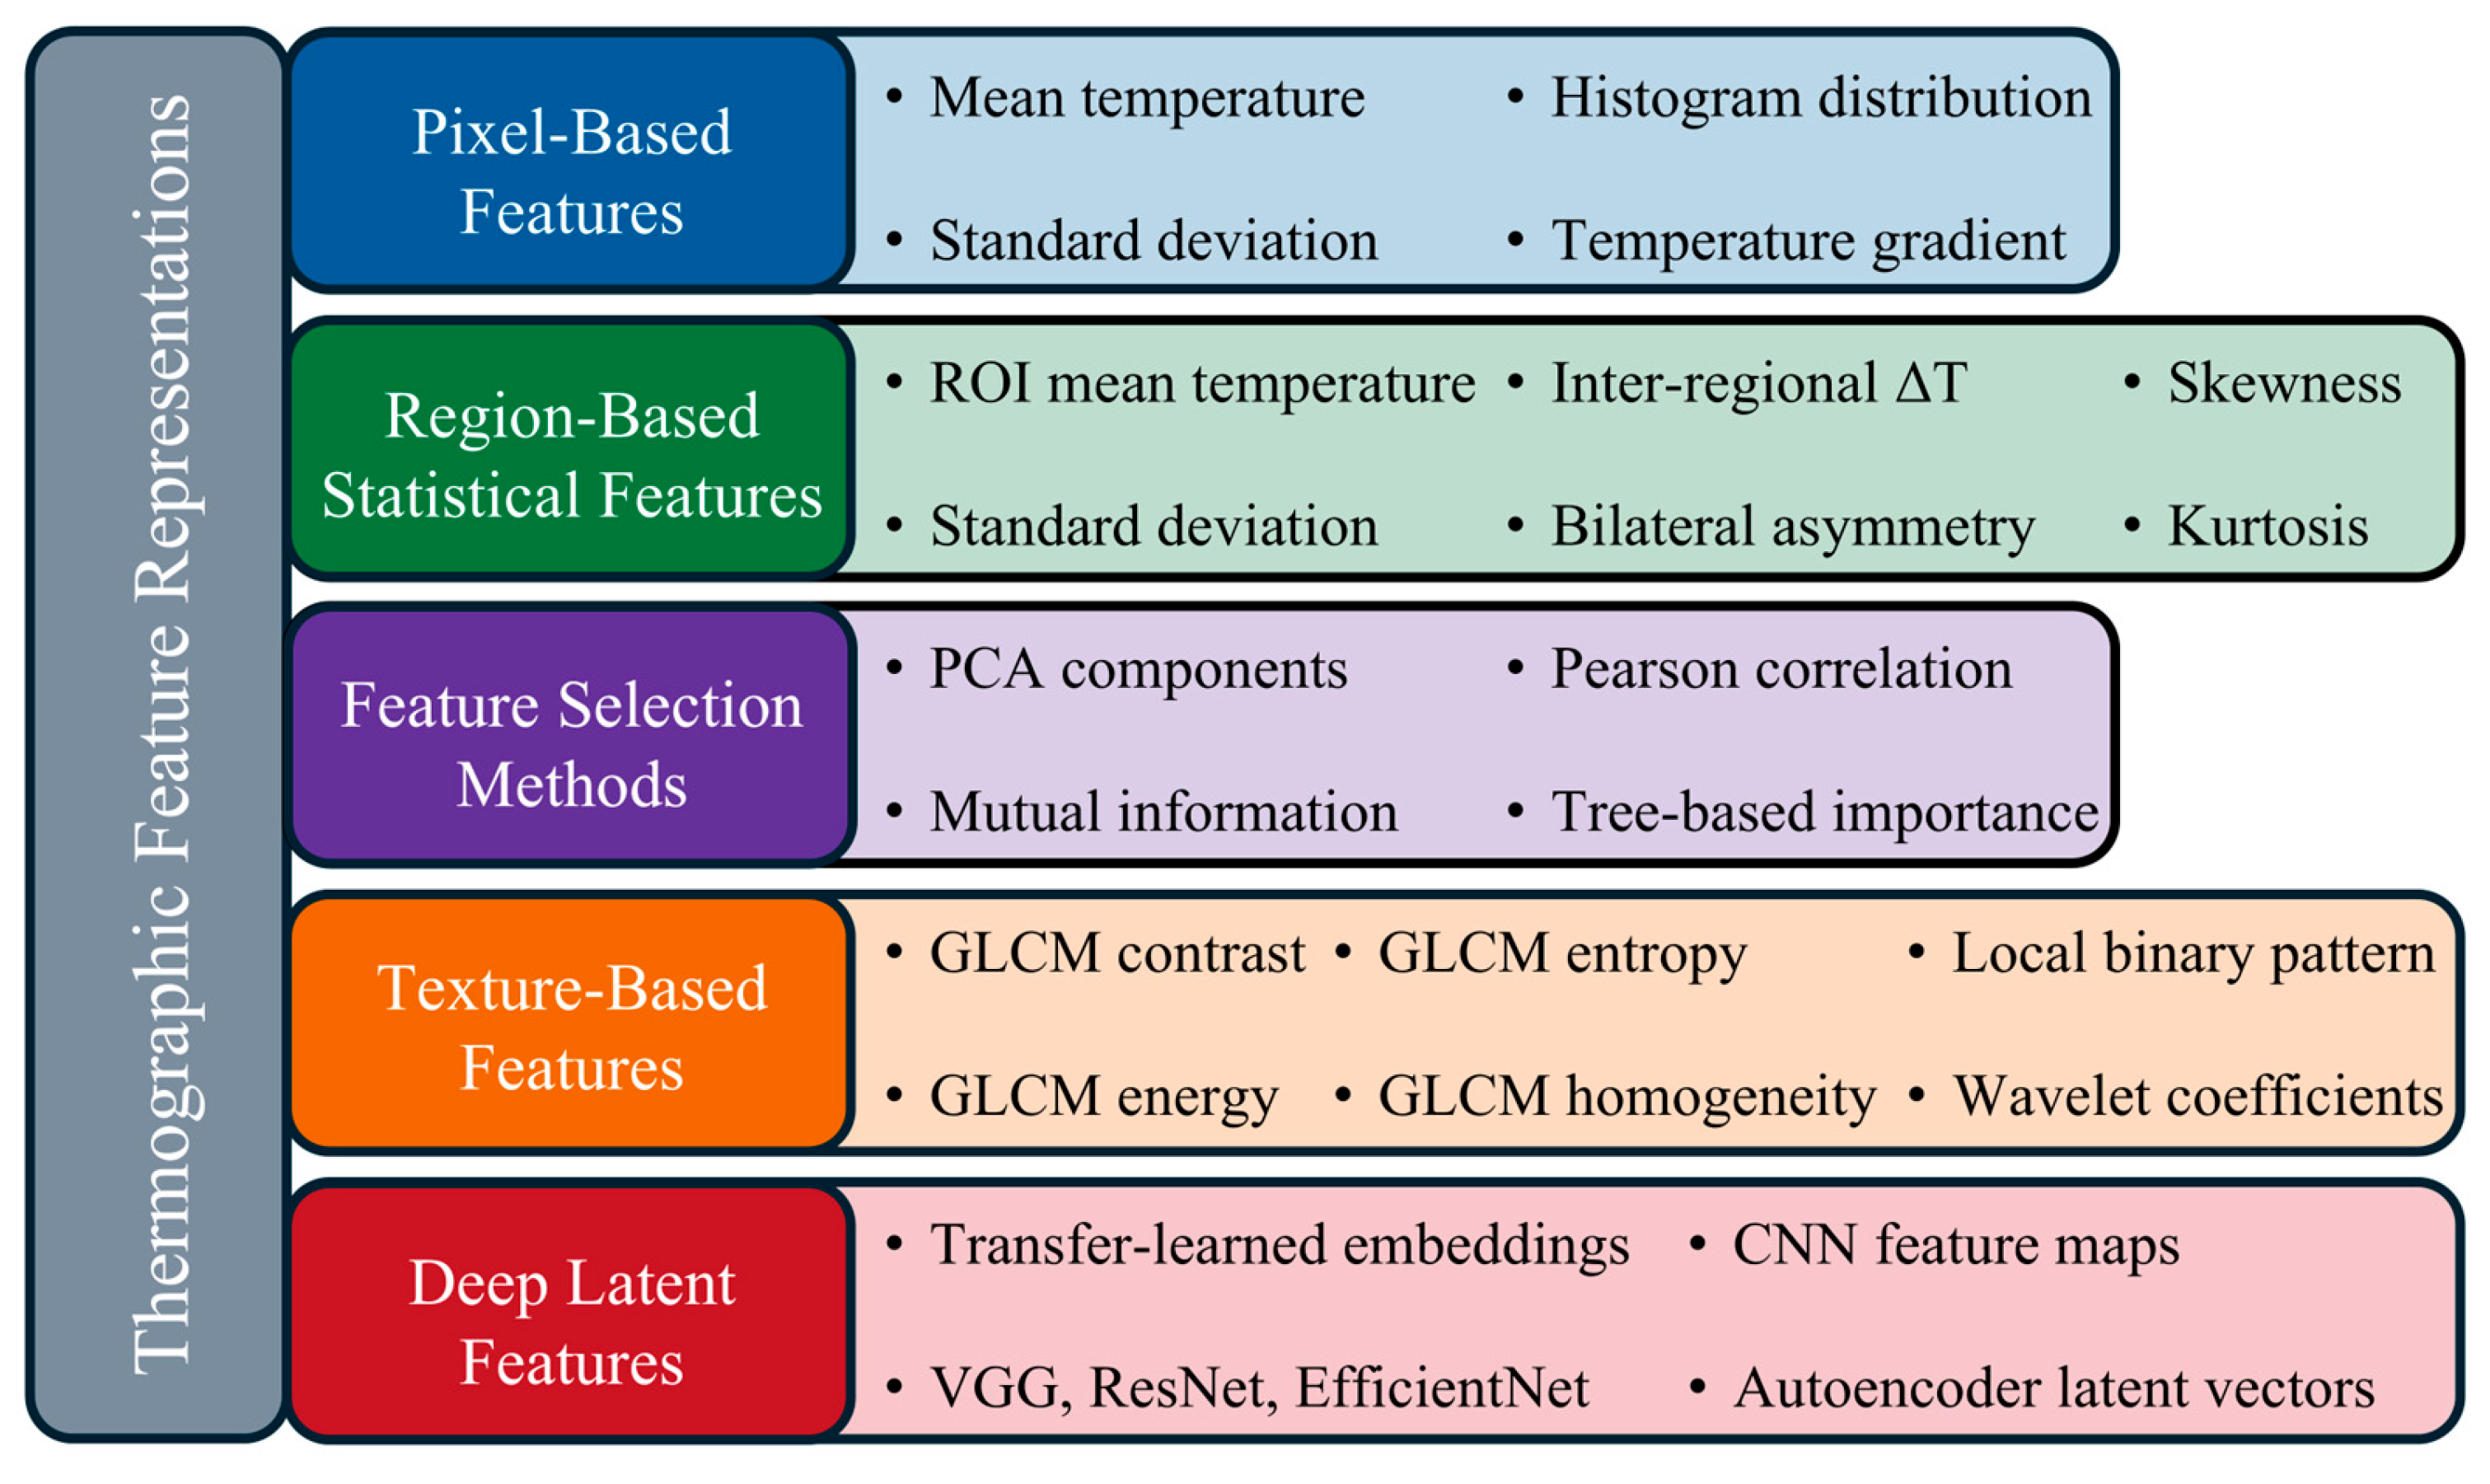
Thermographic images may be viewed as discretized measurements of a surface temperature field over an anatomical domain. For computational analysis, this field must be transformed into a representation that is suitable for statistical inference, machine learning, and physiological interpretation. The choice of representation is not a purely technical issue: it determines what thermal information is retained, what variability is suppressed, and whether the resulting descriptors can plausibly serve as interpretable biomarkers rather than merely predictive variables. In medical thermography, feature representations can be broadly grouped into pixel-level descriptors, region-level statistical descriptors, texture-based spatial descriptors, and learned latent representations. These classes differ in dimensionality, robustness to acquisition variability, anatomical interpretability, and suitability for explainable machine learning. Statistical features such as average temperature, standard deviation, median, maximum, minimum, skewness, kurtosis, and entropy are important for medical image analysis [54,55]. This section reviews these representations from a mathematical perspective, with emphasis on their relevance to interpretable thermal analysis and biomarker-oriented modeling.

3.1. Pixel-Based Features

Pixel-based features are the most direct descriptors of thermographic data because they are derived from temperature values at individual image locations. Let a thermographic image be represented by a discrete temperature field T ( x , y ) , where each pixel at a spatial coordinate ( x , y ) stores a surface temperature value. This pixel-level representation preserves the original thermal information and therefore provides the most basic mathematical description of temperature distribution, thermal variability, and local spatial change [56]. The simplest pixel-based descriptor is the mean temperature, which summarizes the overall thermal level of an image or an ROI:
T ¯ = 1 N p   i = 1 N p T i
where T i represents the temperature at pixel i , and N p is the total number of pixels in the ROI or image. Although the mean is useful as a global summary, it does not capture spatial heterogeneity. To quantify thermal variation, the standard deviation is commonly used:
σ T = 1 N p   i = 1 N p ( T i T ¯ ) 2
This measure reflects the dispersion of pixel temperatures and is useful for identifying thermally heterogeneous regions, which may correspond to irregular perfusion, inflammation, or other localized physiological disturbances. Histogram-based features provide a complementary description of the empirical temperature distribution. If n i denotes the number of pixels with the temperature level T i , the corresponding histogram probability is:
p ( T i ) = n i N p
Histogram representations describe the spread and shape of temperature values and can therefore capture distributional characteristics not reflected by the mean alone. Another important pixel-level descriptor is the temperature gradient magnitude:
| T | = ( T x ) 2 + ( T y ) 2
which measures the local rate of spatial temperature change. Gradient-based features are useful for detecting thermal boundaries, localized hot or cold transitions, and edge-like structures in thermographic images. Overall, pixel-based features form the foundation of thermographic feature analysis because they retain the original temperature information with minimal abstraction [57]. Their main advantage is descriptive fidelity; however, they are also sensitive to noise, registration error, and acquisition variability. For this reason, pixel-level descriptors are often most effective when used as a basis for more structured representations, including regional, texture-based, and learned features.

3.2. Region-Based Statistical Features

Region-based statistical features are widely used in medical thermography because many clinically relevant thermal changes are expressed at the level of anatomical regions rather than isolated pixels [58]. Instead of analyzing the full temperature field directly, thermographic studies often partition the body surface into ROIs, such as the face, chest, abdomen, back, extremities, or plantar foot, and compute summary statistics within each region [59]. This representation reduces dimensionality and facilitates physiological interpretation because the resulting descriptors can be linked more directly to blood perfusion, metabolic activity, and thermoregulatory function. For an ROI containing N pixels with temperatures T i , the regional mean temperature is calculated as per Equation (5). This provides a compact estimate of the average thermal level within an anatomical region and is commonly used to identify abnormal heating or cooling patterns. However, the regional mean alone may obscure focal abnormalities, especially when localized hot or cold spots are averaged over a large area. Regional temperature heterogeneity is therefore often characterized by the standard deviation [33], calculated as per Equation (6). Standard deviation reflects the spread of temperatures within the ROI. Standard deviation quantifies thermal-pattern variability within the ROI, while local temperature differences in medical thermography are influenced by perfusion and inflammatory processes; therefore, elevated SD may reflect heterogeneous perfusion or inflammatory involvement [60,61]. Higher-order moments provide additional information about the shape of the regional temperature distribution, like skewness which measures the distributional asymmetry:
S k e w n e s s   = 1 N p i = 1 N p ( T i T ¯ R O I σ R O I ) 3
Also, kurtosis describes the relative concentration of temperatures around the center:
K u r t o s i s   = 1 N p i = 1 N p ( T i T ¯ R O I σ R O I ) 4
Skewness and kurtosis help distinguish asymmetrical thermal patterns [62], but in practice, they are more sensitive to noise and sample size than mean-based summaries [63] and are therefore less consistently reported across studies. Asymmetry is calculated as:
Δ T   =   | T ¯ l e f t   T ¯ r i g h t |
Asymmetry-based descriptors are especially attractive in thermography because they partially normalize inter-subject variability by comparing anatomically matched regions within the same individual. For this reason, they are frequently used in breast thermography, diabetic foot assessment, vascular dysfunction analysis, and musculoskeletal applications [11,64]. Their reliability, however, depends strongly on accurate ROI matching and consistent posture during image acquisition. Temperature differences between non-symmetric anatomical regions may also be informative when the goal is to characterize broader heat-distribution patterns or thermoregulatory gradients [65]. For two regions R 1 and R 2 , this can be expressed as:
Δ T R O I =   T ¯ R O I 1   T ¯ R O I 2
Such measures may reflect systemic or regional physiological differences, but their interpretation is generally less standardized than bilateral asymmetry. Overall, region-based statistical features offer a useful compromise between interpretability and dimensionality reduction. Compared with pixel-level descriptors, they are more robust and more naturally aligned with physiological hypotheses. At the same time, they depend heavily on ROI definition, anatomical registration, and acquisition protocol, which limits cross-study comparability. For biomarker-oriented thermographic analysis, their main strength lies in anatomical interpretability; their main weakness is that poor region selection or inconsistent segmentation can substantially affect the resulting statistics.

3.3. Texture Features

Texture features characterize the spatial organization of temperature values in a thermographic image. Unlike pixel-level descriptors, which retain individual temperature measurements, or region-based statistics, which summarize thermal values within an ROI, texture features quantify how temperatures vary locally and how thermal patterns are spatially arranged [66]. This is particularly relevant in medical thermography because many pathological processes are expressed not only as absolute temperature shifts but also as altered thermal heterogeneity, irregular vascular patterns, or disrupted spatial symmetry.
Among the most widely used texture representations is the gray-level co-occurrence matrix (GLCM), which models the joint occurrence of neighboring temperature levels. For a given spatial offset, the matrix entry P ( i , j ) denotes the normalized frequency with which a pixel of quantized temperature level i occurs adjacent to a pixel of level j [67]:
P ( i , j ) = n ( i , j ) u v n ( u , v )
where n ( i , j ) is the number of such pixel pairs. From the GLCM, several second-order statistical descriptors can be derived. Contrast,
C o n t r a s t   = i j ( i j ) 2 P ( i , j )
measures local temperature variation and tends to increase in images with pronounced thermal discontinuities. Energy,
E n e r g y   = i j P ( i , j ) 2
reflects textural uniformity, whereas entropy,
E n t r o p y   = i j P ( i , j ) log P ( i , j )
quantifies randomness or structural complexity. Homogeneity
H o m o g e n e i t y   = i j P ( i , j ) 1 + | i j |
is higher when neighboring temperatures are similar and lower when abrupt thermal transitions are common. GLCM-based descriptors are attractive because they provide interpretable summaries of spatial thermal structure. However, they depend strongly on image quantization, spatial offset choice, ROI size, and preprocessing [68,69]. In thermography, where acquisition conditions and spatial resolution often vary, this sensitivity is a nontrivial limitation. Another commonly used texture operator is the local binary pattern (LBP), which encodes local microstructure by comparing each pixel with its neighbors [70]. The LBP code is defined as:
L B P   =   p = 0 P L B P 1 s ( T p   T c ) 2 p
where T c is the center-pixel temperature, T p are neighboring temperatures, and P L B P is the number of neighboring pixels used in the LBP operator.
s ( x ) = { 1 ,     x 0 0 ,     x < 0
LBP features are computationally simple and effective for capturing local thermal micro-patterns. Their main limitation is that they are sensitive to noise, describe highly local structure, and may miss broader temperature organization unless combined with regional or multiscale descriptors [71,72,73]. Wavelet-based features provide a multiscale representation of thermal texture by decomposing the image into components associated with different spatial frequencies [74]. In general form, the wavelet transform of a temperature signal may be written as:
W ( a , b ) =   T ( x ) ψ a , b ( x ) d x  
where ψ a , b denotes the wavelet basis function at scale a and position b . Such features are useful when clinically relevant thermal patterns occur at multiple spatial scales, as may happen in diffuse inflammation or vascular irregularity. At the same time, wavelet coefficients are usually less intuitive to interpret physiologically than regional statistics or asymmetry measures.
Overall, texture features extend thermographic analysis beyond average temperature and simple variability by capturing spatial irregularity, local organization, and multiscale structure. They are often more informative than first-order statistics when abnormalities manifest as patterned rather than purely scalar thermal change. Their main weakness is that they are more dependent on preprocessing choices and are generally less anatomically interpretable, which can reduce their value for robust biomarker identification unless they are combined with well-defined regional or explainable representations.

3.4. Feature Selection Methods

Thermographic analysis can generate a high-dimensional feature space composed of pixel-level descriptors, regional summaries, asymmetry measures, and texture features. In such settings, feature reduction is important for limiting redundancy and reducing overfitting, especially because thermographic datasets are often small [75,76,77]. This is particularly important in medical thermography, where datasets are often small and a feature that improves prediction is not necessarily a reliable physiological marker. One widely used dimensionality-reduction method is principal component analysis (PCA), which transforms the original feature set into orthogonal components that capture the dominant variance structure. For a feature matrix X, the features are first mean-centered to obtain the centered matrix X ~ :
C   = 1 N s 1 X ~ T X ~
where X ~ denotes the mean-centered feature matrix and N s is the number of samples. The principal components are then obtained from the eigenvalue problem C v = λ v , where v denotes an eigenvector and λ is its corresponding eigenvalue. PCA is useful for compressing correlated thermal descriptors into a lower-dimensional representation; it should be interpreted cautiously in biomarker-oriented studies, because components that explain large statistical variance do not necessarily correspond to physiologically meaningful variation [78]. A more direct relevance measure is mutual information, which quantifies statistical dependence between a feature X and an outcome Y [79]:
I ( X ; Y ) =   x y p ( x , y ) log ( p ( x , y ) ( p ( x ) p ( y ) ) )
where p ( x , y ) is the joint probability distribution of feature X and target variable Y , and p ( x ) and p ( y ) are marginal probability distributions. Mutual information can capture nonlinear dependence, but in small thermographic datasets, its estimation may be unstable, especially when features are continuous, and sample sizes are limited [80]. The Pearson correlation coefficient between a feature X and target Y is given by:
r   =   ( X i X ¯ ) ( Y i Y ¯ )   ( X i X ¯ ) 2 ( Y i Y ¯ ) 2
This approach is simple and interpretable, but it measures only linear association and may miss features that are informative in a nonlinear or interaction-dependent manner [81]. In addition, highly correlated features can produce unstable rankings when used in isolation. Model-based importance measures provide another route to feature selection. Tree-based methods such as Random Forest, Gradient Boosting, and XGBoost estimate feature relevance according to the contribution of each variable for prediction across the ensemble [75]. A generic average importance score for feature j can be written as:
F I j = 1 M m = 1 M I m p o r t a n c e j , m
where M is the number of trees. These methods are useful because they account for nonlinear structure and interactions, but their importance scores are model-dependent and can be biased toward features with greater variability or more split opportunities.
Overall, feature selection in thermography should be viewed as a tradeoff between predictive utility and physiological interpretability. Methods such as PCA can reduce dimensionality, relevance measures such as mutual information and correlation can rank associations, and ensemble models can identify influential variables under nonlinear prediction settings. However, no selection method by itself establishes biomarker validity. For thermal biomarker discovery, selected features should ideally be not only predictive but also anatomically interpretable and robust to acquisition variability. Table 2 summarizes and compares representative feature selection and deep feature extraction methods in terms of their strengths, weaknesses, and applicability in medical thermography.

3.5. Deep Feature Extraction

Deep feature extraction refers to the automatic learning of image representations by deep neural networks, including CNNs, autoencoders, and transfer-learning models. Unlike handcrafted descriptors, which are explicitly defined in terms of temperature statistics or spatial texture, deep models learn hierarchical representations directly from thermographic data. These learned features (latent representations) can capture complex spatial temperature organization that may be difficult to describe using predefined feature formulas [82]. CNN-based representations are among the most widely used deep features in medical image analysis. A convolution layer applies learnable kernels to the input image to generate feature maps, which can be written as:
F ( x , y ) =   m n I ( x + m ,   y + n ) K ( m , n )
where I ( x , y ) is the input thermogram, K ( m , n ) is the convolution kernel, and F ( x , y ) is the resulting feature map. In thermographic applications, these maps encode local thermal gradients, spatial asymmetry, and higher-order temperature structures. As network depth increases, the learned representation becomes progressively more abstract, potentially capturing complex thermal signatures associated with physiological and pathological states [83]. Autoencoders provide another form of learned representation by compressing the input image into a low-dimensional latent space [84]. A simple encoding step may be written as:
z   =   f ( W x + b )
where z represents the latent feature vector, W is the weight matrix, b is the bias vector, and f ( ) is the nonlinear activation function. Such latent features are useful for dimensionality reduction, clustering, anomaly detection, and downstream prediction tasks. However, they are often difficult to interpret anatomically and physiologically without additional analysis.
Transfer learning is especially relevant in thermography because available datasets are often too small to support stable training of deep networks from scratch. In this setting, pretrained models are used as generic feature extractors and then adapted to thermographic tasks through fine-tuning or feature reuse [85]. This strategy can improve predictive performance because features learned from natural-image datasets may not be well aligned with the physical and physiological characteristics of thermal images [86]. The main advantage of deep feature extraction is representational flexibility. However, deep features are typically less interpretable, more dependent on dataset size and preprocessing choices, and more vulnerable to overfitting and dataset-specific artifacts [87,88]. In thermography, where acquisition protocols, camera characteristics, and environmental conditions vary substantially, such sensitivity can limit generalizability and weaken claims of biomarker discovery.
Overall, deep feature extraction has expanded the scope of thermographic analysis by enabling data-driven learning of complex thermal patterns. Nevertheless, deep representations are most convincing in biomarker-oriented studies when they are combined with explainability methods or linked back to anatomically meaningful and physiologically plausible thermal structures. Figure 2 schematically summarizes the major thermographic feature classes and representative feature names discussed in this section, while Table 3 compares these feature representations in terms of information content, strengths, weaknesses, interpretability, robustness to protocol variability, and biomarker potential.

4. Machine Learning and Deep Learning in Medical Thermography

4.1. Conventional Machine Learning

Conventional machine learning remains important in medical thermography [89], particularly when studies rely on handcrafted thermal descriptors such as regional temperature statistics, asymmetry indices, and texture features. Conventional models often offer better interpretability, especially when the analysis is based on engineered features [90]. However, their outcomes should not be judged by predictive accuracy alone, since thermographic features may reflect acquisition conditions as well as underlying physiology. Among these methods, support vector machine (SVM) is widely used in thermographic analysis and has shown good performance in small-sample, feature-based settings [27], applied to tasks such as abnormal pattern detection, breast thermography classification, and diabetic-foot screening. However, its performance depends strongly on feature scaling, kernel choice, and parameter tuning [91]. Tree-based methods such as Random Forest and gradient boosting models can capture nonlinear relationships and provide feature-importance estimates [92]. Nevertheless, feature importance should be interpreted cautiously, since influential variables in a predictive model are not necessarily robust or clinically valid biomarkers. Logistic regression remains useful when interpretability is prioritized, because its coefficients can be directly related to input predictors and their association with the outcome [93]. Its limitation is that thermal patterns are often nonlinear and complex, which may reduce model expressiveness. K-nearest neighbors has also been used in thermographic classification, but it is more sensitive to feature scaling, noise, and irrelevant variables, which may limit robustness in heterogeneous datasets [94]. Conventional regression models are additionally used to predict continuous variables such as age, physiological parameters, or disease-risk scores from thermal features [5]. These approaches are relevant in ageing-related thermography and quantitative risk assessment. Overall, conventional machine learning provides a useful framework for analyzing structured thermal features and prioritizing candidate markers; however, biomarker-oriented claims require further evidence of physiological plausibility and external validity.

4.2. Deep Learning Methods

Deep learning has expanded medical thermography by enabling models to learn thermal patterns directly from images rather than relying only on handcrafted descriptors. This is particularly useful when clinically relevant information is distributed across complex spatial structures, such as local hot spots, bilateral asymmetry, and diffuse temperature heterogeneity [95]. In comparison with conventional machine learning, deep models can capture richer image-level representations, but their performance is often constrained by small datasets, protocol variability, and limited interpretability in clinical settings [96].
CNNs are the most widely used deep-learning models in thermography because they are well-suited to spatial temperature maps. They can learn both local and global thermal patterns associated with abnormalities such as inflammation, vascular dysfunction, tumor-related hyperthermia, and diabetic-foot risk [97]. Their main advantage is representational flexibility, since they can detect image features that are difficult to summarize using regional statistics or texture measures alone [98]. However, CNNs typically require careful preprocessing and sufficiently large training datasets, as their performance is sensitive to data preparation and often limited by data scarcity in medical imaging [99,100]. Autoencoder-based models have mainly been used for unsupervised feature learning and anomaly detection [101]. By compressing thermograms into latent representations and reconstructing the input image, they can identify unusual thermal patterns even when labeled data are limited [102]. Their main limitation, however, is that latent features and reconstruction errors are often difficult to interpret in physiologically or clinically meaningful terms, which may reduce their direct value for biomarker-oriented analysis [103]. Transfer learning is especially important in thermography because available medical thermal datasets are often too limited to support stable deep training from scratch [104]. Pretrained architectures such as VGG, ResNet, and EfficientNet are therefore commonly adapted to thermal images [105]. While this strategy often improves predictive performance, it should be interpreted cautiously: models pretrained on natural images may learn generic spatial features that are not fully aligned with the physical and physiological structure of thermal data, leading to domain mismatch effects [106,107]. As a result, transfer learning improves practical performance but not automatically interpretability or generalizability. Vision Transformers and attention-based models offer a different perspective by modeling longer-range relationships across image regions. This may be useful in thermography when diagnosis depends not only on focal abnormalities but also on broader temperature organization across anatomical regions. However, their application in medical thermography is still emerging, and their greater complexity may further increase demands for data, validation, and explainability [108].
Overall, deep learning has increased the representational power of thermographic analysis, but its main weakness remains the gap between predictive success and clinical interpretability. In this context, deep models are most convincing when combined with explainability methods, rigorous validation, and evidence that highlighted thermal regions are stable, physiologically plausible, and reproducible across datasets. Thus, deep learning should be viewed not as a direct route to biomarker discovery, but as a powerful feature-learning framework whose outputs require careful interpretation before clinical significance can be claimed.

4.3. Performance Metrics

Performance evaluation in medical thermography should be aligned with the clinical task rather than reported as a generic measure of model quality. For classification tasks such as disease detection or abnormal-pattern screening, commonly used metrics include accuracy, precision, recall, and F1-score. Among these, accuracy alone is often insufficient because thermographic datasets are frequently imbalanced, with abnormal cases underrepresented. In such settings, recall is particularly important for screening applications, since missed abnormal cases may have greater clinical consequences than false alarms, whereas precision becomes important when unnecessary follow-up should be minimized. The F1-score is useful when a balance between false positives and false negatives is needed. Accuracy, precision, recall, and F1-score are defined as [109]:
A c c u r a c y   = ( T P   +   T N ) ( T P   +   T N   +   F P   +   F N )
P r e c i s i o n = T P ( T P + F P )
R e c a l l = T P T P + F N
F 1 s c o r e = 2 × ( P r e c i s i o n × R e c a l l ) ( P r e c i s i o n + R e c a l l )
For regression tasks, including age estimation, physiological-parameter prediction, and risk-score modeling, commonly reported metrics are mean absolute error (MAE), root mean square error (RMSE), and the coefficient of determination ( R 2 ) [5]. MAE reflects average prediction error, RMSE penalizes larger deviations more strongly, and R 2 indicates the proportion of variance explained by the model. These metrics are useful in thermographic studies that aim to estimate continuous health-related variables from thermal features or image-derived representations:
M A E   = 1 n i = 1 n | y i   y ^ i   |  
R M S E = 1 n i = 1 n ( y i y ^ i ) 2
R 2 = 1 i = 1 n ( y i y ^ i ) 2 i = 1 n ( y i y - ) 2
In medical thermography, reported results may be influenced by small sample size, class imbalance, acquisition variability, and limited external validation [29,110]. For this reason, model evaluation should be interpreted together with robustness, generalizability, and interpretability rather than as performance alone. This limitation has motivated increasing use of explainable AI methods, which help relate model outputs to specific thermal regions and features and are therefore essential for clinically meaningful thermographic analysis.

4.4. Applications

Machine learning and deep learning have broadened the role of medical thermography from simple temperature visualization to disease screening, physiological assessment, risk prediction, and ageing-related analysis, as reflected by studies such as [5,12,28]. In some settings, thermographs reveal abnormal heat signatures before structural abnormalities become evident by other imaging modalities, although the significance of such findings remains context-dependent, as supported by primary studies including [13,49,111]. However, the clinical significance of these applications depends not only on predictive performance, but also on physiological interpretability. Table 4 summarizes representative clinical and physiological application domains of medical thermography, their typical thermographic targets, commonly used feature types, learning tasks, modeling approaches, interpretability relevance, and key limitations.
Breast thermography is among the most extensively studied applications, with machine-learning models developed to classify normal and abnormal thermograms using regional statistics, asymmetry measures, texture descriptors, and deep features [12,26,27,31,32,77]. This interest is motivated by the possibility that tumor-related angiogenesis and metabolic activity may alter local heat distribution, which is consistent with the thermal abnormalities reported in these breast-thermography studies. Even so, thermography is best viewed as a complementary screening modality rather than a standalone diagnostic tool, because thermal patterns are sensitive to environmental conditions, patient preparation, and non-cancer-related physiological variation [13,14,28,33,35,36,89,111]. In these settings, the most informative signals often include contralateral asymmetry, regional temperature elevation, and abnormal spatial distribution patterns [50,112,113].
Table 5 summarizes representative deep-learning approaches applied to medical thermography, including CNN-based classifiers, transfer-learning models, attention-based networks, segmentation architectures, multimodal fusion models, and emerging approaches such as Capsule Networks and Spiking Neural Networks. These methods can automatically learn discriminative thermal patterns and have been applied across breast cancer, diabetic foot, thyroid disorders, arthritis, pressure injuries, and physiological monitoring. However, their clinical translation remains limited by small datasets, computational complexity, protocol variability, reduced interpretability, and limited external validation.
Beyond these, thermography is increasingly being used for regression-based tasks such as risk prediction, physiological-status estimation, and ageing-related assessment [5], which linked facial thermal patterns to ageing and metabolic disease. These applications are especially relevant when thermal features are treated as continuous indicators of health status rather than binary disease markers. However, they require careful validation, because accurate prediction does not necessarily imply that the learned thermal features represent stable biological markers [4,7,8]. An emerging direction is thermal biomarker discovery, where the goal is not only to classify or predict, but also to identify thermal regions or features that are physiologically meaningful [5,57,140]. This is where explainable machine learning becomes especially important, because model-highlighted regions may help prioritize candidate markers, although biomarker claims still require robustness across datasets, plausible physiological interpretation, and evidence of clinical relevance.

5. Explainable Machine Learning in Medical Thermography

5.1. Need for Explainable AI in Medical Imaging

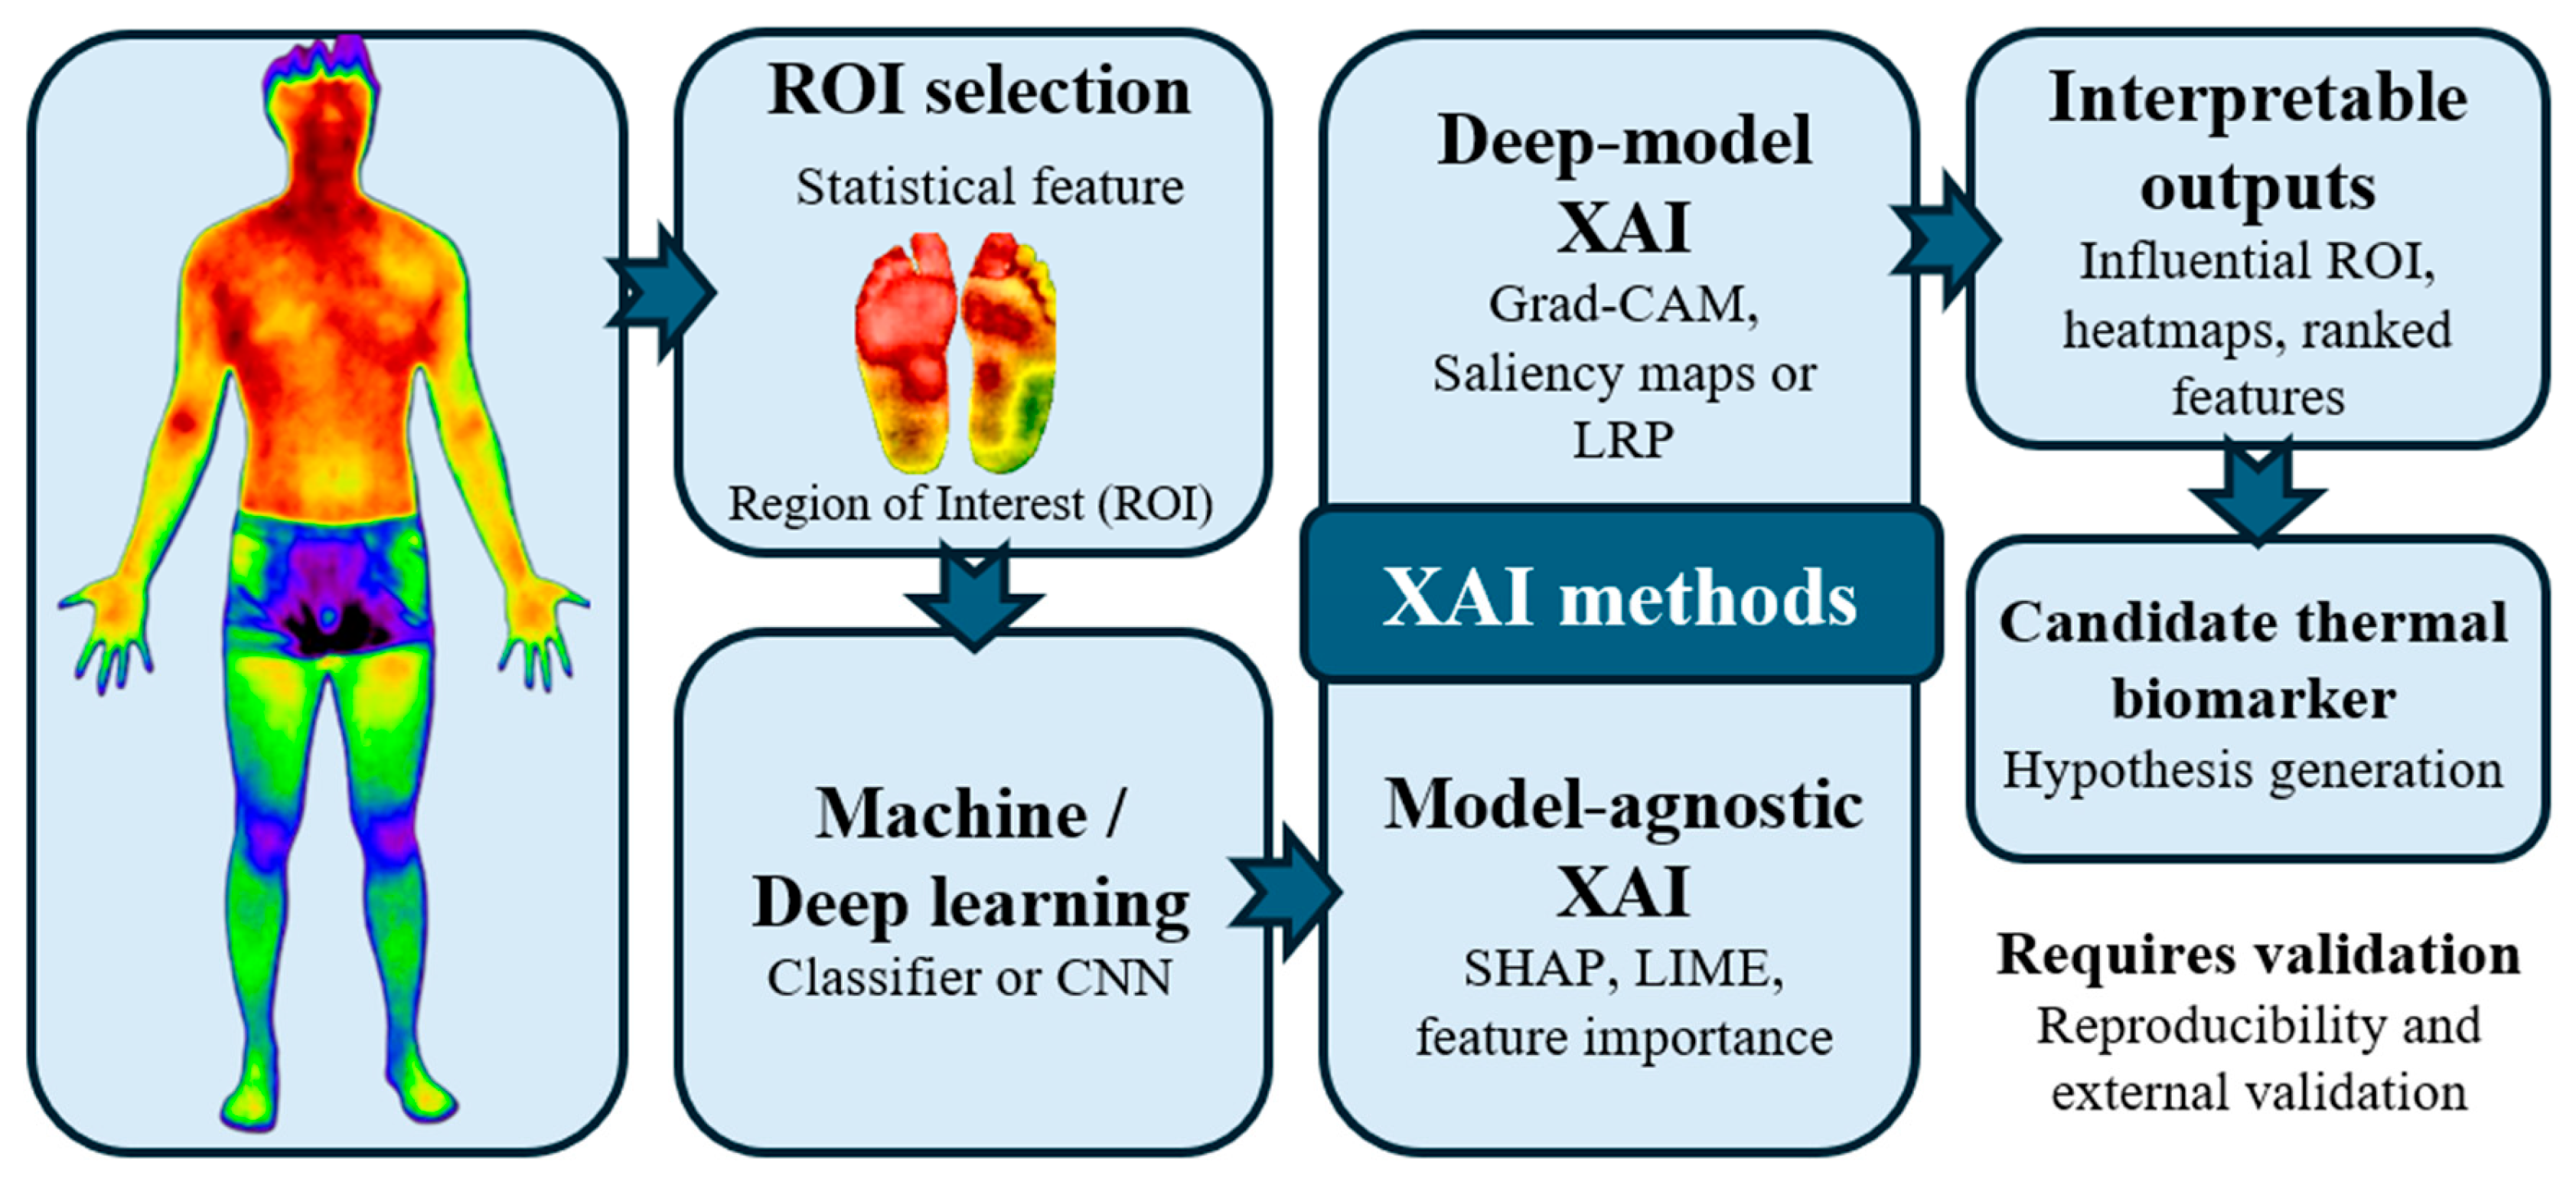
Explainable AI is particularly important in medical thermography because thermal models often learn from patterns that are physiologically plausible but also sensitive to acquisition conditions, subject preparation, and environmental variability. Clinicians must also know whether a model is responding to meaningful thermal physiology, such as asymmetry, inflammation, or perfusion change, rather than to noise, background artifacts, or protocol-specific bias [110,141]. This problem is especially relevant in thermography, where temperature distributions can be altered by room conditions, camera settings, and patient posture, as well as by disease. In this context, explainability serves two purposes. First, it improves transparency by identifying which features, regions, or thermal patterns influence a prediction. Second, it provides a mechanism for judging whether those signals are anatomically and physiologically credible. This is essential for clinical trust and scientific interpretation, as a model predicting disease or age accurately does not necessarily identify a valid thermal marker. Explainable methods, therefore, help bridge the gap between prediction and interpretation, although they should not be mistaken for validation in themselves [140]. For medical thermography, the value of explainability lies not simply in making models more understandable, but in testing whether model behavior is consistent with thermal physiology and robust enough to support biomarker-oriented analysis. This is why explainable machine learning has become a central component of trustworthy thermographic AI. Figure 3 summarizes a representative explainable machine-learning workflow in medical thermography, illustrating how thermographic data can be transformed into interpretable outputs and candidate thermal biomarker hypotheses through ROI-based analysis, predictive modeling, and explainability methods.

5.2. Model-Agnostic Explainability Methods

Model-agnostic explainability methods are especially useful in medical thermography because they can be applied across diverse predictive models, including support vector machines, tree-based ensembles, and deep networks [110,142]. Their main advantage is flexibility: they allow thermal features, anatomical regions, or image-derived variables to be interpreted without depending on the internal structure of the model. In thermography, this is valuable because predictive pipelines often combine heterogeneous feature types, such as regional temperature statistics, asymmetry measures, texture descriptors, and learned representations. Yet their interpretive value depends on stability and context, not on visual appeal alone. Among these methods, SHAP is widely used because it provides feature-level attributions that can be aggregated across individuals or examined for specific predictions [110]. In thermographic studies, SHAP can help identify whether variables such as regional temperature elevation, bilateral asymmetry, or texture irregularity contribute positively or negatively to disease classification, age estimation, or risk prediction. This makes it useful for linking model outputs to plausible physiological patterns. However, SHAP values should be interpreted cautiously: they explain model behavior, not causal physiology, and the results may vary with model specification, feature dependence, and background-reference choices. LIME serves a different purpose by approximating a complex model locally around a single prediction [57]. In thermography, this can be helpful for case-based interpretation, especially when clinicians need to understand why a specific subject was classified as abnormal or high risk. Its limitation is that local explanations may be unstable and sensitive to the perturbation strategy used to generate the surrogate model. For this reason, LIME is often more useful for illustrative interpretation than for establishing robust thermal markers [57,143]. Feature-importance rankings from tree-based models are also common because they provide a simple summary of influential predictors [75,144]. These rankings can help prioritize candidate thermal regions or descriptors for further study, but they are not sufficient evidence of biomarker validity. Importance scores may be biased, model-dependent, and unstable across resampling or dataset shifts. In thermography, where acquisition variability and small sample size are common, this limitation is particularly important.
Overall, model-agnostic explainability methods are valuable in thermography because they help translate predictive outputs into interpretable thermal signals. Their main strength is comparative flexibility across models; their main weakness is that explanation can easily be overread as validation. Accordingly, these methods are most useful when they are treated as tools for prioritizing candidate features and regions, not as standalone evidence that a thermal pattern is a clinically meaningful biomarker. Table 6 summarizes the principal explainability methods relevant to medical thermography, including their typical inputs, outputs, strengths, limitations, and appropriate roles in biomarker-oriented analysis.

5.3. Deep Learning Explainability Methods

Deep learning explainability methods are essential in medical thermography because image-based models can achieve strong predictive performance while offering limited insight into which thermal structures actually drive the output. This is a particular concern in thermography, where spatial temperature patterns may reflect true physiology, acquisition artifacts, or background bias. The main purpose of deep explainability is therefore not only to visualize model attention, but also to assess whether the model is responding to anatomically and physiologically credible thermal information. Grad-CAM is among the most widely used methods for CNNs because it produces class-specific heatmaps that localize influential image regions [140,145,146]. In thermography, these maps can highlight asymmetry, focal hot spots, or abnormal regional temperature distributions associated with disease classification or age-related analysis. Its main advantage is intuitive visualization, but the maps are often coarse and should not be interpreted as precise evidence of pathological localization.
Saliency maps and layer-wise relevance propagation (LRP) provide higher-resolution attribution at the pixel level [147,148,149,150,154,155,156,157,158]. In principle, this can reveal finer thermal boundaries or distributed temperature patterns that affect prediction. However, these methods are often sensitive to model architecture, input perturbation, and noise, which can reduce their stability and make visual patterns appear more reliable than reality. In thermography, this limitation is important because subtle temperature differences may already be close to the level of acquisition variability. Attention maps from Vision Transformers and related architectures offer a broader view by showing which image regions interact most strongly during prediction [154,155,156,157,158]. This may be useful when thermographic interpretation depends on global temperature organization across multiple anatomical regions rather than on a single focal abnormality. Even so, attention should not automatically be treated as explanation, since regions receiving strong attention are not always the same regions that causally drive the model output.
Overall, deep learning explainability methods are valuable in thermography because they help test whether image-based models are using plausible thermal structure rather than irrelevant visual cues. Their main strength is visual interpretability; their main weakness is that visually convincing heatmaps can still be unstable, coarse, or misleading. For this reason, these methods are most informative when used alongside quantitative validation, anatomical reasoning, and cross-subject consistency analysis rather than as standalone evidence of thermal biomarker relevance.

5.4. Explainability for Biomarker Discovery

Explainable machine learning can support thermal biomarker discovery by identifying features, regions, and spatial patterns that consistently influence prediction. In medical thermography, this is valuable because disease classification, physiological assessment, and age estimation are often driven by complex temperature distributions rather than by a single scalar measurement. Methods such as SHAP, feature-importance analysis, Grad-CAM, and attention mapping can therefore help prioritize candidate thermal signals for further study [110,141]. Its contribution, however, should be interpreted carefully. An explainable model identifies patterns that are important to the model. For a thermal feature to be considered a plausible biomarker, it should also be reproducible across subjects and acquisition settings, anatomically consistent, physiologically interpretable, and clinically relevant. This distinction is essential in thermography, where highlighted regions may reflect protocol effects, image artifacts, or nonspecific thermal variation as well as disease-related physiology.
Even with this limitation, explainability provides an important intermediate step between prediction and biomarker research. It can reveal whether model-relevant signals correspond to plausible mechanisms such as altered perfusion, inflammation, impaired thermoregulation, or age-related changes in tissue and circulation. It can also help determine whether recurring patterns, such as bilateral asymmetry, focal hot spots, or region-specific cooling, are consistently associated with specific clinical or physiological states. In this sense, explainability is most valuable not as proof of biomarker validity, but as a framework for generating and refining biomarker hypotheses. This role is particularly important in ageing-related thermography, where models may detect distributed thermal changes linked to circulation, metabolism, and thermoregulatory decline. Explainable methods can help localize which body regions and thermal patterns contribute most strongly to age prediction, but these findings require independent validation before they can be interpreted as ageing biomarkers. Thus, the main value of explainability in thermography is to narrow the search space for meaningful thermal markers while imposing a more interpretable path from model output to physiological inference.

6. Thermal Biomarkers and Ageing Analysis

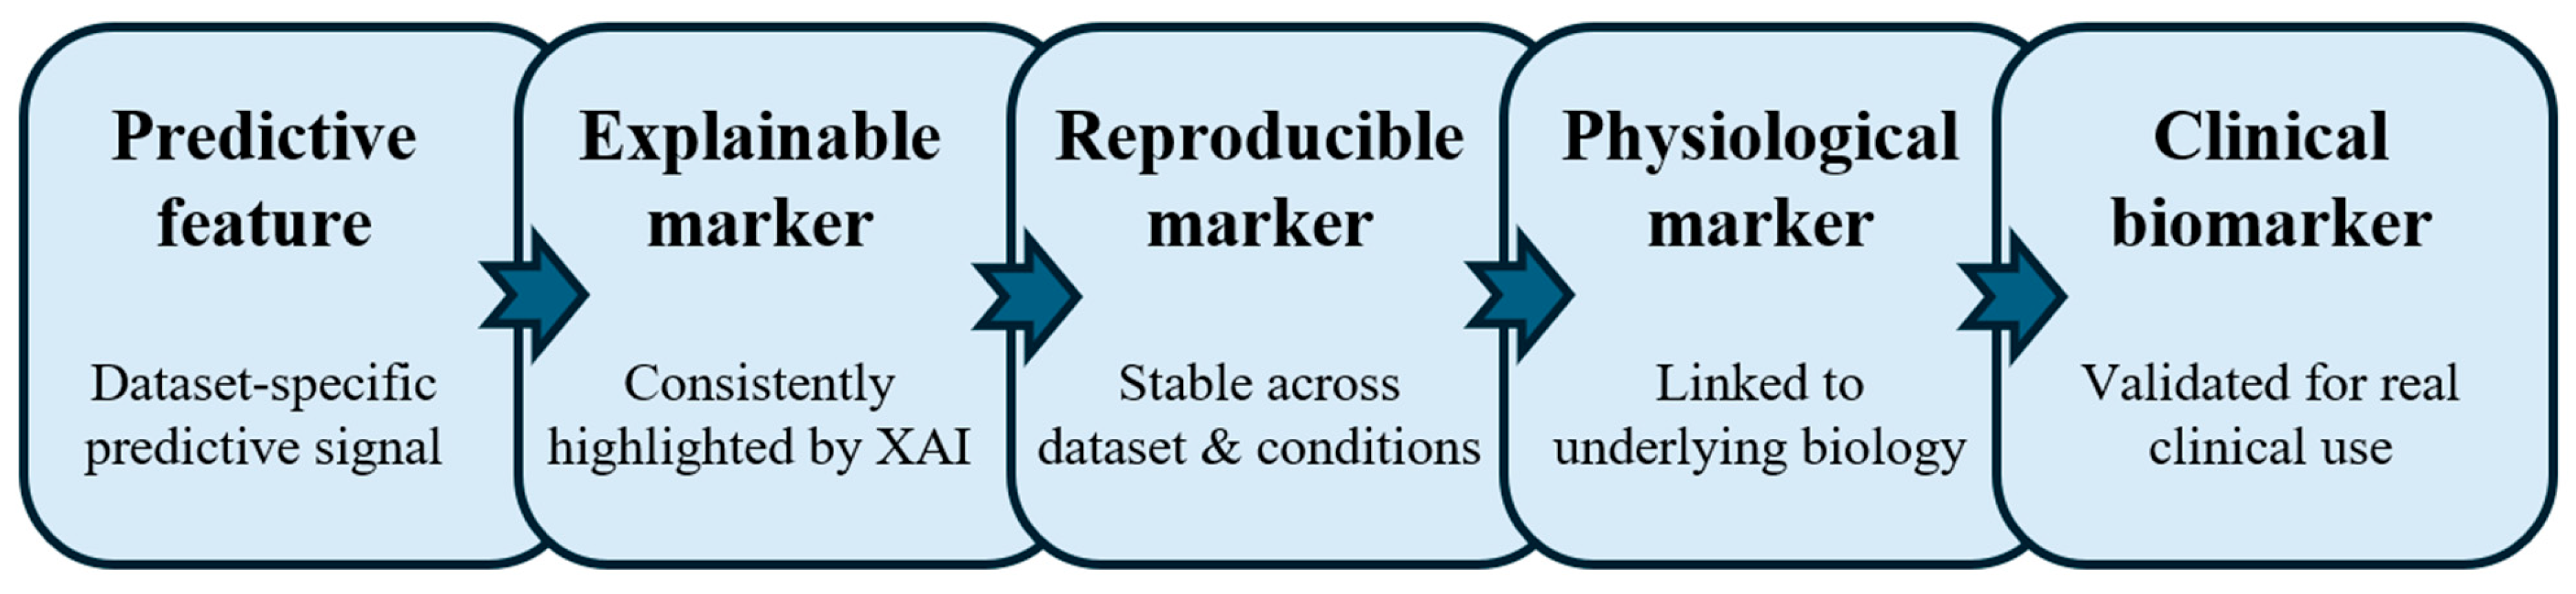
Thermal biomarkers in medical thermography are quantitative temperature-derived features. Examples include regional temperature statistics, bilateral asymmetry, spatial distribution patterns, and other image-derived thermal descriptors. Their importance has increased with the use of machine learning and explainable AI, which can help identify model-relevant thermal signals. This section, therefore, examines thermal biomarkers from a more critical perspective, with particular emphasis on their role in disease assessment and ageing-related thermographic analysis. Figure 4 presents a conceptual translational maturity pathway for thermal biomarkers in medical thermography, illustrating the progression from predictive thermal features to clinically validated biomarkers.

6.1. Biomarkers vs. Imaging Biomarkers

A biomarker is a measurable indicator of a biological process, disease state, or treatment response. Traditional biomarkers are often obtained from blood, genetic, or biochemical assays, whereas imaging biomarkers are quantitative features extracted non-invasively from medical images [1,3]. Their clinical value lies not only in measurability but also in usefulness for diagnosis, monitoring, or risk assessment [2]. Therefore, thermographic features can be viewed as candidate imaging biomarkers. Examples include regional temperature statistics, bilateral asymmetry, and other structured thermal descriptors derived from the image. To have biomarker relevance, it should also demonstrate stability across acquisition conditions, plausible physiological interpretation, and potential clinical value beyond a single predictive model [4,6]. This distinction is especially important in medical thermography, where image-derived signals may reflect both biological variation and protocol-dependent effects. For that reason, thermal imaging biomarkers are best understood not as any temperature-based feature, but as a narrower class of interpretable thermal measures with demonstrated physiological and clinical significance.

6.2. Biological Age vs. Chronological Age

Chronological age measures time lived, whereas biological age reflects the functional state of the body and may vary substantially among individuals of the same chronological age. For this reason, biological age is often considered more informative for health assessment and disease risk than age alone [159]. It is commonly estimated using biomarkers linked to processes such as metabolism, inflammation, cardiovascular function, and tissue ageing. Thermography is potentially relevant in this context because skin-temperature patterns are influenced by circulation, metabolic heat production, and thermoregulatory control, all of which may change with ageing [5]. This creates the possibility that thermal features could serve as non-invasive indicators of physiological ageing. However, age-related thermal differences may also be affected by participant emotion, sex, body composition, environment, medication, and health status [160,161,162]. Therefore, age prediction from thermograms does not automatically imply measurement of biological ageing. Accordingly, the value of thermographic ageing analysis lies not simply in estimating age, but in determining whether the extracted thermal patterns capture stable and physiologically meaningful aspects of ageing rather than cohort-specific or protocol-dependent variation [5].

6.3. Thermal Biomarkers

Thermal biomarkers in medical thermography are quantitative image-derived temperature features that may reflect underlying physiology. Their appeal lies in being non-invasive and spatially informative. Bilateral temperature asymmetry is one of the most widely studied candidates, since healthy contralateral regions are often expected to show approximate thermal symmetry. Marked asymmetry may indicate inflammation, vascular impairment, nerve dysfunction, or musculoskeletal abnormality [112]. Its strength is internal normalization within the same subject, but its reliability depends on accurate anatomical matching and controlled acquisition conditions. A second class includes vascular-related thermal patterns, in which elevated or reduced temperature may reflect altered blood perfusion [111,163]. These patterns are physiologically plausible because circulation is a major determinant of skin temperature, yet they are not necessarily disease-specific. Similarly, localized hot spots may reflect local inflammation, injuries, or insect bites, but such findings must be interpreted cautiously because multiple processes can produce similar thermal signatures [113]. Regional temperature differences also have biomarker potential, particularly when body areas with distinct thermoregulatory or vascular characteristics are compared systematically. In addition, age-related thermal distributions may provide candidate markers of physiological ageing, especially in peripheral regions where circulatory and thermoregulatory changes are more evident. Even so, these ageing-related signals remain vulnerable to confounding by environment, body composition, sex, and health status [5].
Overall, the most credible thermal biomarkers are not simply those that differ between groups, but those that remain stable across measurements, map to plausible physiological mechanisms, and retain interpretive value across populations and protocols. In this sense, thermal biomarkers should be treated as a graded concept: many thermal features are candidate indicators, but relatively few can yet be regarded as robust biomarkers in the stricter clinical sense.

6.4. Clinical Significance of Thermal Biomarkers

Beyond ageing analysis, thermal biomarkers have significant potential across a range of clinical applications, including fever screening, inflammation assessment, and diabetes-related risk evaluation. In fever screening, facial or forehead skin temperature can be used as a non-contact indicator of elevated body temperature, with regional mean temperature and spatial temperature distribution serving as candidate thermal biomarkers for identifying febrile individuals in screening settings [15]. However, measurement accuracy depends strongly on the selected measurement site, camera calibration, environmental conditions, and acquisition protocol [9]. In inflammatory conditions, localized temperature elevation and increased regional temperature asymmetry are among the most physiologically interpretable thermal signals. Increased perfusion and metabolic activity associated with acute or chronic inflammation may produce hot spots and disrupted thermal symmetry, which can be quantified using regional statistics, asymmetry measures, and texture descriptors [16,49]. Such thermal patterns have been studied in rheumatic diseases, musculoskeletal injury, and dermatological conditions, where they may complement clinical assessment or support monitoring of disease activity and treatment response [17,49]. In diabetes-related applications, plantar thermography has been widely investigated for diabetic-foot risk assessment. Bilateral plantar temperature asymmetry, regional temperature elevation, and localized hot spots have been proposed as candidate thermal biomarkers for diabetic peripheral neuropathy, ulcer risk, and early tissue stress [13,28]. These features may reflect impaired peripheral circulation, autonomic dysfunction, inflammation, or localized pressure-related changes, making thermography a potentially useful screening tool for identifying high-risk patients before visible structural damage or ulceration occurs [33]. Collectively, these examples demonstrate that thermal biomarkers are not limited to ageing research but have broader relevance for diagnosis, screening, risk stratification, and disease monitoring. Their clinical value, however, depends on standardized acquisition, physiological validation, repeatability, reproducibility, and external validation across cohorts and clinical settings.

6.5. Machine Learning for Biomarker Discovery

In thermographic biomarker research, machine learning is most valuable as a tool for prioritizing candidate thermal indicators rather than confirming biomarker validity [26]. By analyzing structured thermal descriptors, such as regional temperature statistics, asymmetry measures, and texture features, predictive models can highlight variables that appear relevant to disease status, physiological condition, or ageing [29,164]. However, these signals should be interpreted cautiously. A feature that improves prediction in one dataset may still be unstable across cohorts, sensitive to acquisition conditions, or weakly related to the underlying biology [26,53]. Thus, predictive relevance should be regarded as hypothesis-generating evidence, not proof of a valid biomarker. Explainable AI can strengthen this process by indicating which thermal regions or features contribute most to the model output. Methods such as SHAP, LIME, and Grad-CAM may help determine whether predictions are linked to plausible thermal patterns [29], including bilateral asymmetry, focal heating, or localized cooling [57]. Even so, explanation does not replace validation. Candidate thermal biomarkers identified by machine learning still require confirmation through reproducibility analysis, physiological interpretation, and external validation. Accordingly, the main contribution of machine learning in thermographic biomarker discovery is to narrow the search space for meaningful features, while biomarker validity depends on subsequent biological and clinical verification. To make this distinction more explicit, Table 7 proposes a translational maturity framework for candidate thermal biomarkers, ranging from features that are merely predictive within a single dataset to markers that are reproducible, physiologically grounded, and clinically validated.

7. Challenges, Research Gaps, and Future Directions

Despite growing interest in machine learning and explainable AI for medical thermography, several barriers still limit reliable clinical translation. The central problem is not only model performance, but the instability of the entire thermographic pipeline; image acquisition, temperature measurement, feature extraction, model training, and interpretation are all sensitive to technical and biological variation [165]. As a result, many reported findings remain difficult to reproduce, compare across studies, or generalize beyond the original dataset [166,167].
A major challenge is data quality and external validity. Many thermographic studies rely on relatively small datasets, often collected in single-center settings and from narrow demographic groups [168]. This increases the risk of overfitting, weakens subgroup analysis, and limits confidence that the reported thermal patterns will persist across populations. Furthermore, class imbalance further complicates evaluation, since abnormal cases are often much fewer than controls, making apparently strong performance metrics difficult to interpret clinically [169]. In this setting, better algorithms alone are unlikely to solve the problem; larger, more diverse, and better curated datasets are needed.
A second challenge is measurement and protocol variability. Thermographic data are highly sensitive to camera calibration, emissivity assumptions, imaging distance, room temperature, humidity, airflow, subject posture, recent physical activity, and acclimatization time [170,171,172]. These factors influence the recorded temperature field directly, which means that variability can enter the analysis before any machine-learning step begins. For this reason, protocol heterogeneity is one of the central obstacles to reproducibility. Without stronger standardization, it remains difficult to determine whether a reported thermal signature reflects genuine physiology or a study-specific acquisition condition.
A third challenge is physiological and demographic confounding. Skin-temperature patterns vary with age, sex, body composition, vascular status, metabolic state, medication use, and lifestyle, among other factors [5,173]. These influences are not simply noise; they are part of the thermal signal itself. This makes thermographic interpretation inherently more difficult, because a model may learn differences that are real but nonspecific. Consequently, future work must go beyond simple case–control modeling and address how thermal features behave across heterogeneous populations and under realistic clinical variability.
These issues feed directly into the problem of model generalization. Many thermographic models perform well on the dataset on which they were developed but remain untested across institutions, cameras, or protocols. This is particularly problematic for biomarker-oriented claims, because a feature that is predictive only under one acquisition setting cannot be regarded as robust. Generalization in thermography, therefore, depends as much on study design and harmonization as on model architecture. Multi-center evaluation, external validation, and robustness analysis are likely to be more important than further gains in in-sample accuracy.
A further research gap concerns interpretability and explanation quality. Explainable AI is often presented as a solution to black-box prediction, but in thermography, the challenge is more demanding: explanations must be not only visually plausible, but also anatomically credible, physiologically meaningful, and stable across subjects and models. Heatmaps and feature-attribution methods can help identify candidate thermal signals, yet they do not by themselves establish causality, robustness, or biomarker status. Thus, explainability should be treated as an interpretive tool, not as a substitute for validation. The most important translational gap remains clinical validation of thermal biomarkers. Many studies report promising classification accuracy or highlight influential thermal features, but relatively few demonstrate longitudinal stability, reproducibility across cohorts, or correlation with independent physiological and clinical measurements. This is the point at which prediction and biomarker research diverge most clearly: a useful classifier may not yield a valid biomarker, and a highlighted thermal region is not equivalent to a clinically meaningful marker. Progress in this area will require longitudinal studies, cross-site replication, and stronger integration of thermographic findings with clinical endpoints and physiological reference measures.
Finally, the field still places greater emphasis on disease classification than on biomarker-oriented understanding. This imbalance has encouraged performance-driven studies while slowing the development of reproducible, interpretable, and physiologically grounded thermal markers. The long-term value of medical thermography is unlikely to rest on isolated high-accuracy models alone. Rather, it will depend on whether the field can establish standardized acquisition, reliable cross-study validation, and a clearer pathway from thermal patterns to clinically meaningful biomarkers. Looking ahead, the most promising advances are likely to come from approaches that improve both data quality and physiological interpretability. These include physics-informed or physiologically constrained learning, self-supervised and federated learning for limited and distributed datasets, multimodal integration with complementary imaging or wearable sensing, and longitudinal study designs that allow thermal patterns to be tracked over time. Digital-twin frameworks and continuous thermal monitoring may further support personalized physiological assessment, but their value will depend on rigorous validation rather than technical novelty alone. In this sense, future progress in thermographic AI will depend less on increasingly complex prediction models than on building reproducible, interpretable, and clinically grounded pathways from thermal data to reliable biomarkers.

8. Conclusions

Medical thermography is a promising noninvasive imaging modality for capturing temperature-based signatures of physiology, including perfusion, inflammation, metabolism, and thermoregulation. With the transition of thermal imaging from qualitative visualization to quantitative analysis, machine learning has broadened its applications in disease screening, physiological assessment, risk prediction, and ageing-related research. In parallel, explainable AI has strengthened the interpretability of thermographic models by enabling predictions to be related to identifiable thermal features and anatomical patterns. This review emphasizes that the future value of thermographic AI lies not only in predictive performance but also in the development of reproducible, physiologically grounded, and clinically meaningful thermal biomarkers. Although regional temperature statistics, asymmetry measures, texture descriptors, and deep learning representations all offer useful analytical information, their importance depends on robustness across acquisition conditions, populations, and study designs. Explainability contributes to this process by improving transparency and helping prioritize candidate thermal markers; however, explanation alone does not establish biomarker validity. Accordingly, the central challenge in this field is translational rather than purely technical. Meaningful progress will require stronger protocol standardization, larger and more diverse datasets, rigorous external validation, and closer integration of thermographic findings with physiological evidence and clinical outcomes. The long-term clinical significance of medical thermography will therefore depend less on isolated high-accuracy models than on the establishment of reliable, interpretable, and clinically grounded pathways from thermal patterns to validated biomarkers. Under such conditions, thermography combined with machine learning and explainable AI may become a valuable tool for noninvasive health monitoring, biomarker discovery, and personalized physiological assessment.

Author Contributions

M.S.: Investigation, Writing—Original Draft, Writing—Review and Editing. H.Y.: Writing—Original Draft, Writing—Review and Editing. H.S.K.: Supervision, Project administration, Funding acquisition, Writing—Review and Editing. All authors have read and agreed to the published version of the manuscript.

Funding

This work was supported by the National Research Foundation of Korea(NRF) grant funded by the Korea government(MSIT) (RS-2025-00523019), the “Regional Innovation System & Education (RISE)” through the Seoul RISE Center, funded by the Ministry of Education (MOE) and the Seoul Metropolitan Government (2026-RISE-01-007-04) and the InnoCORE program of the Ministry of Science and ICT (N10260002).

Data Availability Statement

No new data were created or analyzed in this study.

Conflicts of Interest

The authors declare no conflicts of interest.

References

  1. Califf, R.M. Biomarker definitions and their applications. Exp. Biol. Med. 2018, 243, 213–221. [Google Scholar] [CrossRef] [Scilit]
  2. Ye, S.; Lim, J.Y.; Huang, W. Statistical considerations for repeatability and reproducibility of quantitative imaging biomarkers. BJR Open 2022, 4, 20210083. [Google Scholar] [CrossRef] [Scilit] [PubMed]
  3. Buckler, A.J.; Ouellette, M.; Danagoulian, J.; Wernsing, G.; Liu, T.T.; Savig, E.; Suzek, B.E.; Rubin, D.L.; Paik, D. Quantitative imaging biomarker ontology (QIBO) for knowledge representation of biomedical imaging biomarkers. J. Digit. Imaging 2013, 26, 630–641. [Google Scholar] [CrossRef] [Scilit] [PubMed]
  4. O’Connor, J.P.; Aboagye, E.O.; Adams, J.E.; Aerts, H.J.; Barrington, S.F.; Beer, A.J.; Boellaard, R.; Bohndiek, S.E.; Brady, M.; Brown, G. Imaging biomarker roadmap for cancer studies. Nat. Rev. Clin. Oncol. 2017, 14, 169–186. [Google Scholar] [CrossRef] [Scilit]
  5. Yu, Z.; Zhou, Y.; Mao, K.; Pang, B.; Wang, K.; Jin, T.; Zheng, H.; Zhai, H.; Wang, Y.; Xu, X.; et al. Thermal facial image analyses reveal quantitative hallmarks of aging and metabolic diseases. Cell Metab. 2024, 36, 1482–1493. [Google Scholar] [CrossRef] [Scilit] [PubMed]
  6. Chauvie, S.; Mazzoni, L.N.; O’Doherty, J. A review on the use of imaging biomarkers in oncology clinical trials: Quality assurance strategies for technical validation. Tomography 2023, 9, 1876–1902. [Google Scholar] [CrossRef] [Scilit]
  7. Raunig, D.L.; McShane, L.M.; Pennello, G.; Gatsonis, C.; Carson, P.L.; Voyvodic, J.T.; Wahl, R.L.; Kurland, B.F.; Schwarz, A.J.; Gönen, M. Quantitative imaging biomarkers: A review of statistical methods for technical performance assessment. Stat. Methods Med. Res. 2015, 24, 27–67. [Google Scholar] [CrossRef] [Scilit]
  8. Hayes, D.F. Biomarker validation and testing. Mol. Oncol. 2015, 9, 960–966. [Google Scholar] [CrossRef] [Scilit]
  9. Wang, Q.; Zhou, Y.; Ghassemi, P.; McBride, D.; Casamento, J.P.; Pfefer, T.J. Infrared thermography for measuring elevated body temperature: Clinical accuracy, calibration, and evaluation. Sensors 2021, 22, 215. [Google Scholar] [CrossRef] [Scilit]
  10. Kaczmarek, M.; Nowakowski, A. Active IR-thermal imaging in medicine. J. Nondestruct. Eval. 2016, 35, 19. [Google Scholar] [CrossRef] [Scilit]
  11. Lahiri, B.B.; Bagavathiappan, S.; Jayakumar, T.; Philip, J. Medical applications of infrared thermography: A review. Infrared Phys. Technol. 2012, 55, 221–235. [Google Scholar] [CrossRef] [Scilit]
  12. Ekici, S.; Jawzal, H. Breast cancer diagnosis using thermography and convolutional neural networks. Med. Hypotheses 2020, 137, 109542. [Google Scholar] [CrossRef] [Scilit] [PubMed]
  13. Zhou, Q.; Qian, Z.; Wu, J.; Liu, J.; Ren, L.; Ren, L. Early diagnosis of diabetic peripheral neuropathy based on infrared thermal imaging technology. Diabetes Metab. Res. Rev. 2021, 37, e3429. [Google Scholar] [CrossRef] [Scilit]
  14. Choda, G.; Rao, G.H. Thermal Imaging for the diagnosis of early vascular dysfunctions: A case report. J. Clin. Cardiol. Diagn. 2020, 3, 1–7. [Google Scholar]
  15. Zhou, Y.; Ghassemi, P.; Chen, M.; McBride, D.; Casamento, J.P.; Pfefer, T.J.; Wang, Q. Clinical evaluation of fever-screening thermography: Impact of consensus guidelines and facial measurement location. J. Biomed. Opt. 2020, 25, 097002. [Google Scholar] [CrossRef] [Scilit] [PubMed]
  16. Nallathambi, N.; Bisaralli, R.; Naidu, S.P.; Mallikarjunaswamy, M.; Praveen, P.; Mamadapur, M. Clinical application of infrared thermography in rheumatic diseases: A systematic review. Mediterr. J. Rheumatol. 2025, 36, 159. [Google Scholar] [CrossRef] [Scilit]
  17. Speeckaert, R.; Hoorens, I.; Lambert, J.; Speeckaert, M.; van Geel, N. Beyond visual inspection: The value of infrared thermography in skin diseases, a scoping review. J. Eur. Acad. Dermatol. Venereol. 2024, 38, 1723–1737. [Google Scholar] [CrossRef] [Scilit]
  18. Gulias-Cañizo, R.; Rodríguez-Malagón, M.E.; Botello-González, L.; Belden-Reyes, V.; Amparo, F.; Garza-Leon, M. Applications of infrared thermography in ophthalmology. Life 2023, 13, 723. [Google Scholar] [CrossRef] [Scilit]
  19. Ring, E.; Ammer, K. The technique of infrared imaging in medicine. In Thermology International; IoP Publishing: Bristol, UK, 2000; pp. 7–14. [Google Scholar]
  20. Usamentiaga, R.; Venegas, P.; Guerediaga, J.; Vega, L.; Molleda, J.; Bulnes, F.G. Infrared thermography for temperature measurement and non-destructive testing. Sensors 2014, 14, 12305–12348. [Google Scholar] [CrossRef] [Scilit] [PubMed]
  21. Ring, E.; Thomas, R.; Howell, K.; Jones, D. Sensors for medical thermography and infrared radiation measurements. In Biomedical Sensors; Momentum Press: New York, NY, USA, 2009; pp. 417–441. [Google Scholar]
  22. Kesztyüs, D.; Brucher, S.; Wilson, C.; Kesztyüs, T. Use of infrared thermography in medical diagnosis, screening, and disease monitoring: A scoping review. Medicina 2023, 59, 2139. [Google Scholar] [CrossRef] [Scilit]
  23. Wilson, A.; Gupta, K.A.; Koduru, B.H.; Kumar, A.; Jha, A.; Cenkeramaddi, L.R. Recent advances in thermal imaging and its applications using machine learning: A review. IEEE Sens. J. 2023, 23, 3395–3407. [Google Scholar] [CrossRef] [Scilit]
  24. Ludwig, N.; Formenti, D.; Gargano, M.; Alberti, G. Skin temperature evaluation by infrared thermography: Comparison of image analysis methods. Infrared Phys. Technol. 2014, 62, 1–6. [Google Scholar] [CrossRef] [Scilit]
  25. Salles, M.S.V.; Da Silva, S.C.; Salles, F.A.; Roma, L.C., Jr.; El Faro, L.; Mac Lean, P.A.B.; de Oliveira, C.E.L.; Martello, L.S. Mapping the body surface temperature of cattle by infrared thermography. J. Therm. Biol. 2016, 62, 63–69. [Google Scholar] [CrossRef] [Scilit] [PubMed]
  26. Attallah, O. Harnessing infrared thermography and multi-convolutional neural networks for early breast cancer detection. Sci. Rep. 2025, 15, 27464. [Google Scholar] [CrossRef] [Scilit] [PubMed]
  27. Acharya, U.R.; Ng, E.Y.-K.; Tan, J.-H.; Sree, S.V. Thermography based breast cancer detection using texture features and support vector machine. J. Med. Syst. 2012, 36, 1503–1510. [Google Scholar] [CrossRef] [Scilit] [PubMed]
  28. Khandakar, A.; Chowdhury, M.E.; Reaz, M.B.I.; Ali, S.H.M.; Hasan, M.A.; Kiranyaz, S.; Rahman, T.; Alfkey, R.; Bakar, A.A.A.; Malik, R.A. A machine learning model for early detection of diabetic foot using thermogram images. Comput. Biol. Med. 2021, 137, 104838. [Google Scholar] [CrossRef] [Scilit]
  29. Nowakowski, A.Z.; Kaczmarek, M. Artificial intelligence in IR thermal imaging and sensing for medical applications. Sensors 2025, 25, 891. [Google Scholar] [CrossRef] [Scilit]
  30. Tsietso, D.; Yahya, A.; Samikannu, R. A review on thermal imaging-based breast cancer detection using deep learning. Mob. Inf. Syst. 2022, 2022, 8952849. [Google Scholar] [CrossRef] [Scilit]
  31. Mohamed, E.A.; Rashed, E.A.; Gaber, T.; Karam, O. Deep learning model for fully automated breast cancer detection system from thermograms. PLoS ONE 2022, 17, e0262349. [Google Scholar] [CrossRef] [Scilit]
  32. Civilibal, S.; Cevik, K.K.; Bozkurt, A. A deep learning approach for automatic detection, segmentation and classification of breast lesions from thermal images. Expert Syst. Appl. 2023, 212, 118774. [Google Scholar] [CrossRef] [Scilit]
  33. Sharma, N.; Mirza, S.; Rastogi, A.; Singh, S.; Mahapatra, P.K. Region-wise severity analysis of diabetic plantar foot thermograms. Biomed. Eng. Tech. 2023, 68, 607–615. [Google Scholar]
  34. Wartakusumah, R.; Yamada, A.; Noguchi, H.; Oe, M. Analysis of foot thermography images of diabetic patients using artificial intelligence: A scoping review. Diabetes Res. Clin. Pract. 2025, 228, 112446. [Google Scholar] [CrossRef] [Scilit]
  35. Tian, X.; Fang, L.; Liu, W. The influencing factors and an error correction method of the use of infrared thermography in human facial skin temperature. Build. Environ. 2023, 244, 110736. [Google Scholar] [CrossRef] [Scilit]
  36. Bernard, V.; Staffa, E.; Mornstein, V.; Bourek, A. Infrared camera assessment of skin surface temperature–effect of emissivity. Phys. Med. 2013, 29, 583–591. [Google Scholar] [CrossRef] [Scilit]
  37. Jia, X.; Ren, L.; Cai, J. Clinical implementation of AI technologies will require interpretable AI models. Med. Phys. 2020, 47, 1–4. [Google Scholar] [CrossRef] [Scilit] [PubMed]
  38. Vollmer, M. Infrared thermal imaging. In Computer Vision: A Reference Guide; Springer: Cham, Switzerland, 2020; pp. 1–4. [Google Scholar]
  39. Ignatov, I.; Mosin, O.; Niggli, H.; Drossinakis, C. Evaluating of possible methods and approaches for registering electromagnetic waves emitted from the human body. Adv. Phys. Theor. Appl. 2014, 30, 15–33. [Google Scholar]
  40. Reggiani, L.; Alfinito, E. Revisiting the Boltzmann derivation of the Stefan law. Fluct. Noise Lett. 2022, 21, 2230001. [Google Scholar] [CrossRef] [Scilit]
  41. Charlton, M.; Stanley, S.A.; Whitman, Z.; Wenn, V.; Coats, T.J.; Sims, M.; Thompson, J.P. The effect of constitutive pigmentation on the measured emissivity of human skin. PLoS ONE 2020, 15, e0241843. [Google Scholar] [CrossRef] [Scilit]
  42. Steketee, J. Spectral emissivity of skin and pericardium. Phys. Med. Biol. 1973, 18, 686–694. [Google Scholar] [CrossRef] [Scilit]
  43. Pennes, H.H. Analysis of tissue and arterial blood temperatures in the resting human forearm. J. Appl. Physiol. 1948, 1, 93–122. [Google Scholar] [CrossRef] [Scilit]
  44. Luchakov, Y.I.; Nozdrachev, A. Mechanism of heat transfer in different regions of human body. Biol. Bull. 2009, 36, 53–57. [Google Scholar] [CrossRef] [Scilit]
  45. Sheng, Y.; Zhu, L. The crosstalk between autonomic nervous system and blood vessels. Int. J. Physiol. Pathophysiol. Pharmacol. 2018, 10, 17. [Google Scholar]
  46. Gerngroß, C.; Schretter, J.; Klingenspor, M.; Schwaiger, M.; Fromme, T. Active brown fat during 18F-FDG PET/CT imaging defines a patient group with characteristic traits and an increased probability of brown fat redetection. J. Nucl. Med. 2017, 58, 1104–1110. [Google Scholar] [CrossRef] [Scilit]
  47. Benzinger, T.; Pratt, A.; Kitzinger, C. The thermostatic control of human metabolic heat production. Proc. Natl. Acad. Sci. USA 1961, 47, 730–739. [Google Scholar] [CrossRef] [Scilit] [PubMed]
  48. Singh, I.S.; Hasday, J.D. Fever, hyperthermia and the heat shock response. Int. J. Hyperth. 2013, 29, 423–435. [Google Scholar] [CrossRef] [Scilit] [PubMed]
  49. Ramirez-GarciaLuna, J.L.; Rangel-Berridi, K.; Bartlett, R.; Fraser, R.D.; Martinez-Jimenez, M.A. Use of infrared thermal imaging for assessing acute inflammatory changes: A case series. Cureus 2022, 14, e28980. [Google Scholar] [CrossRef] [Scilit] [PubMed]
  50. Gatt, A.; Formosa, C.; Cassar, K.; Camilleri, K.P.; De Raffaele, C.; Mizzi, A.; Azzopardi, C.; Mizzi, S.; Falzon, O.; Cristina, S. Thermographic patterns of the upper and lower limbs: Baseline data. Int. J. Vasc. Med. 2015, 2015, 831369. [Google Scholar] [CrossRef] [Scilit]
  51. Lubkowska, A.; Chudecka, M. Thermal characteristics of breast surface temperature in healthy women. Int. J. Environ. Res. Public Health 2021, 18, 1097. [Google Scholar] [CrossRef] [Scilit]
  52. Romanovsky, A.A. Skin temperature: Its role in thermoregulation. Acta Physiol. 2014, 210, 498–507. [Google Scholar] [CrossRef] [Scilit]
  53. Wu, L.; Huang, R.; He, X.; Tang, L.; Ma, X. Advances in machine learning-aided thermal imaging for early detection of diabetic foot ulcers: A review. Biosensors 2024, 14, 614. [Google Scholar] [CrossRef] [Scilit]
  54. Lessa, V.; Marengoni, M. Applying Artificial Neural Network for the Classification of Breast Cancer Using Infrared Thermographic Images. In Proceedings of the International Conference on Computer Vision and Graphics, Warsaw, Poland, 19–21 September 2016; pp. 429–438. [Google Scholar]
  55. Koay, J.; Herry, C.; Frize, M. Analysis of breast thermography with an artificial neural network. In Proceedings of the 26th Annual International Conference of the IEEE Engineering in Medicine and Biology Society; IEEE: San Francisco, CA, USA, 2004; Volume 1, pp. 1159–1162. [Google Scholar]
  56. Budu, T.; Sato, W.; Shimokawa, K.; Hsu, C.-T.; Kochiyama, T. Development of pixel-based facial thermal image analysis for emotion sensing. Comput. Hum. Behav. Rep. 2025, 19, 100761. [Google Scholar] [CrossRef] [Scilit]
  57. Mirasbekov, Y.; Aidossov, N.; Mashekova, A.; Zarikas, V.; Zhao, Y.; Ng, E.Y.K.; Midlenko, A. Fully interpretable deep learning model using IR thermal images for possible breast cancer cases. Biomimetics 2024, 9, 609. [Google Scholar] [CrossRef] [Scilit] [PubMed]
  58. Sharma, N.; Aggarwal, L.M. Automated medical image segmentation techniques. J. Med. Phys. 2010, 35, 3–14. [Google Scholar] [CrossRef] [Scilit] [PubMed]
  59. Singh, J.; Arora, A.S. Automated approaches for ROIs extraction in medical thermography: A review and future directions. Multimed. Tools Appl. 2020, 79, 15273–15296. [Google Scholar] [CrossRef] [Scilit]
  60. Saiko, G. Skin temperature: The impact of perfusion, epidermis thickness, and skin wetness. Appl. Sci. 2022, 12, 7106. [Google Scholar] [CrossRef] [Scilit]
  61. Stanley, S.A.; Divall, P.; Thompson, J.P.; Charlton, M. Uses of infrared thermography in acute illness: A systematic review. Front. Med. 2024, 11, 1412854. [Google Scholar] [CrossRef] [Scilit]
  62. Gogoi, U.R.; Majumdar, G.; Bhowmik, M.K.; Ghosh, A.K.; Bhattacharjee, D. Breast abnormality detection through statistical feature analysis using infrared thermograms. In Proceedings of the 2015 International Symposium on Advanced Computing and Communication (ISACC), Silchar, India, 14–15 September 2015; pp. 258–265. [Google Scholar]
  63. Tabachnick, B.G.; Fidell, L.S.; Ullman, J.B. Using Multivariate Statistics, 5th ed.; Pearson: Boston, MA, USA, 2007. [Google Scholar]
  64. Kesztyüs, D.; Brucher, S.; Kesztyüs, T. Use of infrared thermography in medical diagnostics: A scoping review protocol. BMJ Open 2022, 12, e059833. [Google Scholar] [CrossRef] [Scilit]
  65. Koscheyev, V.; Coca, A.; Leon, G.; Maximov, A. Informative value of temperatures in different areas of the human body for correcting body thermal imbalance during extravehicular activities. Hum. Physiol. 2005, 31, 688–695. [Google Scholar] [CrossRef] [Scilit]
  66. Gonzalez, R.C.; Woods, R.E. Digital Image Processing, 4th ed.; Pearson Education: London, UK, 2018. [Google Scholar]
  67. Tan, J.-H.; Ng, E.; Acharya, U.R.; Chee, C. Study of normal ocular thermogram using textural parameters. Infrared Phys. Technol. 2010, 53, 120–126. [Google Scholar] [CrossRef] [Scilit]
  68. Löfstedt, T.; Brynolfsson, P.; Asklund, T.; Nyholm, T.; Garpebring, A. Gray-level invariant Haralick texture features. PLoS ONE 2019, 14, e0212110. [Google Scholar] [CrossRef] [Scilit]
  69. Kolios, C.; Sannachi, L.; Dasgupta, A.; Suraweera, H.; DiCenzo, D.; Stanisz, G.; Sahgal, A.; Wright, F.; Look-Hong, N.; Curpen, B. MRI texture features from tumor core and margin in the prediction of response to neoadjuvant chemotherapy in patients with locally advanced breast cancer. Oncotarget 2021, 12, 1354–1365. [Google Scholar] [CrossRef] [Scilit]
  70. Pietikäinen, M.; Hadid, A.; Zhao, G.; Ahonen, T. Local binary patterns for still images. In Computer Vision Using Local Binary Patterns; Springer: London, UK, 2011; pp. 13–47. [Google Scholar]
  71. Ke-Chen, S.; Yun-Hui, Y.; Wen-Hui, C. Research and perspective on local binary pattern. Acta Autom. Sin. 2013, 39, 730–744. [Google Scholar]
  72. He, Y.; Sang, N.; Gao, C. Multi-structure local binary patterns for texture classification. Pattern Anal. Appl. 2013, 16, 595–607. [Google Scholar] [CrossRef] [Scilit]
  73. Nanni, L.; Brahnam, S.; Lumini, A. A simple method for improving local binary patterns by considering non-uniform patterns. Pattern Recognit. 2012, 45, 3844–3852. [Google Scholar] [CrossRef] [Scilit]
  74. Mallat, S.G. A theory for multiresolution signal decomposition: The wavelet representation. IEEE Trans. Pattern Anal. Mach. Intell. 1989, 11, 674–693. [Google Scholar] [CrossRef] [Scilit]
  75. Jalloul, R.; Krishnappa, C.H.; Agughasi, V.I.; Alkhatib, R. Enhancing early breast cancer detection with infrared thermography: A comparative evaluation of deep learning and machine learning models. Technologies 2024, 13, 7. [Google Scholar] [CrossRef] [Scilit]
  76. Samee, N.A.; Alhussan, A.A.; Ghoneim, V.F.; Atteia, G.; Alkanhel, R.; Al-Antari, M.A.; Kadah, Y.M. A hybrid deep transfer learning of CNN-based LR-PCA for breast lesion diagnosis via medical breast mammograms. Sensors 2022, 22, 4938. [Google Scholar] [CrossRef] [Scilit]
  77. Youssef, D.; Atef, H.; Gamal, S.; El-Azab, J.; Ismail, T. Early Breast Cancer Prediction Using Thermal Images and Hybrid Feature Extraction-Based System. IEEE Access 2025, 13, 29327–29339. [Google Scholar] [CrossRef] [Scilit]
  78. Hilario, M.; Kalousis, A. Approaches to dimensionality reduction in proteomic biomarker studies. Brief. Bioinform. 2008, 9, 102–118. [Google Scholar] [CrossRef] [Scilit]
  79. Cover, T.M. Elements of Information Theory; John Wiley & Sons: New York, NY, USA, 1999. [Google Scholar]
  80. Vergara, J.R.; Estévez, P.A. A review of feature selection methods based on mutual information. Neural Comput. Appl. 2014, 24, 175–186. [Google Scholar] [CrossRef] [Scilit]
  81. Ratnasingam, S.; Muñoz-Lopez, J. Distance correlation-based feature selection in random forest. Entropy 2023, 25, 1250. [Google Scholar] [CrossRef] [Scilit]
  82. Snekhalatha, U.; Sangamithirai, K. Computer aided diagnosis of obesity based on thermal imaging using various convolutional neural networks. Biomed. Signal Process. Control 2021, 63, 102233. [Google Scholar]
  83. Attallah, O. A deep learning-driven CAD for breast cancer detection via thermograms: A compact multi-architecture feature strategy. Appl. Sci. 2025, 15, 7181. [Google Scholar] [CrossRef] [Scilit]
  84. Salah, M.; Saeed, N.; Svetinovic, D.; Sfarra, S.; Omar, M.; Abdulrahman, Y. PCA-Guided Autoencoding for Structured Dimensionality Reduction in Active Infrared Thermography. arXiv 2025, arXiv:2508.07773. [Google Scholar] [CrossRef] [Scilit]
  85. Aidossov, N.; Zarikas, V.; Mashekova, A.; Zhao, Y.; Ng, E.Y.K.; Midlenko, A.; Mukhmetov, O. Evaluation of integrated CNN, transfer learning, and BN with thermography for breast cancer detection. Appl. Sci. 2023, 13, 600. [Google Scholar] [CrossRef] [Scilit]
  86. Roozendaal, M. Deep Learning for Early Detection of Vasovagal Reactions Through Infrared Thermal Imaging. Master’s Thesis, Tilburg University, Tilburg, The Netherlands, 2024. [Google Scholar]
  87. Li, X.; Xiong, H.; Li, X.; Wu, X.; Zhang, X.; Liu, J.; Bian, J.; Dou, D. Interpretable deep learning: Interpretation, interpretability, trustworthiness, and beyond. Knowl. Inf. Syst. 2022, 64, 3197–3234. [Google Scholar] [CrossRef] [Scilit]
  88. Molnar, C.; König, G.; Herbinger, J.; Freiesleben, T.; Dandl, S.; Scholbeck, C.A.; Casalicchio, G.; Grosse-Wentrup, M.; Bischl, B. General pitfalls of model-agnostic interpretation methods for machine learning models. In Proceedings of the International Workshop on Extending Explainable AI Beyond Deep Models and Classifiers, Online, 17 April 2022; pp. 39–68. [Google Scholar]
  89. Khandakar, A.; Chowdhury, M.E.; Reaz, M.B.I.; Ali, S.H.M.; Kiranyaz, S.; Rahman, T.; Chowdhury, M.H.; Ayari, M.A.; Alfkey, R.; Bakar, A.A.A. A novel machine learning approach for severity classification of diabetic foot complications using thermogram images. Sensors 2022, 22, 4249. [Google Scholar] [CrossRef] [Scilit] [PubMed]
  90. Yue, L.; Tian, D.; Chen, W.; Han, X.; Yin, M. Deep learning for heterogeneous medical data analysis. World Wide Web 2020, 23, 2715–2737. [Google Scholar] [CrossRef] [Scilit]
  91. Periyasamy, S.; Prakasarao, A.; Menaka, M.; Venkatraman, B.; Jayashree, M. Support vector machine based methodology for classification of thermal images pertaining to breast cancer. J. Therm. Biol. 2022, 110, 103337. [Google Scholar] [CrossRef] [Scilit]
  92. Noura, H.N.; Allal, Z.; Salman, O.; Chahine, K. An optimized tree-based model with feature selection for efficient fault detection and diagnosis in diesel engine systems. Results Eng. 2025, 27, 106619. [Google Scholar] [CrossRef] [Scilit]
  93. McLaren, C.E.; Chen, W.-P.; Nie, K.; Su, M.-Y. Prediction of malignant breast lesions from MRI features: A comparison of artificial neural network and logistic regression techniques. Acad. Radiol. 2009, 16, 842–851. [Google Scholar] [CrossRef] [Scilit] [PubMed]
  94. Pagan, M.; Zarlis, M.; Candra, A. Investigating the impact of data scaling on the k-nearest neighbor algorithm. Comput. Sci. Inf. Technol. 2023, 4, 135–142. [Google Scholar] [CrossRef] [Scilit]
  95. Jones, B.F. A reappraisal of the use of infrared thermal image analysis in medicine. IEEE Trans. Med. Imaging 2002, 17, 1019–1027. [Google Scholar] [CrossRef] [Scilit]
  96. Prinzi, F.; Currieri, T.; Gaglio, S.; Vitabile, S. Shallow and deep learning classifiers in medical image analysis. Eur. Radiol. Exp. 2024, 8, 26. [Google Scholar] [CrossRef] [Scilit] [PubMed]
  97. Lu, L.; Zheng, Y.; Carneiro, G.; Yang, L. Deep Learning and Convolutional Neural Networks for Medical Image Computing; Advances in Computer Vision and Pattern Recognition; Springer: Basel, Switzerland, 2017; Volume 10. [Google Scholar]
  98. Anwar, S.M.; Majid, M.; Qayyum, A.; Awais, M.; Alnowami, M.; Khan, M.K. Medical image analysis using convolutional neural networks: A review. J. Med. Syst. 2018, 42, 226. [Google Scholar] [CrossRef] [Scilit]
  99. Hussain, Z.; Gimenez, F.; Yi, D.; Rubin, D. Differential data augmentation techniques for medical imaging classification tasks. In AMIA Annual Symposium Proceedings; American Medical Informatics Association (AMIA): San Francisco, CA, USA, 2018; Volume 2017, p. 979. [Google Scholar]
  100. De Raad, K.; van Garderen, K.A.; Smits, M.; van der Voort, S.R.; Incekara, F.; Oei, E.H.; Hirvasniemi, J.; Klein, S.; Starmans, M.P. The effect of preprocessing on convolutional neural networks for medical image segmentation. In Proceedings of the 2021 IEEE 18th International Symposium on Biomedical Imaging (ISBI), Nice, France, 13–16 April 2021; pp. 655–658. [Google Scholar]
  101. Petersen, A.; Brabrand, M.; Kucheryavskiy, S. Using artificial neural networks for anomaly detection in infrared thermography images for rapid diagnosis in an emergency care unit. Biomed. Signal Process. Control 2026, 112, 108734. [Google Scholar] [CrossRef] [Scilit]
  102. Petersen, A.; Brabrand, M.; Kucheryavskiy, S. Infrared Thermography Anomaly Detection Using VAESIMCA Approach. Sens. Imaging 2025, 26, 91. [Google Scholar] [CrossRef] [Scilit]
  103. Xue, B.; Jiao, Y.; Kannampallil, T.; Fritz, B.; King, C.; Abraham, J.; Avidan, M.; Lu, C. Perioperative predictions with interpretable latent representation. In Proceedings of the 28th ACM SIGKDD Conference on Knowledge Discovery and Data Mining, Washington, DC, USA, 14–18 August 2022; pp. 4268–4278. [Google Scholar]
  104. Farooq, M.A.; Javidnia, H.; Corcoran, P. Performance estimation of the state-of-the-art convolution neural networks for thermal images-based gender classification system. J. Electron. Imaging 2020, 29, 063004. [Google Scholar] [CrossRef] [Scilit]
  105. Kiymet, S.; Aslankaya, M.Y.; Taskiran, M.; Bolat, B. Breast cancer detection from thermography based on deep neural networks. In Proceedings of the 2019 Innovations in Intelligent Systems and Applications Conference (ASYU), Izmir, Turkey, 31 October–2 November 2019; pp. 1–5. [Google Scholar]
  106. Kim, J.; Huh, J.; Park, I.; Bak, J.; Kim, D.; Lee, S. Small object detection in infrared images: Learning from imbalanced cross-domain data via domain adaptation. Appl. Sci. 2022, 12, 11201. [Google Scholar] [CrossRef] [Scilit]
  107. Li, C.; Xia, W.; Yan, Y.; Luo, B.; Tang, J. Segmenting objects in day and night: Edge-conditioned CNN for thermal image semantic segmentation. IEEE Trans. Neural Netw. Learn. Syst. 2020, 32, 3069–3082. [Google Scholar] [CrossRef] [Scilit]
  108. Komorowski, P.; Baniecki, H.; Biecek, P. Towards evaluating explanations of vision transformers for medical imaging. In Proceedings of the IEEE/CVF Conference on Computer Vision and Pattern Recognition, Vancouver, BC, Canada, 17–24 June 2023; pp. 3726–3732. [Google Scholar]
  109. Sokolova, M.; Lapalme, G. A systematic analysis of performance measures for classification tasks. Inf. Process. Manag. 2009, 45, 427–437. [Google Scholar] [CrossRef] [Scilit]
  110. Kansal, S.; Kaur, S.; Jain, A.; Bansal, S.; Gambhir, M. Thermal signatures in breast cancer: Deciphering latent biomarkers through deep learning and explainable AI. J. Therm. Biol. 2026, 137, 104426. [Google Scholar] [CrossRef] [Scilit]
  111. Bagavathiappan, S.; Saravanan, T.; Philip, J.; Jayakumar, T.; Raj, B.; Karunanithi, R.; Panicker, T.; Korath, M.P.; Jagadeesan, K. Infrared thermal imaging for detection of peripheral vascular disorders. J. Med. Phys. 2009, 34, 43–47. [Google Scholar]
  112. Liu, X.; Hong, W.; Zhang, T.; Wu, Z.; Zhang, D. Anomaly of infrared thermal radiation intensity on unilateral mild to moderate bell’s palsy. Spectrosc. Spectr. Anal. 2011, 31, 1266–1269. [Google Scholar]
  113. Deng, Z.-S.; Liu, J. Mathematical modeling of temperature mapping over skin surface and its implementation in thermal disease diagnostics. Comput. Biol. Med. 2004, 34, 495–521. [Google Scholar] [CrossRef] [Scilit]
  114. Alshehri, A.; AlSaeed, D. Breast cancer diagnosis in thermography using pre-trained vgg16 with deep attention mechanisms. Symmetry 2023, 15, 582. [Google Scholar] [CrossRef] [Scilit]
  115. Alzahrani, R.M.; Sikkandar, M.Y.; Begum, S.S.; Babetat, A.F.S.; Alhashim, M.; Alduraywish, A.; Prakash, N.; Ng, E.Y. Early breast cancer detection via infrared thermography using a CNN enhanced with particle swarm optimization. Sci. Rep. 2025, 15, 25290. [Google Scholar] [CrossRef] [Scilit] [PubMed]
  116. Munguía-Siu, A.; Vergara, I.; Espinoza-Rodríguez, J.H. The use of hybrid CNN-RNN deep learning models to discriminate tumor tissue in dynamic breast thermography. J. Imaging 2024, 10, 329. [Google Scholar] [CrossRef] [Scilit]
  117. Alshehri, A.; AlSaeed, D. Breast cancer detection in thermography using convolutional neural networks (CNNs) with deep attention mechanisms. Appl. Sci. 2022, 12, 12922. [Google Scholar] [CrossRef] [Scilit]
  118. Ghatge, D.; Rajeswari, K. Secure-Therm-AI Sentinel: A Privacy-Preserving AI Pipeline for Breast Cancer Classification using Thermal Imaging. In Proceedings of the 2025 6th International Conference on Smart Electronics and Communication (ICOSEC), Trichy, India, 24–26 September 2025; pp. 2122–2127. [Google Scholar]
  119. Tello-Mijares, S.; Woo, F.; Flores, F. Breast cancer identification via thermography image segmentation with a gradient vector flow and a convolutional neural network. J. Healthc. Eng. 2019, 2019, 9807619. [Google Scholar] [CrossRef] [Scilit]
  120. Kanimozhi, P.; Sathiya, S.; Balasubramanian, M.; Sivaraj, P. Novel segmentation method to diagnose breast cancer in thermography using deep convolutional neural network. Ann. Rom. Soc. Cell Biol. 2021, 25, 6010–6025. [Google Scholar]
  121. Guan, S.; Kamona, N.; Loew, M. Segmentation of thermal breast images using convolutional and deconvolutional neural networks. In Proceedings of the 2018 IEEE Applied Imagery Pattern Recognition Workshop (AIPR), Washington, DC, USA, 9–11 October 2018; pp. 1–7. [Google Scholar]
  122. Mohamed, E.A.; Gaber, T.; Karam, O.; Rashed, E.A. A Novel CNN pooling layer for breast cancer segmentation and classification from thermograms. PLoS ONE 2022, 17, e0276523. [Google Scholar] [CrossRef] [Scilit]
  123. Khomsi, Z.; Elfezazi, M.; Bellarbi, L. Deep learning-based approach in surface thermography for inverse estimation of breast tumor size. Sci. Afr. 2024, 23, e01987. [Google Scholar] [CrossRef] [Scilit]
  124. Ensafi, M.; Keyvanpour, M.R.; Shojaedini, S.V. A New method for promote the performance of deep learning paradigm in diagnosing breast cancer: Improving role of fusing multiple views of thermography images. Health Technol. 2022, 12, 1097–1107. [Google Scholar] [CrossRef] [Scilit] [PubMed]
  125. Al Husaini, M.A.S.; Habaebi, M.H.; Islam, M.R. Real-time thermography for breast cancer detection with deep learning. Discov. Artif. Intell. 2024, 4, 57. [Google Scholar] [CrossRef] [Scilit]
  126. Cruz-Vega, I.; Hernandez-Contreras, D.; Peregrina-Barreto, H.; Rangel-Magdaleno, J.d.J.; Ramirez-Cortes, J.M. Deep learning classification for diabetic foot thermograms. Sensors 2020, 20, 1762. [Google Scholar] [CrossRef] [Scilit]
  127. Anaya-Isaza, A.; Zequera-Diaz, M. Detection of diabetes mellitus with deep learning and data augmentation techniques on foot thermography. IEEE Access 2022, 10, 59564–59591. [Google Scholar] [CrossRef] [Scilit]
  128. Cao, Z.; Zeng, Z.; Xie, J.; Zhai, H.; Yin, Y.; Ma, Y.; Tian, Y. Diabetic plantar foot segmentation in active thermography using a two-stage adaptive gamma transform and a deep neural network. Sensors 2023, 23, 8511. [Google Scholar] [CrossRef] [Scilit] [PubMed]
  129. Zhang, N.; Liu, J.; Jin, Y.; Duan, W.; Wu, Z.; Cai, Z.; Wu, M. An adaptive multi-modal hybrid model for classifying thyroid nodules by combining ultrasound and infrared thermal images. BMC Bioinform. 2023, 24, 315. [Google Scholar] [CrossRef] [Scilit]
  130. Umapathy, S.; Krishnan, P.T. Automated detection of orofacial pain from thermograms using machine learning and deep learning approaches. Expert Syst. 2021, 38, e12747. [Google Scholar] [CrossRef] [Scilit]
  131. Jagadev, P.; Naik, S.; Indu Giri, L. Contactless monitoring of human respiration using infrared thermography and deep learning. Physiol. Meas. 2022, 43, 025006. [Google Scholar] [CrossRef] [Scilit] [PubMed]
  132. Luo, J.; Wang, H.; Tong, S.; Zhang, J.; Luo, M.; Zhao, Q.; Zhang, Y.; Zhang, J.; Gao, F.; Tu, G. Interpreting infrared thermography with deep learning to assess the mortality risk of critically ill patients at risk of hypoperfusion. Rev. Cardiovasc. Med. 2023, 24, 7. [Google Scholar] [CrossRef] [Scilit]
  133. Lyra, S.; Mayer, L.; Ou, L.; Chen, D.; Timms, P.; Tay, A.; Chan, P.Y.; Ganse, B.; Leonhardt, S.; Hoog Antink, C. A deep learning-based camera approach for vital sign monitoring using thermography images for ICU patients. Sensors 2021, 21, 1495. [Google Scholar] [CrossRef] [Scilit] [PubMed]
  134. Pandey, B.; Singh, J.; Joshi, D.; Dubey, S.R.; Arora, A.S. Diagnosis of superficial ailments using infrared thermal imaging and CapsNet. J. Therm. Biol. 2025, 134, 104325. [Google Scholar] [CrossRef] [Scilit] [PubMed]
  135. Sheikh, M.M.; Balachandra, M.; Narendra, V.G.; Maiya, A.G. SoleFusion-Net: An explainable multimodal deep learning framework for diabetic foot syndrome classification in type II diabetes mellitus. Sci. Rep. 2026. [Google Scholar] [CrossRef] [Scilit]
  136. Rudnicka, Z.; Pauk, K.; Pauk, J.; Ihnatouski, M.; Pregowska, A. Energy-efficient detection of rheumatoid arthritis using spiking neural networks and thermographic imaging. Biocybern. Biomed. Eng. 2026, 46, 266–277. [Google Scholar] [CrossRef] [Scilit]
  137. Wang, Y.; Jiang, X.; Wang, Y.; Han, X.; Xi, G.; Shi, F.; Dey, N.; Cai, F. Early detection of pressure injuries via infrared thermography and ConvNeXt. Biomed. Signal Process. Control 2026, 116, 109572. [Google Scholar] [CrossRef] [Scilit]
  138. Bansode, N.V.; Ingale, V.V.; Ingale, S. A Non-Contact Framework for Thyroid Disorder Screening Using Infrared Thermography and GLCM-based Neural Networks. IEEE Access 2026, 14, 65744–65758. [Google Scholar] [CrossRef] [Scilit]
  139. Weber, V.; López, D.A.; Ochmann, D.T.; Zentgraf, S.; Nägele, M.; Neuberger, E.W.; Schömer, E.; Simon, P.; Hillen, B. Deep learning-based infrared thermography reveals reproducible uniform and individual thermoregulatory responses during running. Sci. Rep. 2026, 16, 10525. [Google Scholar] [CrossRef] [Scilit]
  140. Munguía-Siu, A.; Espinoza-Rodríguez, J.H. An Explainable Deep Temporal Model of Dynamic Breast Thermography Based on Grad-CAM and a Metaheuristic Feature Selection Strategy. Sens. Imaging 2026, 27, 37. [Google Scholar] [CrossRef] [Scilit]
  141. Zhang, S.; Yao, R.; Wei, H.; Li, B. Prediction of occupant thermal state via infrared thermography and explainable AI. Energy Build. 2024, 312, 114153. [Google Scholar] [CrossRef] [Scilit]
  142. Sandamal, N. Investigating Explainable Deep Learning & Dynamic Thermography for Skin Lesion Analysis. Master’s Dissertation, University of Malta, Msida, Malta, 2025. [Google Scholar]
  143. Prasanna, M.; Abirami, M.; Nithya, R.; Santhi, B.; Brindha, G.; Thiruvengadam, M. Enhanced Breast Cancer Detection From Thermal Images Using DNN and Explainable AI. Int. J. Imaging Syst. Technol. 2025, 35, e70243. [Google Scholar] [CrossRef] [Scilit]
  144. Krishnan, N.; Snekhalatha, U. A Non-invasive Diagnostic Approach to Orofacial Pain Using Infrared Thermography and Machine Learning. In Proceedings of the International Conference on Artificial Intelligence over Infrared Images for Medical Applications, Online, 17 November 2025; pp. 113–127. [Google Scholar]
  145. Raghavan, K.; Sivaselvan, B.; Kamakoti, V. Attention guided grad-CAM: An improved explainable artificial intelligence model for infrared breast cancer detection. Multimed. Tools Appl. 2024, 83, 57551–57578. [Google Scholar] [CrossRef] [Scilit]
  146. Raghavan, K.; Balasubramanian, S.; Veezhinathan, K. Explainable artificial intelligence for medical imaging: Review and experiments with infrared breast images. Comput. Intell. 2024, 40, e12660. [Google Scholar] [CrossRef] [Scilit]
  147. Arun, N.; Gaw, N.; Singh, P.; Chang, K.; Aggarwal, M.; Chen, B.; Hoebel, K.; Gupta, S.; Patel, J.; Gidwani, M. Assessing the trustworthiness of saliency maps for localizing abnormalities in medical imaging. Radiol. Artif. Intell. 2021, 3, e200267. [Google Scholar] [CrossRef] [Scilit]
  148. Gade, A.; Dash, D.K.; Kumari, T.M.; Ghosh, S.K.; Tripathy, R.K.; Pachori, R.B. Multiscale analysis domain interpretable deep neural network for detection of breast cancer using thermogram images. IEEE Trans. Instrum. Meas. 2023, 72, 4011213. [Google Scholar] [CrossRef] [Scilit]
  149. Niha, S.I.; Mahadi, M.H.; Ahmed, F. Optimizing Breast Cancer Diagnosis with VGG16 and CNN: An XAI Approach Using Saliency Maps. In Proceedings of the 2025 2nd International Conference on Next-Generation Computing, IoT and Machine Learning (NCIM), Gazipur, Bangladesh, 27–28 June 2025; pp. 1–6. [Google Scholar]
  150. Tewari, S.; Roy, S.; Das, D.; Roy, C.; Parida, S. Artificial intelligence in breast cancer detection: Advances across imaging modalities and clinical integration. Int. J. Oncol. 2026, 8, 1–6. [Google Scholar] [CrossRef] [Scilit]
  151. Aguirre-Arango, J.C.; Álvarez-Meza, A.M.; Castellanos-Dominguez, G. Feet segmentation for regional analgesia monitoring using convolutional RFF and layer-wise weighted CAM interpretability. Computation 2023, 11, 113. [Google Scholar] [CrossRef] [Scilit]
  152. Dewangan, K.K.; Singh, J. BioDL-BreastNet: A Bio-Inspired Deep Learning Framework for Breast Cancer Diagnosis and Risk Stratification. In Proceedings of the 2025 2nd International Conference on Artificial Intelligence for Innovations in Healthcare Industries (ICAIIHI), Raipur, India, 4–5 December 2025; pp. 1–6. [Google Scholar]
  153. Wang, T.; Zou, J.; Shi, L.; Liu, J. ViT-ResNet Contrastive Adaptation for Pneumonia Detection. In Proceedings of the 2025 8th International Conference on Big Data and Artificial Intelligence (BDAI), Taicang, China, 22–24 August 2025; pp. 315–319. [Google Scholar]
  154. Shao, H. An improved vision transformer for early detection of diabetic foot using thermogram. In Proceedings of the 2023 8th International Conference on Intelligent Computing and Signal Processing (ICSP), Xi’an, China, 21–23 April 2023; pp. 72–76. [Google Scholar]
  155. Ahalya, R.; Snekhalatha, U. Cnn transformer for the automated detection of rheumatoid arthritis in hand thermal images. In Proceedings of the MICCAI Workshop on Artificial Intelligence over Infrared Images for Medical Applications, Online, 3 November 2024; pp. 23–32. [Google Scholar]
  156. Bao, D.; Zhou, J.; Li, W.; Zhou, X.; Zhang, D. Integrating MobileViT with infrared thermography for non-organic sleep disorder detection. J. Therm. Biol. 2025, 134, 104309. [Google Scholar] [CrossRef] [Scilit]
  157. Afroze, A.S.; Tamilselvi, R.; Judith, J.; Beham, M.P.; Gayathri, M.; Senthilpari, C. Early Osteoarthritis Detection Using Multi-Scale Hybrid Vision Transformer and Thermal Imaging. In Proceedings of the 2025 Multimedia University Engineering Conference (MECON), Cyberjaya, Malaysia, 21–23 July 2025; pp. 1–7. [Google Scholar]
  158. Garia, L.S.; Hariharan, M. Vision transformers for breast cancer classification from thermal images. In Robotics, Control and Computer Vision: Select Proceedings of ICRCCV 2022; Springer: Singapore, 2023; pp. 177–185. [Google Scholar]
  159. Chen, B.H.; Marioni, R.E.; Colicino, E.; Peters, M.J.; Ward-Caviness, C.K.; Tsai, P.-C.; Roetker, N.S.; Just, A.C.; Demerath, E.W.; Guan, W. DNA methylation-based measures of biological age: Meta-analysis predicting time to death. Aging 2016, 8, 1844. [Google Scholar] [CrossRef] [Scilit]
  160. Zajonc, R.B.; Murphy, S.T.; Inglehart, M. Feeling and facial efference: Implications of the vascular theory of emotion. Psychol. Rev. 1989, 96, 395. [Google Scholar] [CrossRef] [Scilit]
  161. Reis, H.H.T.; Brito, C.J.; Sillero-Quintana, M.; da Silva, A.G.; Fernández-Cuevas, I.; Cerqueira, M.S.; Werneck, F.Z.; Marins, J.C.B. Can the body mass index influence the skin temperature of adolescents assessed by infrared thermography? J. Therm. Biol. 2023, 111, 103424. [Google Scholar] [CrossRef] [Scilit] [PubMed]
  162. Sund-Levander, M.; Grodzinsky, E. Accuracy when assessing and evaluating body temperature in clinical practice: Time for a change. Thermol. Int. 2012, 22, 90. [Google Scholar]
  163. Charkoudian, N. Skin blood flow in adult human thermoregulation: How it works, when it does not, and why. In Mayo Clinic Proceedings; Elsevier: Amsterdam, The Netherlands, 2003; Volume 78, pp. 603–612. [Google Scholar]
  164. Chen, Y.; Wang, H.; Lu, W.; Wu, T.; Yuan, W.; Zhu, J.; Lee, Y.K.; Zhao, J.; Zhang, H.; Chen, W. Human gut microbiome aging clocks based on taxonomic and functional signatures through multi-view learning. Gut Microbes 2022, 14, 2025016. [Google Scholar] [CrossRef] [Scilit] [PubMed]
  165. Snekhalatha, U.; Thanaraj, K.P.; Ammer, K. Artificial Intelligence-Based Infrared Thermal Image Processing and Its Applications; CRC Press: Boca Raton, FL, USA, 2022. [Google Scholar]
  166. Vardasca, R.; Simoes, R. Current issues in medical thermography. In Topics in Medical Image Processing and Computational Vision; Springer: Dordrecht, The Netherlands, 2013; pp. 223–237. [Google Scholar]
  167. van den Heuvel, C.J.; Ferguson, S.A.; Dawson, D.; Gilbert, S.S. Comparison of digital infrared thermal imaging (DITI) with contact thermometry: Pilot data from a sleep research laboratory. Physiol. Meas. 2003, 24, 717–725. [Google Scholar] [CrossRef] [Scilit] [PubMed]
  168. Ornek, A.H.; Ceylan, M. Comparison of traditional transformations for data augmentation in deep learning of medical thermography. In Proceedings of the 2019 42nd International Conference on Telecommunications and Signal Processing (TSP), Budapest, Hungary, 1–3 July 2019; pp. 191–194. [Google Scholar]
  169. Magalhaes, C.; Tavares, J.M.R.; Mendes, J.; Vardasca, R. Comparison of machine learning strategies for infrared thermography of skin cancer. Biomed. Signal Process. Control 2021, 69, 102872. [Google Scholar] [CrossRef] [Scilit]
  170. Verstockt, J.; Verspeek, S.; Thiessen, F.; Tjalma, W.A.; Brochez, L.; Steenackers, G. Skin cancer detection using infrared thermography: Measurement setup, procedure and equipment. Sensors 2022, 22, 3327. [Google Scholar] [CrossRef] [Scilit]
  171. Schmidt, M.F.; Liebmann, F.; Menenberg, M.; Rahman, S.M.; Holz, T.A.; Bergstrom, P.; Gust, J. Testing and performance standards for elevated skin temperature (EST) screening systems using infrared cameras. In Infrared Technology and Applications XLVII; SPIE: Bellingham, WA, USA, 2021; Volume 11741, pp. 208–227. [Google Scholar]
  172. Lee, J.K.; Tan, B.; Kingma, B.R.; Haman, F.; Epstein, Y. Biomarkers for warfighter safety and performance in hot and cold environments. J. Sci. Med. Sport 2023, 26, S71–S78. [Google Scholar] [CrossRef] [Scilit]
  173. Chudecka, M.; Lubkowska, A. Thermal maps of young women and men. Infrared Phys. Technol. 2015, 69, 81–87. [Google Scholar] [CrossRef] [Scilit]
Figure 1. Overall structure of the present review, showing the relationships among the main sections and subsections.
Mathematics 14 01666 g001
Figure 2. Schematic overview of the main thermographic feature representations.
Mathematics 14 01666 g002
Figure 3. Explainable machine-learning workflow in medical thermography. A thermographic image is first used for ROI selection and statistical feature extraction, followed by machine-learning or deep-learning analysis. Model-agnostic and deep-model explainability methods then generate interpretable outputs, including influential ROIs, heatmaps, and ranked features.
Mathematics 14 01666 g003
Figure 4. Translational maturity pathway for thermal biomarkers in medical thermography.
Mathematics 14 01666 g004
Table 1. Comparison of representative existing reviews and the present review.
Review/StudyBroad
Thermography
Machine Learning/Deep Learning (ML/DL)Explainable Artificial Intelligence (XAI)Biomarker
Focus
Lahiri et al. (2012) [11]Focus: General medical applications of infrared thermography.Limitation: Predates recent ML/XAI developments.
~
Kesztyüs et al. (2023) [22] Focus: Diagnosis, screening, monitoringLimitation: Limited computational focus
~
Wilson et al. (2023) [23]Focus: Thermal imaging and ML applications.Limitation: Engineering-oriented.
~~
Tsietso et al. (2022) [30]Focus: DL for breast thermography.Limitation: Breast-only review.
Disease-specific~
Wartakusumah et al. (2025) [34]Focus: AI in diabetic foot thermography.Limitation: Diabetic-foot-only.
Disease-specific~
Speeckaert et al. (2024) [17]Focus: Skin disease thermography.Limitation: Clinical, not AI-focused.
Application-specific~
Gulias-Cañizo et al. (2023) [18]Focus: Ophthalmic thermography.Limitation: Narrow application scope.
Application-specific~
Present reviewFocus: Explainable ML for interpretable thermal analysis and biomarker discovery.Limitation: Could be strengthened with structured evidence synthesis.
Note: ✓ denotes comprehensive discussion; ✗ denotes no discussion; ~ denotes brief introduction without detailed discussion.
Table 2. Comparison of feature selection and deep feature extraction methods for thermographic analysis.
MethodStrengthsWeaknessesApplicability
Principal Component AnalysisReduces dimensionality; computationally efficientComponents lack physiological meaning; not outcome-drivenCompresses regional/texture descriptors; limited biomarker interpretability
Mutual
Information
Captures nonlinear dependencies; model-agnosticUnstable with small samples; estimation-sensitiveRanks thermal features against outcomes; needs sufficient sample size
Pearson
Correlation
Simple, interpretable, fastLinear associations only; unstable with correlated featuresPreliminary screening of regional temperature and asymmetry features
Tree-based ImportanceHandles nonlinearity; captures interactionsModel-dependent; biased toward high-variance featuresRanks thermal descriptors; insufficient alone for biomarker claims
CNN-based featuresAutomatically learn complex spatial thermal patternsRequire larger datasets and are less interpretableUseful for image-level classification and risk prediction
Autoencoder latent featuresUseful for compression and anomaly detectionLatent features are difficult to interpretUseful for unsupervised thermographic analysis
Transfer-learned featuresHelpful when thermal datasets are smallRisk of domain mismatch from natural-image pretrainingUseful for thermography tasks with limited labeled data
Table 3. Comparison of major thermographic feature representations for interpretable machine learning.
Feature ClassMain Information CapturedStrengthsWeaknessesInterpretabilityRobustness to Protocol VariabilityBiomarker Potential
Pixel-based featuresLocal temperature and spatial variationMaximum fidelity to original dataHigh dimensionality; noise-sensitive; registration-sensitiveLow to moderateLowLimited unless aggregated or validated
Region-based statistical featuresAnatomically localized thermal summariesDimension reduction; physiologically intuitiveDepends strongly on the ROI definition and registrationHighModerateStrong candidate class for interpretable biomarkers
Texture featuresSpatial organization and heterogeneityCaptures structured thermal irregularity beyond the mean temperatureSensitive to preprocessing, quantization, and image resolutionModerateLow to moderateUseful but usually indirect physiologically
Feature-selected representationsReduced and prioritized the feature subsetHelps reduce redundancy and overfittingMay privilege statistical relevance over physiologyModerateVariableModerate if combined with reproducibility testing
Deep latent featuresHierarchical and distributed thermal patternsCan capture subtle, complex structuresPoor transparency; data-hungry; overfitting riskLow without XAI, moderate with XAILow to moderatePotentially high but weak unless explained and externally validated
Abbreviations: SD, standard deviation; ROI, region of interest; GLCM, gray-level co-occurrence matrix; LBP, local binary pattern; PCA, principal component analysis; CNN, convolutional neural network; XAI, explainable artificial intelligence.
Table 4. Representative application domains of medical thermography and associated machine-learning tasks.
Clinical/Physiological ApplicationTypical Thermographic TargetCommon Feature TypesTypical Learning TaskModeling ApproachesInterpretability RelevanceKey Limitation
Breast abnormality/breast cancer screeningFocal hyperthermia, asymmetry, vascular-like thermal patternsRegional statistics, asymmetry, texture, deep featuresClassificationSVM, CNN, U-Net/CNN, Mask R-CNNHigh, hot regions must be physiologically plausibleNot disease-specific; highly protocol-sensitive
Diabetic foot risk/ulcer preventionPlantar hot spots, contralateral asymmetry, regional elevationROI temperature, asymmetry, textureClassification/risk stratificationAdaBoost, conventional ML, CNNVery high, support early interventionDependent on segmentation and patient preparation
Vascular dysfunctionLocalized warming/cooling due to impaired perfusionRegional mean, gradients, asymmetryClassification/case assessmentConventional ML, rule-based analysisHigh, linked to blood flow physiologyThermal findings often nonspecific
Inflammation/rheumatic conditionsRegional heat elevation and irregular thermal distributionRegional descriptors, textureClassification/monitoringConventional ML, image analysisHigh, inflammatory signals may overlap with other causes Confounded by ambient conditions and systemic state
Musculoskeletal injuryLocal hot/cold regions, asymmetry, diffuse thermal changeROI statistics, textureClassification/severity supportConventional ML, CNNHigh, important for spatial localizationHeat patterns may evolve over time
Ocular/dermatologic thermographyLocal surface temperature changePixel, ROI, textureClassification/assessmentConventional ML, DLModerate to highSmall datasets; protocol variability
Fever/physiological screeningFacial or selected-region temperaturePixel/ROI temperaturesClassification/regressionStatistical models, MLModerateSensitive to measurement site and calibration
Ageing/biological age estimationDistributed age-related thermal signaturesRegional patterns, deep features, asymmetryRegressionRegression, CNN, representation learningVery high, age prediction is not biomarker validityConfounded by sex, body composition, health status
Abbreviations: SVM, support vector machine; CNN, convolutional neural network; ML, machine learning; DL, deep learning.
Table 5. Representative deep learning approaches for medical thermography tasks.
ReferencesMethodTypeStrengthWeaknessDomain
Alshehri et al. [114]VGG16 + AttentionHybrid DL + AttentionHigher accuracy, transfer learningHigher computational complexityBreast cancer
Alzahrani et al. [115]Five-layer CNN + PSOHybrid DLOptimized feature learningRequires extensive tuning for better performance
Munguía-Siu et al. [116]VGG16-LSTMHybrid DLCaptures spatial + temporal featuresHigher computational complexity
Alshehri et al. [117]CNN + AttentionHybrid DL + AttentionFocus on relevant regionsIncreased risk of overfitting
Ghatge et al. [118]Three-Layer CNN with Privacy-preserving pipelineDLSecure + robust classificationAdded system complexity
Civilibal et al. [32]ResNet-50DLEnd-to-end automatic feature extractionRequires a large amount of training data
Tello-Mijares et al. [119]GVF + Five-layer CNNHybrid GVF + DLBetter segmentation accuracyExtensive preprocessing required
Kanimozhi et al. [120]U-NetDLAccurate lesion segmentationHigher computational complexity
Guan et al. [121]AutoencoderDLEffective segmentationHigh computational cost
Mohamed et al. [122]U-Net with AVG-MAX VPBDLImproved feature representationLimited generalization
Khomsi et al. [123]FF-DNNDLEstimates tumor sizeComplex modeling
Ensafi et al. [124]DenseNet12, EfficientNetB0, and VGG19DLImproved accuracy via modality fusionHigher computational complexity
Jalloul et al. [75]ResNet152 + SVMHybrid DL + MLImproved performanceDL requires more data and training time
Al Husaini et al. [125]Inception Mv4DLFast detectionHardware dependency
Khandakar et al. [28]Traditional ML and MobilenetV2Hybrid ML + DLSimple, interpretableLower accuracyDiabetic foot
Cruz-Vega et al. [126]DFNetHybrid DL + SVMHigh classification accuracyRequires a large dataset
Anaya-Isaza et al. [127]ResNet50v2DLImproves generalizationHigh data-dependency
Cao et al. [128]GoogLeNet-inspired + CBAM attentionHybrid DL + AttentionHandles low contrastMulti-stage complexity
Zhang et al. [129]Adaptive MultimodalHybrid DLFuses multimodal information for improved performanceComplex integrationThyroid nodules
Umapathy et al. [130]VGG16DLRobust detectionHigher computational complexityOrofacial pain
Jagadev et al. [131]ResNet50+FLDHybrid DLContactless sensingEnvironmental sensitivityRespiration monitoring
Luo et al. [132]ResNet18DLPrognostic capabilityInterpretability issuesHypoperfusion
Lyra et al. [133]YOLOv4-TinyDLNon-contact monitoringLimited disease specificityICU/vital signs
Pandey et al. [134]CapsNetDLPreserves spatial relationships, robust featuresHigher computational complexitySuperficial ailments
Sheikh et al. [135] SoleFusion-NetHybrid DLExplainable + multimodal fusion improves accuracyComplex architectureDiabetic foot syndrome
Rudnicka et al. [136]Spiking Neural NetworkDLEnergy-efficient, brain-inspired networkLimited maturity, complex training processRheumatoid arthritis
Wang et al. [137]ConvNeXtDLAchieved higher performanceRequires a large datasetPressure injuries
Bansode et al. [138]GLCM + Neural NetworkHybrid DLCombines texture features with effective learning abilitiesFeature dependencyThyroid disorder
Weber et al. [139]DeepLabv3+DLCaptures physiological patternsNot disease-specificHuman physiology (sports science)
Table 6. Explainability methods relevant to medical thermography: use cases, strengths, and limitations.
Explainability MethodTypeTypical
Input/Model
OutputMain Use in ThermographyStrengthsMain
Limitations
Appropriate Role in Biomarker Analysis
SHAP
[110,141]
Model-agnostic/feature attributionTabular ML, tree models, deep modelsFeature contribution valuesIdentifying influential thermal variables such as asymmetry or regional temperatureLocal and global interpretation; intuitive rankingSensitive to background distribution and feature dependenceGood for prioritizing candidate thermal markers
LIME
[57,143]
Model-agnostic/local surrogateAny black-box predictorLocal linear explanationExplaining individual abnormal predictionsUseful for case-based interpretationCan be unstable; depends on perturbation designBest for illustration, not robust biomarker claims
Tree-based feature importance
[75,144]
Model-specificRandom Forest, XGBoost, boostingImportance rankingRanking thermal descriptorsSimple and widely usedModel-dependent; can be biased and unstablePreliminary screening tool
Grad-CAM
[140,145,146]
Deep learning visualizationCNN-based image modelsClass activation heatmapLocalizing influential hot/cold regions in thermogramsIntuitive image-level explanationCoarse spatial localization; not causalGood for region prioritization
Saliency maps
[147,148,149,150]
Deep attributionCNN/image modelsPixel-level sensitivity mapVisualizing fine-grained image sensitivityHigh resolutionNoisy and unstable; architecture-sensitiveExploratory only
Layer-wise relevance propagation
[151,152,153]
Deep attributionNeural networksPixel/feature relevanceTracing importance through image pixelsPotentially more detailed than heatmapsSensitive to model choice and implementationExploratory/
supportive
Attention maps
[154,155,156,157,158]
Transformer/attention modelsViTs and attention-based architecturesRegion interaction/weight patternUnderstanding distributed thermal structureCaptures long-range dependenciesAttention is not always true explanationSupportive only
Abbreviations: SHAP, Shapley additive explanations; LIME, local interpretable model-agnostic explanations; Grad-CAM, gradient-weighted class activation mapping; CNN, convolutional neural network; ML, machine learning; ViTs, Vision Transformers; XGBoost, extreme gradient boosting.
Table 7. Proposed framework for assessing translational maturity of candidate thermal biomarkers.
Biomarker LevelDescriptionExample in ThermographyEvidence RequiredMain Risk If Used Prematurely
Level 1: Predictive featureFeature improves model performance in one datasetROI temperature, asymmetry, texture value, deep embeddingInternal model performance onlyMistaking correlation for meaningful physiology
Level 2: Explainable candidate markerFeature/region is highlighted consistently by XAI or feature attributionRecurrent hot spot or contralateral asymmetry highlighted by SHAP/Grad-CAMStable explanation within dataset and across resamplingExplanation may still reflect artifact or dataset bias
Level 3: Reproducible thermal markerSignal remains stable across sessions, cohorts, devices, or protocolsSimilar asymmetry pattern reproduced under standardized acquisitionRepeatability, reproducibility, and external validationOvergeneralizing from single-center findings
Level 4: Physiologically grounded markerThermal feature has plausible linkage to perfusion, inflammation, metabolism, or thermoregulationRegion-specific thermal pattern associated with vascular dysfunction or ageing mechanismAnatomical consistency and physiological evidenceMechanistic overinterpretation without validation
Level 5: Clinically validated biomarkerMarker supports diagnosis, prognosis, monitoring, or stratification in real settingsThermal marker linked to independent clinical outcomesProspective/multicenter validation and clinical utilityPremature clinical claims
Abbreviations: ROI, region of interest; XAI, explainable artificial intelligence; SHAP, Shapley additive explanations; Grad-CAM, gradient-weighted class activation mapping.
Disclaimer/Publisher’s Note: The statements, opinions and data contained in all publications are solely those of the individual author(s) and contributor(s) and not of MDPI and/or the editor(s). MDPI and/or the editor(s) disclaim responsibility for any injury to people or property resulting from any ideas, methods, instructions or products referred to in the content.