1. Introduction
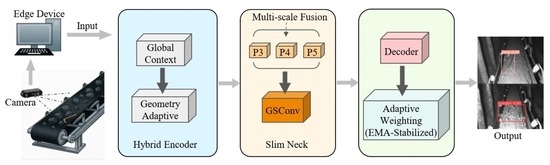
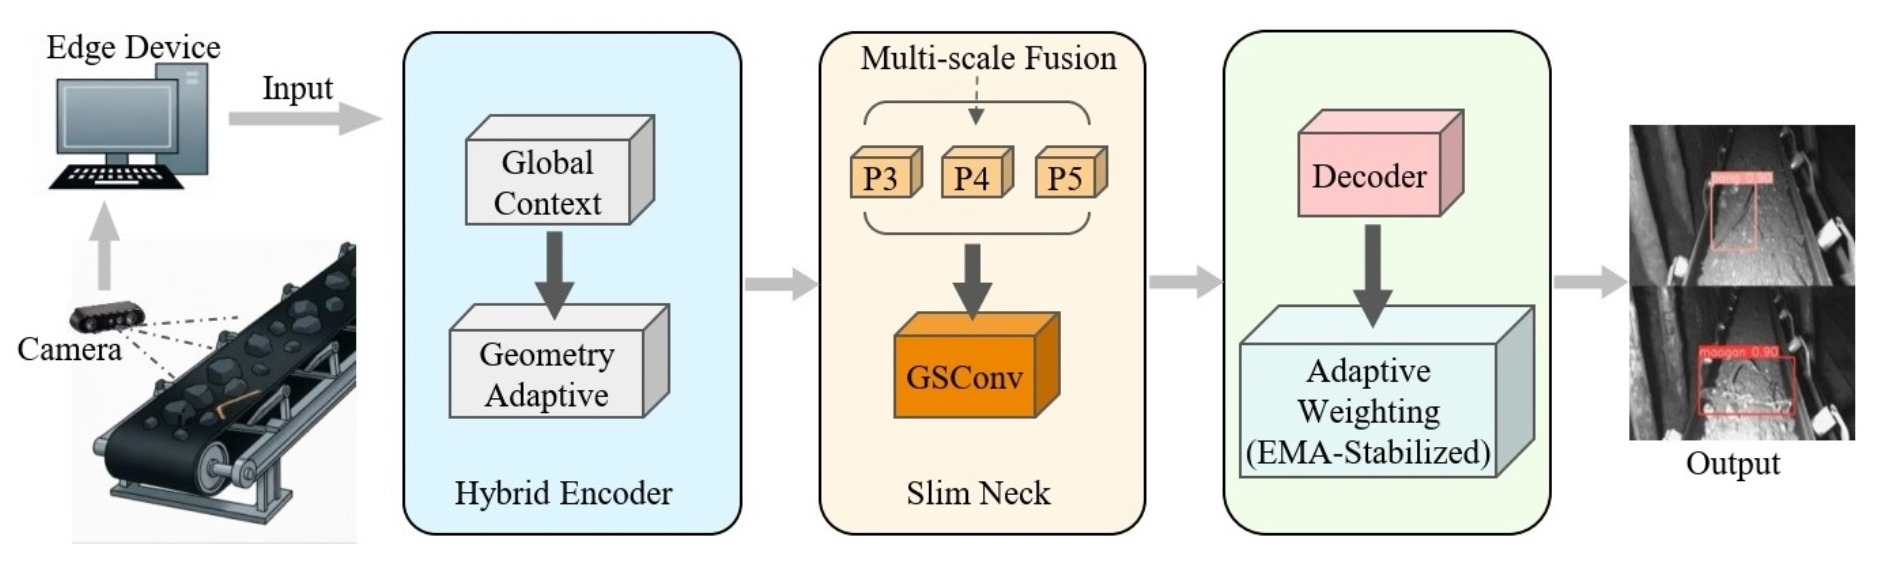
The degree of automation and intelligence in material logistics is a practical indicator of modernization in large-scale mining. As shown in
Figure 1, belt conveyors enable long-distance, high-throughput, continuous transport of bulk materials, so their integrity and stable operation directly affect production continuity and costs [
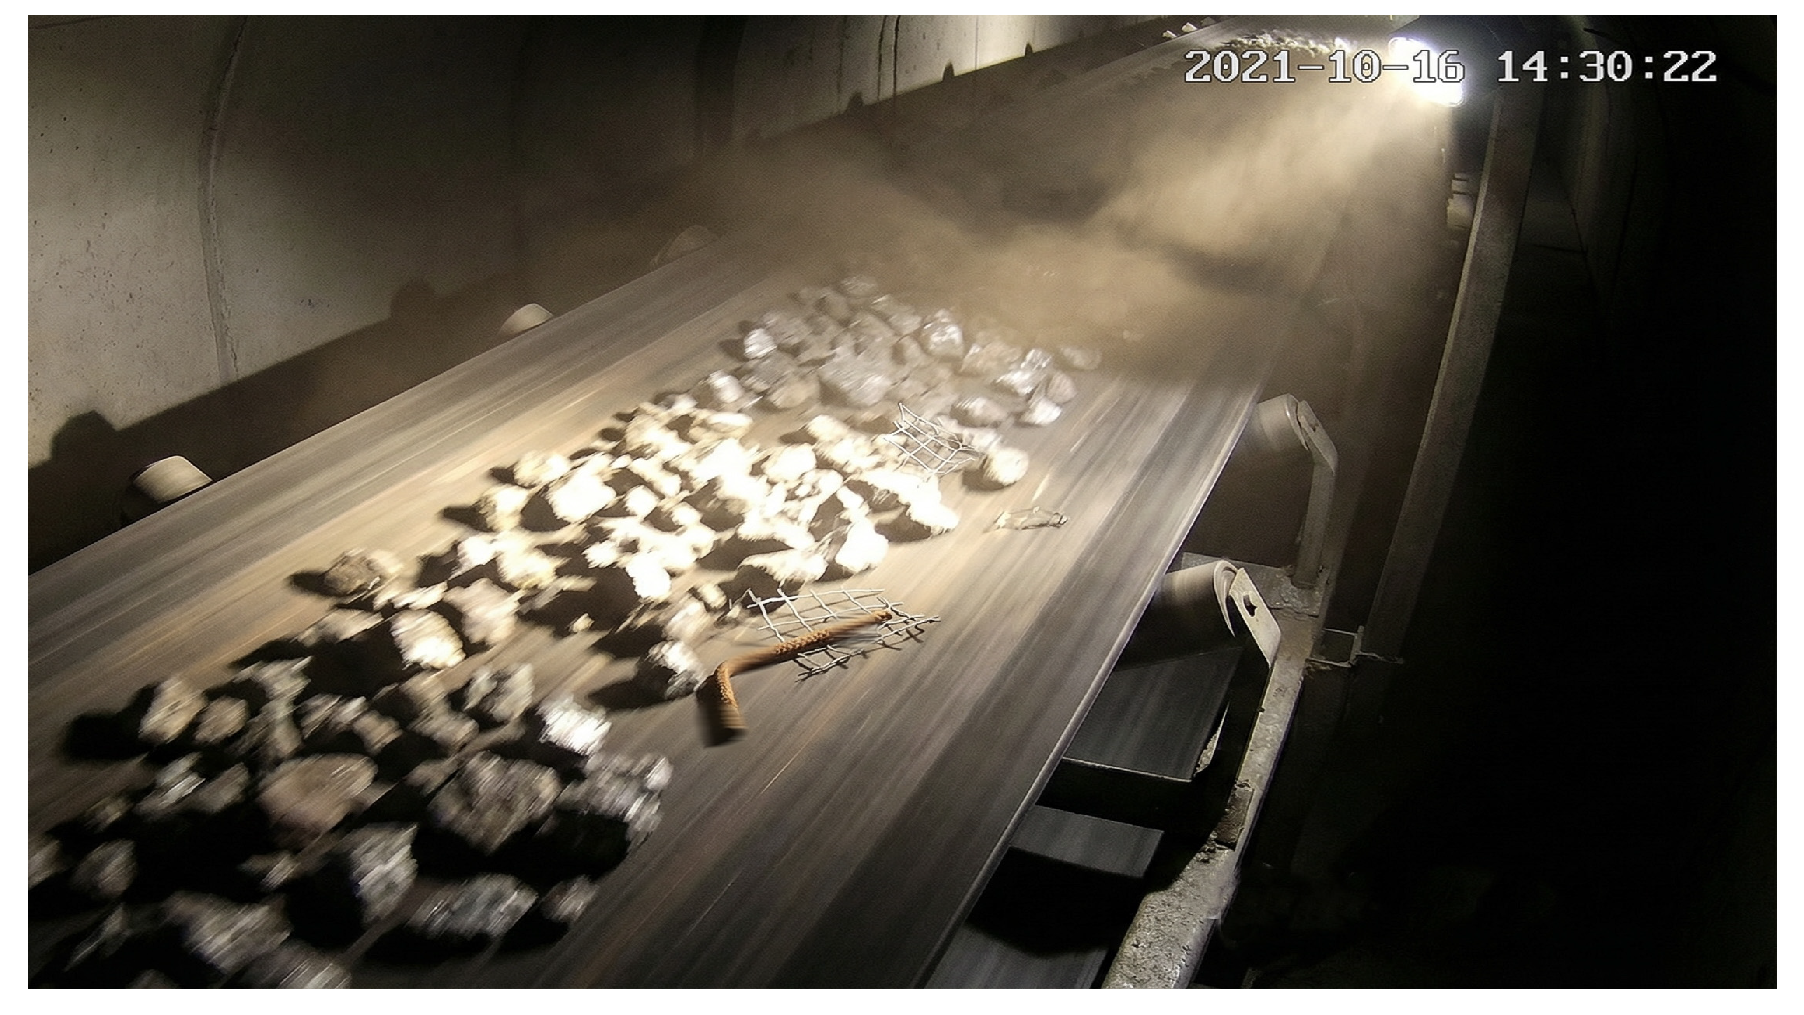
1]. In practice, hazardous foreign objects such as wooden blocks, discarded anchor rods, and metal mesh often intrude into conveyor lines. In practice, hazardous foreign objects such as wooden blocks, discarded anchor rods, and metal mesh are often observed intruding into conveyor lines; for instance, at a mine located in Wuxuan County, Guangxi, China, such intrusions occur frequently. Their irregular shapes and varying sizes, combined with dust, occlusions, and rapidly changing illumination underground, make them easy to miss and risky to ignore [
2]. It should be noted that conveyor belt specifications and operating conditions may differ across mines, and the phenomena described here are based on observations at this specific site. If not detected and removed in time, these intrusions can cause belt tearing, accelerated abrasive wear, and severe mechanical failures, increasing maintenance costs, interrupting production, and creating safety hazards, especially when manual intervention is required in confined, poorly lit roadways [
3].
Historically, non-destructive testing and evaluation of conveyor systems has relied on manual inspection, metal detectors, or radar-based sensing. These approaches tend to be inefficient, limited in scope, and costly over the system lifecycle. More importantly, many conventional scalar sensors cannot characterize non-metallic hazards, which limits their suitability for high-speed mining systems [
4]. Automated visual testing based on deep learning offers richer anomaly representation than traditional measurement methods. With modern hardware, detectors such as YOLO [
5], RetinaNet [
6], Faster R-CNN [
7], and the Transformer-based DETR [
8] have achieved strong results, and mining-oriented adaptations have been reported for online condition monitoring. For example, Wang et al. [
9] improved SSD algorithms for underground coal mines; Tian et al. [
10] proposed a CNN-based method that utilizes time–frequency images derived from electromagnetic non-destructive testing signals to identify damage in mining wire ropes; and Saran et al. [
11] developed multimodal imaging for steel mill conveyors. Other methods include Wang et al.’s [
12] VMD-SVM-based feature extraction approach for gangue, Pu et al.’s [
13] CNN-based recognition model that employs transfer learning to mitigate overfitting, and Sun et al. [
14] proposed AMAF-YOLO to address the challenges of low-resolution and densely distributed targets in complex, cluttered environments. Lai et al. [
15] combined an improved Mask R-CNN with multispectral imaging for gangue instance segmentation. Hong et al. [
16] proposed a dual-model weak-light enhancement pipeline with a lightweight star-shaped attention convolutional detector (SARC-DETR) for foreign object detection under low illumination. To reduce the high computational cost and slow inference of many deep learning models, Lin et al. [
17] developed a lightweight detector based on an improved YOLOv8n, facilitating deployment on embedded monitoring nodes. These studies demonstrate the feasibility of vision-based perception in complex industrial environments.
To address these challenges, this study proposes FDSE-DETR (Faster-DCN-Slim Neck-EMASVFL-DETR), a lightweight end-to-end visual measurement framework for real-time anomaly evaluation in mining operations. Built on RT-DETR, the framework retains efficient end-to-end inference and avoids Non-Maximum Suppression (NMS). FDSE-DETR follows a single design logic: maintain high sensitivity to small, irregular hazards in cluttered scenes while staying within strict edge-device budgets. To meet this constraint, the backbone emphasizes deformation-aware feature sampling so that thin or distorted objects remain distinguishable, the fusion stage prioritizes low-cost multi-scale aggregation to preserve fine cues without increasing latency, and the training objective rebalances hard samples under severe class imbalance to improve the detection confidence. In our implementation, these choices are realized with a dual-path backbone using FasterNet-style blocks with DCNv2-based deformable sampling [
18,
19], a compact Slim Neck based on GSConv and VoVGSCSP [
20], and EMASlideVarifocalLoss (EMASVFL) using sliding-window reweighting with exponential moving averages [
21,
22]. Overall, FDSE-DETR is designed to balance accuracy, latency, and deployability for automated structural health monitoring in intelligent mining systems.
The remainder of this paper is organized as follows.
Section 2 reviews object detection fundamentals.
Section 3 presents FDSE-DETR, including the architecture, backbone, loss function, and low-light image enhancement methods.
Section 4 describes the experimental setup, datasets, and results, including comparisons across backbones and neck networks and against existing approaches.
Section 5 concludes this paper.
3. FDSE-DETR Network Architecture
This study presents an enhanced visual measurement framework that balances evaluation accuracy and inference efficiency under three practical constraints, namely heavy environmental noise, large variations in anomaly scale, and limited computing on embedded monitoring instruments. The proposed architecture is derived from the lightweight RT-DETR-R18 baseline and is tailored for in situ deployment.
As shown in
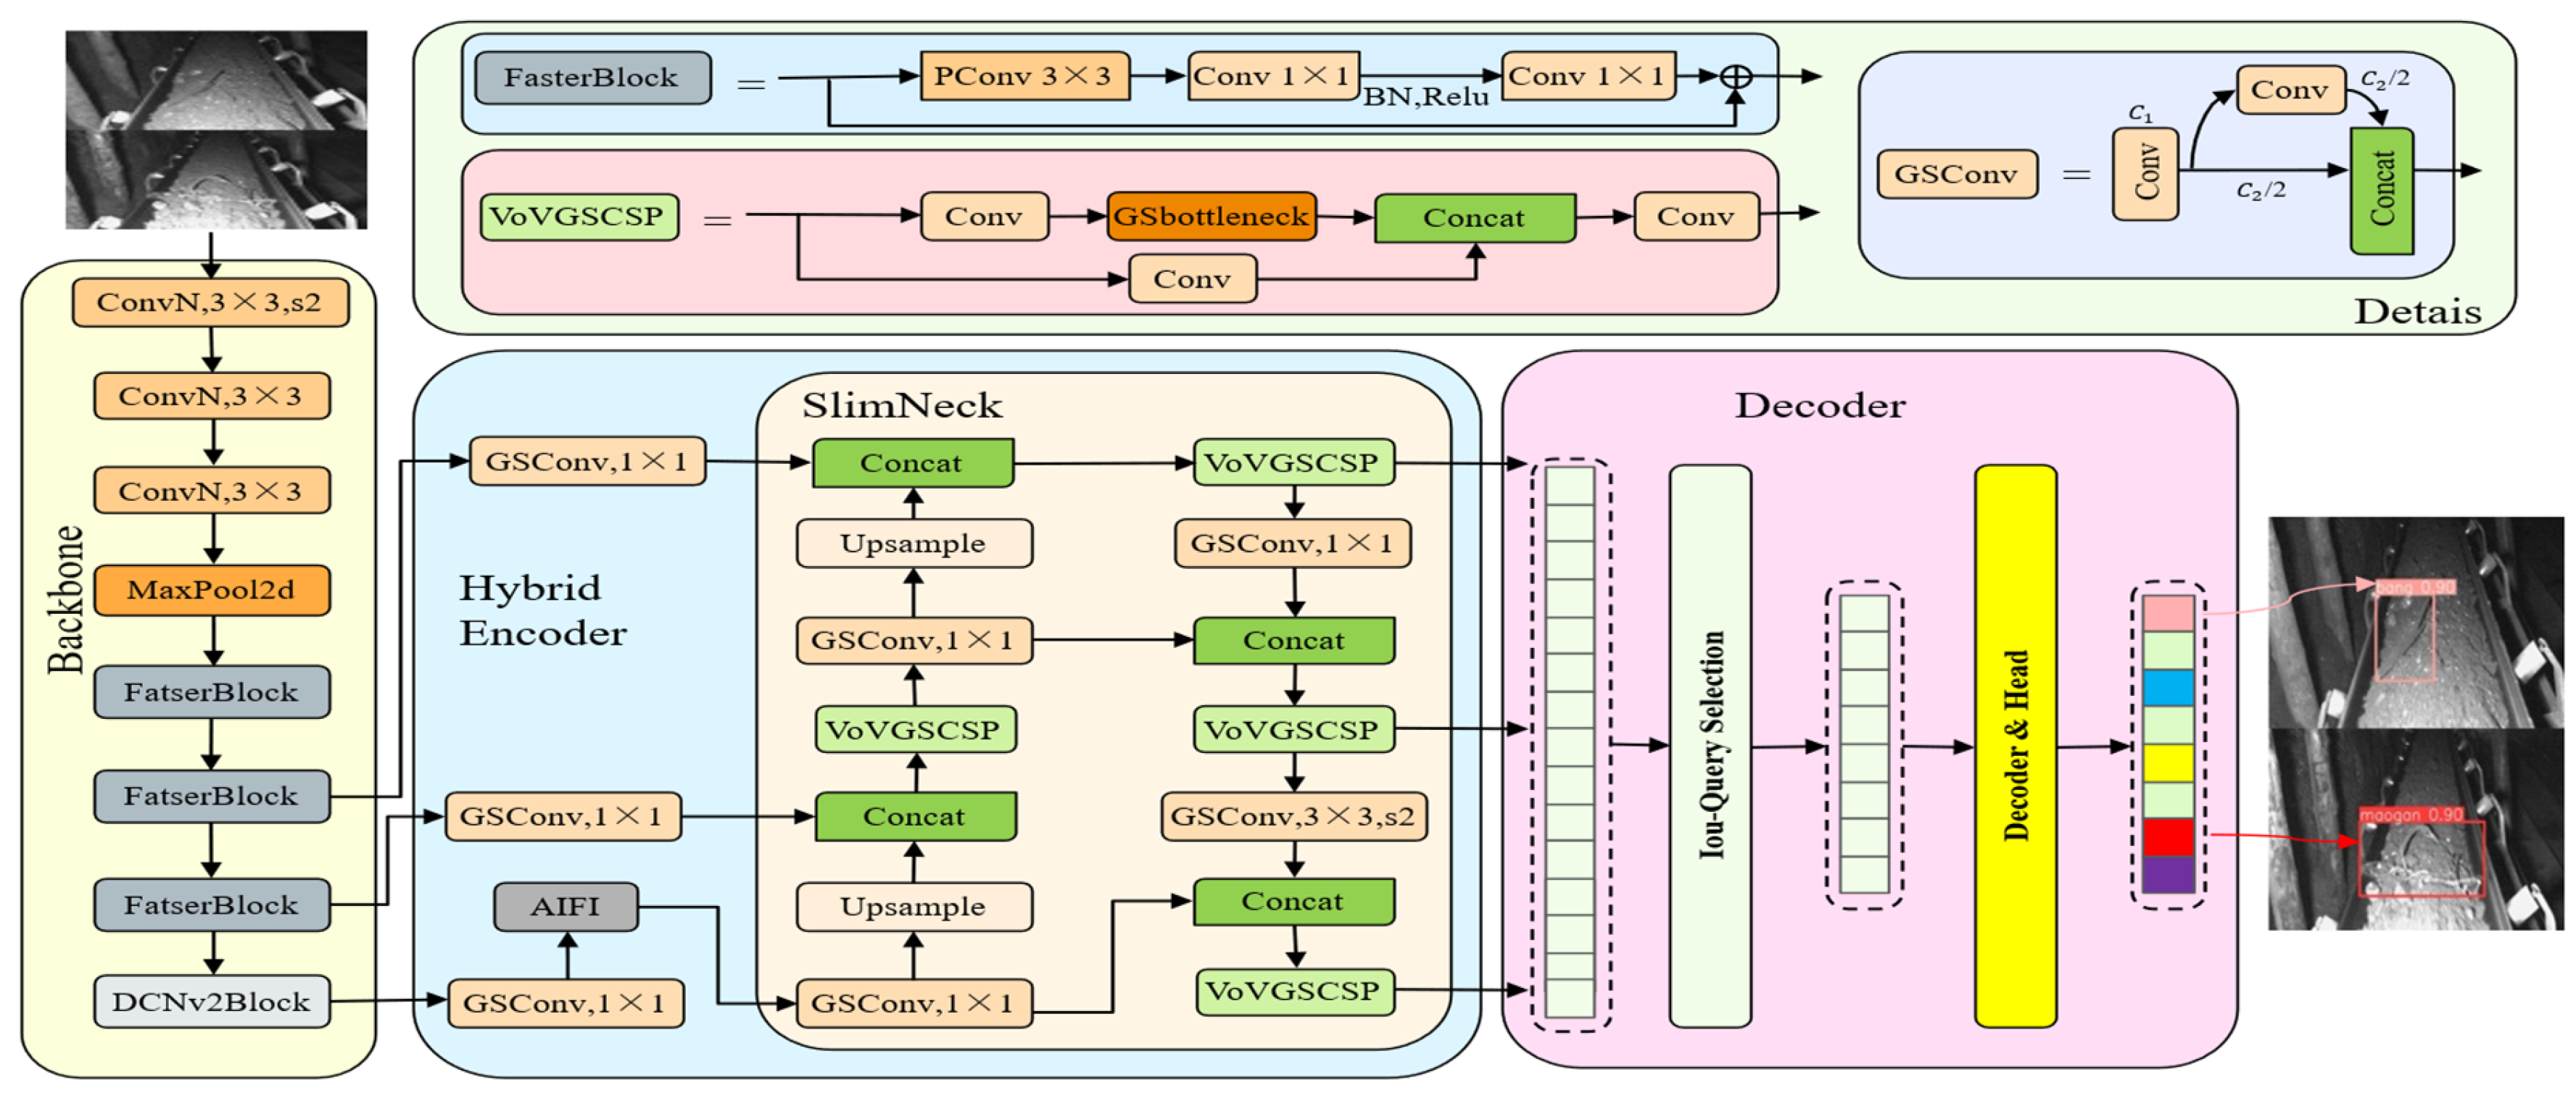
Figure 2, RT-DETR follows an end-to-end object detection paradigm comprising three key components: a backbone network for multi-scale feature extraction, a hybrid encoder that combines an attention-driven global modeling module (AIFI) with a lightweight CCFM, and a Transformer decoder with a detection head. The hybrid encoder decouples global context modeling from local feature fusion, reducing computational overhead while preserving rich spatial details. The decoder iteratively refines initial queries via multi-layer Transformer blocks and outputs category, confidence, and bounding box predictions using bipartite graph matching, eliminating the need for NMS during inference.
FDSE-DETR is organized around a single requirement: the system must preserve weak but safety-critical cues from small and irregular hazards in cluttered conveyor scenes, while remaining deployable on resource-constrained devices. To meet this requirement, this study adjusts feature extraction, feature fusion, and the training objective in a coordinated manner so that each part supports the same end goal.
Specifically, the mining conveyor environment presents four challenges that existing detectors fail to handle adequately.
One such challenge is poor visibility due to low light and high dust, which causes existing models to lose fine texture details. To address this, the backbone uses partial convolution in FasterNet-style Faster Blocks (stages 2–4). PConv reduces redundant computation while preserving high-frequency details, enabling real-time inference on embedded devices under degraded illumination, a need that standard convolutions cannot satisfy without excessive cost.
Another issue is that hazards often have irregular shapes, such as bent anchor rods or tangled nets, whereas existing detectors rely on fixed convolution kernels that cannot adapt to such geometries. Therefore, stage 5 adopts DCNv2-based deformable sampling, which dynamically adjusts sampling locations according to object shape, directly overcoming the rigidity of conventional kernels.
Furthermore, the small size of anomalies is critical: lightweight fusion modules in existing models tend to suppress weak cues from small objects. To remedy this, the neck replaces the original CCFM with a compact Slim Neck that employs GSConv, which preserves small anomaly signals during multi-scale fusion while maintaining low computational cost.
Lastly, severe class imbalance (maogan:bang ≈ 2.8:1) biases standard loss functions toward the majority class, leading to poor recall for the rare but safety-critical bang class. Existing losses such as Focal Loss adjust weights only based on the current prediction of each sample. However, in mining scenarios the difficulty of ambiguous cases, such as a partially occluded anchor rod, can change as training progresses. A purely instantaneous weight may fail to track this shift. To overcome this limitation, this study proposes EMASVFL, a dynamically weighted loss built on Varifocal Loss with an exponential moving average mechanism. EMASVFL maintains a global indicator of training difficulty using the batch-wise mean Intersection-over-Union (IoU), which is updated after each batch via an exponential moving average. This smoothed signal reduces sensitivity to transient noise and stabilizes convergence. Based on this global IoU mean, a sliding modulation weight is defined: it assigns higher gradients to samples that remain difficult yet informative, while down-weighting easy or already well-detected samples. As a result, EMASVFL behaves like a dynamic gain control mechanism. Early in training, the model learns easier cues; later, after global performance becomes more stable, it places more emphasis on hard anomalies such as occluded bolts or rod-like objects. This design effectively handles the 2.8:1 class imbalance that existing losses cannot properly address, improving the discriminability of anomaly responses and increasing robustness to environmental interference.
In summary, each component of FDSE-DETR is motivated by a specific mining challenge and directly remedies a clear shortcoming of off-the-shelf solutions.
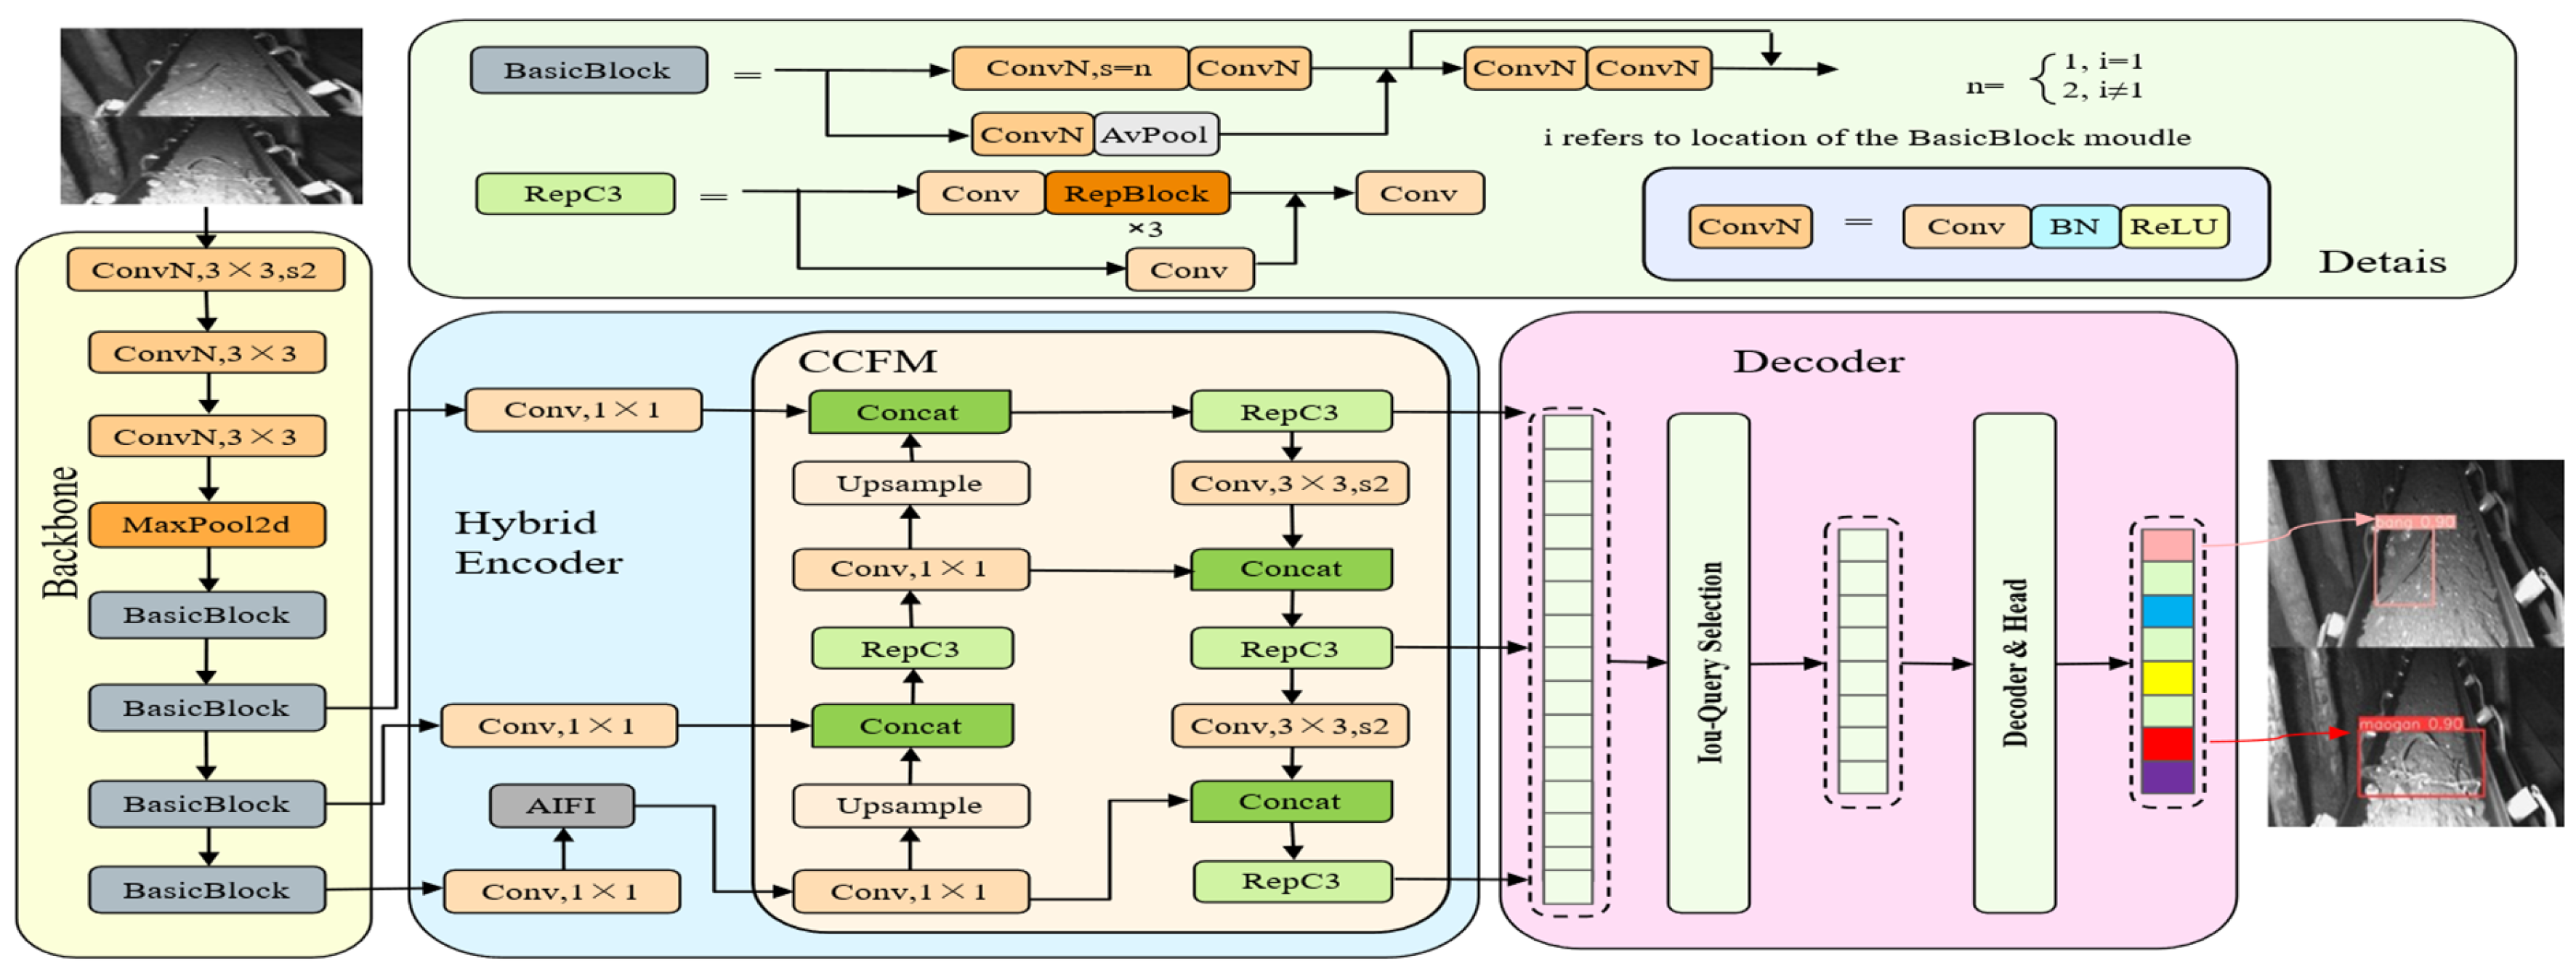
Figure 3 shows the overall FDSE-DETR architecture, which includes a backbone, an encoder, and a decoder. After preprocessing, images are fed into the backbone to extract multi-scale features. The encoder and decoder follow the end-to-end RT-DETR design. IoU-aware query selection retains high-quality object queries, which are then refined through stacked Transformer decoder layers. The detection head outputs class probabilities and bounding boxes jointly. This end-to-end formulation avoids Non-Maximum Suppression and maintains reliable evaluation while limiting algorithmic complexity, which suits real-time deployment in resource-constrained mining environments.
3.1. Lightweight Feature Extraction via Faster Block
To support automated visual testing on resource-constrained embedded instruments such as intrinsically safe cameras in mines, the network must keep computation low while maintaining real-time throughput. In this framework, this study adopt the Faster Block module [
18] in the backbone to reduce the cost of spatial feature processing.
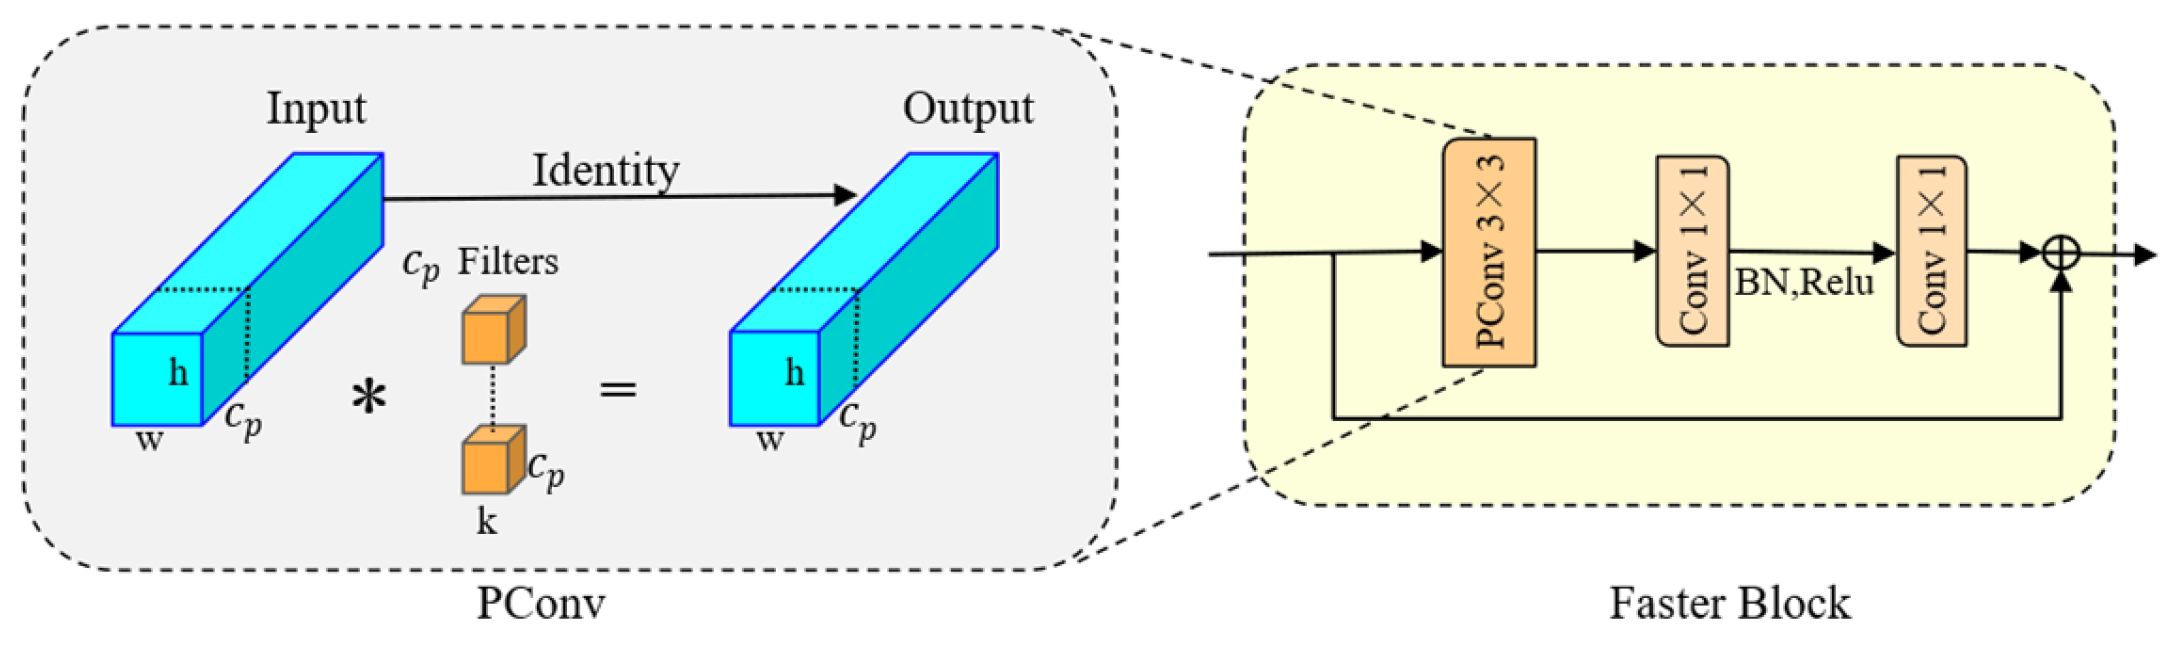
The key idea in the Faster Block is partial convolution (PConv), which improves the efficiency of spatial feature extraction. Standard convolution applies spatial filtering across all channels, which can waste computation on repetitive background patterns. In contrast, PConv applies spatial convolution to only a subset of channels and leaves the remaining channels unchanged. This is well matched to conveyor belt monitoring because large areas of the image are dominated by relatively uniform belt surfaces, while the foreign-object regions require richer spatial modeling.
In terms of computation, PConv substantially reduces complexity. As shown in
Figure 4, PConv splits the input feature map into two branches. One branch is a spatial processing path that applies a standard 3 × 3 convolution to a subset of channels, denoted as
, to extract anomaly-related spatial features. The other branch is an identity path that passes the remaining channels through without spatial convolution so that the original signal content is preserved. The complexity is defined by Equation (1):
where
denotes the spatial size and
denotes the kernel size. With a typical ratio
, only 25% of the channels receive the more expensive spatial convolution. As a result, FLOPs are reduced to about 1/16 of standard convolution under the same channel setting.
For in situ measurement instrumentation, PConv also reduces memory access by avoiding redundant read and write operations on the unchanged channels. This is reflected by the memory access approximation in Equation (2):
This reduction lowers memory bandwidth demand to roughly one-quarter of the standard case, which helps relieve a common bottleneck on edge hardware. Subsequent 1 × 1 convolutions provide cross-channel communication, fusing the anomaly features extracted by the spatial path with the context preserved by the identity path. Overall, the Faster Block provides a practical trade-off between efficiency and anomaly representation, which supports deployment on lightweight mining monitoring nodes.
3.2. Adaptive Anomaly Characterization via DCNv2
Using Faster Blocks in shallow stages reduces computation, but this alone does not fully capture the diverse shapes of hazardous objects. To improve geometric modeling where high-level semantics are formed, this study places DCNv2 in the fifth stage of the backbone. Compared with standard convolution, which samples features on a fixed grid, DCNv2 learns sampling locations conditioned on the target structure. This makes the feature extractor more tolerant to non-rigid shapes and scale changes, which is important for irregular debris on mining conveyor belts under cluttered backgrounds.
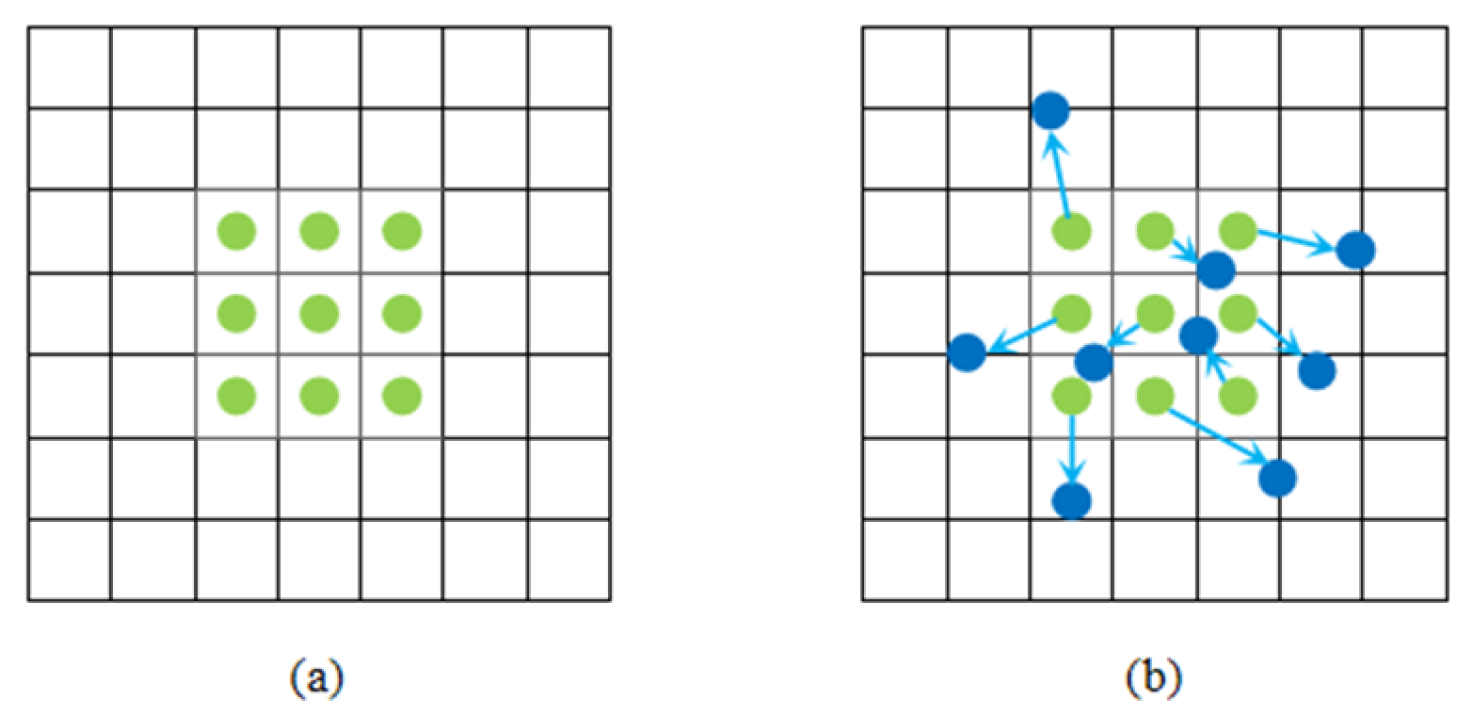
A standard convolution with a 3 × 3 kernel can be viewed as a rigid template sliding over the feature map. For each output position , it samples from a predefined regular grid. This fixed sampling pattern becomes less effective when targets exhibit strong geometric deformation, such as bent anchor rods or twisted metal mesh, because informative regions may fall outside the rigid grid while background regions are unnecessarily included.
DCN relaxes the fixed grid by introducing learnable offsets
so that sampling points can move to better match the target topology [
33]. As illustrated in
Figure 5, deformable sampling provides position awareness and improves sensitivity to curvilinear object structures.
On 2D images, DCNv2 extends deformable convolution by learning both an offset vector
and a modulation scalar
. The resulting feature computation is given in Equation (3):
Here, acts as a learnable weight that controls the contribution of each sampling point. In our setting, this mechanism helps downweight samples that drift into non-target regions such as ore background textures or specular glare on the belt surface. As a result, downstream layers receive cleaner signals, and localization becomes more reliable in complex environments. Compared with earlier deformable variants, DCNv2 reduces the chance that sampling points fall on irrelevant background regions, which improves robustness under clutter.
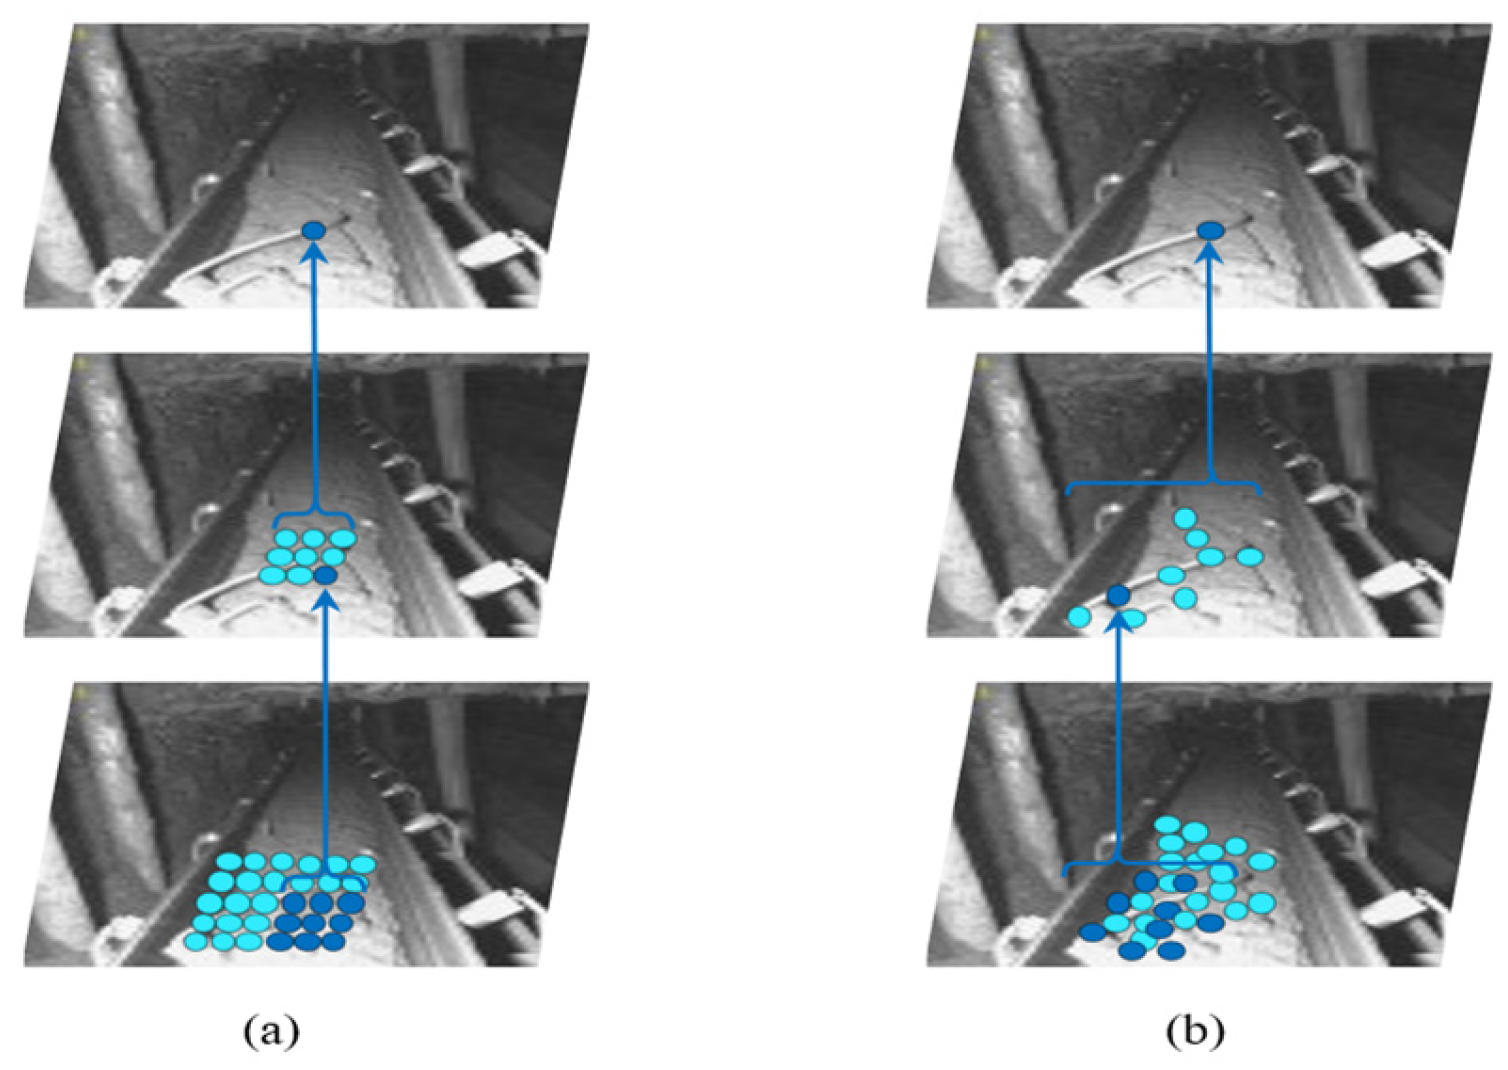
Figure 6 further illustrates why DCNv2 is beneficial for anomaly characterization. With objects such as anchor rods, fixed receptive fields often capture the target incompletely while admitting excessive background noise. DCNv2 mitigates this by aligning sampling locations with the object geometry rather than a predefined rectangular neighborhood. Adding DCNv2 in the deeper stage strengthens the network’s ability to represent the geometric deformations that are common in mining debris. This improves the signal-to-noise ratio of the feature map without additional computational overhead, and it helps preserve recognition accuracy after the model is lightweighted for embedded instruments.
3.3. Optimized Feature Aggregation via Slim Neck Architecture
In RT-DETR-R18, the hybrid encoder uses CCFM to support multi-scale feature interaction. While this design enables cross-scale communication, its reliance on dense standard convolution can create high memory bandwidth pressure on embedded measurement instruments, which makes low-latency deployment difficult. In addition, fixed-grid receptive fields in the fusion stage can be less effective for elongated targets and very small anomalies, where subtle cues are easily overwhelmed by background clutter. To better match these constraints, this study introduces a Slim Neck, a lightweight fusion module designed to reduce bandwidth demand while preserving the features needed for reliable anomaly discrimination.
As shown in
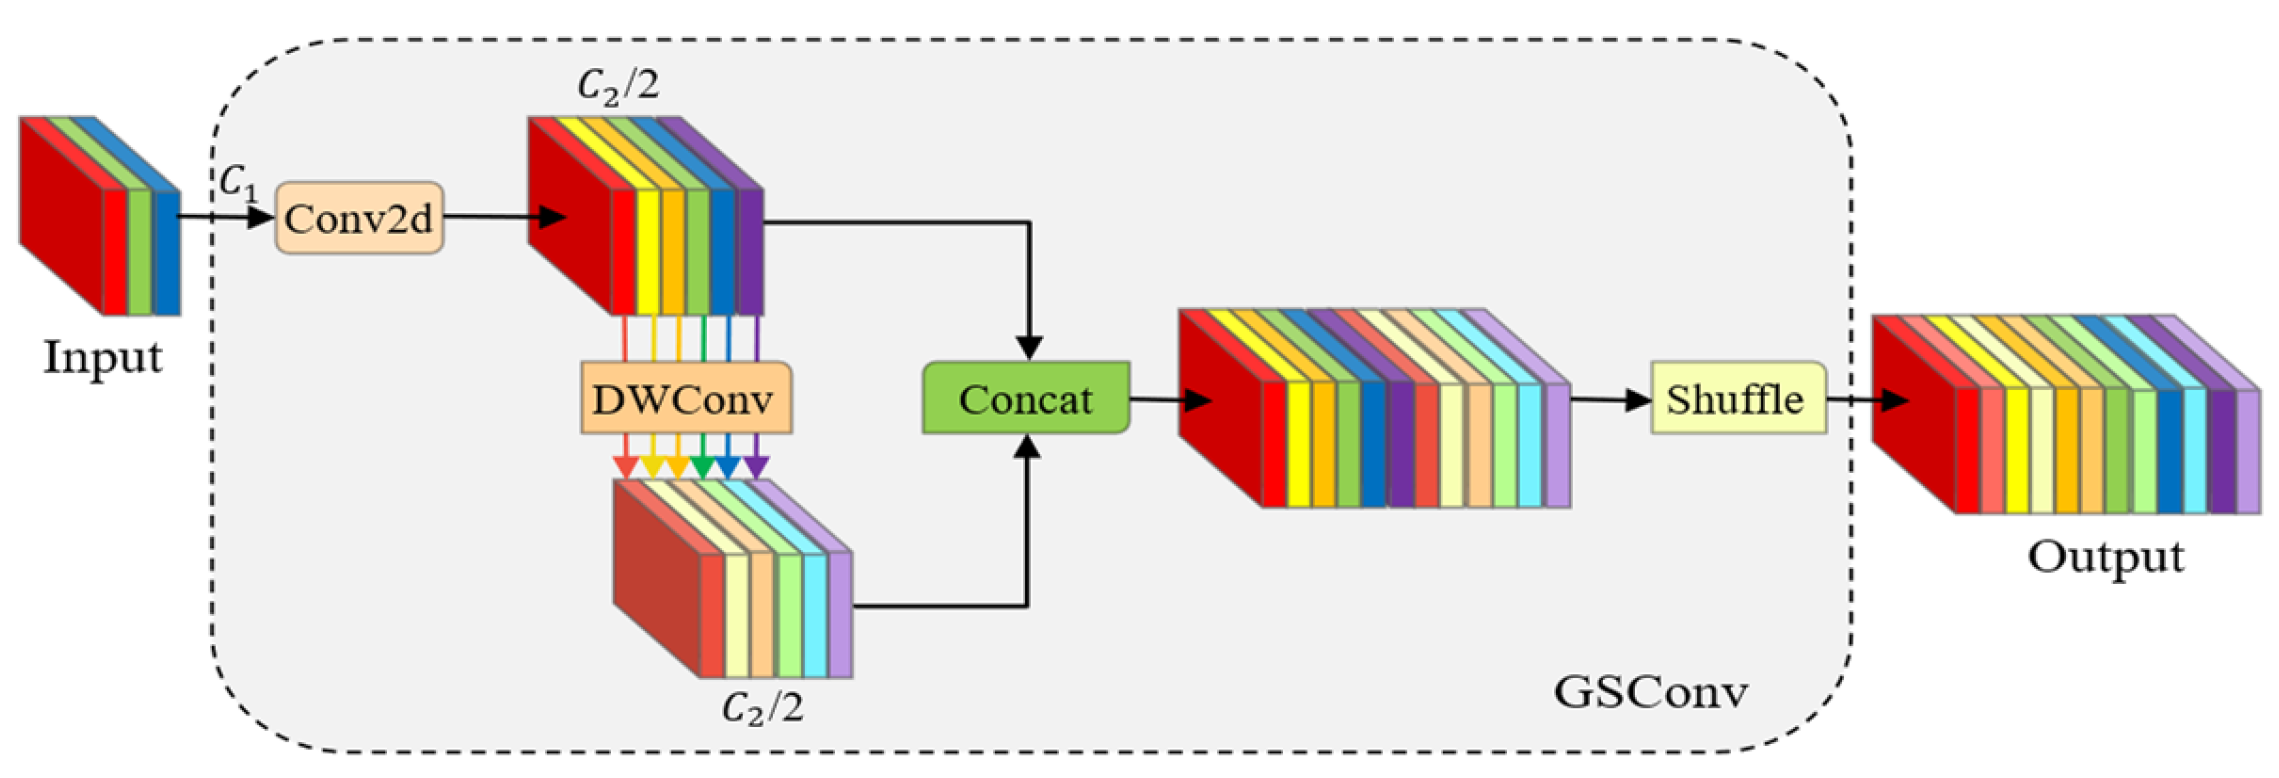
Figure 7, Slim Neck applies GSConv to process high-level semantic features. GSConv reduces the cost of feature mixing by producing a compact intermediate representation and then reconstructing the full channel response through inexpensive operations. This lowers computing and memory traffic on edge devices. Slim Neck also keeps the AIFI module. As a Transformer-based component, AIFI captures global dependencies at the coarsest scale, which helps the system maintain structural context of the conveyor scene and reduces confusion between true hazards and random environmental patterns.
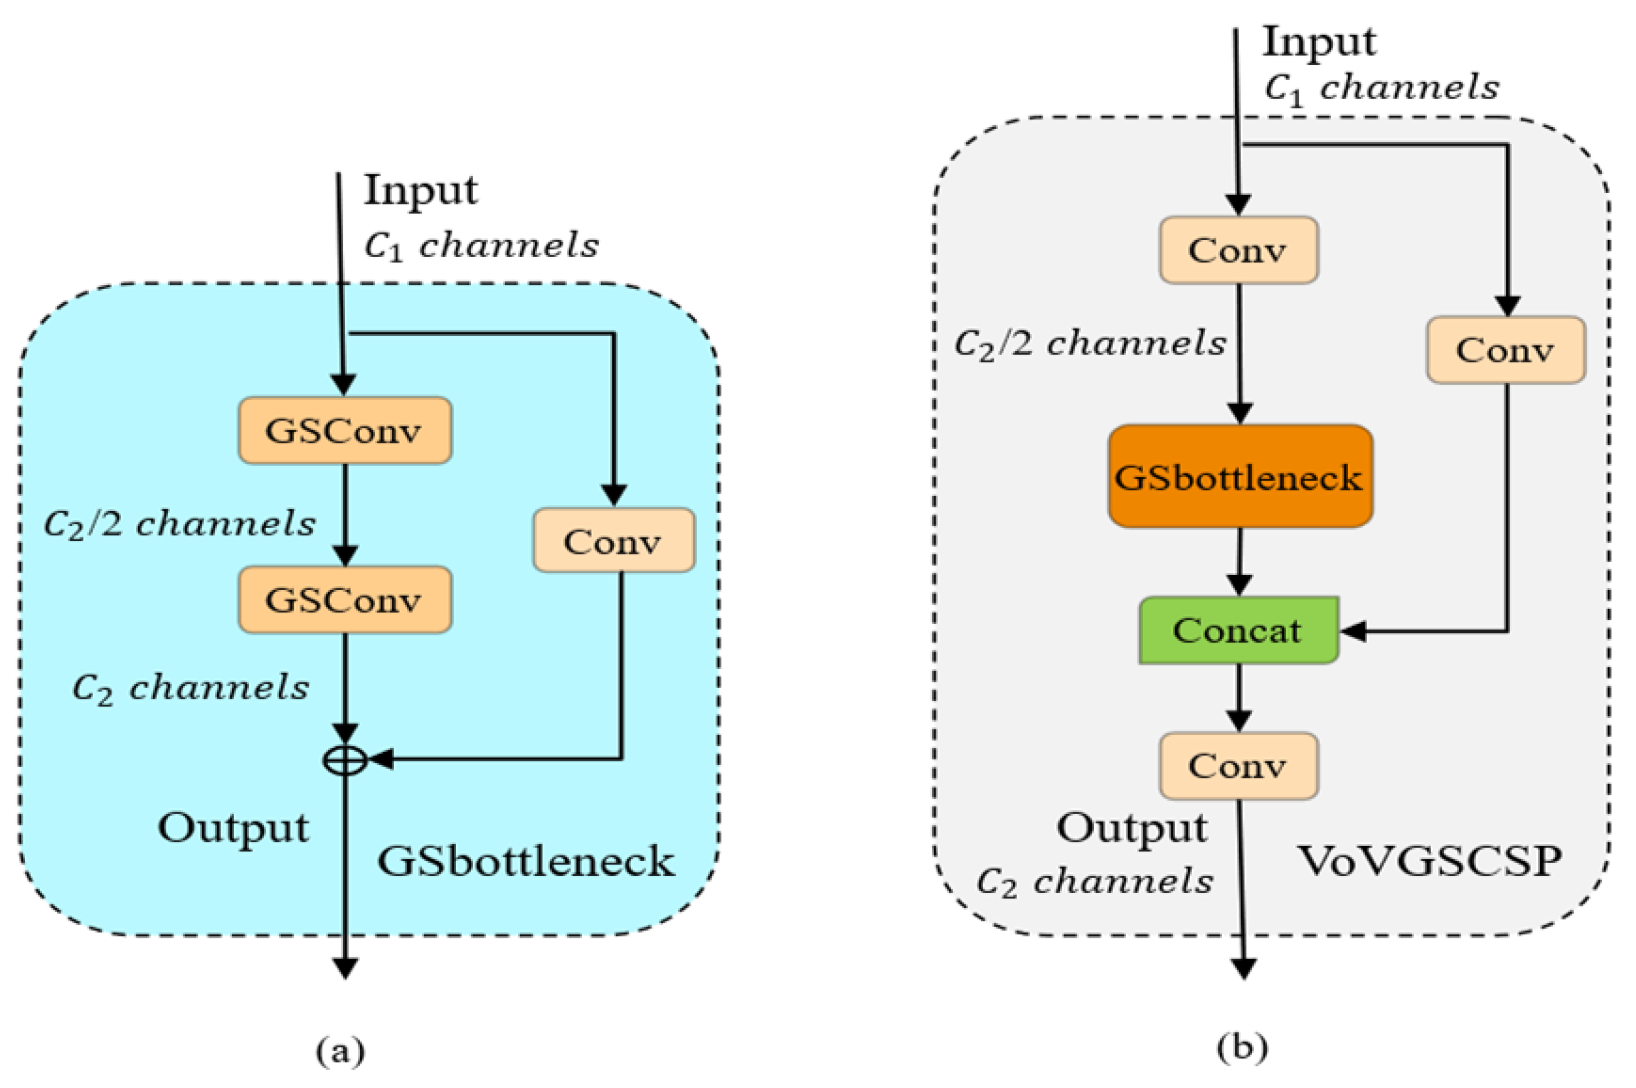
Along the fusion path, Slim Neck uses GSConv in lateral connections to merge upsampled semantic features with higher resolution texture details. The fused features are then processed by VoVGSCSP [
20] to strengthen feature interaction with limited overhead. VoVGSCSP follows the cross-stage partial principle [
34] and the one-shot aggregation design of VoVNet [
35], which helps maintain gradient flow while keeping the fusion stage lightweight. Overall, this redesign replaces the more expensive fusion unit with a streamlined alternative that better fits the real-time and energy constraints of intrinsically safe monitoring equipment in mines.
To quantify the efficiency gain, this study compares GSConv with standard convolution. Let
and H be the spatial size,
be the kernel size, and
and
be the input and output channels. As shown in Equation (4), the computational cost ratio between GSConv and standard convolution is approximately the following:
This indicates that GSConv can reduce the convolution cost by about half under the same spatial and channel settings, while retaining the discriminative capacity needed for hazard identification. Part of this benefit comes from channel shuffle, which improves information exchange across channel groups and supports effective feature mixing at low cost.
As illustrated in
Figure 8, VoVGSCSP follows a split–transform–merge structure. The input is separated into two paths to reduce redundant computation and to support stable gradient propagation during training. In the main transform path, this study uses GSConv rather than standard convolution to keep the module efficient for edge deployment. Multiple GSConv layers form a deeper extraction path, denoted as GSbottleneck, which helps the network model richer anomaly patterns while keeping inference latency within the limits of real-time monitoring.
3.4. Dynamic Sensitivity Calibration via EMASVFL Loss
In conveyor belt monitoring, a key difficulty is extreme class imbalance. Most pixels belong to normal belt surfaces or ore, while hazardous foreign objects are rare. RT-DETR uses Focal Loss to reduce the influence of easy negatives, but its weighting is driven only by the current prediction. As training progresses, the difficulty of ambiguous cases can change, for example partially occluded anchor rods, and a purely instantaneous weight may not track this shift. To improve robustness under noise-dominant conditions, this study introduces EMASVFL, a dynamic objective that adjusts emphasis using a smoothed history of training quality.
Focal Loss applies a modulating factor
to focus optimization on hard samples, as defined in Equation (5):
where
is the predicted probability. This strategy is effective in general detection, but it can be less suitable for measurement settings where ambiguity changes across training stages. For example, separating a black rubber strip from a black rubber belt may require gradually tightening decision boundaries as feature representations improve.
EMASVFL uses the batch Intersection-over-Union (IoU) mean as a proxy for detection quality [
22] and maintains an EMA-based global indicator of training difficulty, denoted as
. This smoothed signal reduces sensitivity to transient noise and supports stable convergence. The global IoU mean is updated after each batch according to Equation (6):
Here, the attenuation factor
adjusts the balance between past and recent states. Based on
, this study defines a sliding modulation weight
that separates confident detections from ambiguous ones. Using thresholds relative to the global mean,
=
0.1,
=
, the loss assigns larger gradients to samples that remain difficult but informative, as shown in Equation (7):
With this weighting, the EMASVFL loss is defined as Equation (8):
Among these, the
is calculated using the Varifocal Loss formula, as shown in Equation (9):
Here, denotes the target value. If is a positive sample, then = IoU ∈ (0, 1]; if is a negative sample, then = 0.
By multiplying Varifocal Loss with the EMA-based weight , EMASVFL behaves like a dynamic gain control mechanism. In mining scenarios, this allows training to emphasize different cases over time. Early in training, the model can learn easier cues, and later it can place more weight on hard anomalies such as occluded anchor bolts after global performance becomes more stable. This improves the signal-to-noise ratio of anomaly responses and increases robustness to environmental interference.
3.5. Low-Light Image Enhancement Method
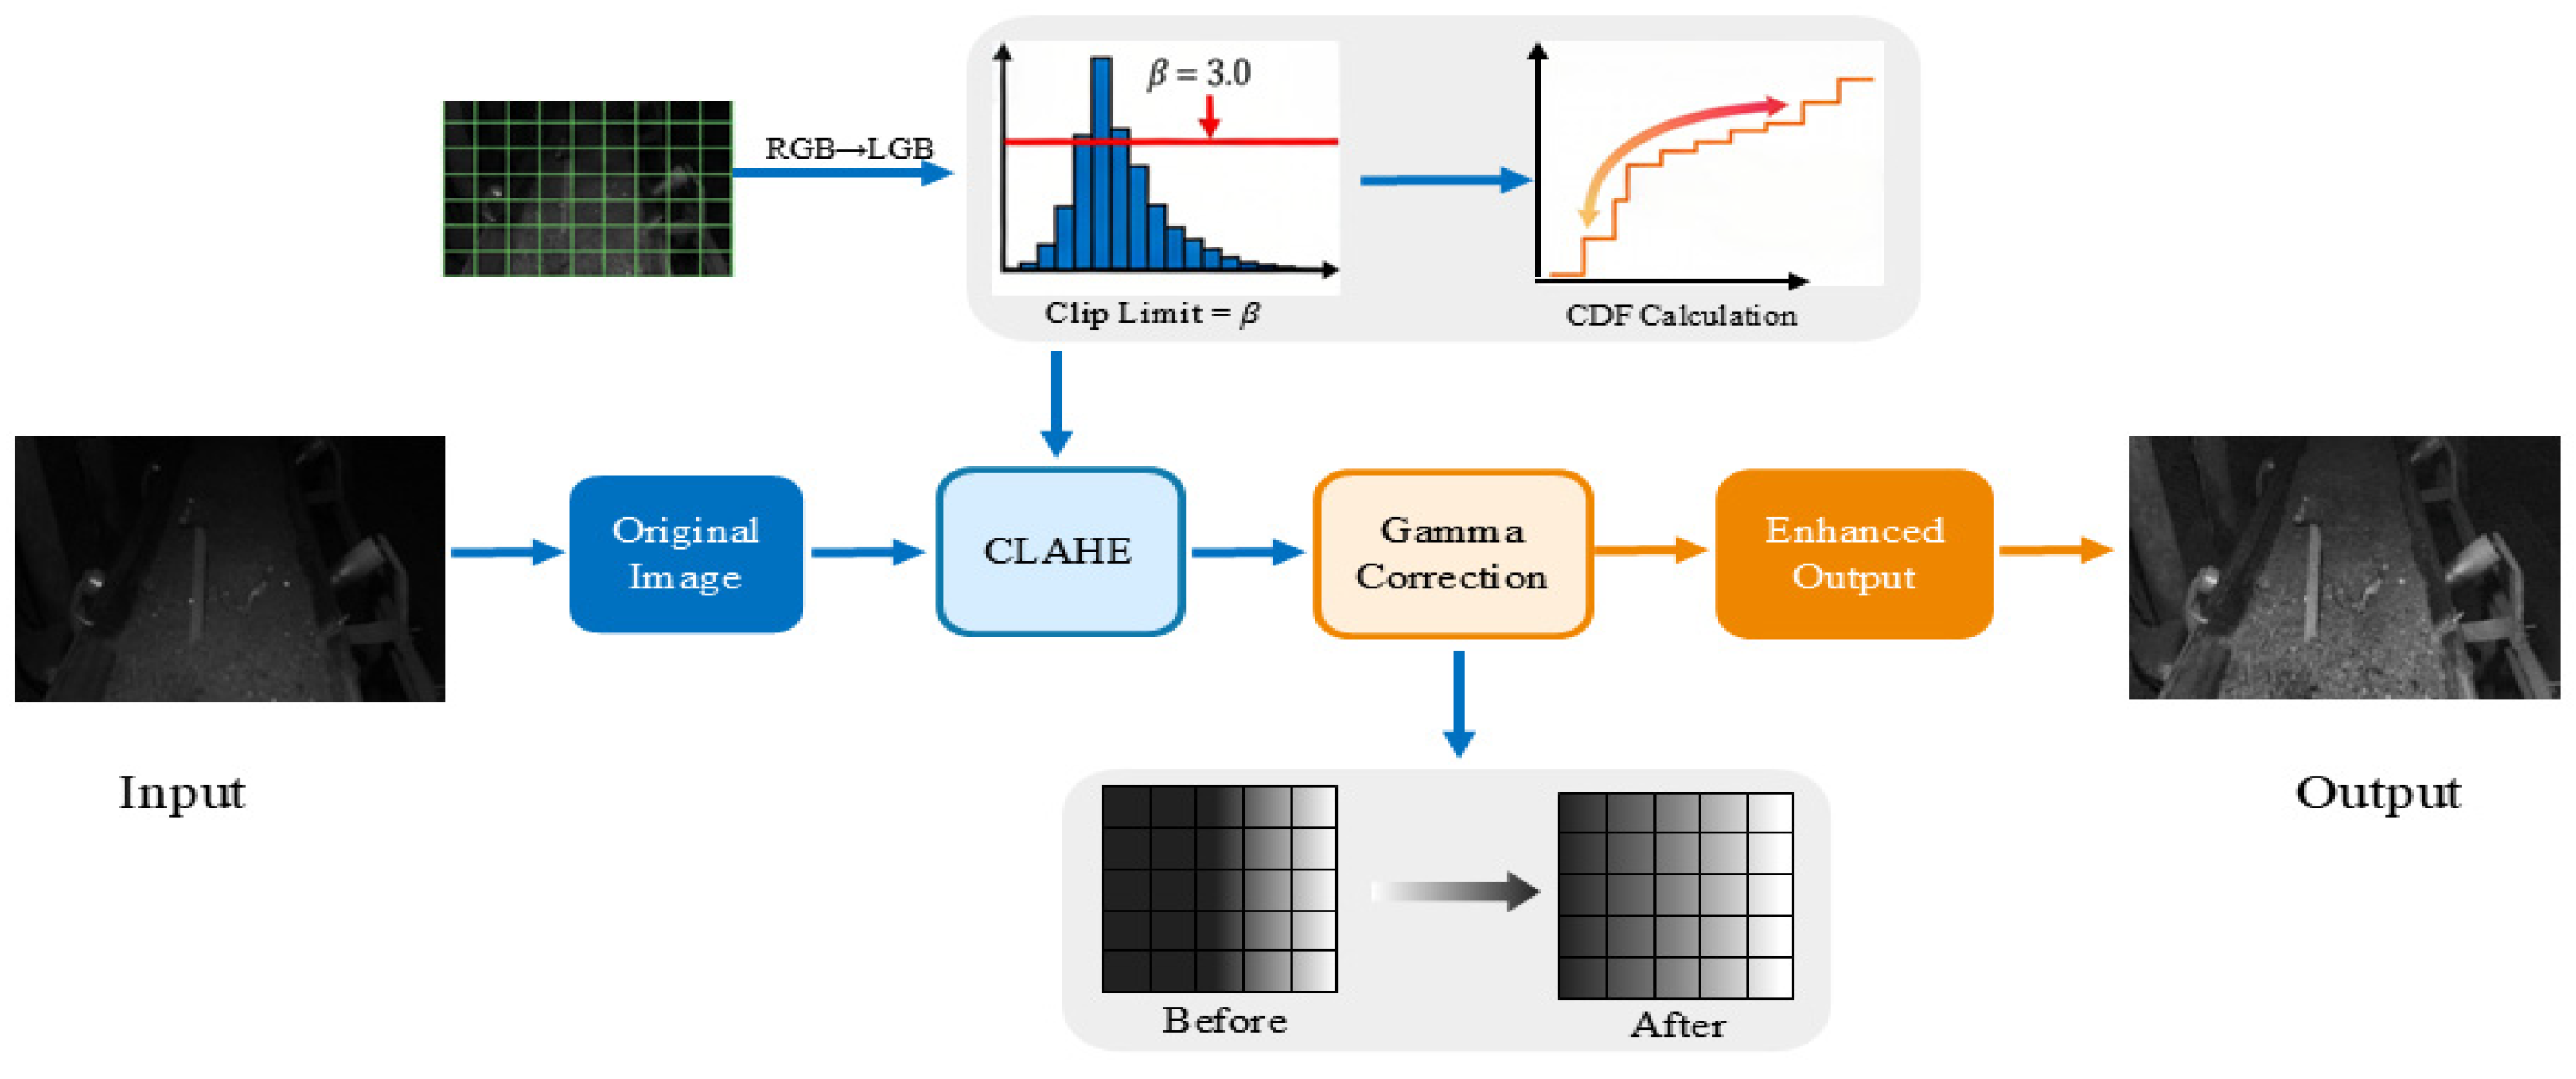
Underground mining scenes are often captured under very low illumination, which leads to low contrast, blurred anomaly details, and spatially uneven lighting. To improve the visibility of hazardous objects, this study uses an image enhancement pipeline that applies Contrast-Limited Adaptive Histogram Equalization (CLAHE) followed by Gamma correction. As shown in
Figure 9, this pipeline increases local contrast and expands the useful intensity range while controlling noise amplification, which improves anomaly visibility in shadowed regions.
It is worth noting that underground mining environments also suffer from camera lens contamination caused by dust, mud, or water droplets. Such contamination can further degrade image quality and affect detection accuracy. Our current enhancement pipeline does not explicitly simulate or correct for lens dirt patterns. Addressing this practical issue will be part of our future work, for instance by incorporating lens-degradation augmentations into the training process to improve real-world robustness.
3.5.1. Localized Contrast Enhancement via CLAHE
Standard histogram equalization can over-amplify background noise, which may introduce artifacts that resemble anomalies. To reduce this risk, this study applies CLAHE to enhance contrast locally on the luminance channel. The input RGB image is converted to the LAB color space so that the luminance component
can be processed without altering chromatic information. CLAHE divides the image into
non-overlapping tiles and computes a histogram for each tile independently. To limit noise spikes in homogeneous regions such as smooth belt surfaces, a clip limit
is applied. The clipping operation for each tile histogram
is defined in Equation (10):
The clipped counts are then redistributed uniformly to obtain the modified histogram
. Next, the cumulative distribution function
and the gray-level mapping
are computed to remap pixel intensities, as shown in Equation (11) and Equation (12):
Finally, bilinear interpolation is used to reconstruct the enhanced luminance component . In our implementation, the tile size is set to 8 × 8, and the clip limit is set to . These settings enhance fine structures such as anchor rods and nets while keeping the overall scene appearance natural.
3.5.2. Global Dynamic Range Expansion via Gamma
CLAHE enhances local texture, but pixels in extremely dark regions can still remain too weak for reliable detection. To compensate, this study applies nonlinear Gamma correction as a global brightness adjustment. This step expands the dynamic range of low-intensity pixels through a power-law transform, defined in Equation (13):
With , the curve is convex and increases the spread of gray levels in dark areas. This improves the visibility of hazards in shadowed regions while avoiding over-brightening, and it provides a better-conditioned input for the downstream detection network.
3.5.3. Evaluation and Analysis of Data Augmentation Effects
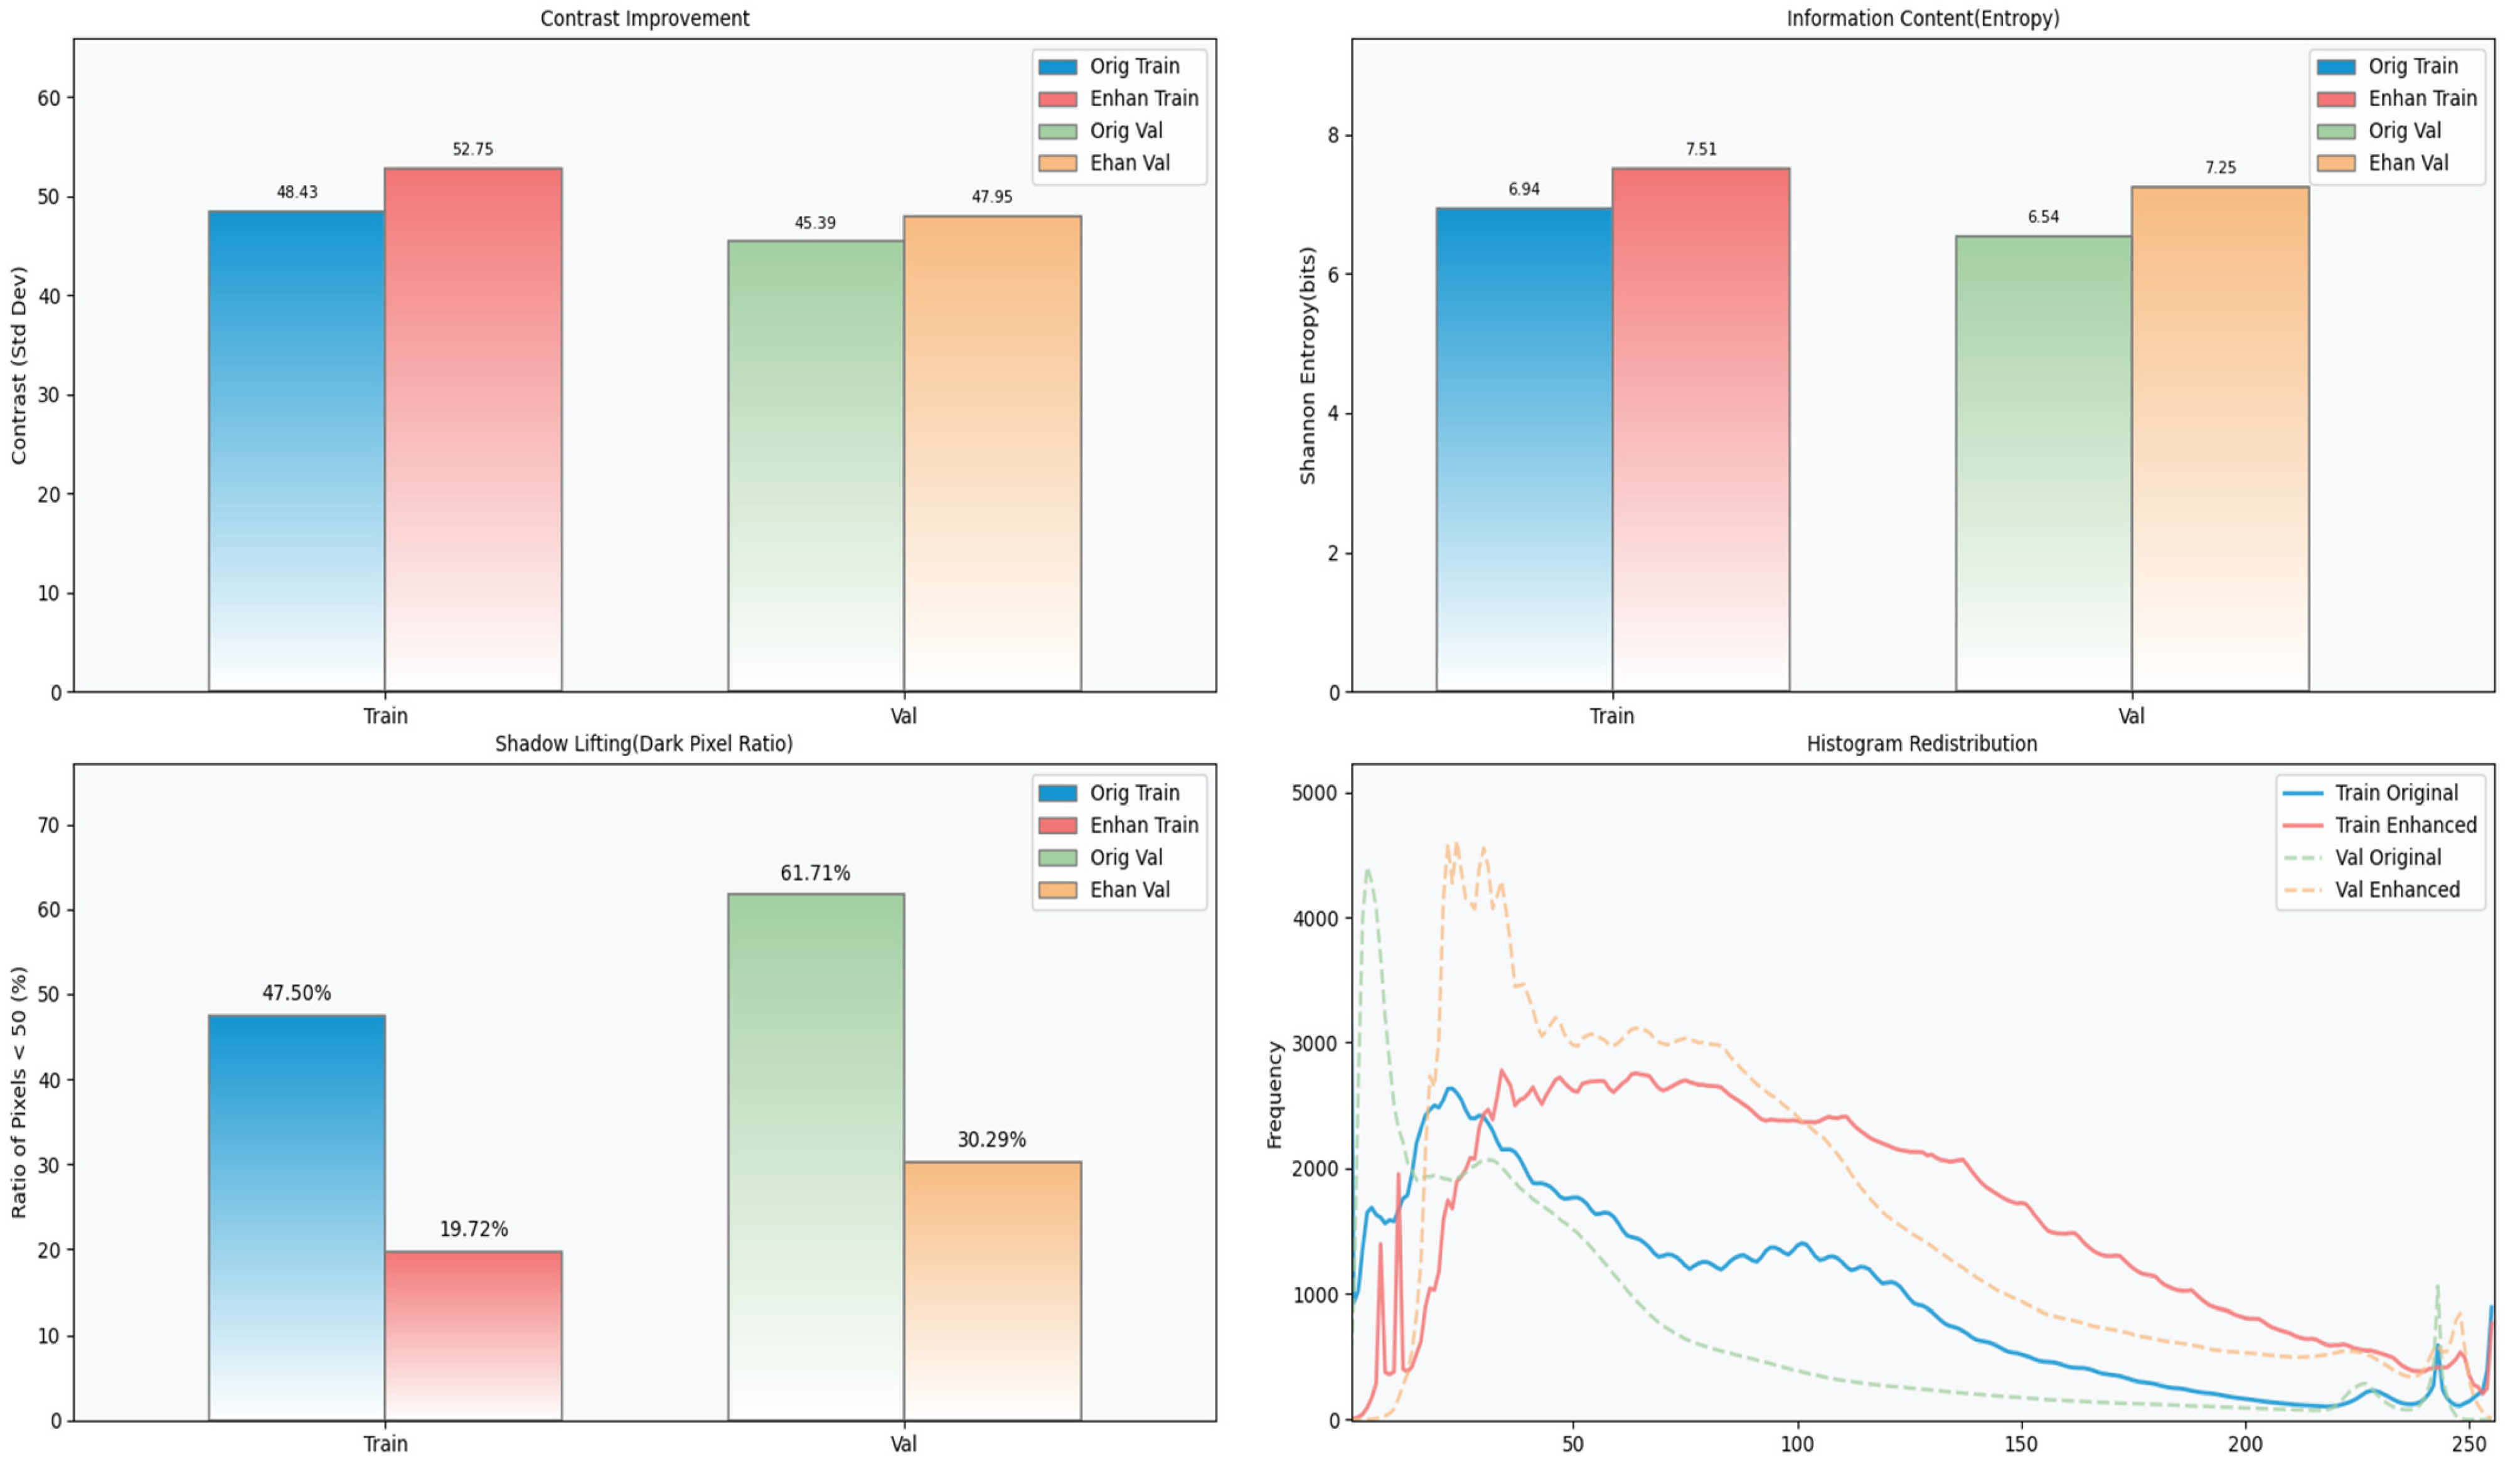
To assess the effect of the enhancement pipeline, this study reports quantitative results on the dataset using metrics related to signal quality and feature separability. As shown in
Figure 10, the enhanced images exhibit improved visibility and stronger cues for automated evaluation.
The results indicate clear recovery of details in low-light regions. Under the shadow-lifting metric, the fraction of underexposed pixels with intensity below 50 decreases substantially in both the training and validation sets, including an approximately 50% reduction in the validation set. This suggests that the enhancement pipeline brings previously obscured regions into a usable intensity range. At the same time, the information content of the image increases. Information entropy rises by about 0.6 to 0.7 bits on average, which indicates a broader distribution of texture details and helps separate subtle anomaly shapes from background patterns. Contrast improvement shows a consistent increase in the gray-level standard deviation by about 5 to 9%, which strengthens grayscale separation between foreign objects and the ore-dust background. The histogram redistribution curves provide a complementary view of this change. The intensity distribution shifts from a narrow, dark-skewed peak to a wider and more even spread. This expansion of the effective dynamic range makes better use of the imaging bit depth and provides a stronger data basis for high-precision foreign-object characterization.
Overall, the joint enhancement strategy improves both signal strength and structural clarity, which supports more reliable FDSE-DETR detection in complex mining environments.
4. Experimental Results and Discussion
4.1. Dataset Construction and Partitioning
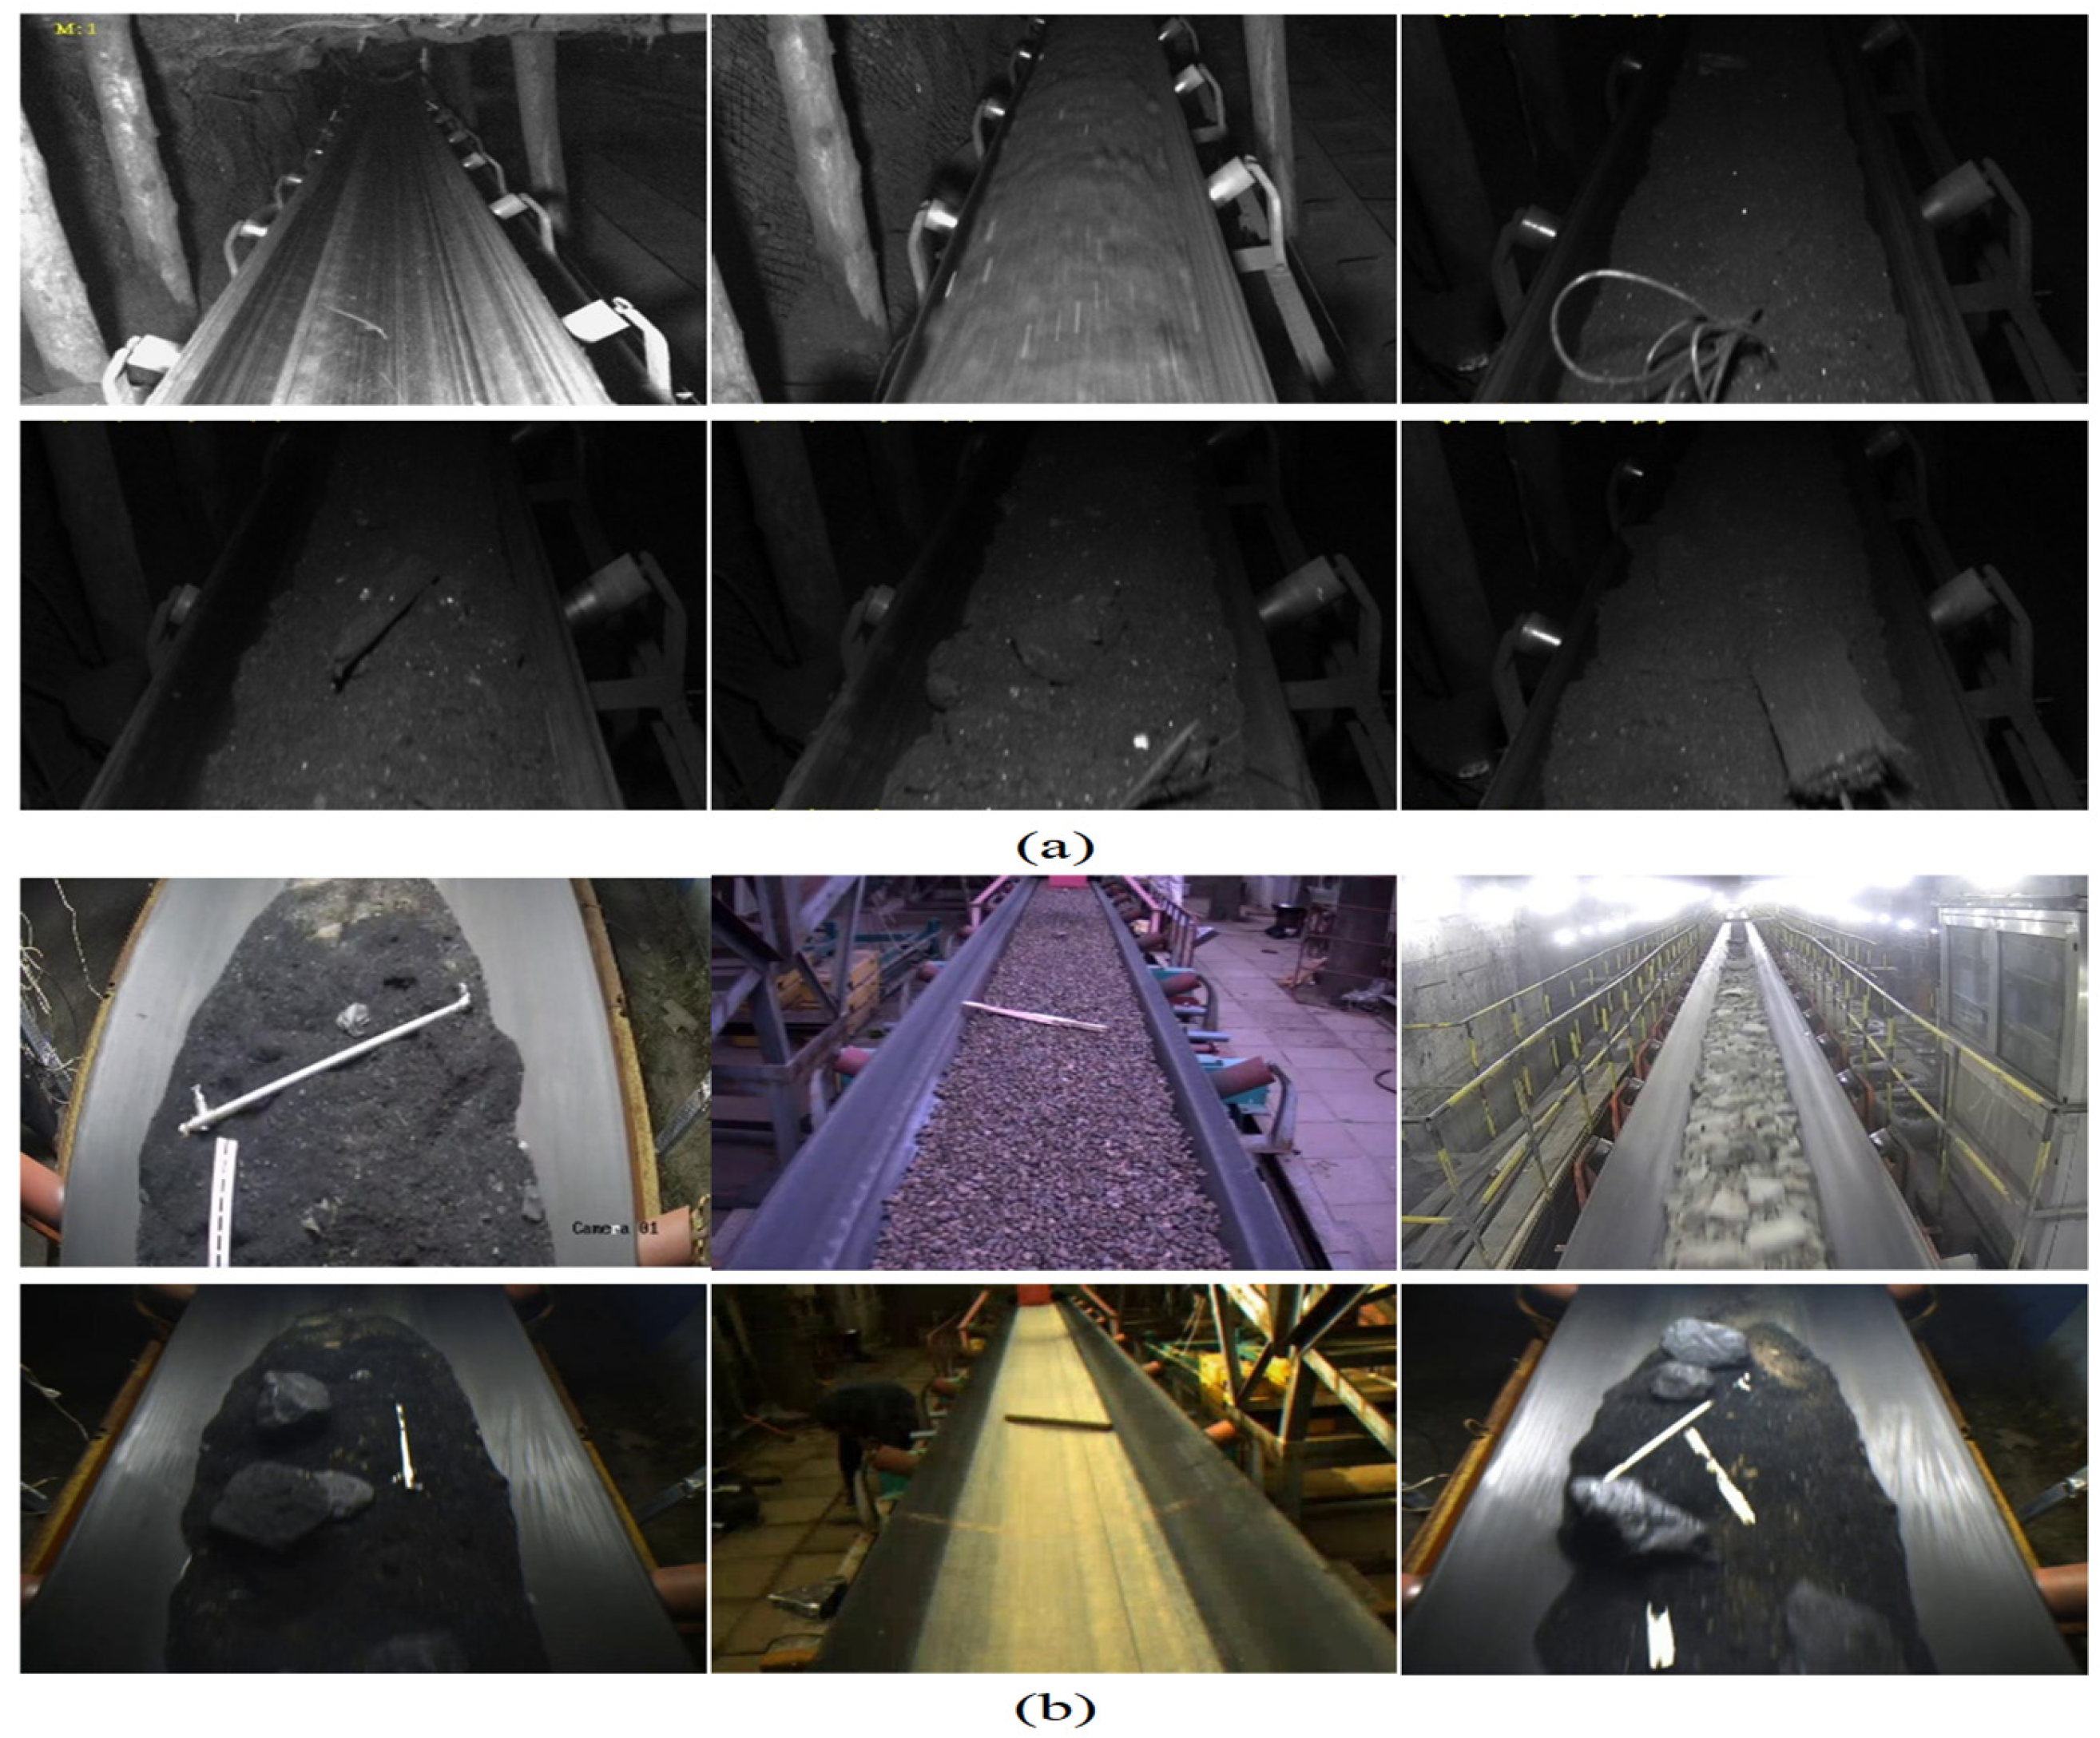
As shown in
Figure 11, the experimental data were built from a combined dataset designed to reflect conveyor belt operating conditions in metal mines.
Figure 11a presents the CUMT-BelT dataset, which serves as the main body of our dataset. Through screening, this study removed irrelevant images such as gangue and coal so that the remaining samples matched the target scenario.
Figure 11b shows additional images collected under metal mine conveyor belt conditions, including simulated foreign objects specific to metal mines. The final dataset was annotated with LabelImg using bounding boxes, with particular attention to safety-critical categories in metal mines, including maogan (anchor rods and nets) with 1363 instances and bang (rod-like foreign objects) with 483 instances, resulting in an approximate class ratio of 2.8:1. The dataset was split into training (3036 images), validation (416 images), and testing (445 images) sets with an 8:1:1 ratio. All images were resized to 640 × 640 pixels. Although the data cover a range of typical operating conditions, they are still limited in terms of scene diversity, such as different mine sites, conveyor configurations, lighting levels, camera viewpoints, and dust or moisture conditions. Therefore, the reported performance may not fully generalize to all real-world mining environments. Future work will involve collecting more diverse data from multiple mines and applying domain adaptation or data augmentation techniques to further enhance cross-site robustness.
4.2. Experimental Platform and Parameter Configuration
All experiments in this study were conducted under a unified hardware and software environment to ensure the fairness and reproducibility of the results. The hardware platform configurations used in the experiments are presented in
Table 1.
During the model training phase, this study sets a series of hyperparameters as shown in
Table 2.
4.3. Evaluation Metrics
To assess whether the proposed framework is suitable for real-time mine safety monitoring, this study uses an evaluation protocol that covers detection reliability, runtime efficiency, and feasibility on embedded instruments.
For reliability, this study reports precision (P), recall (R), and mean average precision (mAP). In conveyor belt safety monitoring, recall is especially important because it is closely related to the probability of detecting hazards. Higher recall means the system is more likely to find true hazardous objects such as partially occluded bolts or rods, which helps reduce missed detections (false negatives) that can lead to belt damage and safety incidents. Precision reflects the false alarm tendency. Low precision means normal ore or belt textures are incorrectly flagged as foreign objects (false positives), which can trigger unnecessary shutdowns and reduce operational efficiency. mAP summarizes detection accuracy across different IoU thresholds.
To evaluate runtime efficiency, the inference speed of each model is measured in frames per second (FPS). All FPS measurements are performed on the same hardware platform (NVIDIA RTX 2060 SUPER) using native PyTorch (1.13) inference with FP16 precision and a batch size of four. The reported FPS values reflect only the model inference time; preprocessing time for CLAHE and Gamma correction is excluded, as these steps are applied offline before feeding images into the network.
To evaluate embedded deployment feasibility, this study reports floating point operations (FLOPs) and parameter count (Params). These two metrics are the direct indicators of a lightweight model. FLOPs describe the computation required per inference and therefore constrain the achievable frame rate on resource-constrained edge nodes. Params reflect the memory footprint and indicate whether the model can fit within the storage limits of industrial smart cameras.
During evaluation, true positives (TPs) are foreign objects that are correctly detected. False positives (FPs) are normal materials incorrectly labeled as anomalies, which reduces the effective signal-to-noise ratio of the alarm output. False negatives (FNs) are hazardous objects that are missed and represent the most critical failure mode. The metrics are defined as follows:
4.4. Neck Network Comparative Experiments
To examine the capacity of the RT-DETR neck and improve feature fusion efficiency, this study performed controlled comparisons of several neck designs. This study used the same baseline setting and kept the backbone and detection head unchanged and then evaluated the following neck variants under identical training and inference conditions: AIFI-MSMHSA, DBBC3, gConvC3, PSConv, MaNet, and Slim Neck.
To make the comparison informative for mining conveyor scenes, this study selects neck variants that reflect different design philosophies for efficient multi-scale fusion. The key question is which mechanism converts computation into more useful anomaly cues under the same backbone and detection head. This study therefore compares several design choices: attention-centered fusion for multi-scale contexts; branch-based aggregation that strengthens representation during training while remaining lightweight at inference; gated separable convolution for efficient selectivity; padding-based operators that bias features toward small objects; and self-attention-based coordination of local and global information. Concretely, the evaluated variants include M2SA with MSMHSA [
36], DBBC3 with Diverse Branch Blocks [
37], gConvC3 [
38], PSConv [
39], and MaNet [
40].
Table 3 reports the quantitative results.
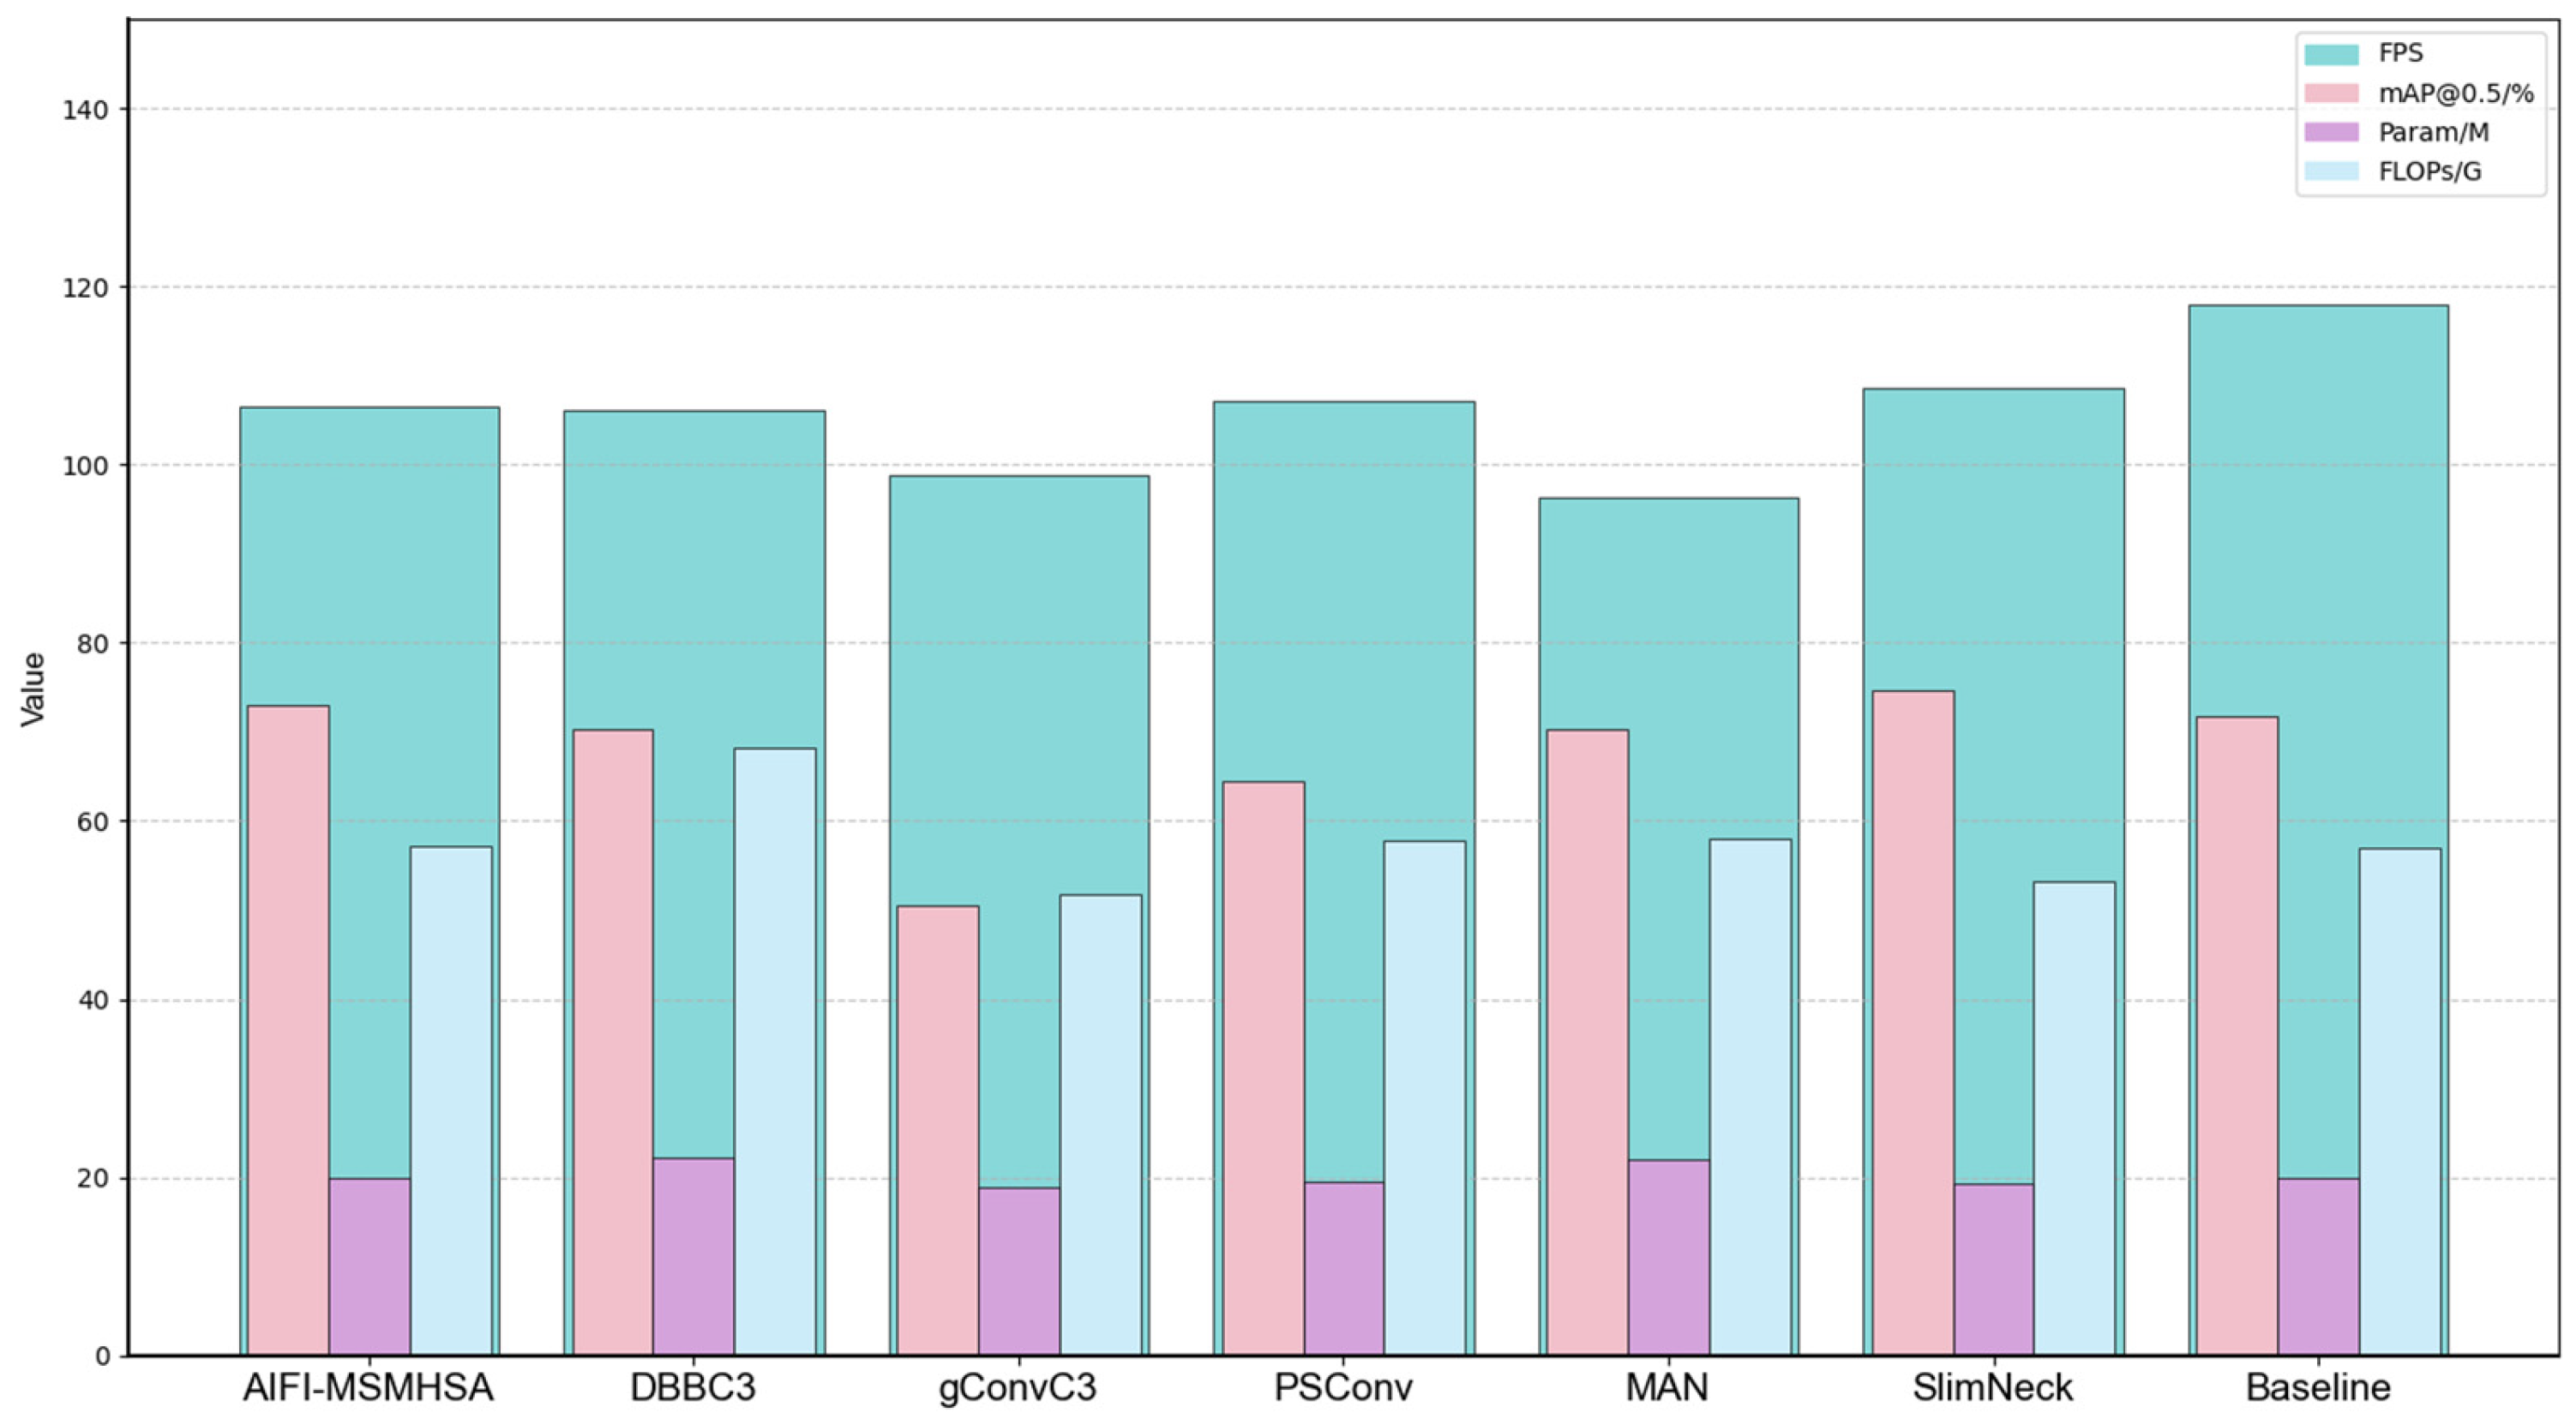
Figure 12 shows that designs dominated by heavier attention style components, including MSMHSA, DBBC3, and MaNet, increase computational overhead but do not deliver proportional improvements in anomaly detection. This indicates that the additional capacity is not efficiently converted into more discriminative features for mining conveyor scenes. At the other end of the spectrum, gConvC3 has the lowest theoretical computational load, but its detection reliability drops sharply. The mAP decreases to 50.6%, and the frame rate decreases to 98.8 FPS. This behavior suggests that aggressive compression weakens feature expressiveness, and critical anomaly cues are lost before decoding.
Across
Figure 12 and
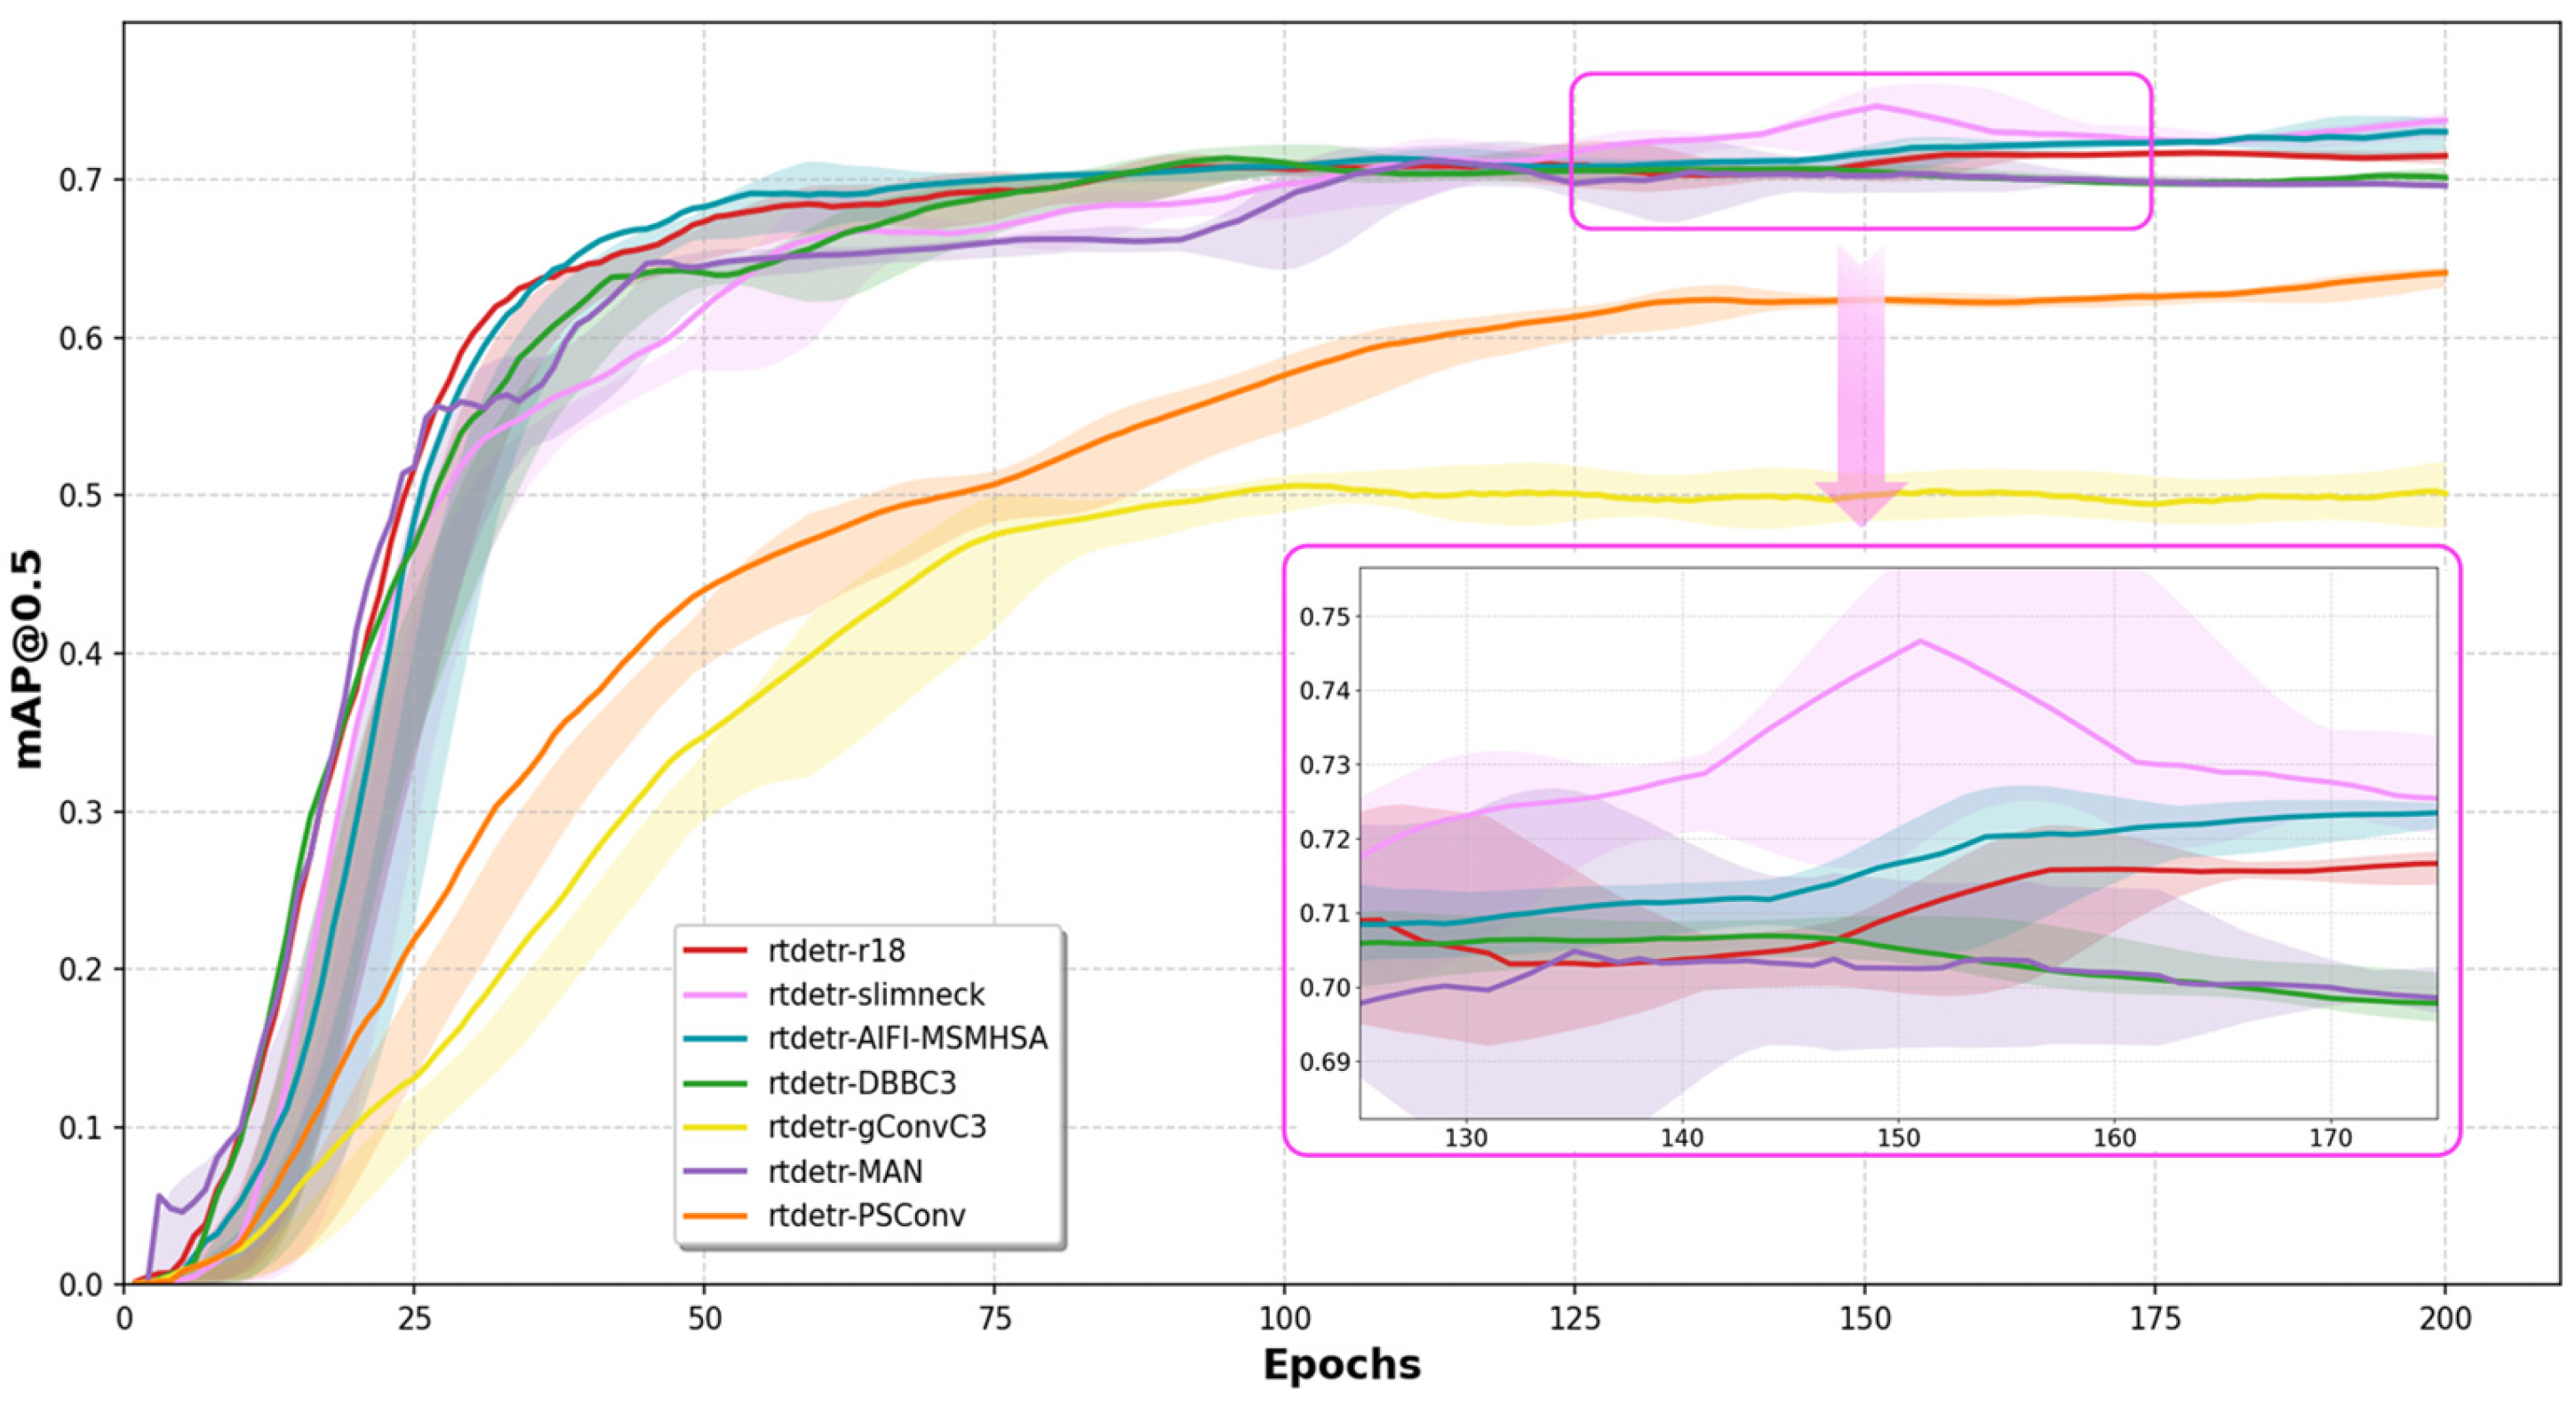
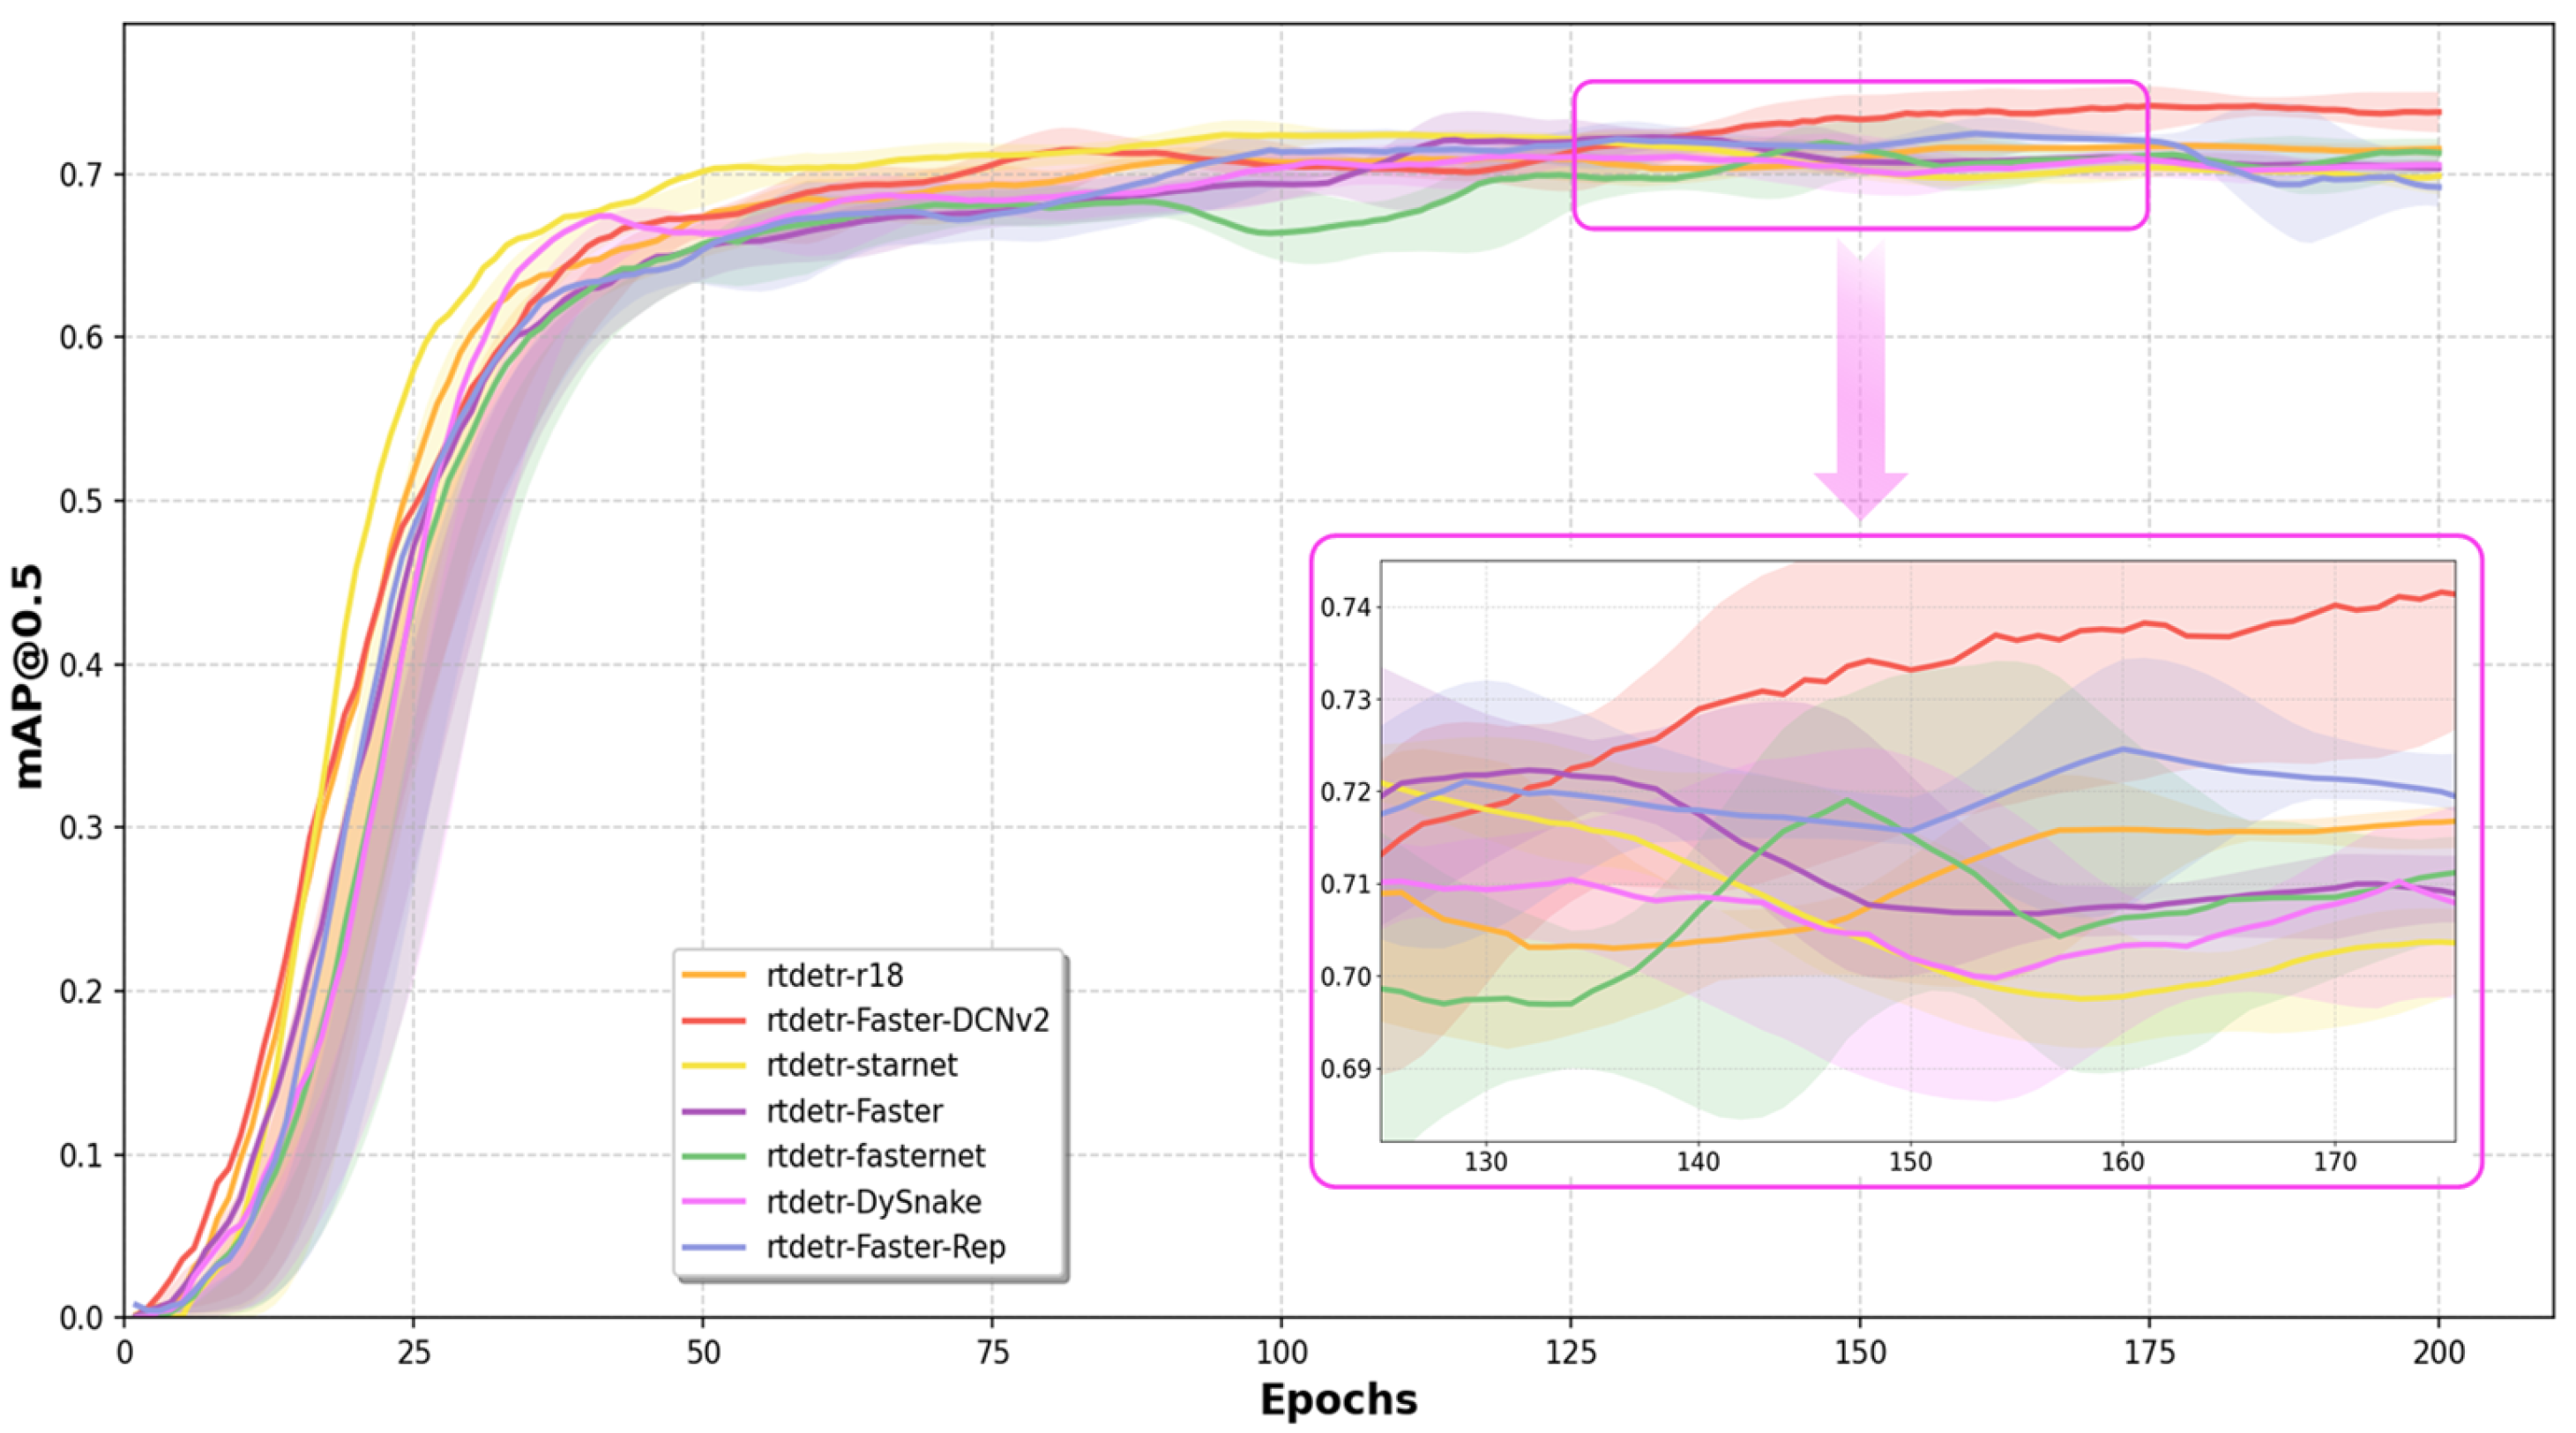
Figure 13, a Slim Neck provides the best overall balance for real-time condition monitoring. It improves mAP to 74.3% compared with 70.8% for the baseline, while also reducing computational cost by 6.5% and parameters by 2.5%. Although its inference speed is slightly lower than the unoptimized baseline, the accuracy gains and the reductions in computation and memory footprint make a Slim Neck a practical choice for continuous safety monitoring on resource-constrained nodes.
4.5. Backbone Network Comparative Experiments
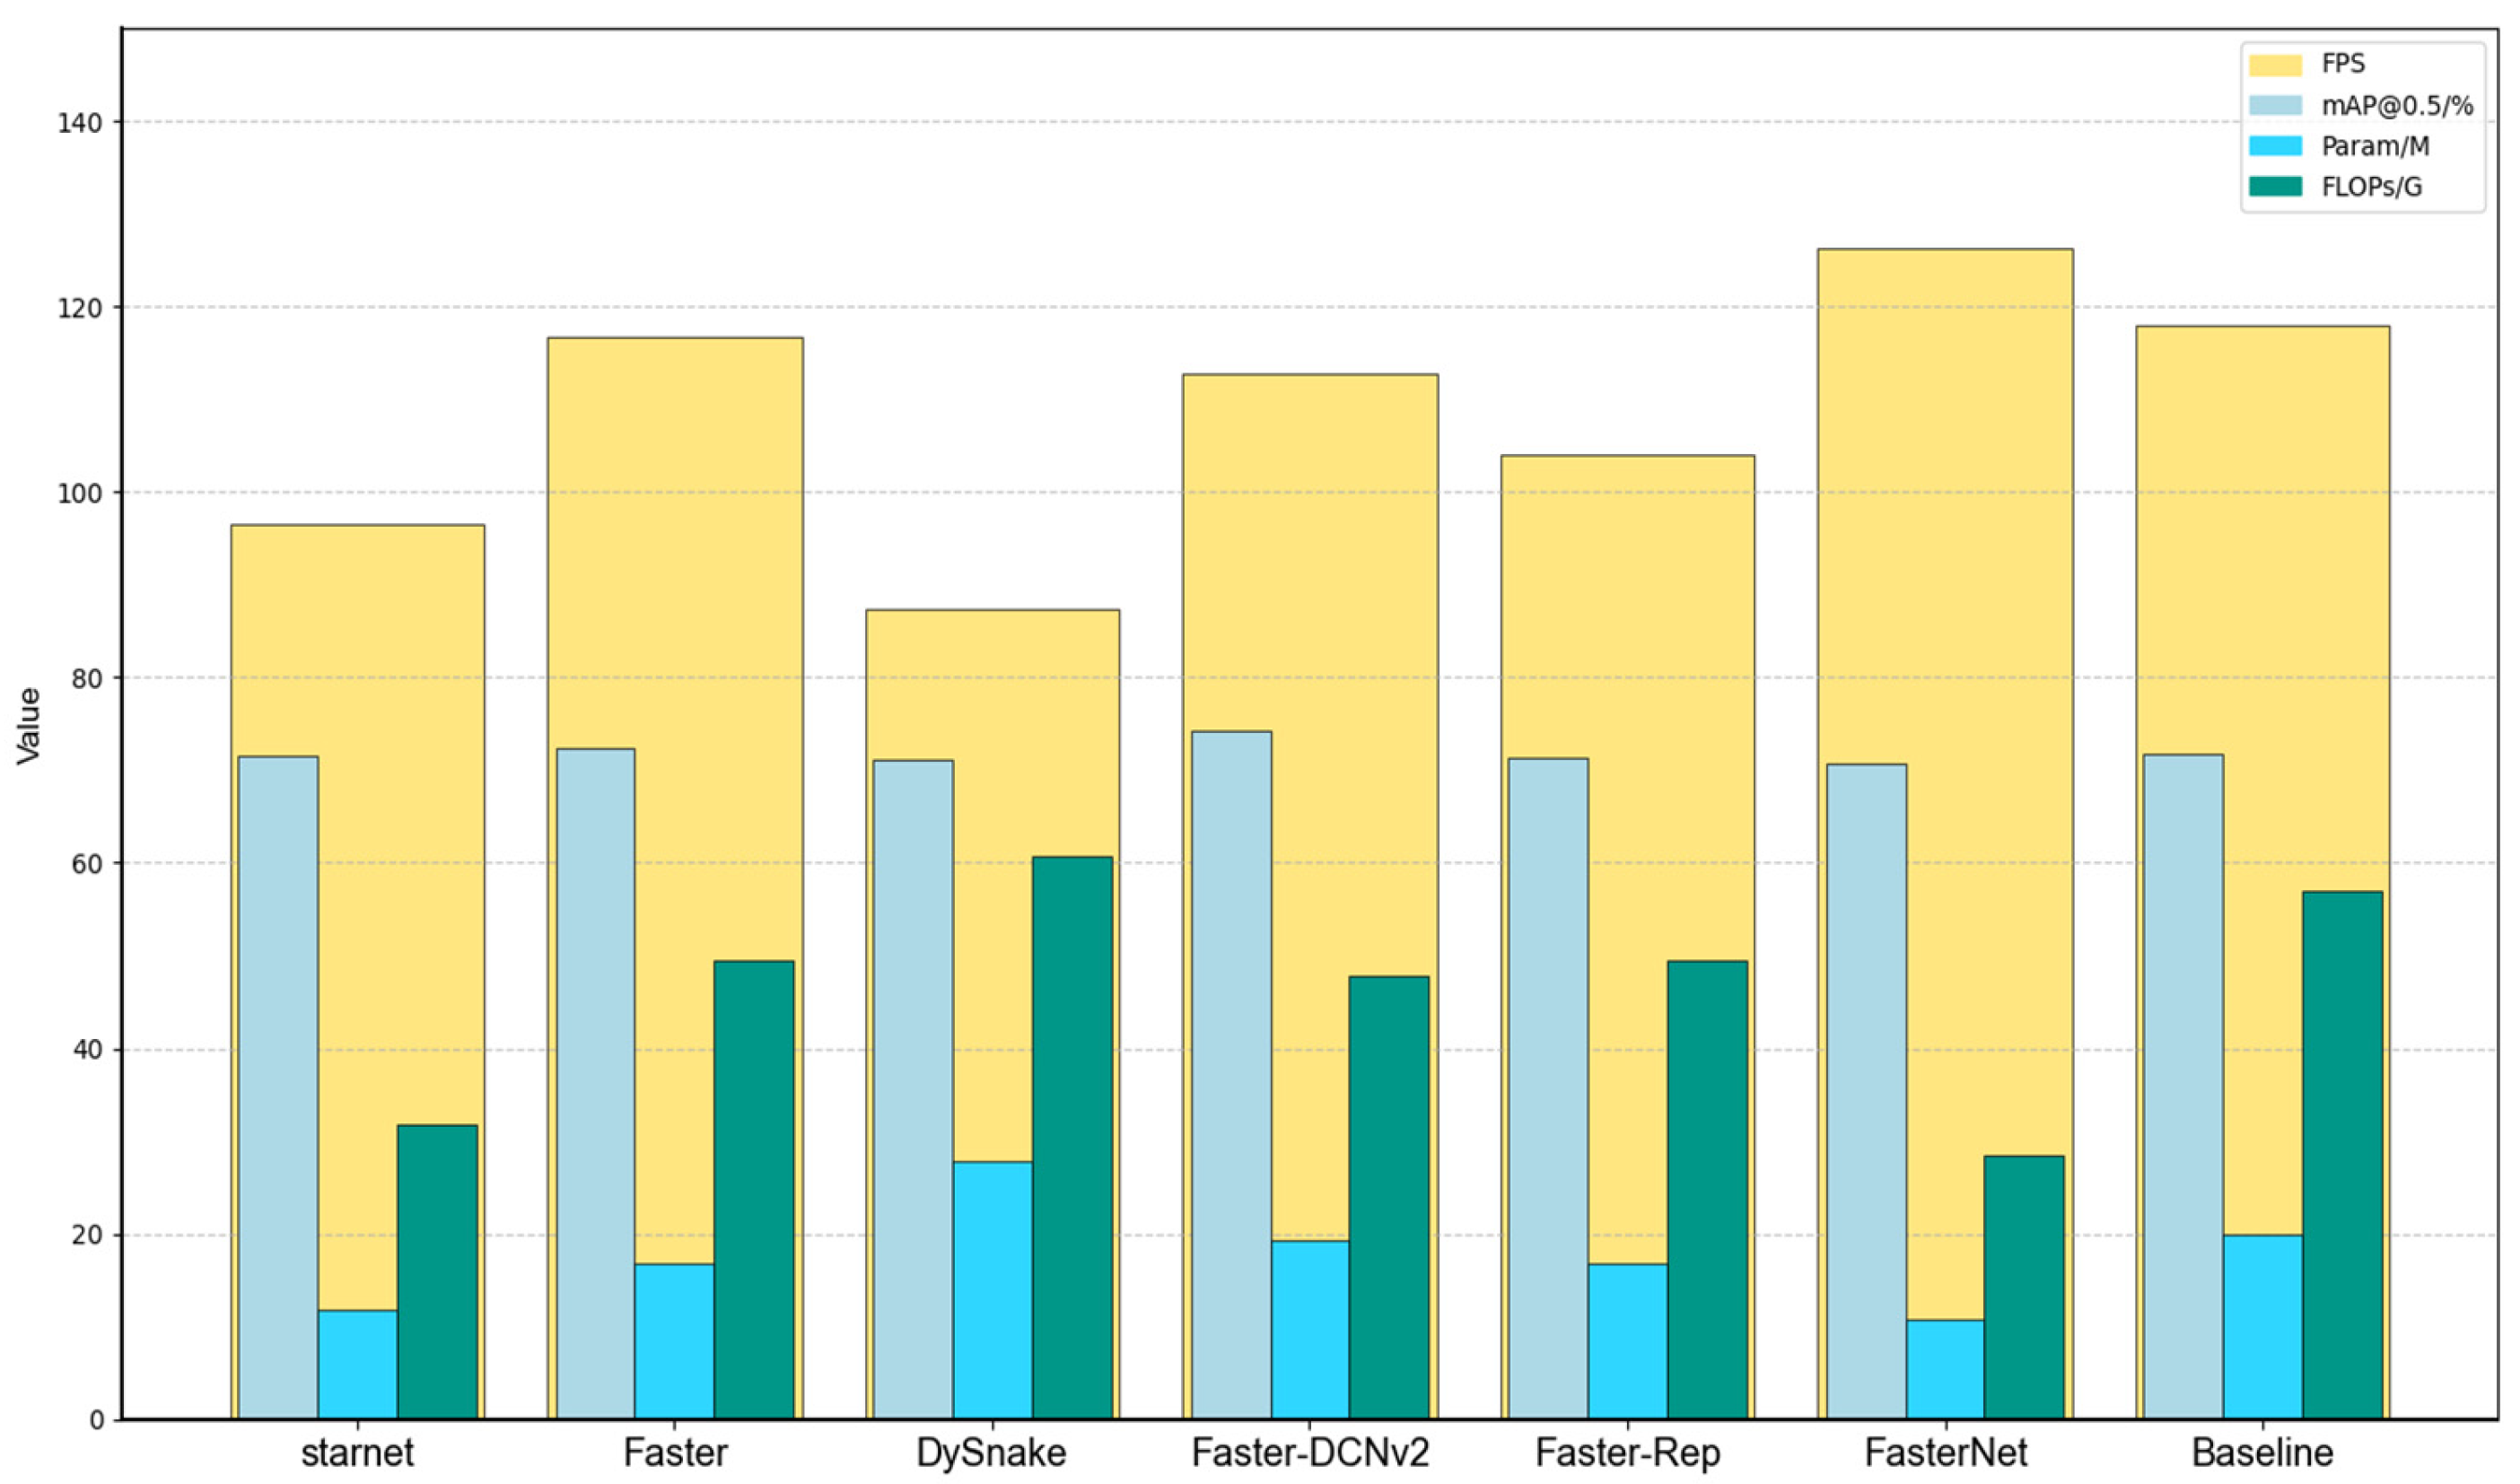
To evaluate the feature extraction capability of different backbones, this study conducts comparative experiments under a controlled setting. The neck and detection head are kept unchanged, and only the backbone is varied. This study compares Faster, StarNet, FasterNet, DySnake, Faster-DCNv2, and Faster-Rep to study the trade-off between inference speed and detection accuracy. The results are summarized in
Table 4.
For the backbone study in mining conveyor scenes, this study aims to cover a broad set of efficiency strategies rather than a single architectural style. The comparison asks how different backbone level mechanisms use a fixed computing budget to preserve the cues that matter for irregular foreign objects, with the neck and detection head held constant. The evaluated strategies span lightweight backbone construction, selective spatial processing to avoid redundant work, high-throughput scaling choices, deformation sensitive convolution for elongated or curved structures, and reparameterization techniques that shift complexity to training while keeping inference efficient. Accordingly, this study tests StarNet [
41], FasterNet-derived Faster Block variants and FasterNet_t0 [
18], a DySnakeConv-based variant [
42], and a Faster-Rep configuration.
As shown in
Figure 14, very lightweight backbones such as StarNet and FasterNet reduce computational complexity, but their mAP values drop below the baseline. This indicates that their capacity is not sufficient to capture subtle texture variations that are important for high-precision anomaly identification. Although such backbones may fit low power sensors, the associated loss in accuracy increases the risk of missed detections in safety critical monitoring. Faster-Rep and Faster improve processing speed, but they do not improve discrimination accuracy relative to the baseline. The DySnake configuration reaches a mAP of 71.2%, but its efficiency is limited to 87.3 FPS, which does not match high-speed conveyor scenarios that require fast response.
Figure 15 shows that Faster-DCNv2 provides the most favorable balance for measurement instrumentation in our comparisons. It achieves a detection accuracy of 74.3%, which is a 3.5% improvement in reliability over the baseline. This gain is consistent with the ability of DCNv2 to adapt the receptive field to non-rigid geometric deformation in irregular foreign objects, such as bent rods, which supports more informative feature sampling for structurally complex hazards. At the same time, the computation cost decreases to 47.8G FLOPs, which corresponds to a 16% reduction, and the parameter count is also lower. With a processing speed of 112.7 FPS, the Faster-DCNv2 backbone supports real-time deployment while maintaining the requirements of industrial safety monitoring.
4.6. Ablation Experiment of the FDSE-DETR
To assess the contribution of each design choice, this study conducts ablation experiments. Reliable foreign-object monitoring in mining scenes depends on retaining fine texture cues under a tight computing budget, maintaining geometric sensitivity for irregular hazards, and keeping multi-scale fusion and supervision stable under clutter.
Table 5 summarizes the settings, where “√” indicates that a component is enabled, and “×” indicates that it is removed. It should be noted that CLAHE and Gamma preprocessing were applied uniformly to all configurations in this ablation study; therefore, its individual contribution was not quantified separately.
The results highlight four consistent patterns. (1) When enabling A, the backbone becomes more efficient, yet mAP@0.5 increases to 72.2%. This indicates that PConv allocates spatial computation to informative channels and preserves high-frequency anomaly textures while reducing redundant processing on repetitive background regions. The recall reaches 74.6%, and mAP@0.5:0.95 reaches 38.4%, showing that lightweight feature extraction does not compromise detection sensitivity. The improved recall directly reduces the probability of missed hazards, which is critical for preventing belt damage and safety incidents. (2) Enabling B in deeper stages further increases mAP@0.5 to 73.4%, which supports the role of adaptive sampling in describing irregular geometry such as twisted anchor rods, and the accuracy gain outweighs the modest parameter increase. Recall improves to 75.3% and mAP@0.5:0.95 to 38.5%, confirming that deformable sampling benefits both localization and recall of irregular hazards. The higher recall for irregular objects means that fewer bent anchor rods or tangled nets escape detection, directly enhancing operational safety. (3) Enabling C reduces computation by 6.5% while improving mAP@0.5 to 74.4%, suggesting that the original CCFM fusion stage includes redundant operations and that a more direct multi-scale fusion path can retain fine target cues at lower cost. Correspondingly, recall reaches 75.0%, and mAP@0.5:0.95 is 38.3%, indicating stable multi-scale fusion without sacrificing recall or fine-grained localization. Maintaining recall under lightweight fusion ensures that small anomalies remain detectable, preventing false negatives that could otherwise lead to accumulated risks. (4) Finally, enabling D improves inference stability and directly targets the class imbalance. Unlike standard losses that rely only on instantaneous predictions, EMASVFL introduces an EMA of batch-wise IoU to track global training difficulty. It then applies a sliding modulation weight that assigns higher gradients to ambiguous hard samples while down-weighting easy ones. This dynamic gain control mechanism stabilizes gradient updates and gradually emphasizes rare but safety-critical objects as training progresses. The loss adjustment yields a recall of 75.9% and mAP@0.5:0.95 of 38.9%, demonstrating that EMASVFL effectively handles class imbalance and hard samples while improving overall detection confidence. Specifically, the recall gain from EMASVFL is particularly valuable because it improves detection of the minority bang class without increasing false alarms on the majority maogan class, directly addressing the concern about class imbalance.
When A and B are combined (A + B), the mAP@0.5 reaches 74.3%, which is 2.1% higher than using A alone and 0.9% higher than using B alone. This indicates that lightweight feature extraction (Faster Blocks) and deformable sampling (DCNv2) are complementary rather than redundant. A preserves high-frequency texture details at low computational cost, while B adaptively adjusts sampling locations to irregular geometries. Their combination allows the network to simultaneously capture fine texture and shape deformation, resulting in a performance gain that exceeds either individual contribution. The synergy is not merely additive but multiplicative in effect, as A and B operate on different aspects of feature representation.
Adding C to A + B (A + B + C) further increases mAP@0.5 to 74.8%, a gain of 0.5% over A + B. Although this gain is modest compared to the large jump from baseline to C alone, it must be interpreted in the context of bottleneck shifting. C already resolves the most severe limitation of the original design: inefficient multi-scale fusion and suppression of small anomaly signals. Once this major bottleneck is alleviated, the remaining headroom for A and B is naturally smaller. Nevertheless, the positive increment (0.5 points) confirms that A and B still provide useful features that C can further exploit, and there is no negative interaction.
Finally, incorporating D into A + B + C yields the full FDSE-DETR, which achieves the best overall performance: mAP@0.5 of 75.3%, mAP@0.5:0.95 of 40.3%, and recall of 79.1%, confirming that the full model not only improves standard accuracy but also significantly enhances the recall of rare safety-critical anomalies and maintains high localization quality across IoU thresholds. The 3.9% improvement in overall recall (from 75.2% to 79.1%) translates directly into a substantial reduction in missed hazards, which is the primary safety concern in mining conveyor operations. Compared with A + B + C, the full model improves recall by 1.8% and mAP@0.5:0.95 by 0.5%. This improvement is particularly significant because D operates on the loss function, directly affecting the optimization dynamics rather than the network architecture. While A, B, and C enhance representation capability, D changes how the model learns from imbalanced data. Consequently, D’s effect is largely orthogonal to the other components, leading to a clear boost in recall and localization quality without sacrificing precision. The fact that adding D after A + B + C still yields noticeable gains demonstrates that the architectural improvements have already provided a strong feature basis, and the loss reweighting further unleashes the model’s potential on hard and rare samples.
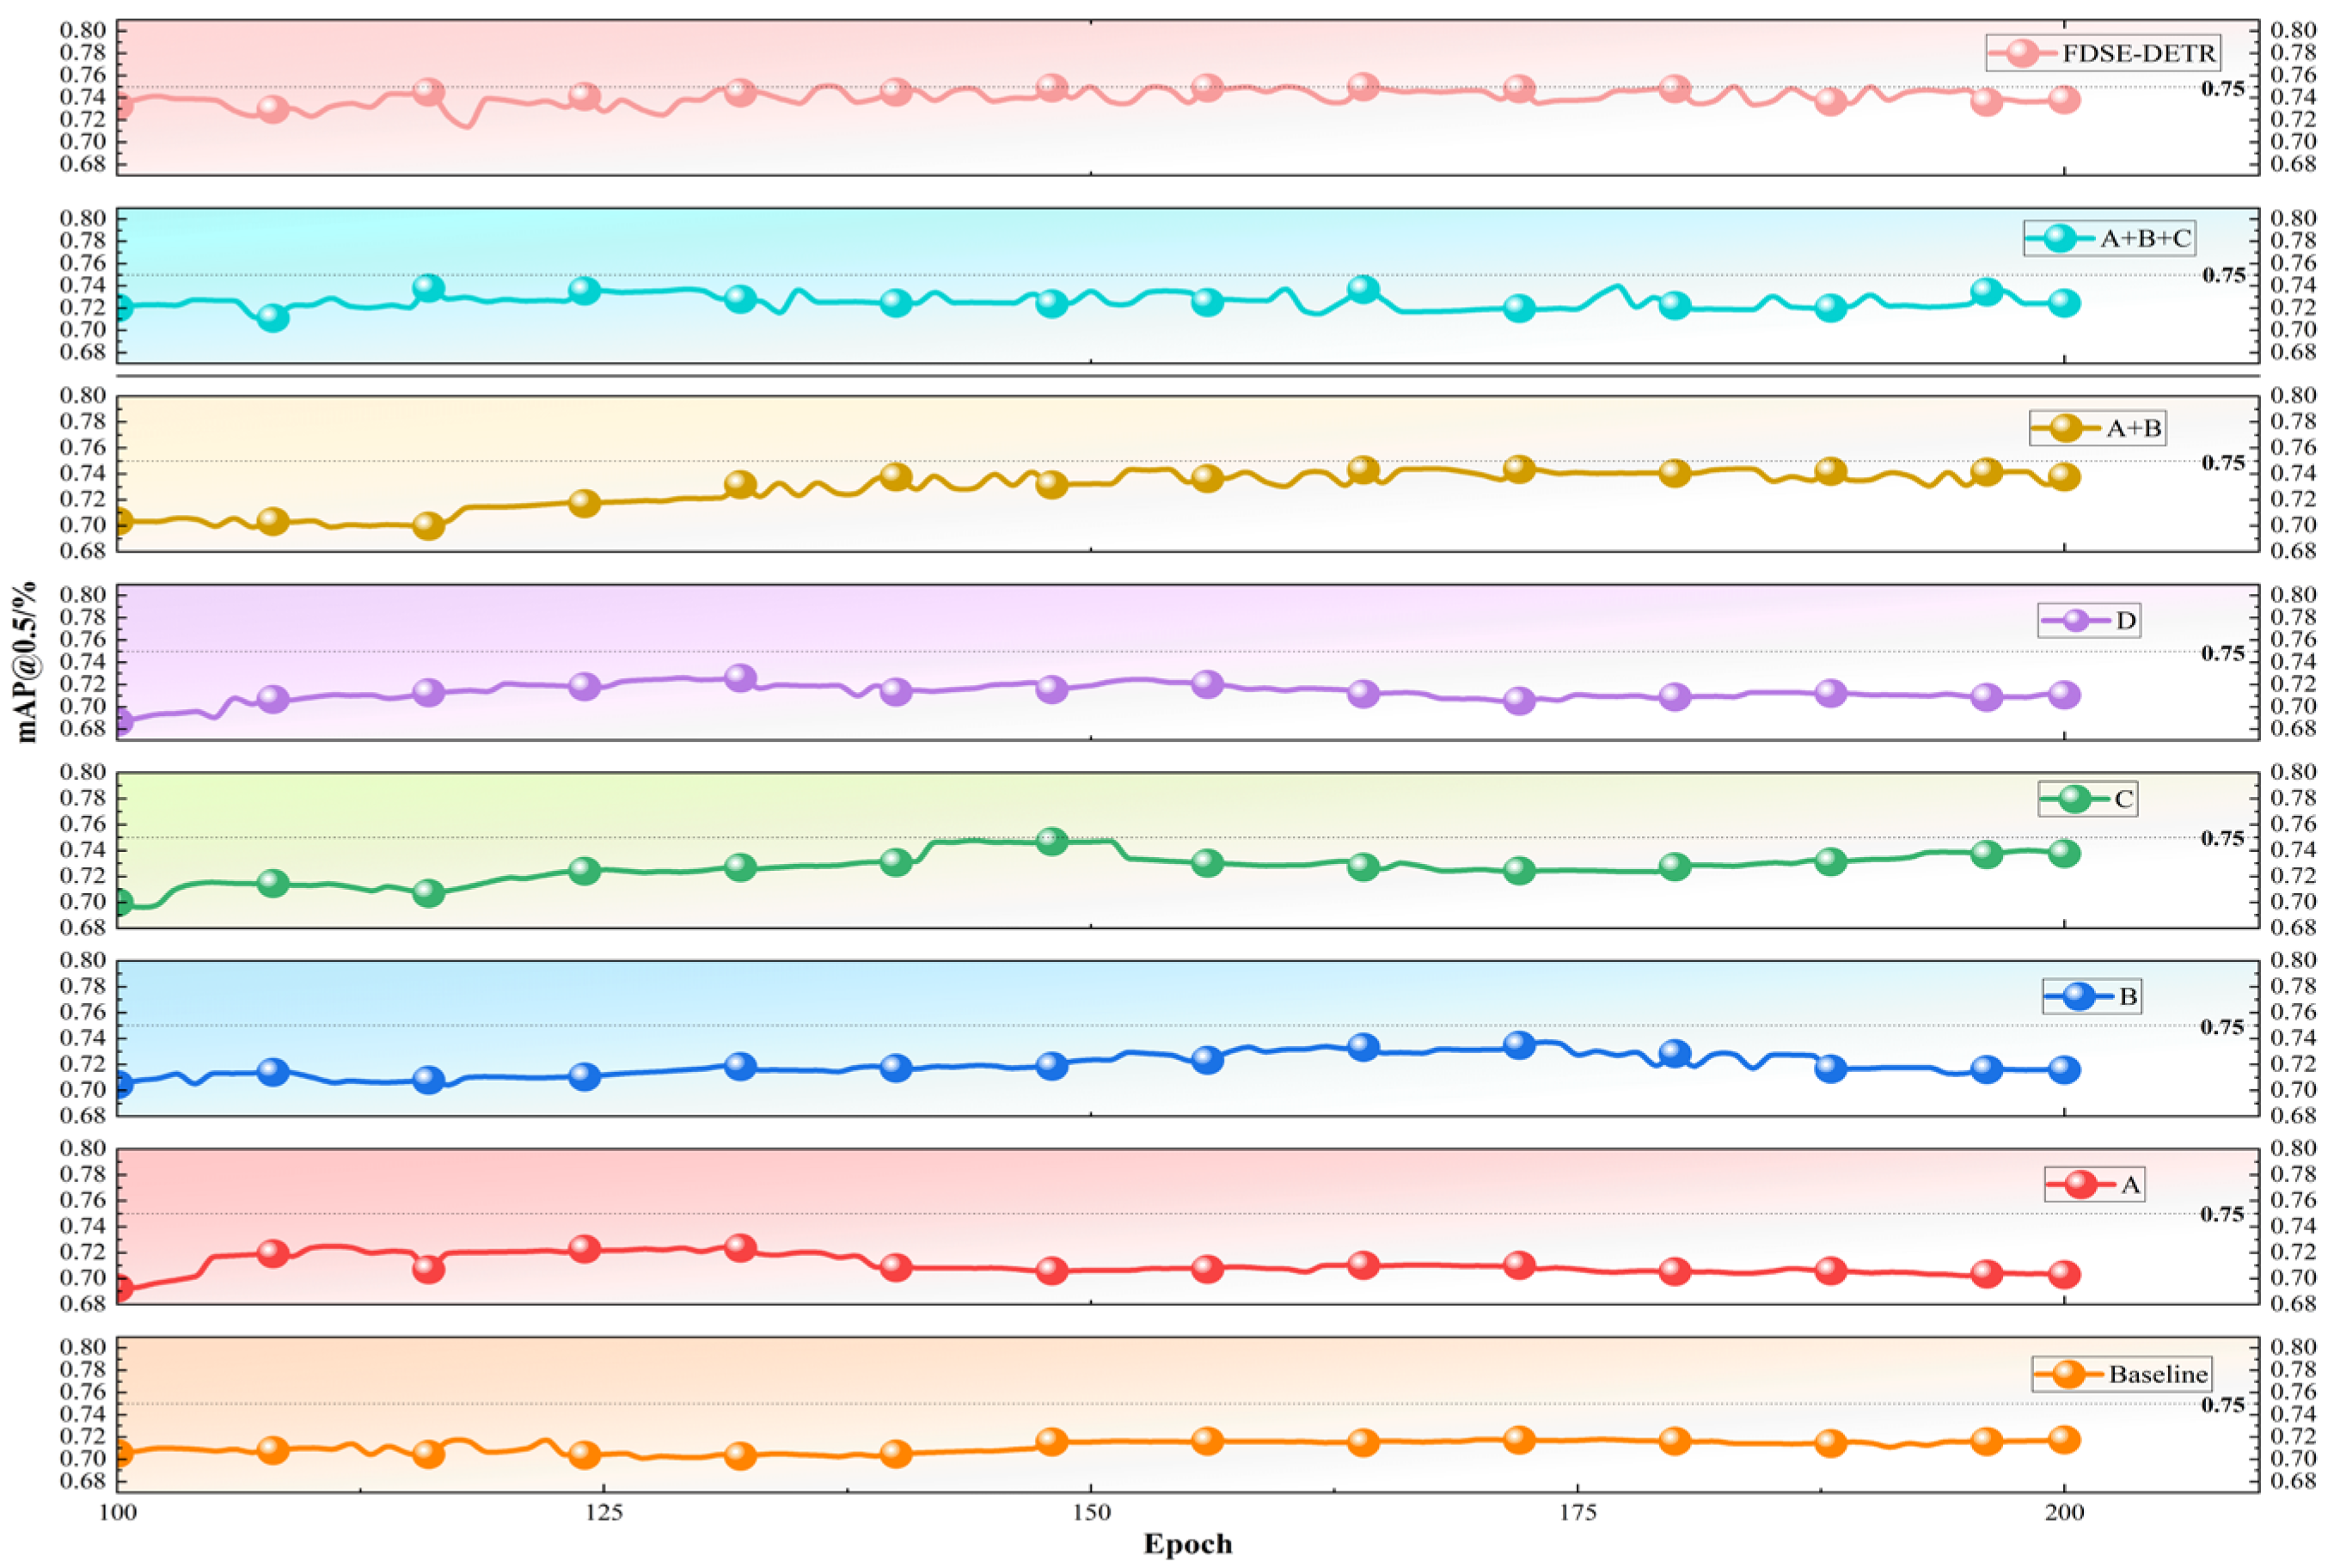
Figure 16 illustrates the mAP@0.5 progression from epoch 100 to epoch 200 during the ablation study, where the horizontal dashed line marks the 0.75 reference. It can be clearly observed that only the complete FDSE-DETR configuration reaches or exceeds this threshold, while all ablated variants fall below it. This further confirms that each added component contributes positively to detection accuracy and that the full model achieves a practically meaningful performance level. Under normal circumstances, the conveyor belt in an underground mine operates at a speed of 2.5 m/s. At this speed, an image processing rate of 120.7 FPS means that the system captures and analyzes a new frame every 8.33 ms. Within this short interval, the belt moves approximately 20.8 mm (2.5 m/s × 0.00833 s). Such a high frame rate ensures that even small hazards are sampled multiple times as they pass through the camera’s field of view, significantly reducing the risk of missed detection. This real-time capability is essential for reliable operation in high-speed mining conveyor belt environments.
Overall, the ablation results show that the proposed framework follows a coherent design logic rather than isolated tricks. Compared with the baseline, the final configuration reduces Param by 5.56% and FLOPs by 22.5% and improves mAP@0.5 by 4.5%, which better matches the real-time and accuracy requirements of mining monitoring. Recall improves by 3.9% and mAP@0.5:0.95 by 2.2%, further demonstrating the effectiveness of the proposed components in addressing class imbalance and irregular hazard detection.
4.7. Comparison of Different Object Detection Models
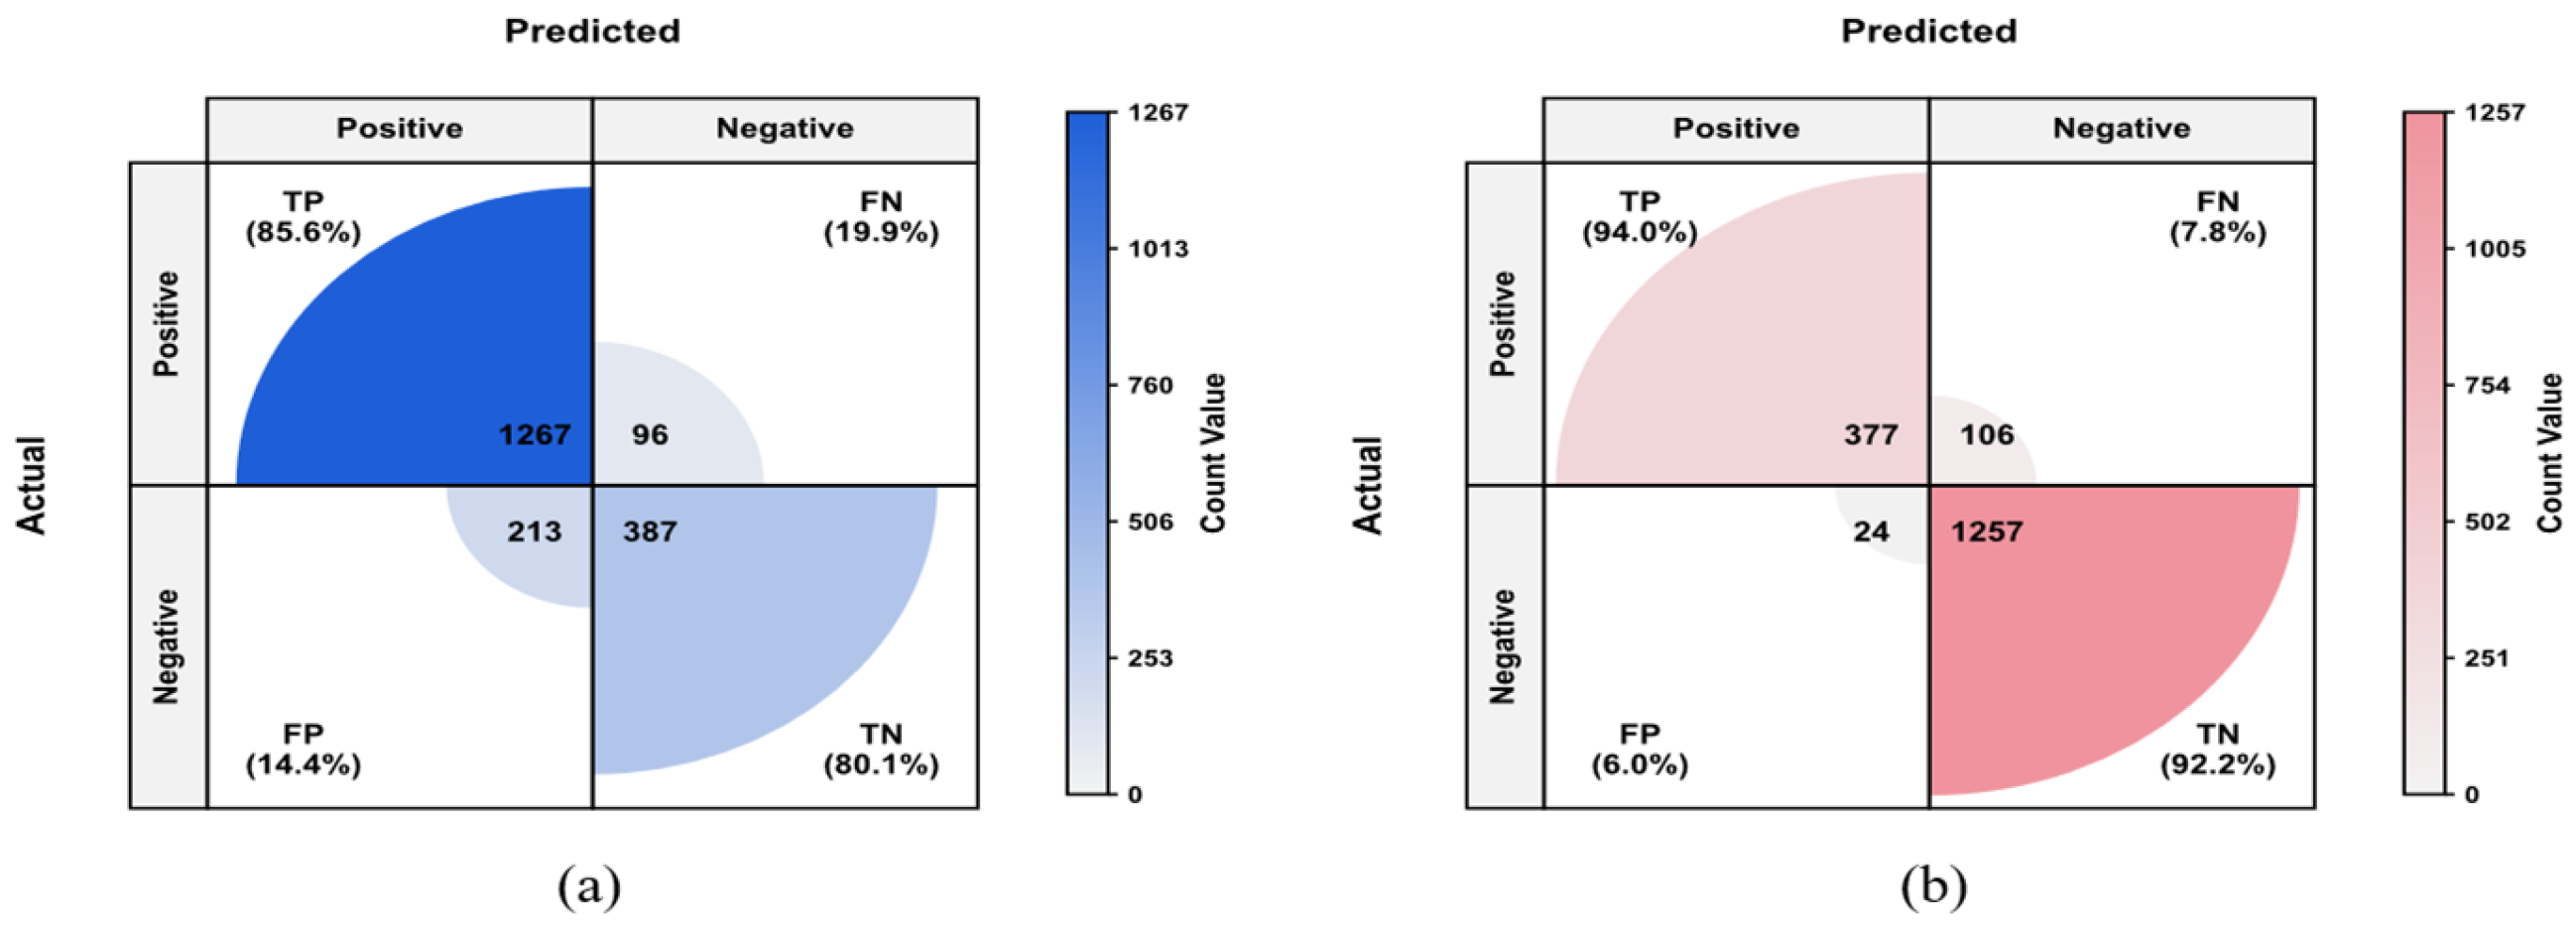
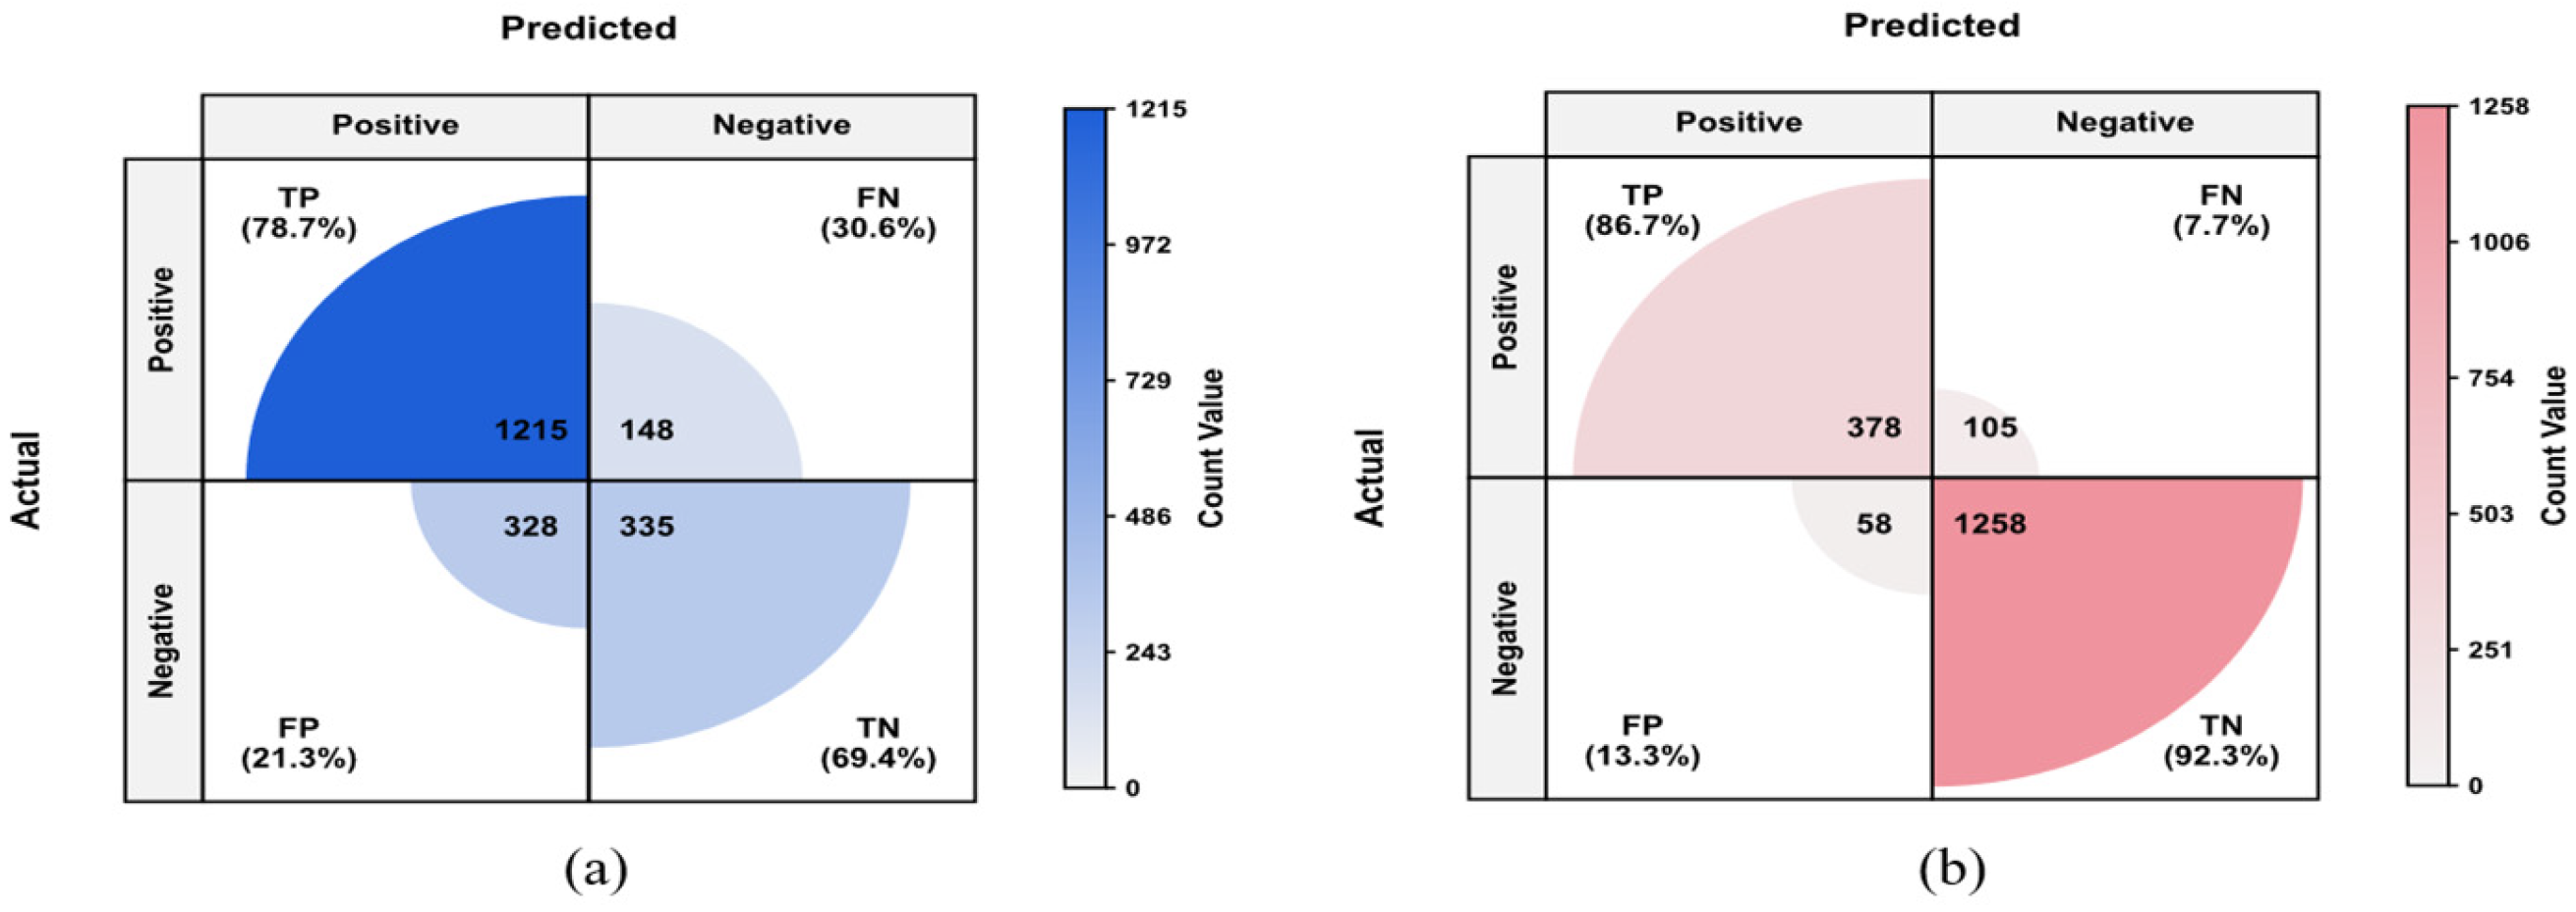
To examine classification reliability, this study compares confusion matrices for the baseline and the enhanced system, as shown in
Figure 17 and
Figure 18. For each model, subfigure (a) corresponds to the maogan class, and subfigure (b) corresponds to the bang class. The matrices indicate that the enhanced model makes fewer confusions between hazardous categories and background related classes.
FDSE-DETR exhibits stronger class discrimination than the baseline, particularly for safety-critical hazards. This study reports the F1-score (Equation (13)) as a summary metric that balances recall and precision. For the maogan class, FDSE-DETR reduces false positives by 115 and false negatives by 52 compared to RT-DETR, while increasing true positives by 52. Consequently, the F1-score improves from 75.3% to 83.3%. For the bang class, false positives drop from 58 to 24 (a 58.6% reduction), and the F1-score increases from 86.8% to 94.0%. These gains reflect fewer missed detections and fewer false alarms. In mining operations, reducing missed detections lowers the probability that hazardous objects pass the inspection point undetected, while reducing false alarms avoids unnecessary line stoppages and helps maintain production continuity.
Overall, the confusion matrix trends suggest that the proposed design improves separability between foreign object appearances and background textures. This leads to more stable predictions and supports autonomous deployment in industrial monitoring.
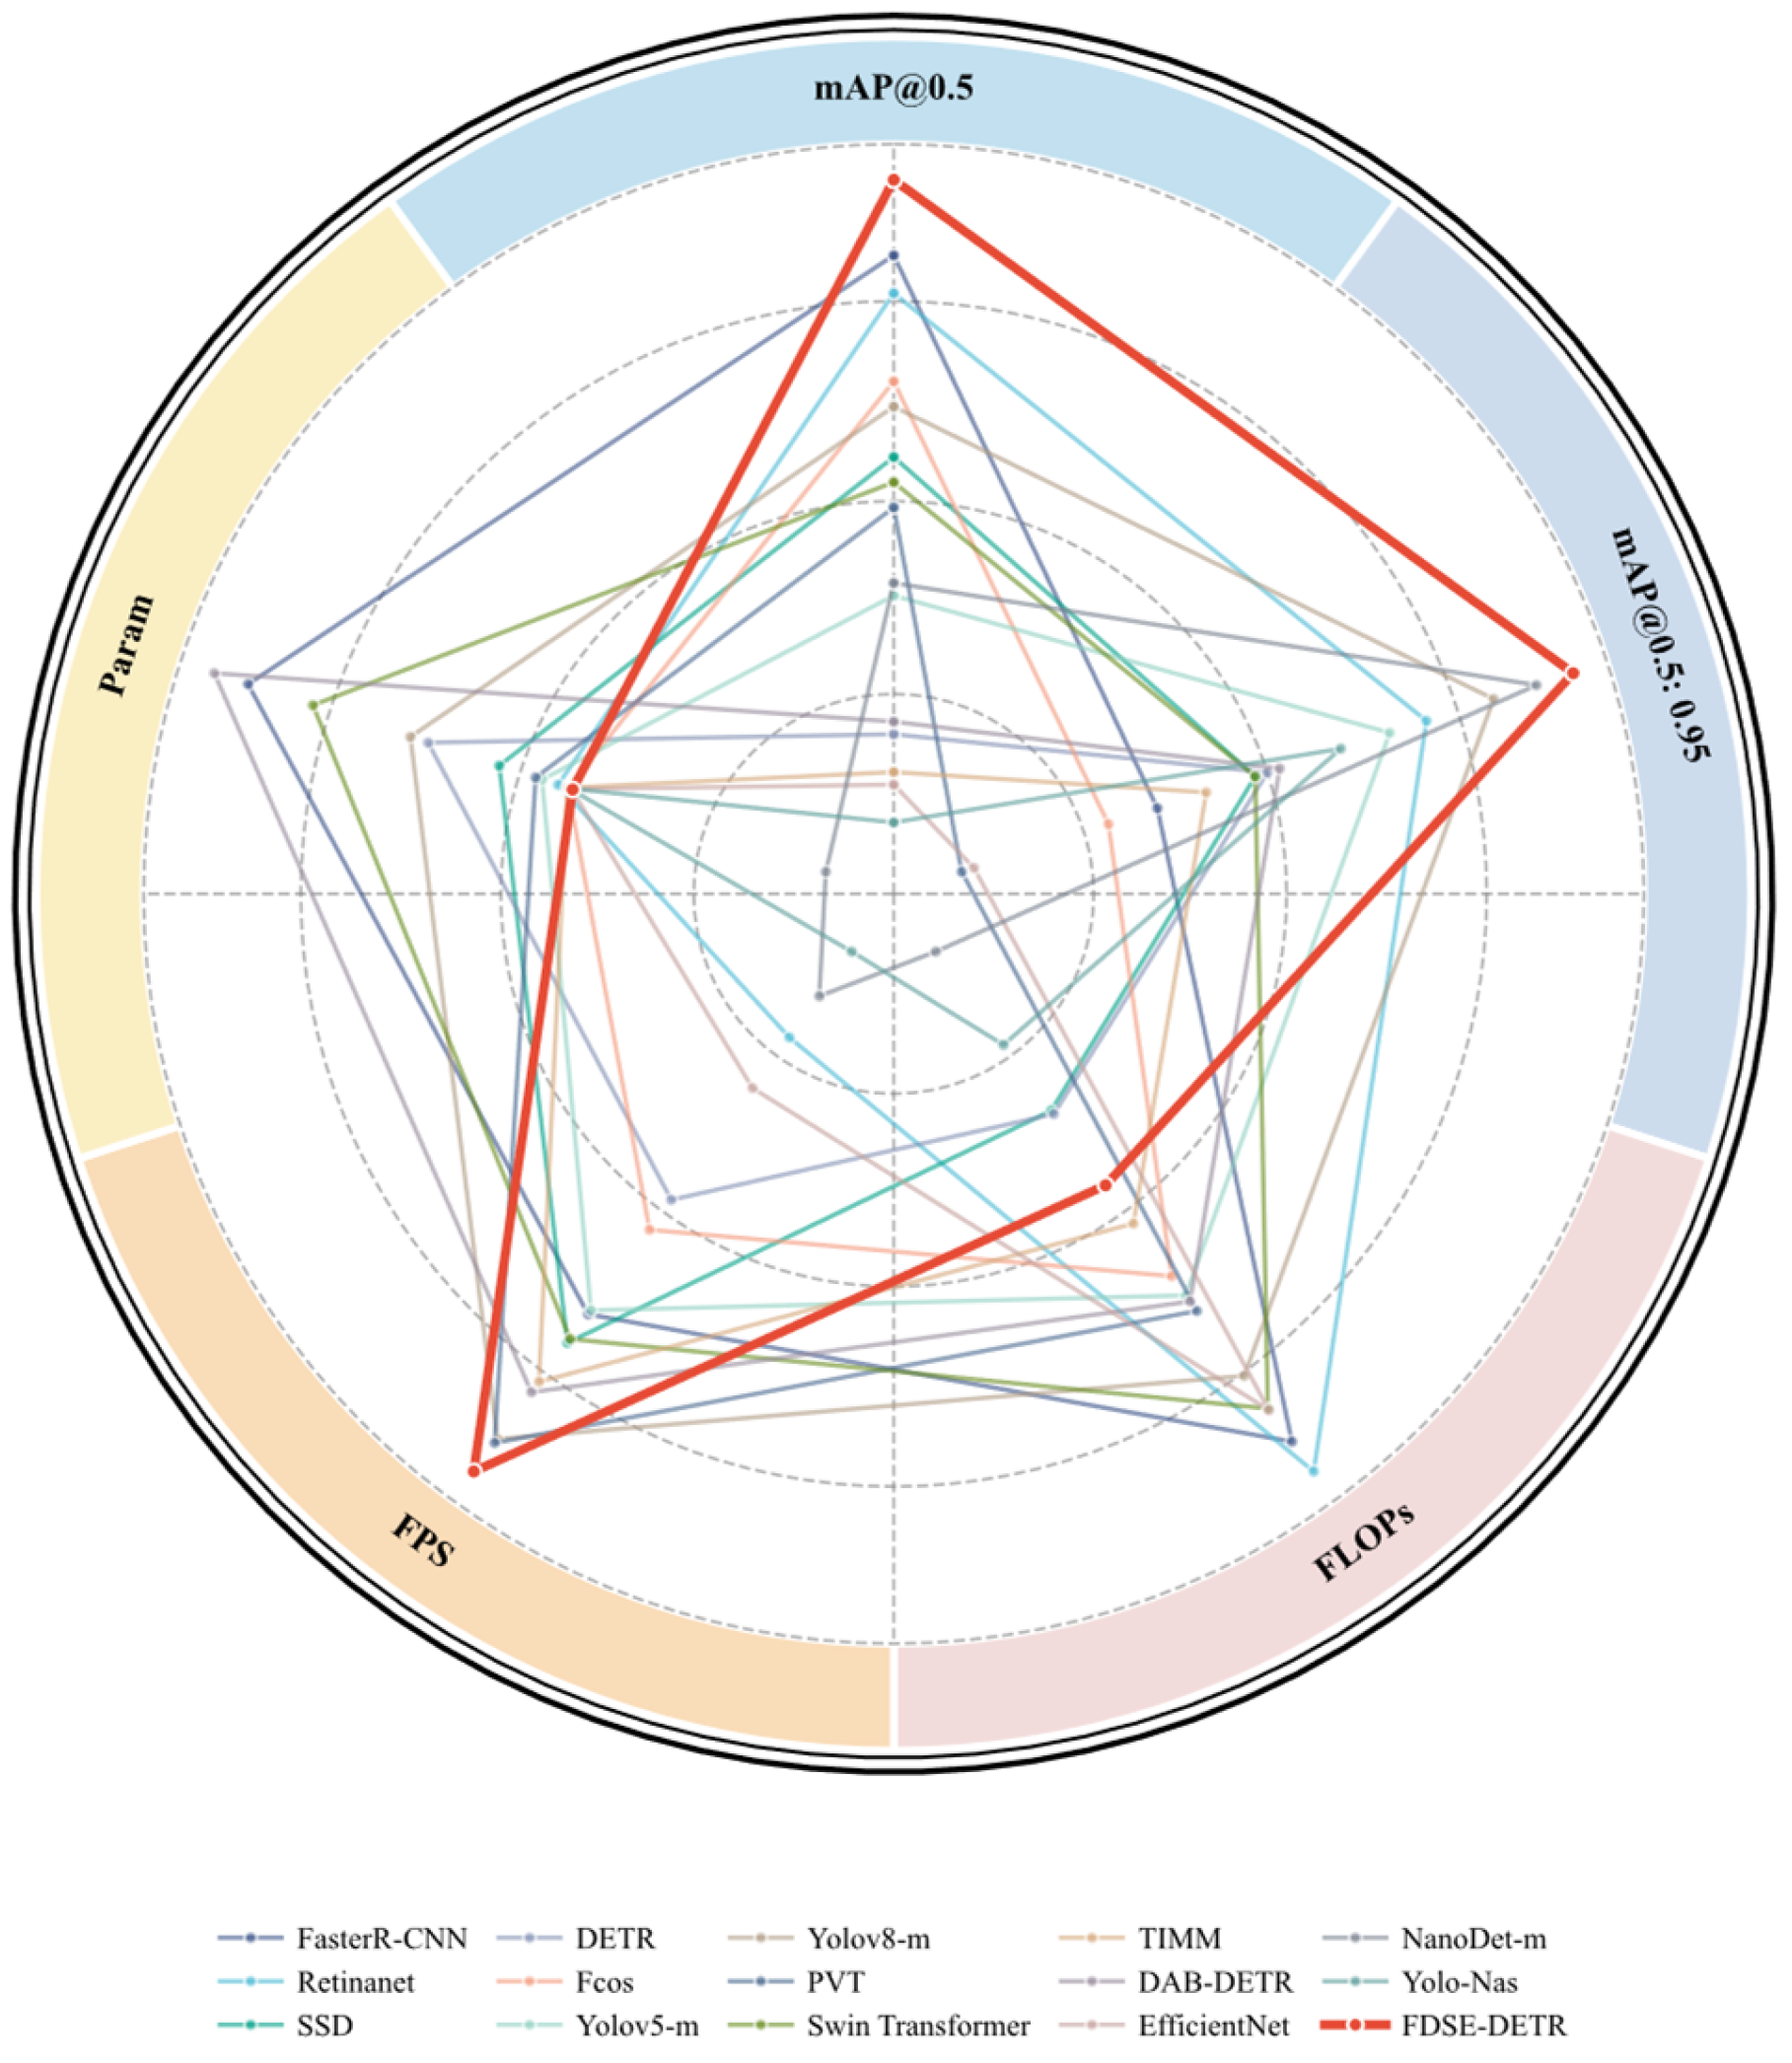
To place FDSE-DETR in the context of intelligent monitoring for mining conveyor scenes, this study compares it with twelve representative detectors. For clarity, this study groups the baselines into three categories: CNN-based detectors (Faster R-CNN, RetinaNet, SSD, FCOS, EfficientNet, TIMM), lightweight real-time detectors (YOLOv5, YOLOv8, NanoDet, YOLO-NAS), and Transformer-based architectures (DETR, DAB-DETR, PVT, Swin Transformer). All methods are evaluated on the same composite mining dataset, and the results are reported in
Table 6.
As summarized in the table, FDSE-DETR offers a strong balance between reliability, efficiency, and deployability. Compared with the two-stage Faster R-CNN baseline, FDSE-DETR reaches similar detection reliability while using 45.4% of the parameters and 48.5% of the FLOPs. This reduction supports deployment on embedded edge nodes without compromising monitoring quality. Compared with heavier Transformer models such as Swin Transformer and PVT, FDSE-DETR achieves better accuracy and higher efficiency, which suggests that a task-focused design is more suitable for this industrial setting than general-purpose large models. Methods such as SSD and FCOS offer lower computational costs but fall short in safety-critical accuracy. RetinaNet and EfficientNet achieve moderate accuracy with higher FLOPs, while TIMM shows even lower reliability. Similarly, lightweight detectors like NanoDet and YOLO-NAS are either less accurate or slower than FDSE-DETR. Specifically, NanoDet is much lighter but sacrifices both accuracy and speed; YOLO-NAS has a similar size to FDSE-DETR yet lags by 5.1% in mAP@0.5 and is 40 FPS slower. Relative to the YOLO family, FDSE-DETR improves mAP@0.5 by 3.3% over YOLOv5 and by 1.8% over YOLOv8, while maintaining the highest throughput at 120.7 FPS, providing a larger safety margin against missed detections. Although DETR has the benefit of end-to-end detection, it typically converges slowly and runs with higher latency. Compared with DAB-DETR, FDSE-DETR achieves higher accuracy with substantially fewer parameters, which is consistent with tailoring the model to measurement constraints.
As shown in
Figure 19, FDSE-DETR demonstrates a well-balanced trade-off among key metrics, achieving 120.7 FPS with only 18.78M parameters while maintaining the highest detection accuracy. This real-time throughput matches the timing constraints of high-speed conveyor operation and helps ensure that hazardous foreign objects are detected early enough to trigger intervention before structural damage occurs. Overall, these results support FDSE-DETR as a deployable measurement solution for automated structural health monitoring, rather than purely algorithmic refinement.
4.8. Visualization and Analysis of Results
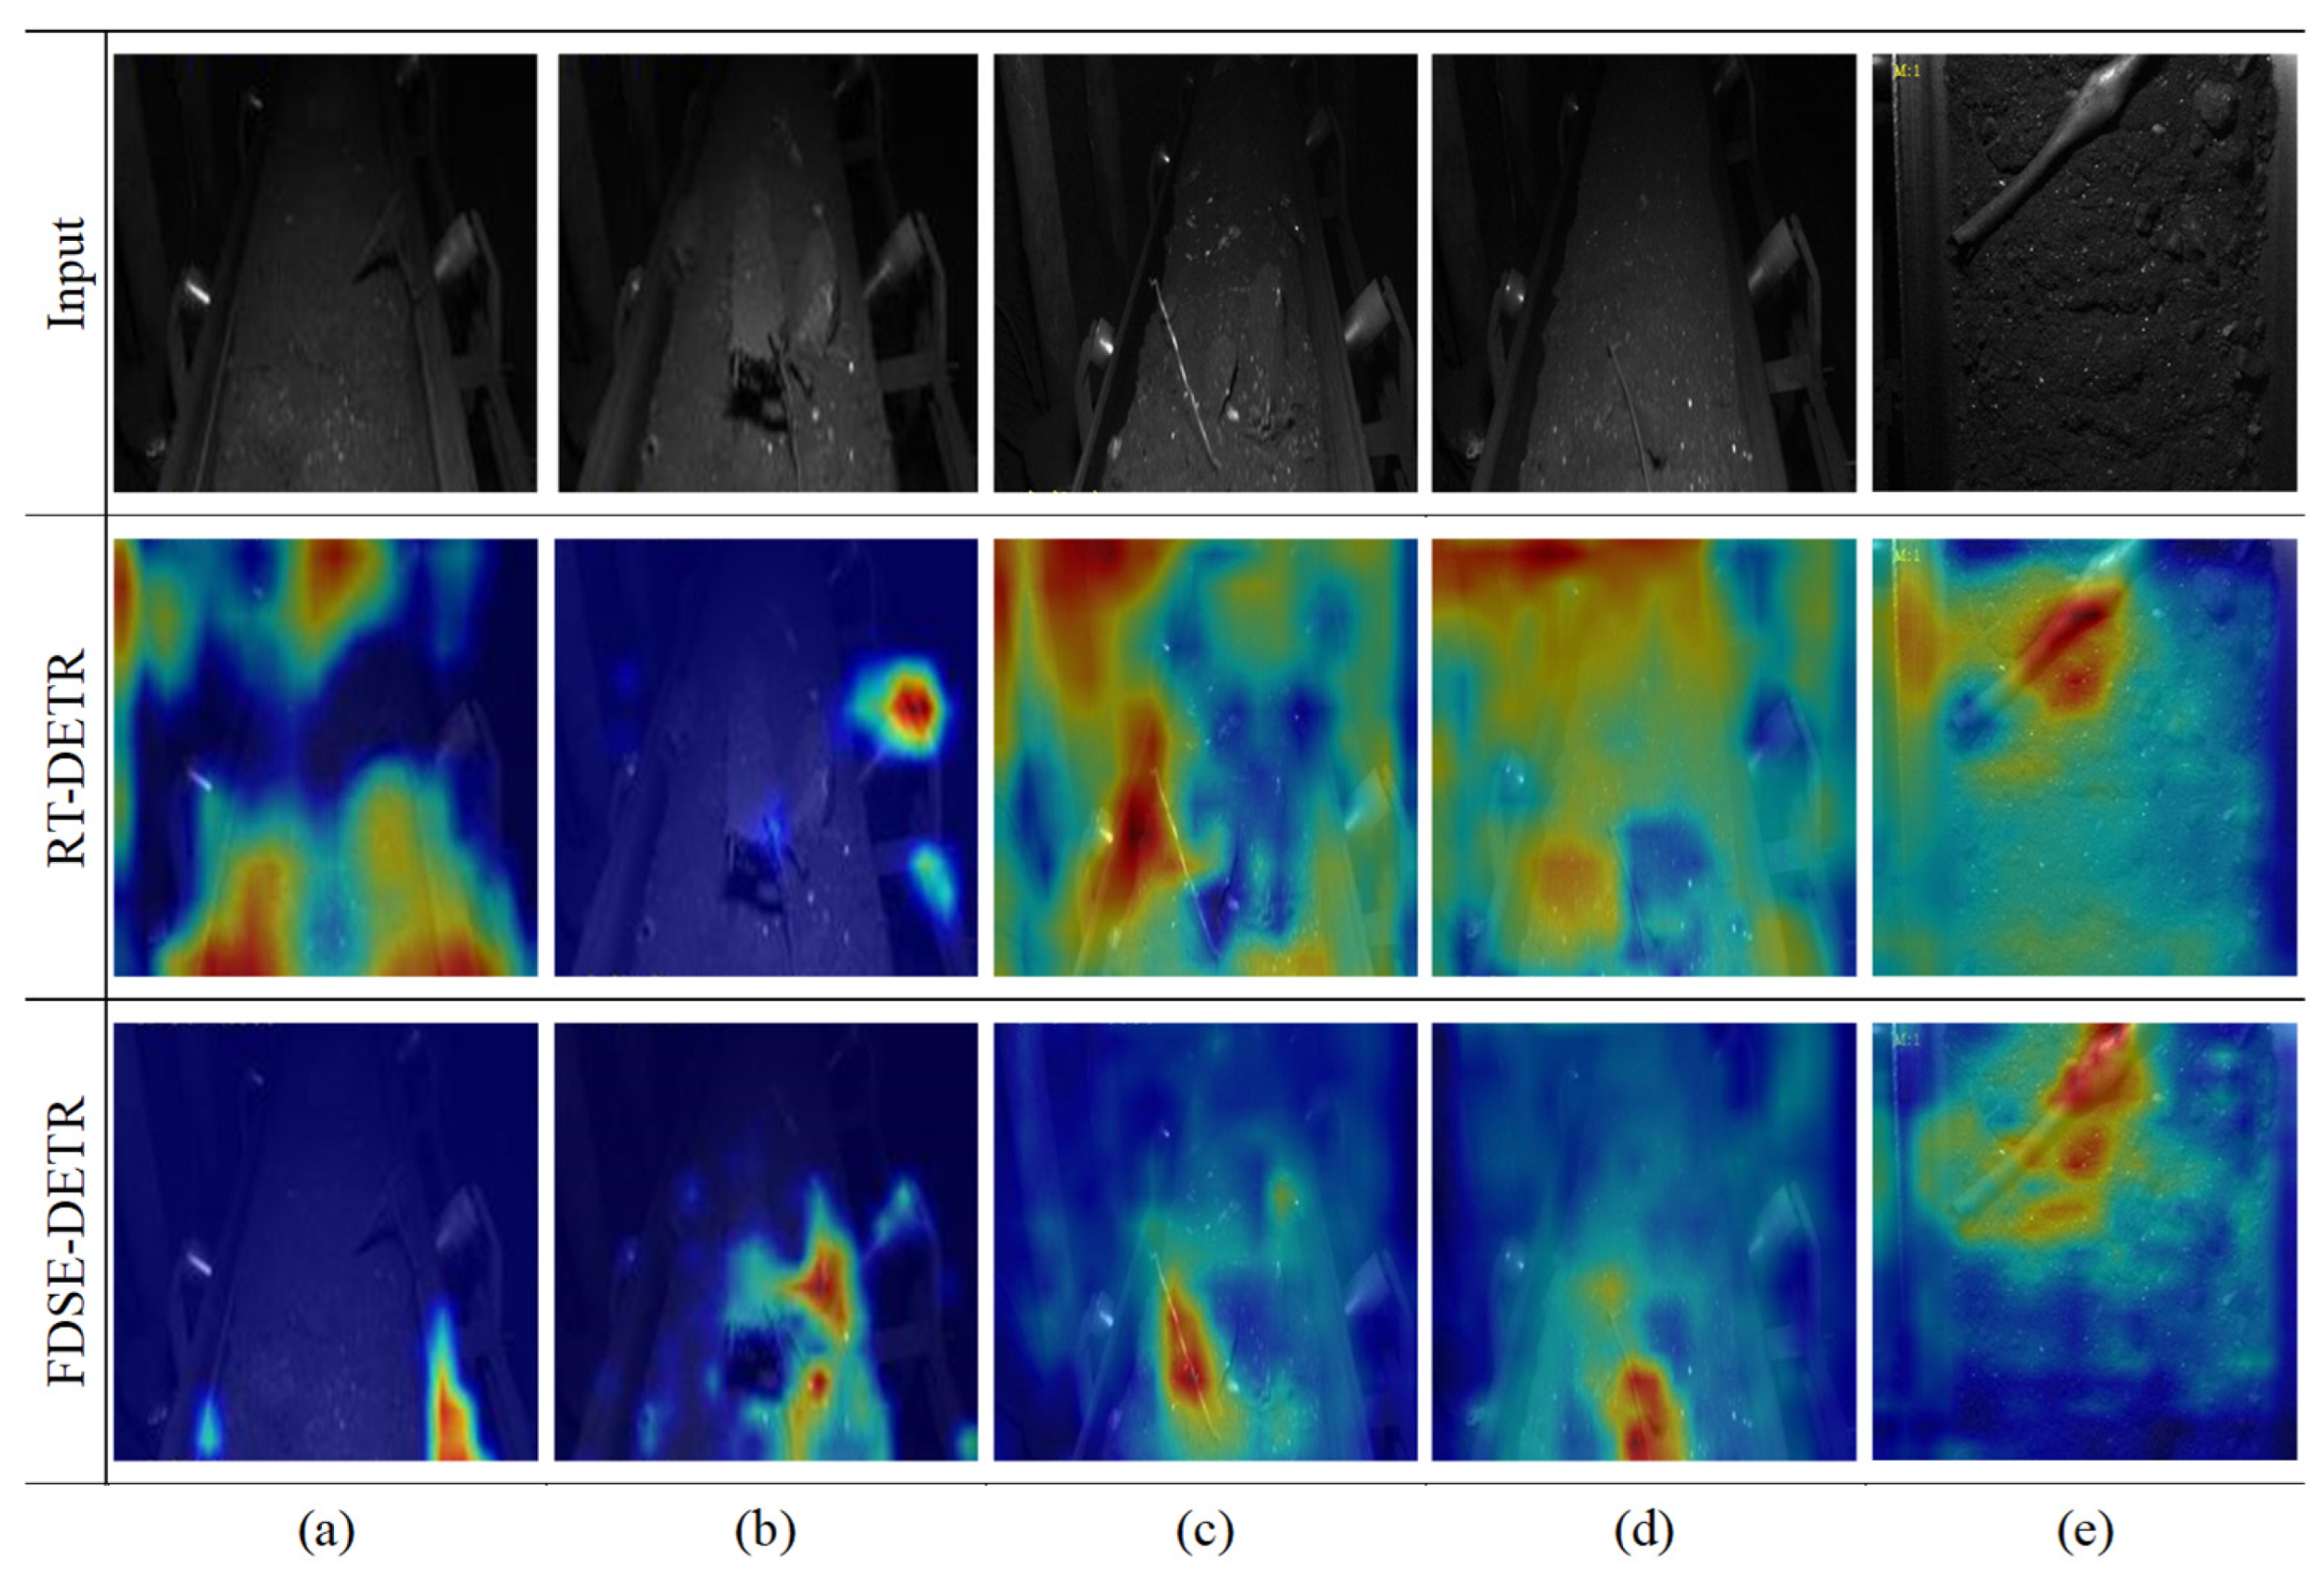
To understand why FDSE-DETR is more robust in mining scenes, this study uses GradCAM++ to visualize class-specific network responses. By backpropagating category gradients, this study generates activation heatmaps that show which regions contribute most to each prediction. This analysis targets difficult cases where hazards such as anchor rods and wooden sticks have weak contrast and are easily confused with conveyor belt textures.
Figure 20 compares the activation maps produced by RT-DETR and FDSE-DETR. RT-DETR shows diffuse responses that frequently spill into high-contrast background areas, such as glare at the edges of the conveyor belt. This reduces the effective signal-to-noise ratio and can prevent the model from concentrating on thin targets like anchor rods, which increases the chance of missed detections. For deformable objects such as metal mesh, the baseline responses also fail to follow the continuous contour, which suggests limited geometric characterization.
FDSE-DETR produces more concentrated responses on the hazardous objects and less activation on background regions. This trend is consistent with the use of adaptive sampling in DCNv2 and the history-aware weighting in EMASVFL, which together improve feature selectivity under clutter. The heatmaps align more closely with irregular object geometry, which supports more reliable localization and recognition, including under low illumination. Overall, the visualization results provide qualitative evidence that the proposed design improves extraction of foreign object cues from complex backgrounds, which is consistent with the accuracy gains reported earlier.
4.9. Edge Deployment Validation
While prior evaluations on a desktop RTX 2060 SUPER GPU demonstrate the baseline efficiency of FDSE-DETR, practical mining applications impose strict hardware limitations. Deploying detection algorithms within embedded monitoring nodes requires robust performance on severely resource-constrained devices. To transition our deployment narrative from theoretical to empirical, we conducted extensive hardware benchmarks on a representative industrial edge platform: the NVIDIA Jetson Orin Nano. To ensure a rigorous and fair evaluation, the edge deployment setup utilized FP16 precision and a batch size of four, keeping parameters consistent with our desktop experiments. Evaluation results indicate that FDSE-DETR achieves a stable, real-time inference speed of 37.5 FPS on this embedded hardware. Crucially, this transition incurs zero accuracy degradation, maintaining an mAP@0.5 of 75.3%. Given that industrial real-time monitoring typically requires at least 25 FPS to ensure timely detection and response, FDSE-DETR’s 37.5 FPS comfortably exceeds this threshold, fully satisfying the real-time requirement for edge deployment in underground mining environments. These physical hardware benchmarks explicitly substantiate our earlier claims. They confirm that the proposed framework is not merely theoretically lightweight but practically viable for real-world edge monitoring in underground mining environments.