
Investigating the Impact of Structural Features on F1 Car Diffuser Performance Using Computational Fluid Dynamics (CFD)


Abstract
1. Introduction
2. Materials and Methods
2.1. Governing Equations
- Continuity Equation (Mass Conservation):
- Momentum Equation (Navier–Stokes):
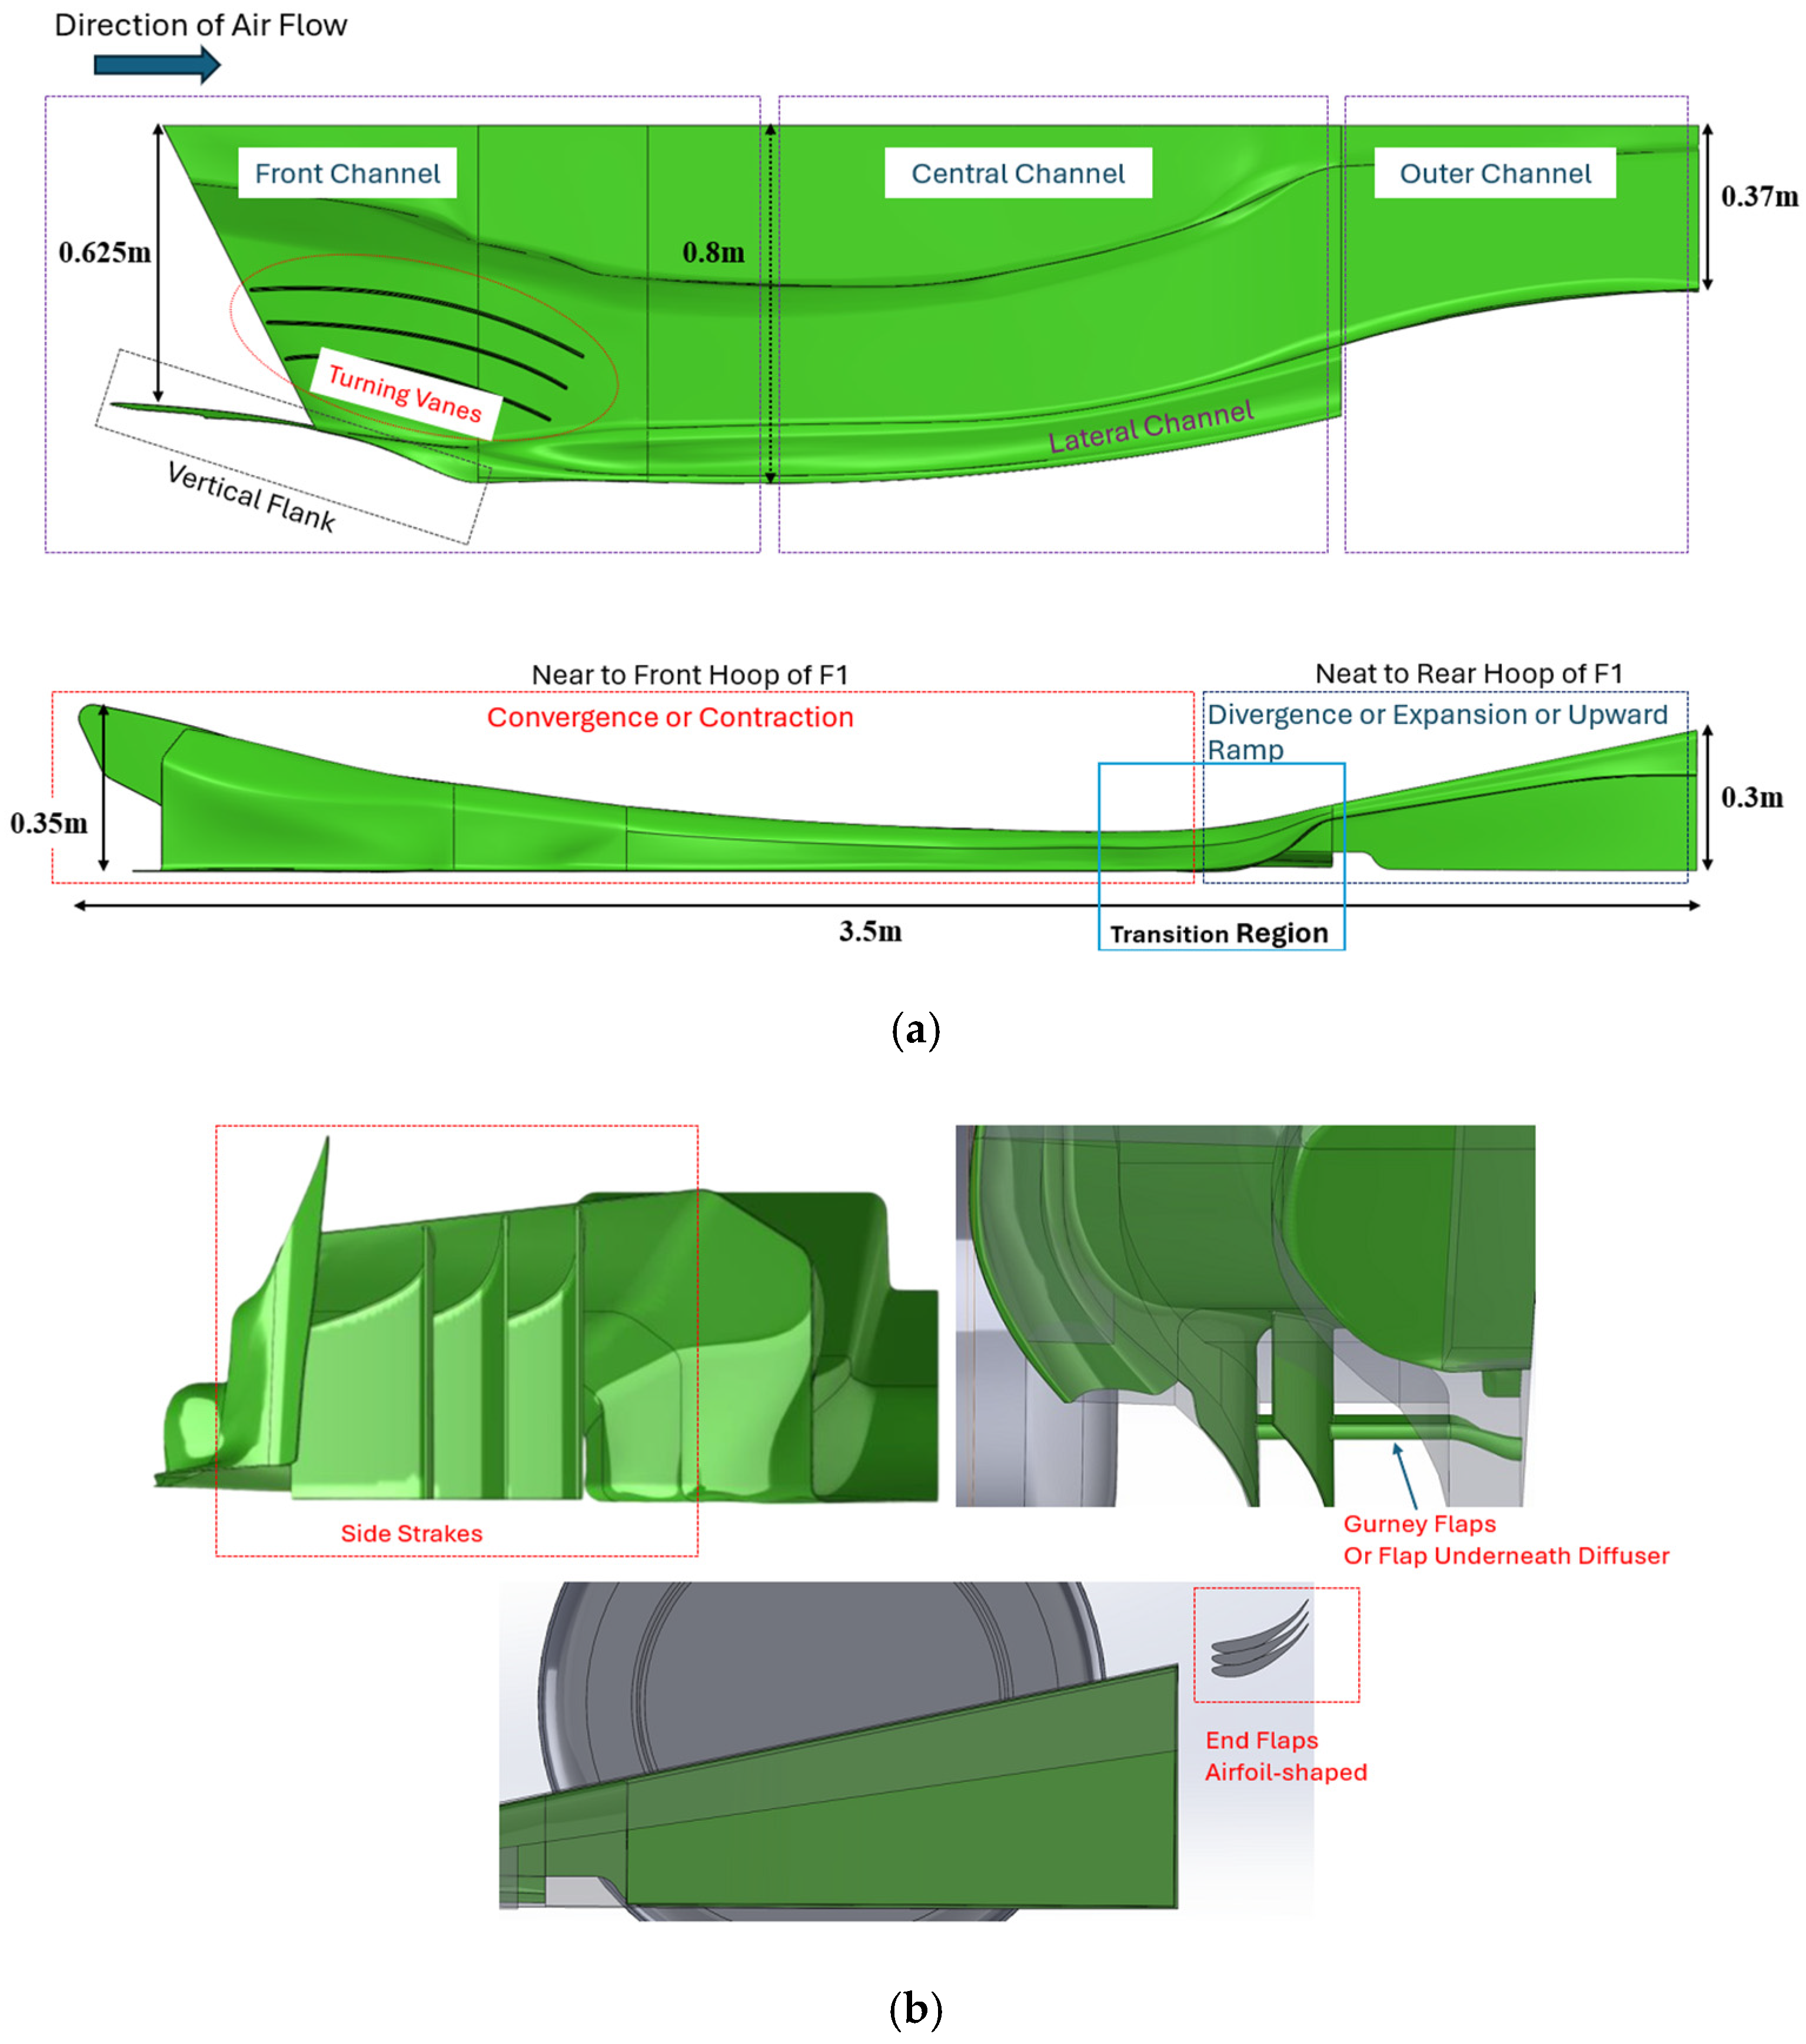
2.2. Geometry
2.3. Modifications in Diffuser Design

| Case Study | Description | ||
|---|---|---|---|
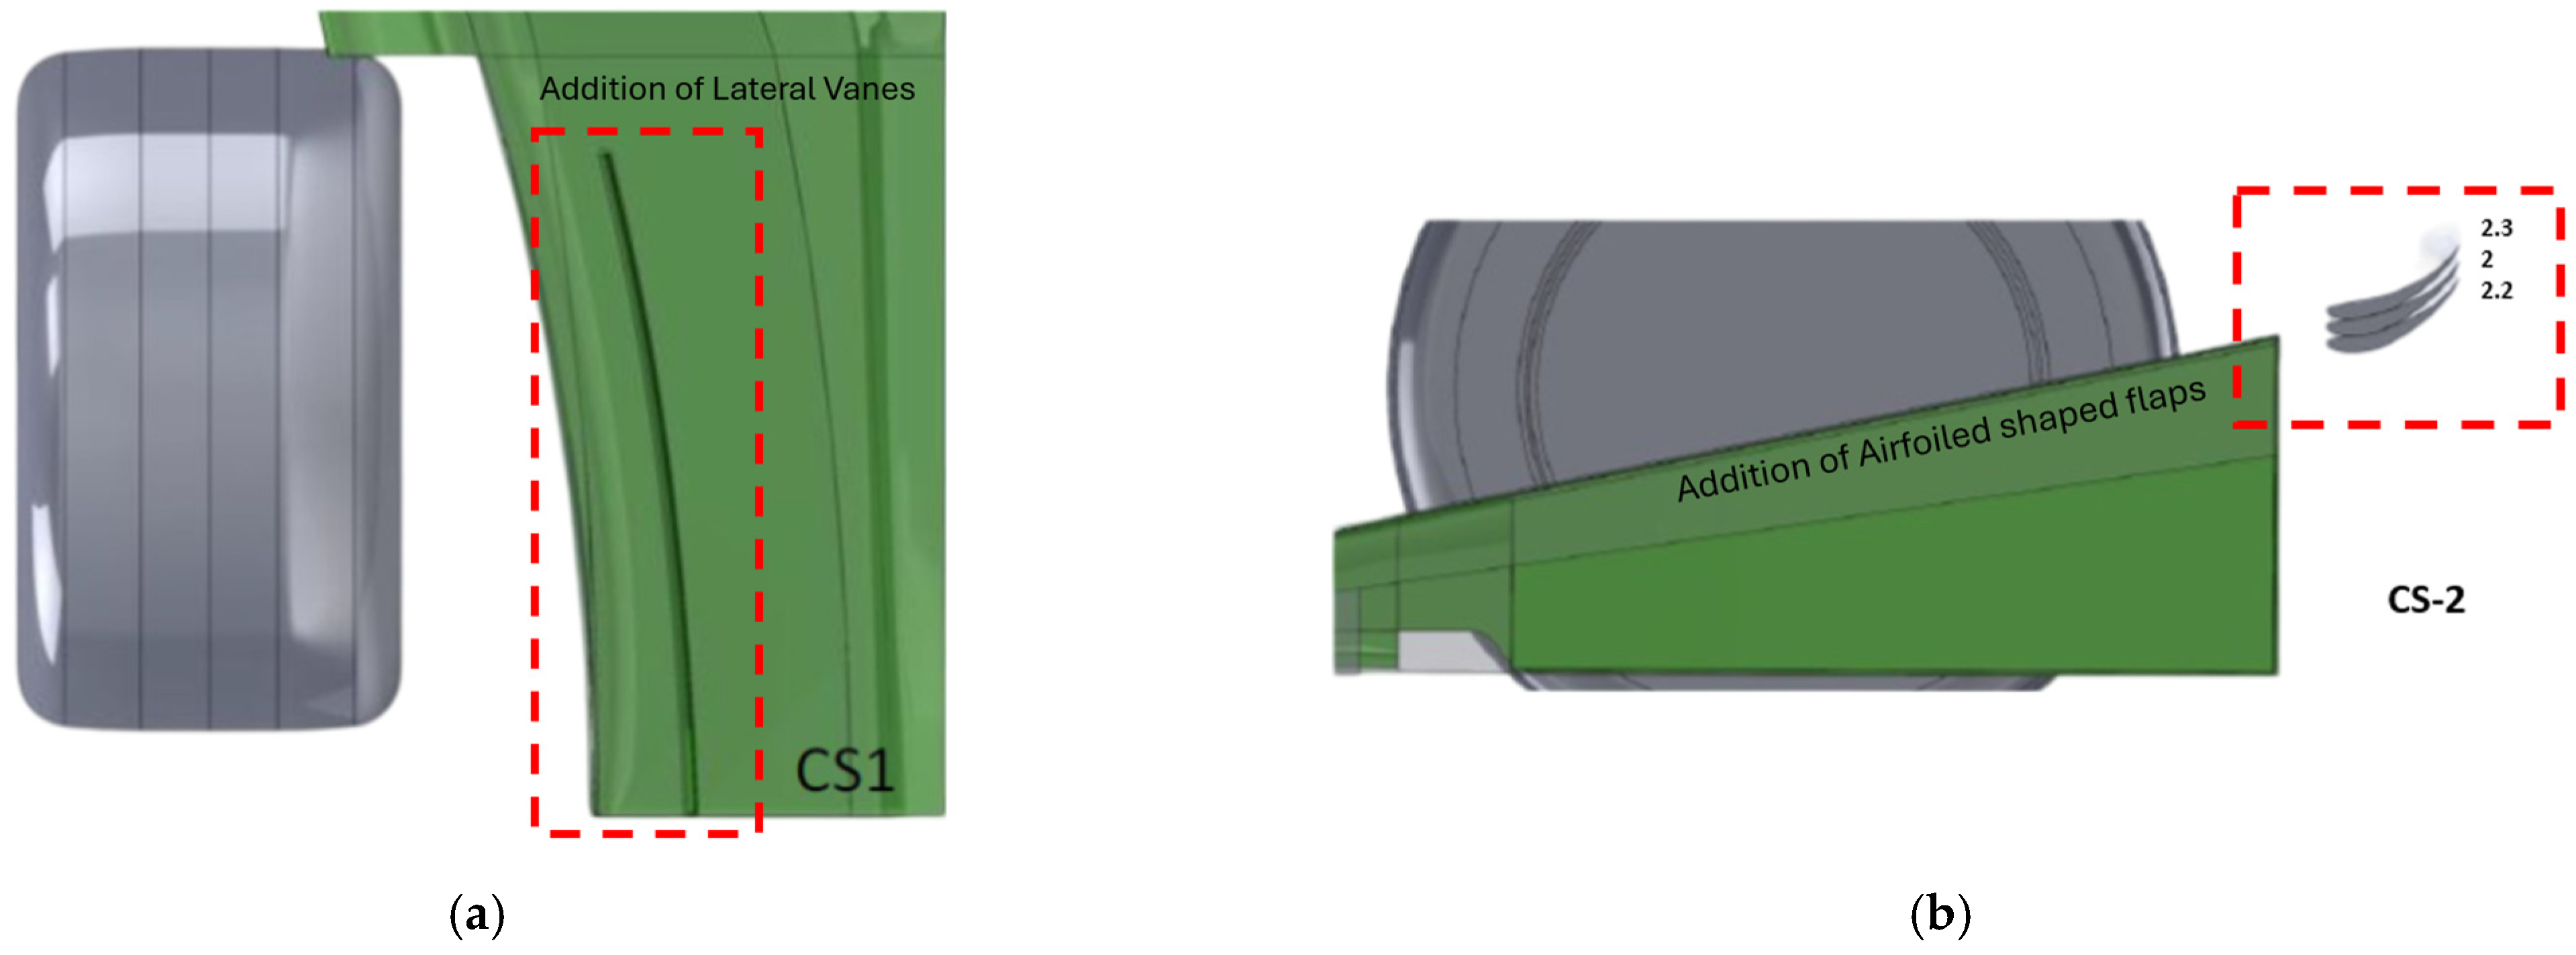
| CS-1 | Inclusion of lateral flow-guiding vanes in the divergent section (Figure 3a) | ||
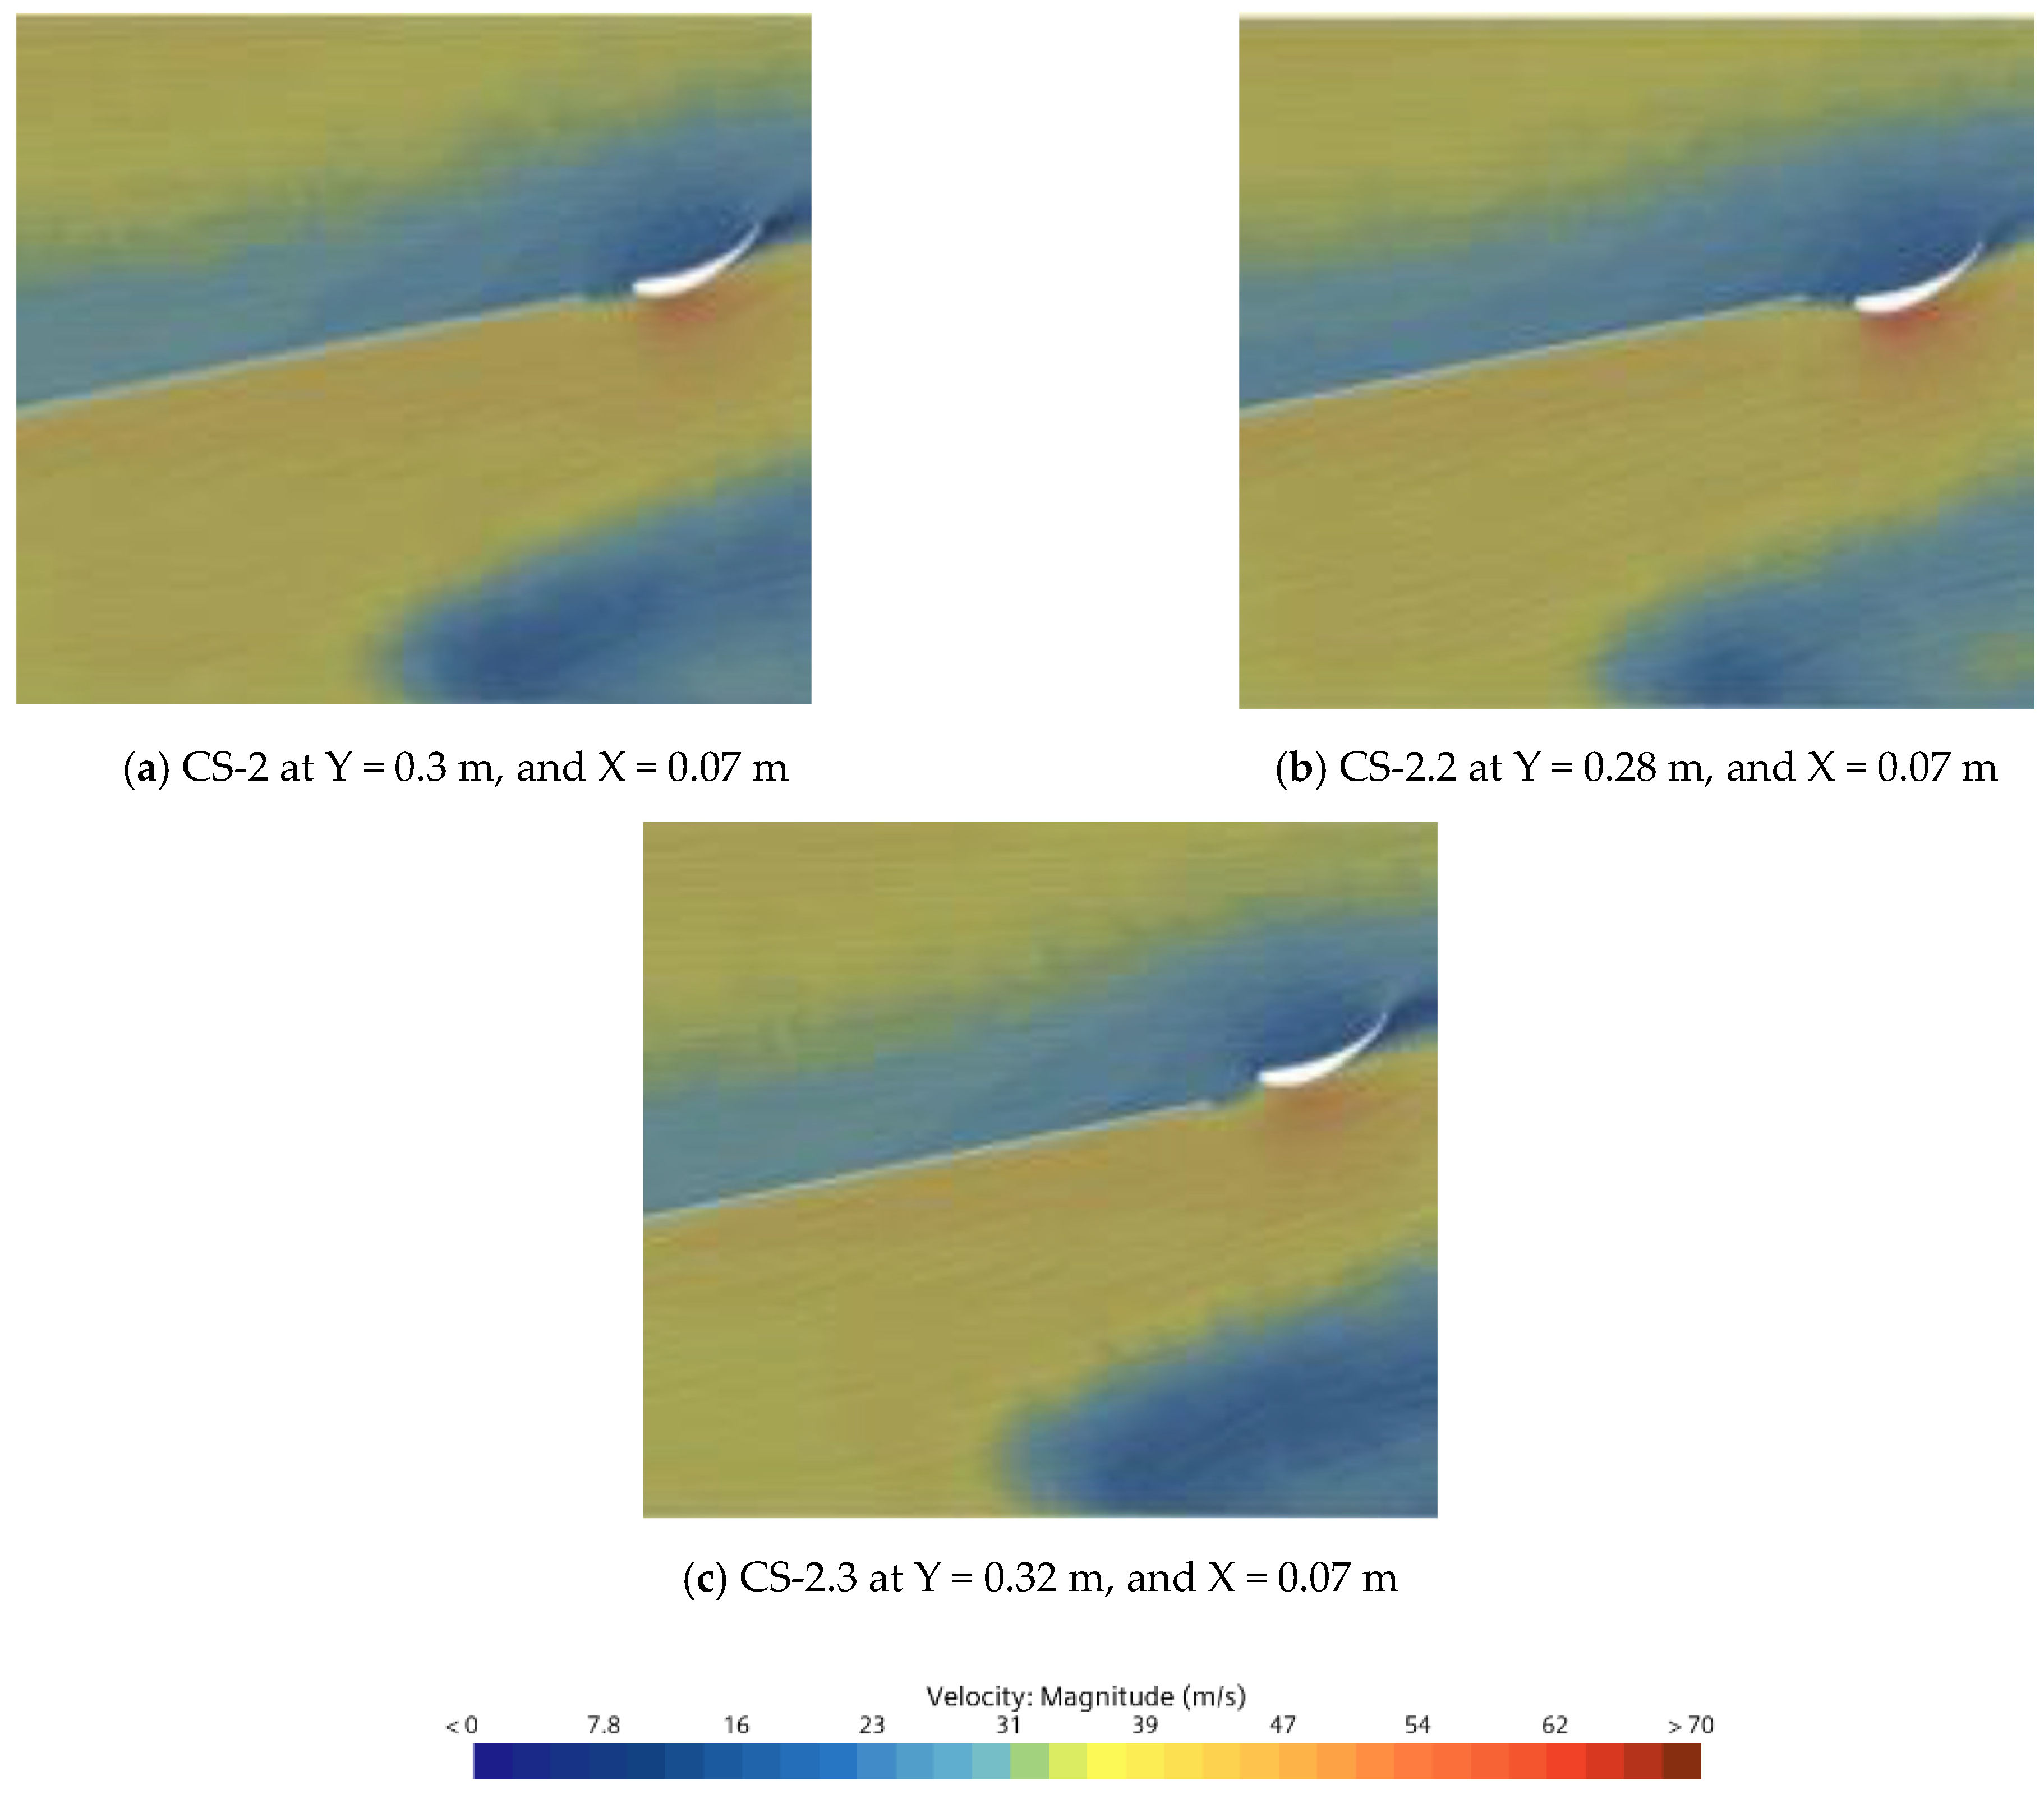
| CS-2, 2.2, 2.3 | Addition of cambered airfoil-shaped flaps at the end of the divergent section to increase diffuser length. The end-flap position measure from the diffuser is as follows: | ||
| CS-2.3 | CS-2 | CS-2.2 | |
| Y = 0.32 m, X = 0.07 m | Y = 0.30 m, X = 0.07 m | Y = 0.28 m, X = 0.07 m | |
| CS-3 | Addition of flaps underneath the diffuser section (Figure 4a). | ||
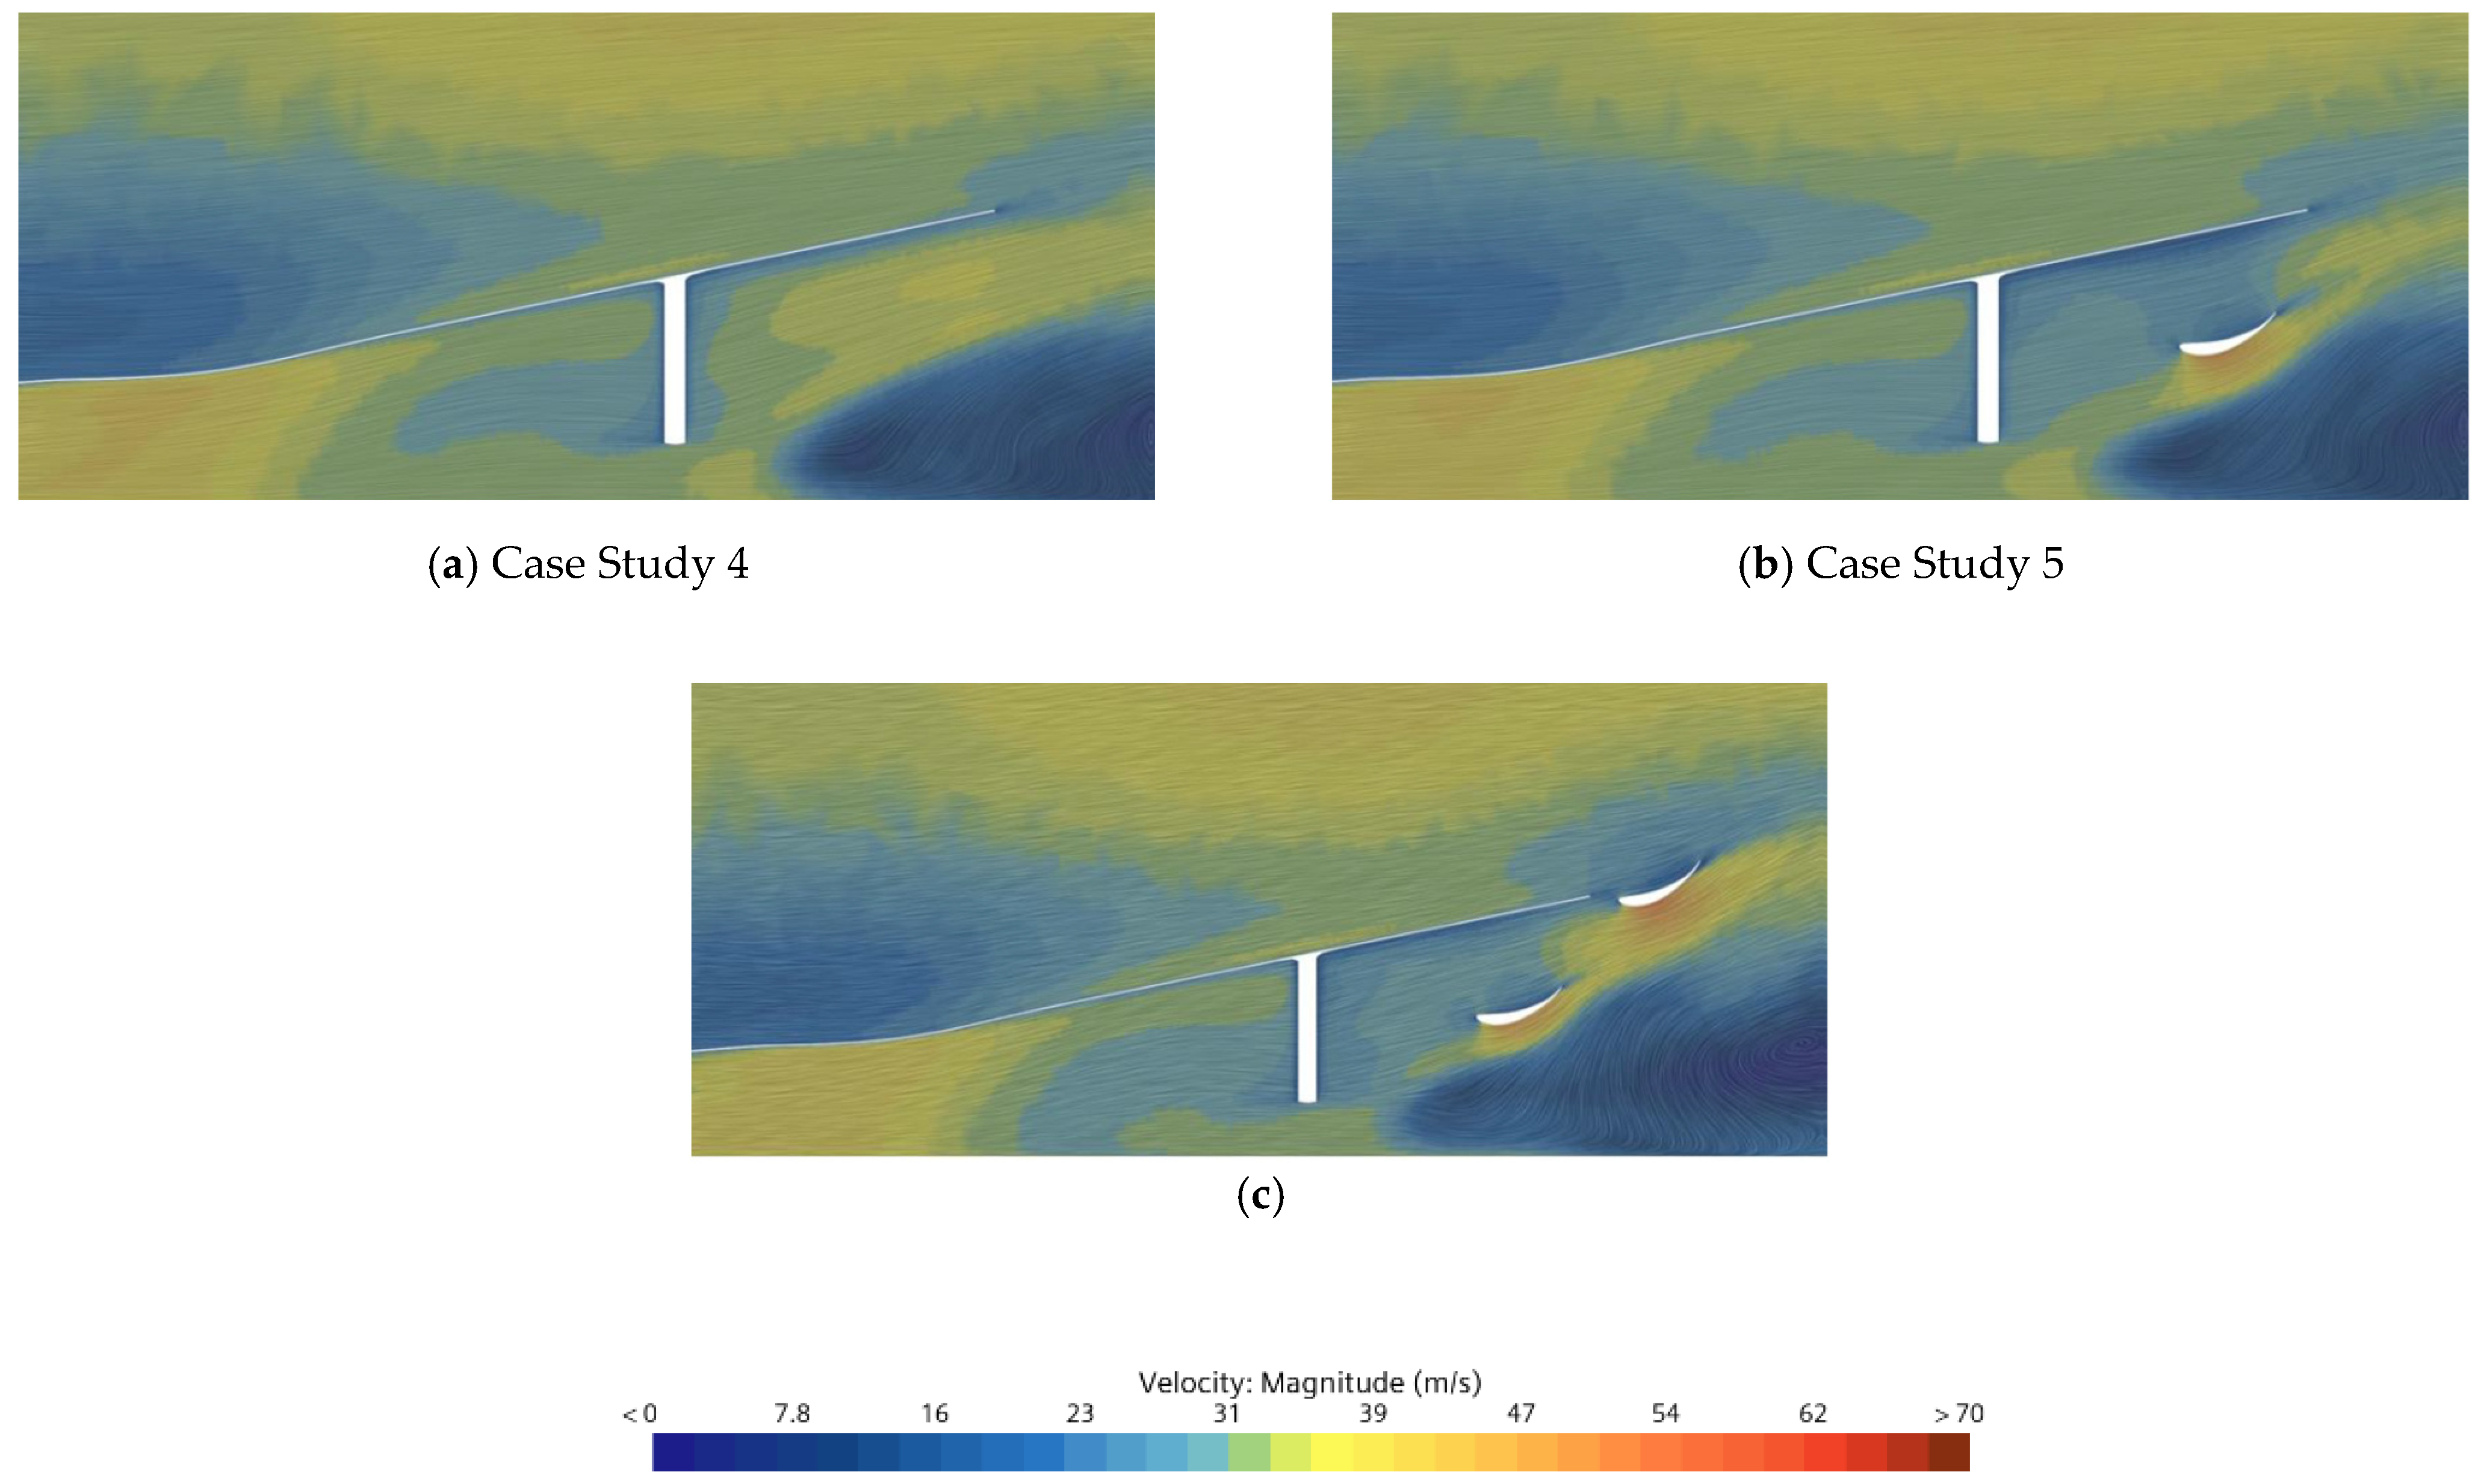
| CS-4 | Combination of lateral vanes beneath the diffuser section (Figure 4b). | ||
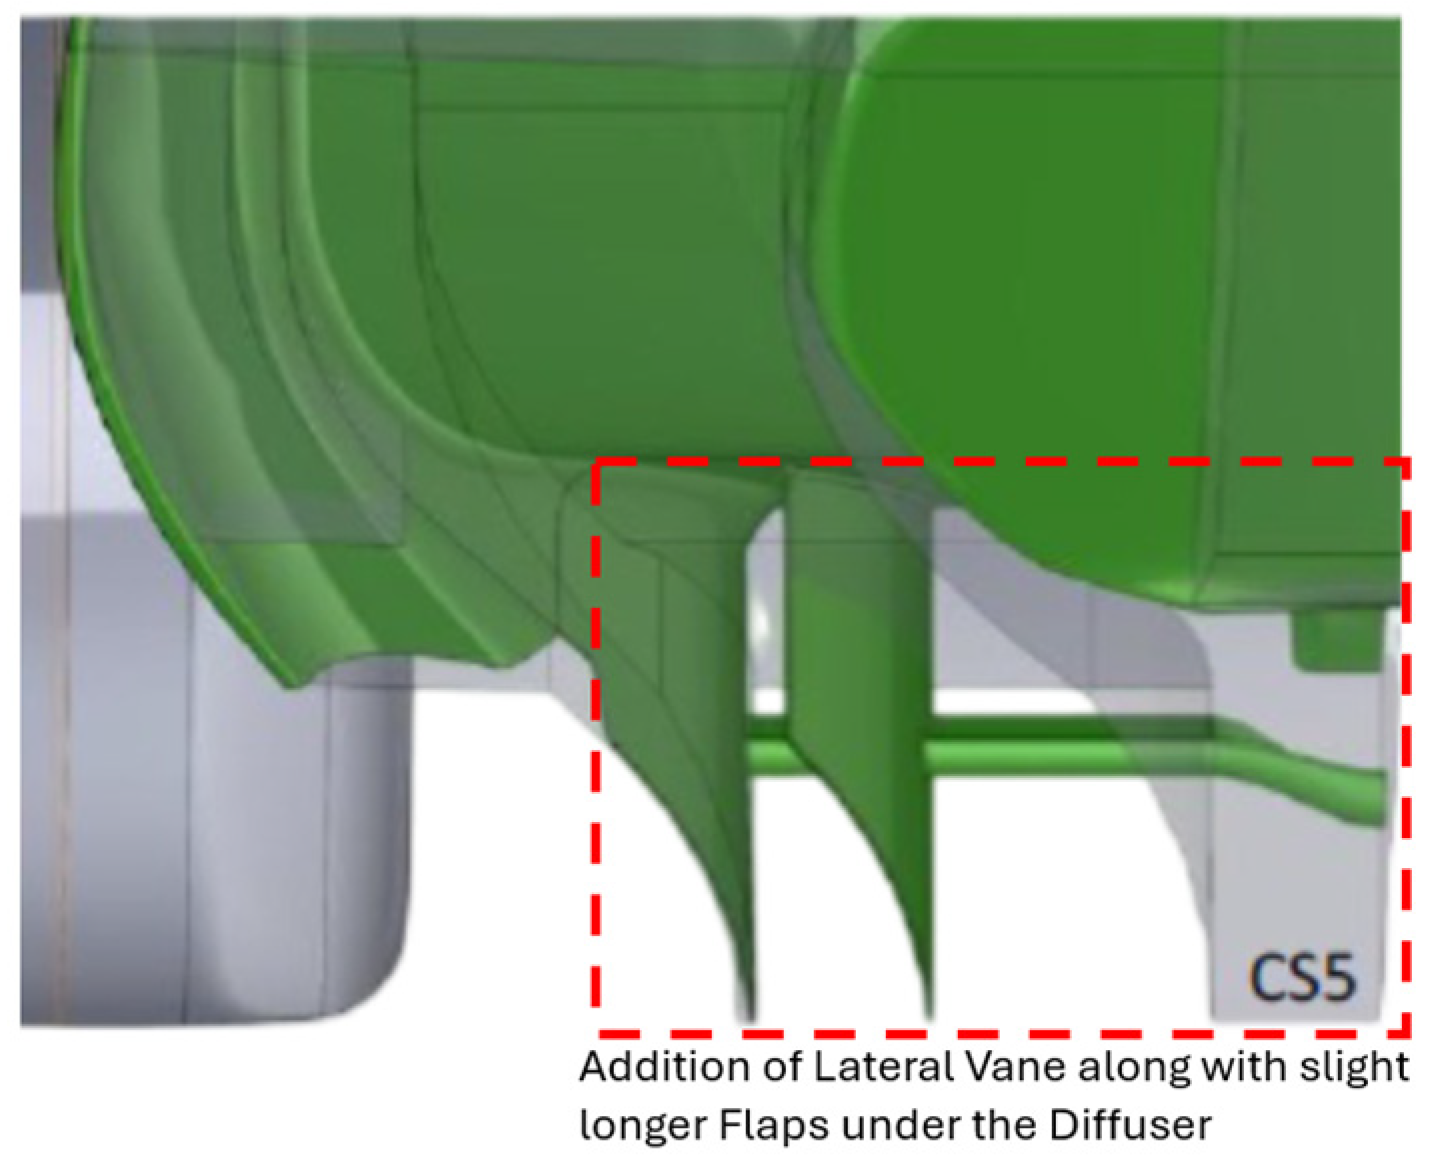
| CS-5 | Addition of lateral vanes with slightly longer flaps beneath the diffuser section (Figure 5)—(CS-1 + CS-3). | ||
| CS-6 | Optimal combination from CS-4 and CS-5, incorporating flaps at the rear end of the diffuser section (CS-4 + CS-5 + CS-2). | ||

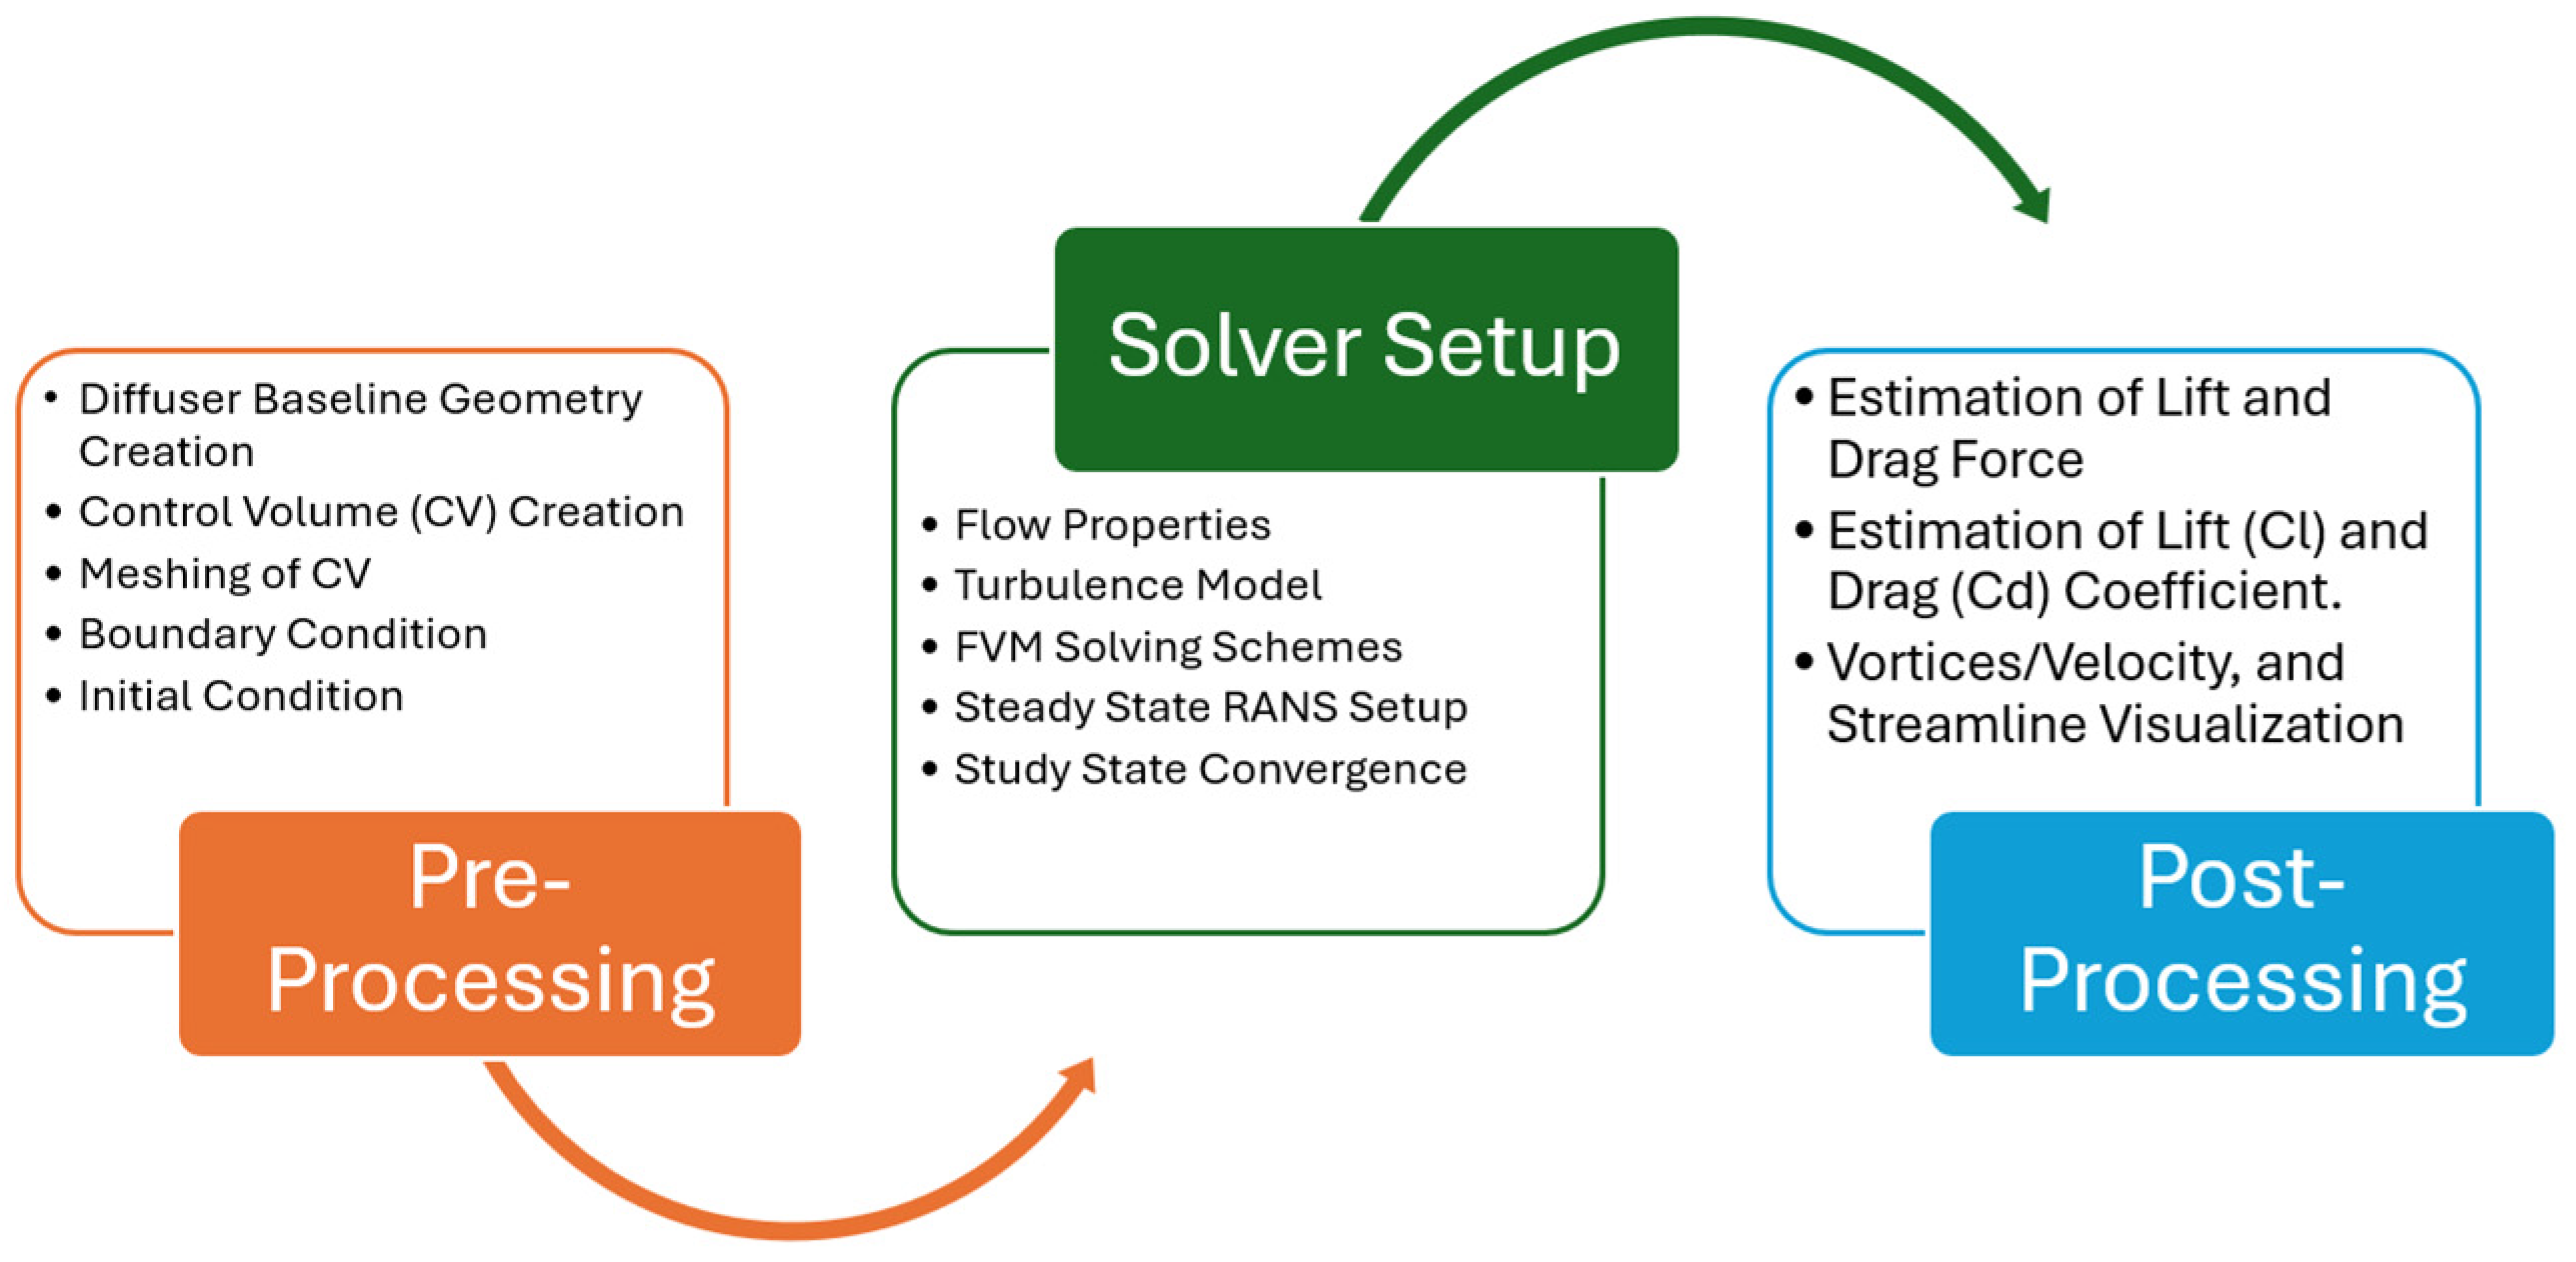
2.4. CFD Methodology
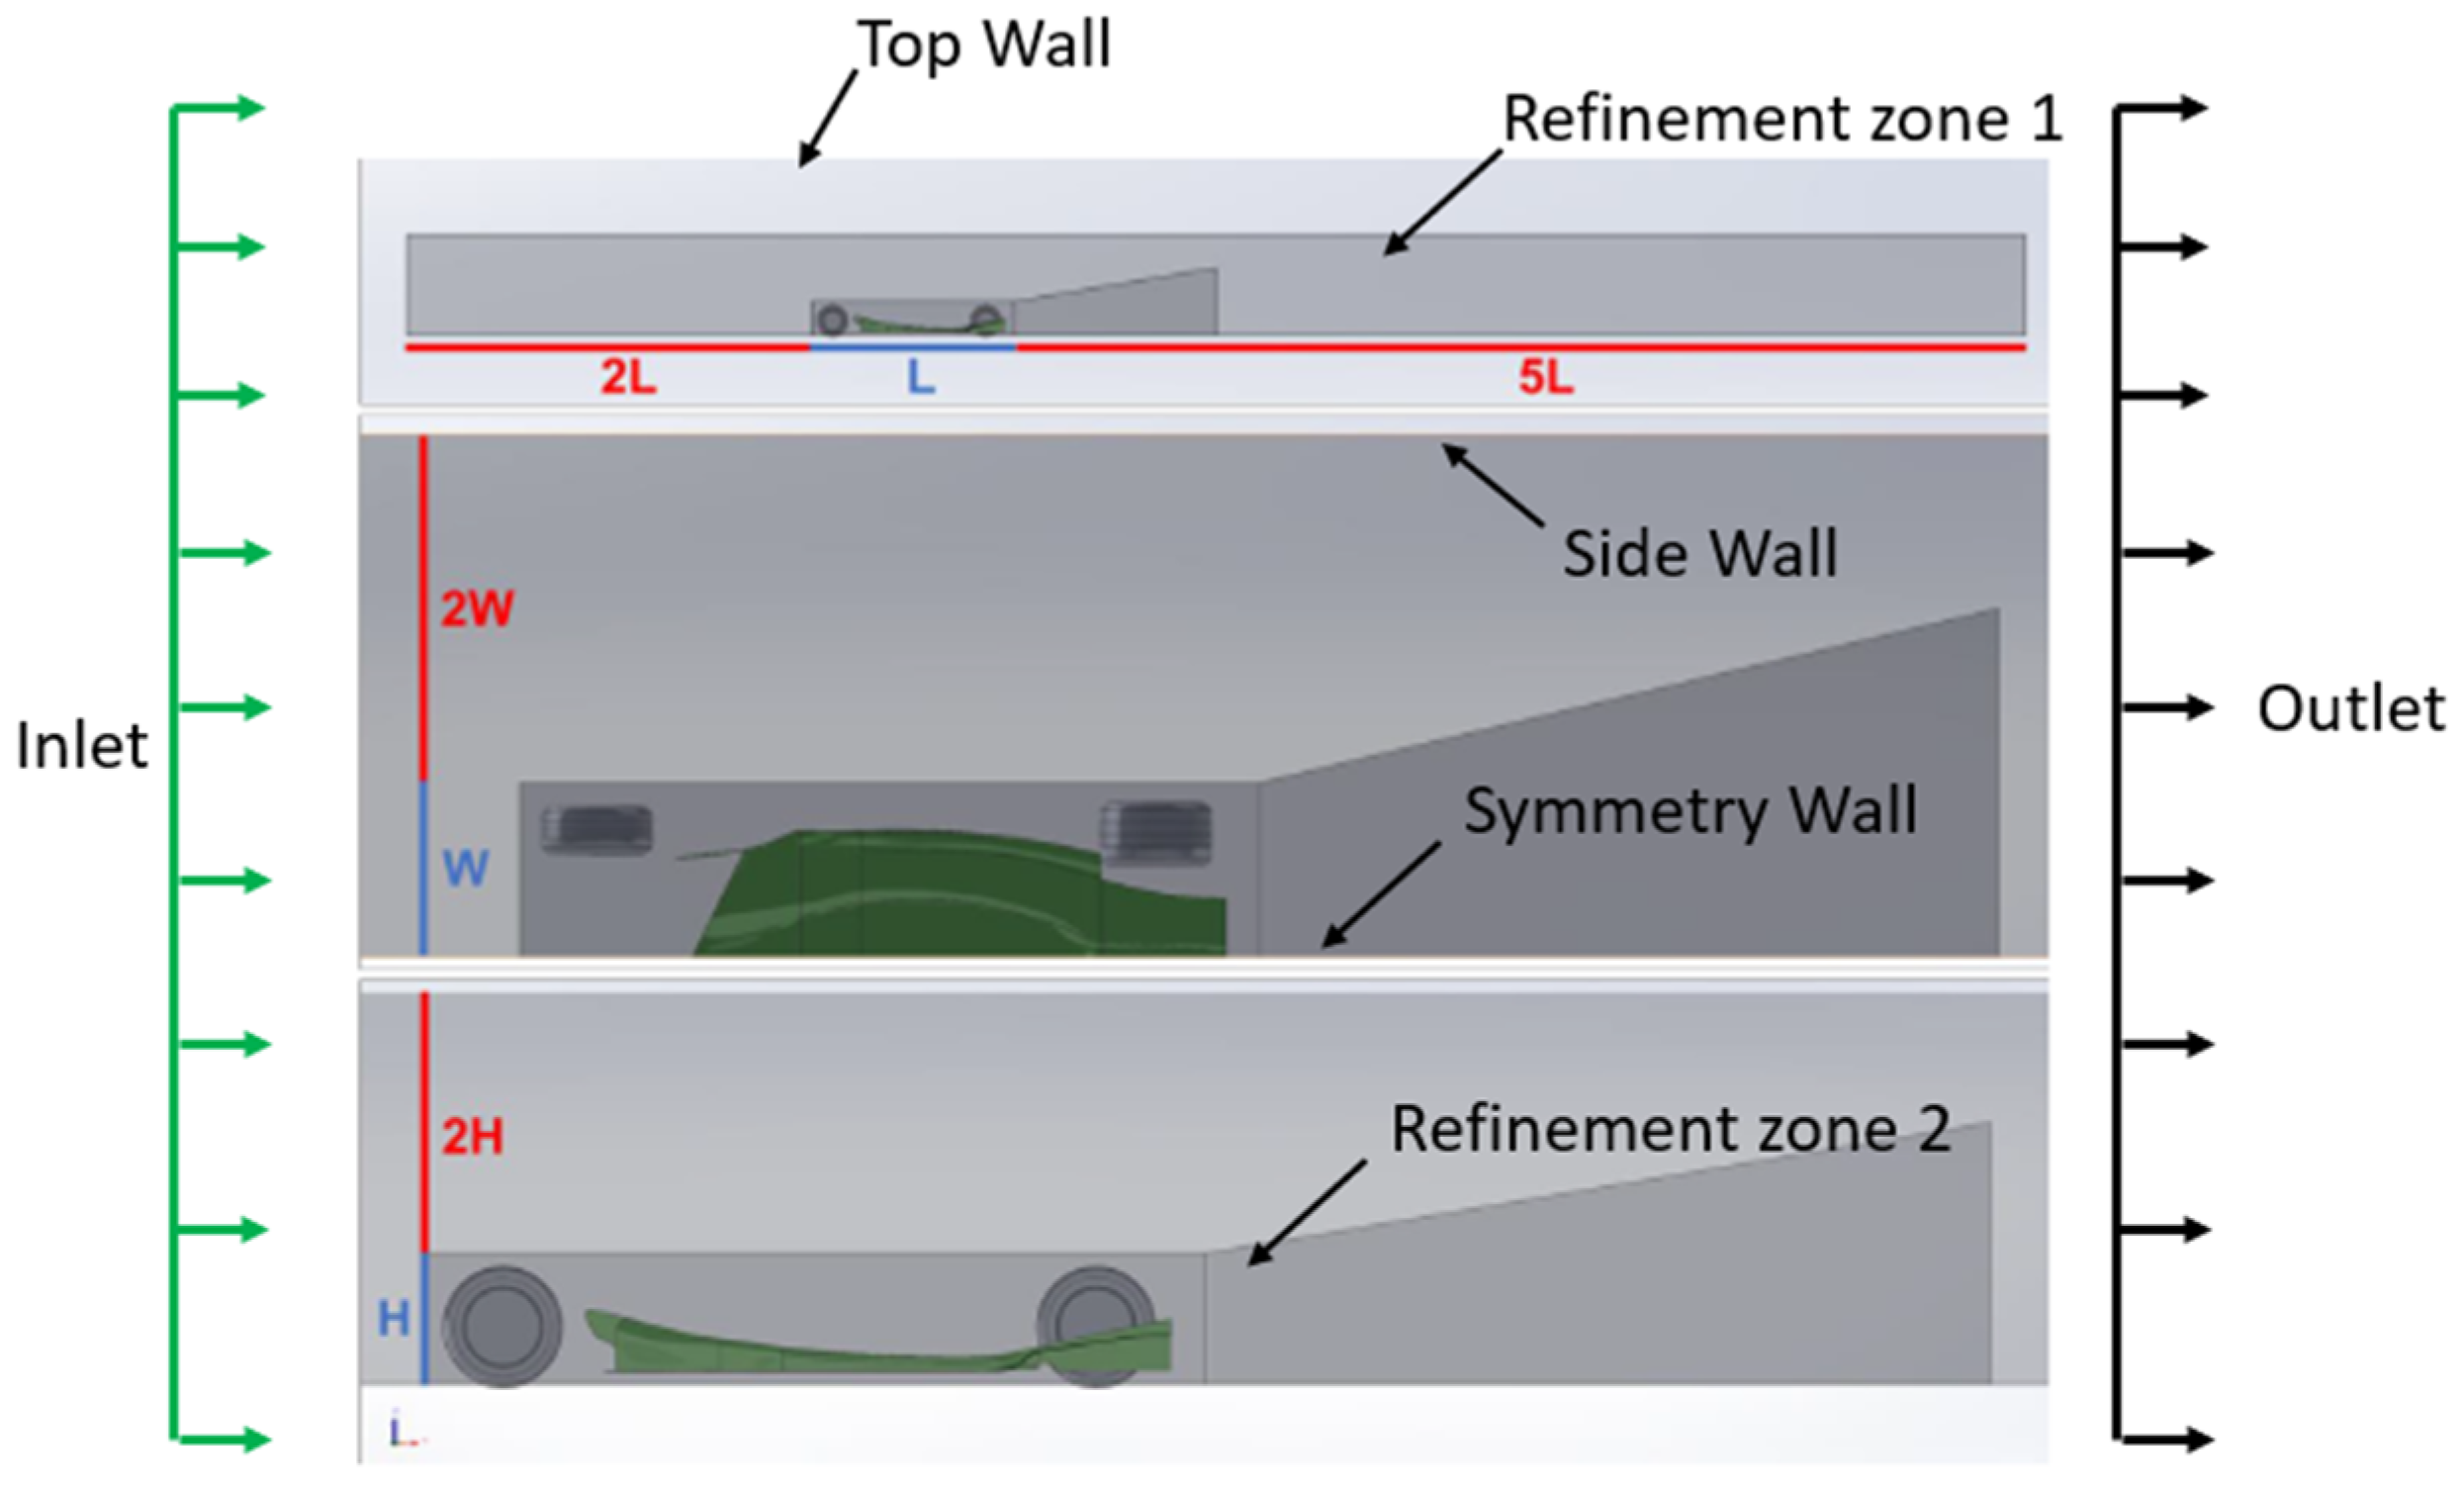
2.4.1. Computational Domain Creation
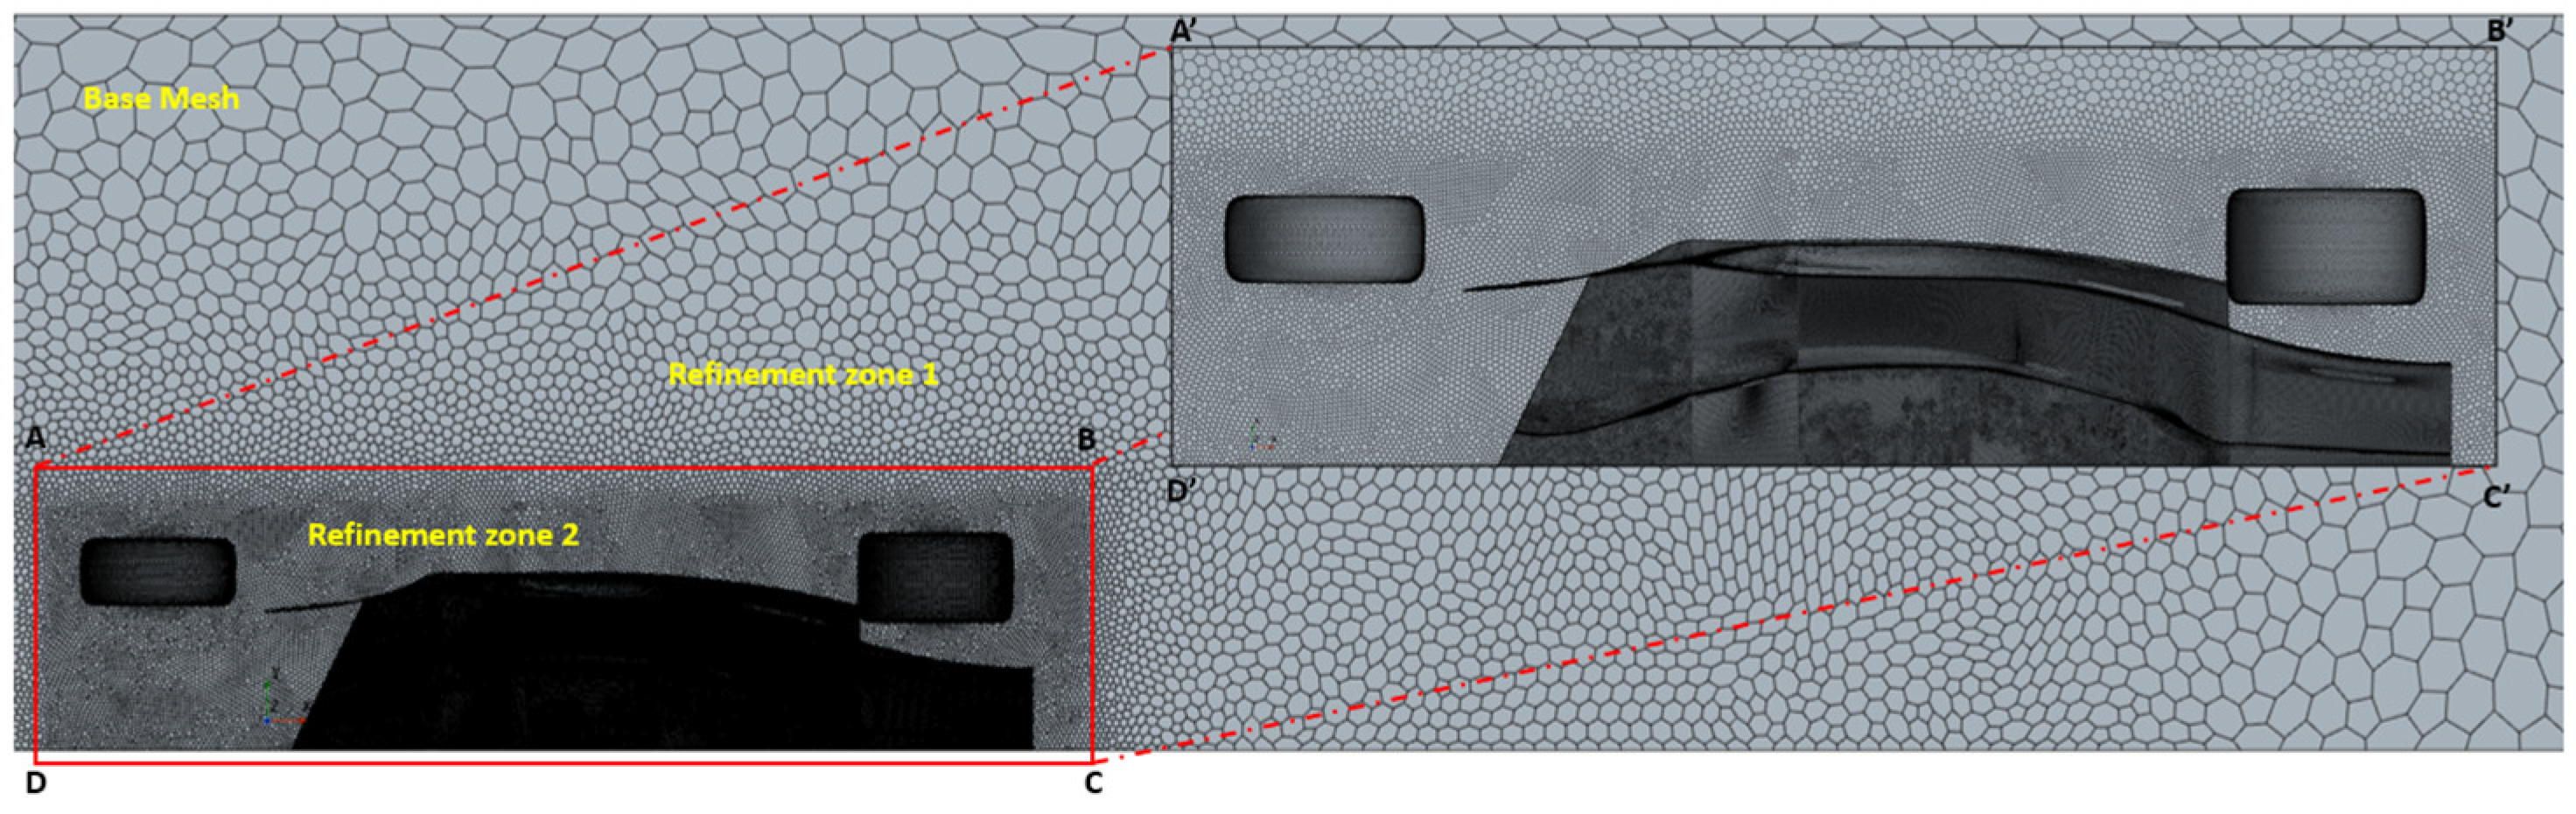
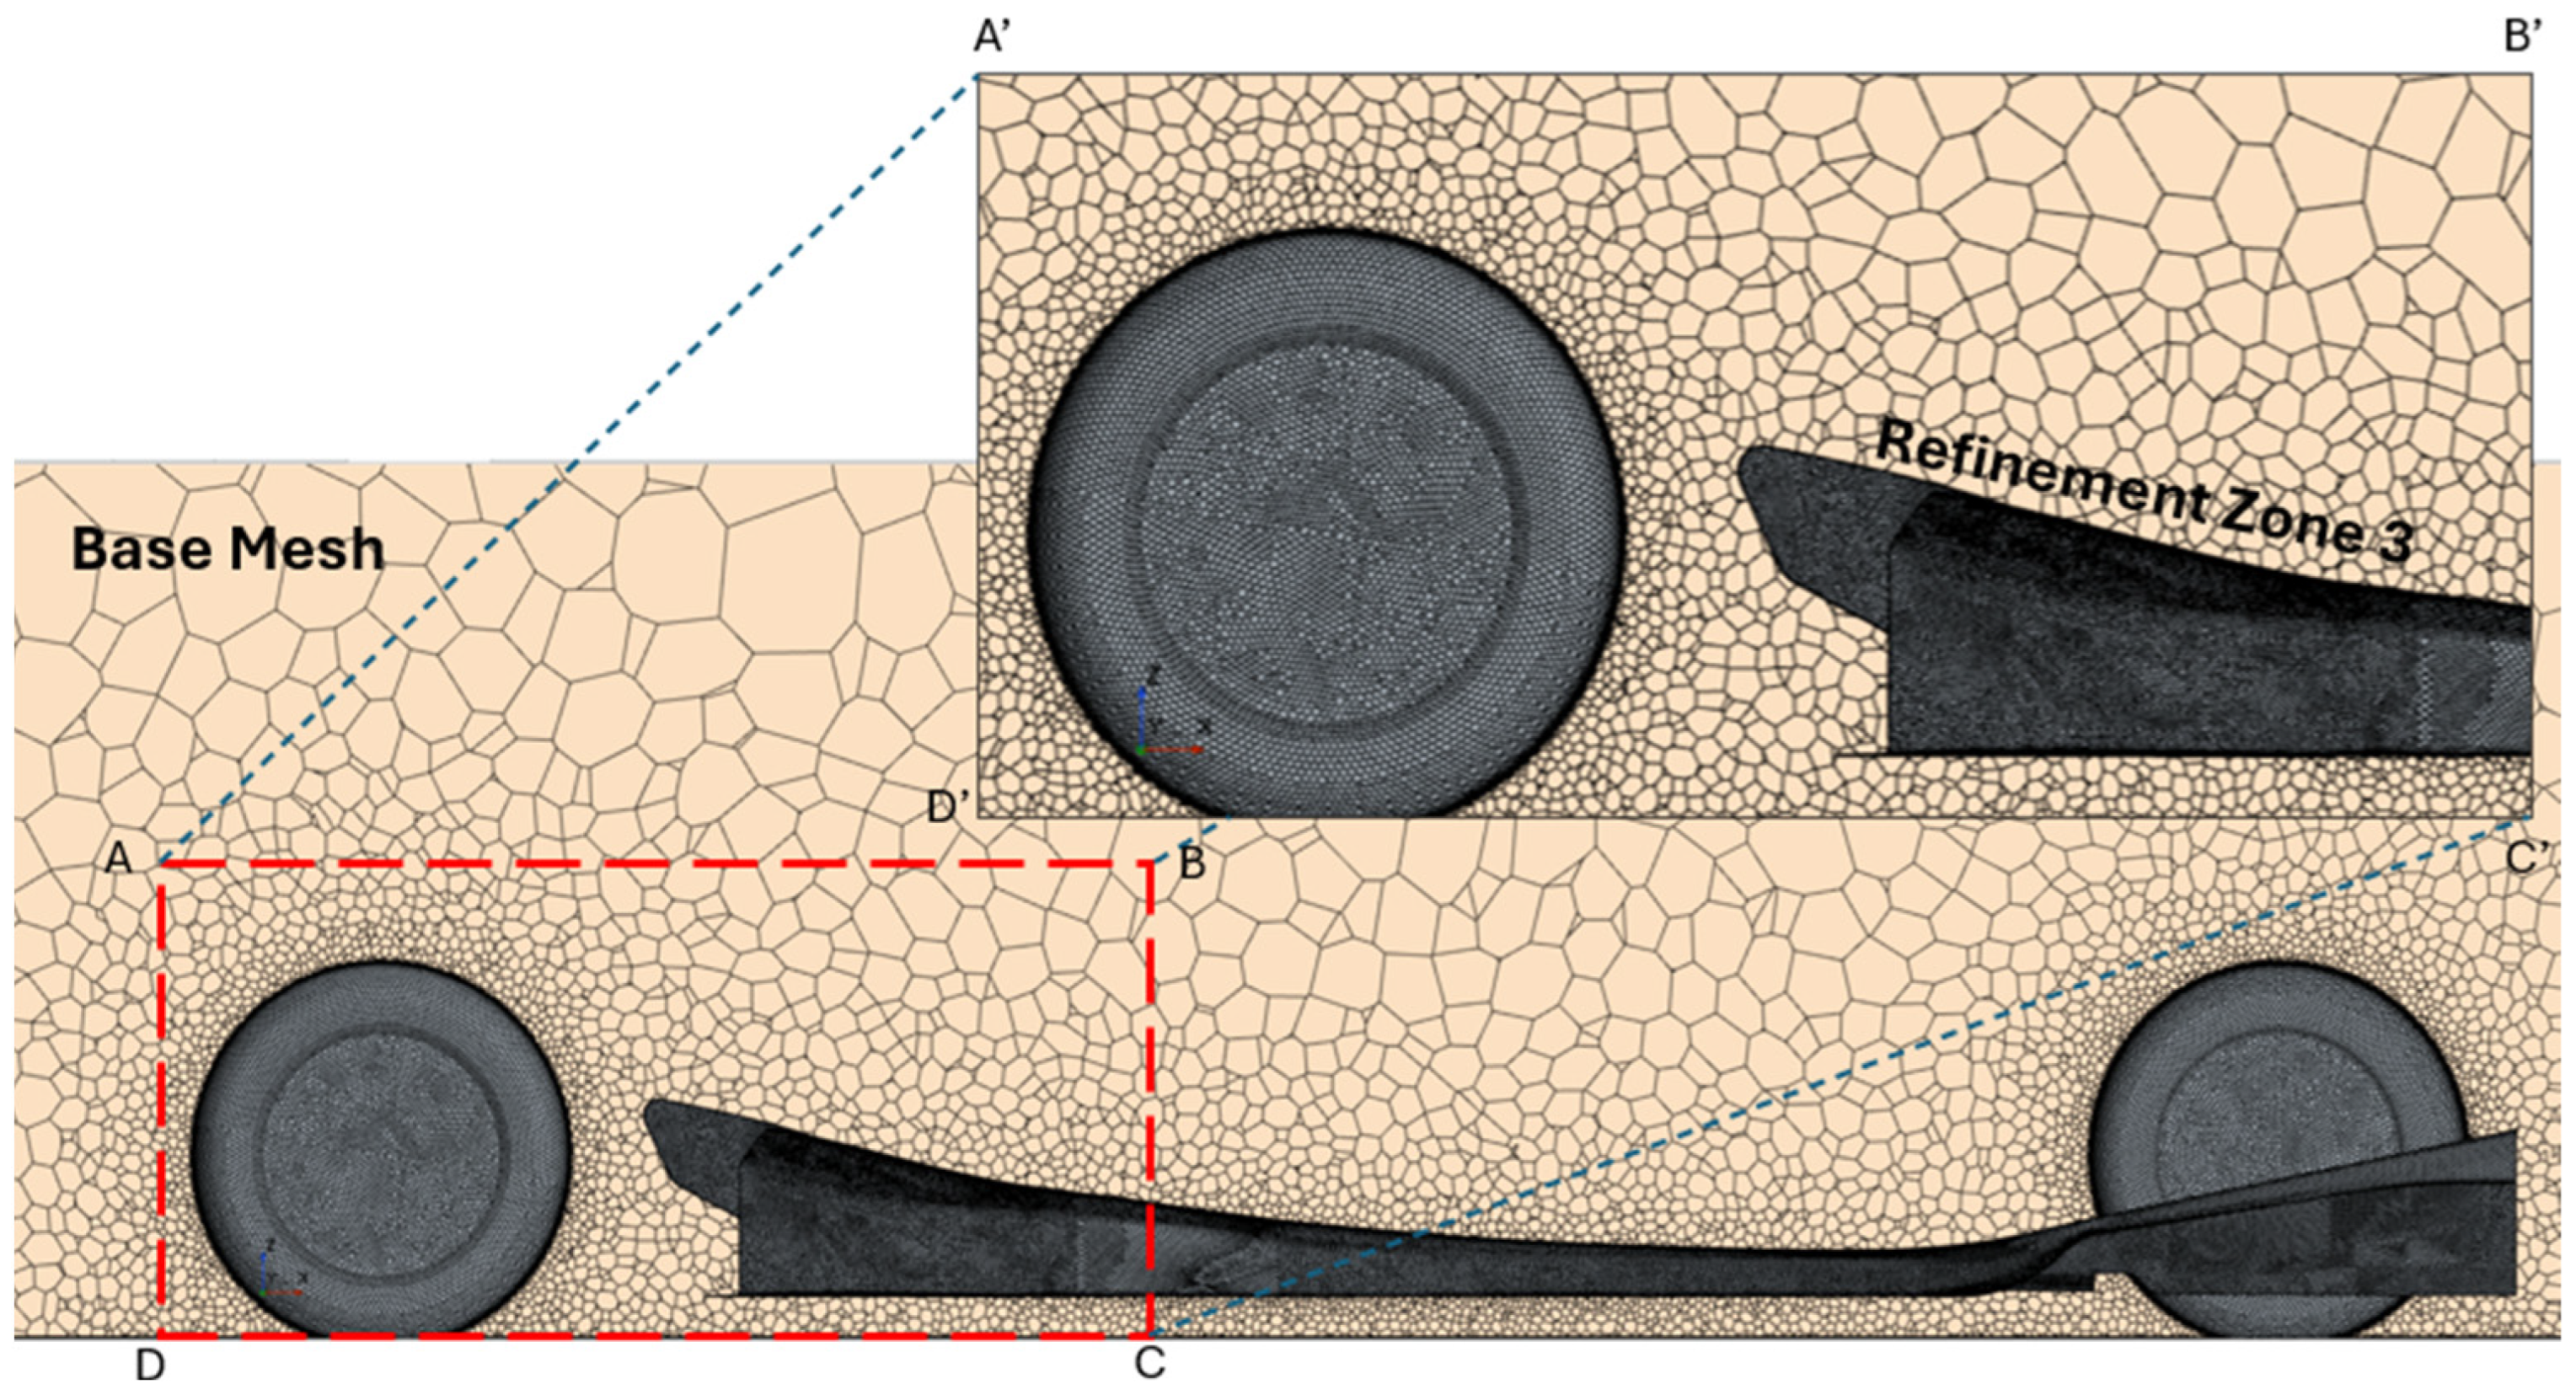
2.4.2. Meshing
2.4.3. Initial and Boundary Conditions
2.4.4. Turbulent Solver and Solving Schemes
3. Results
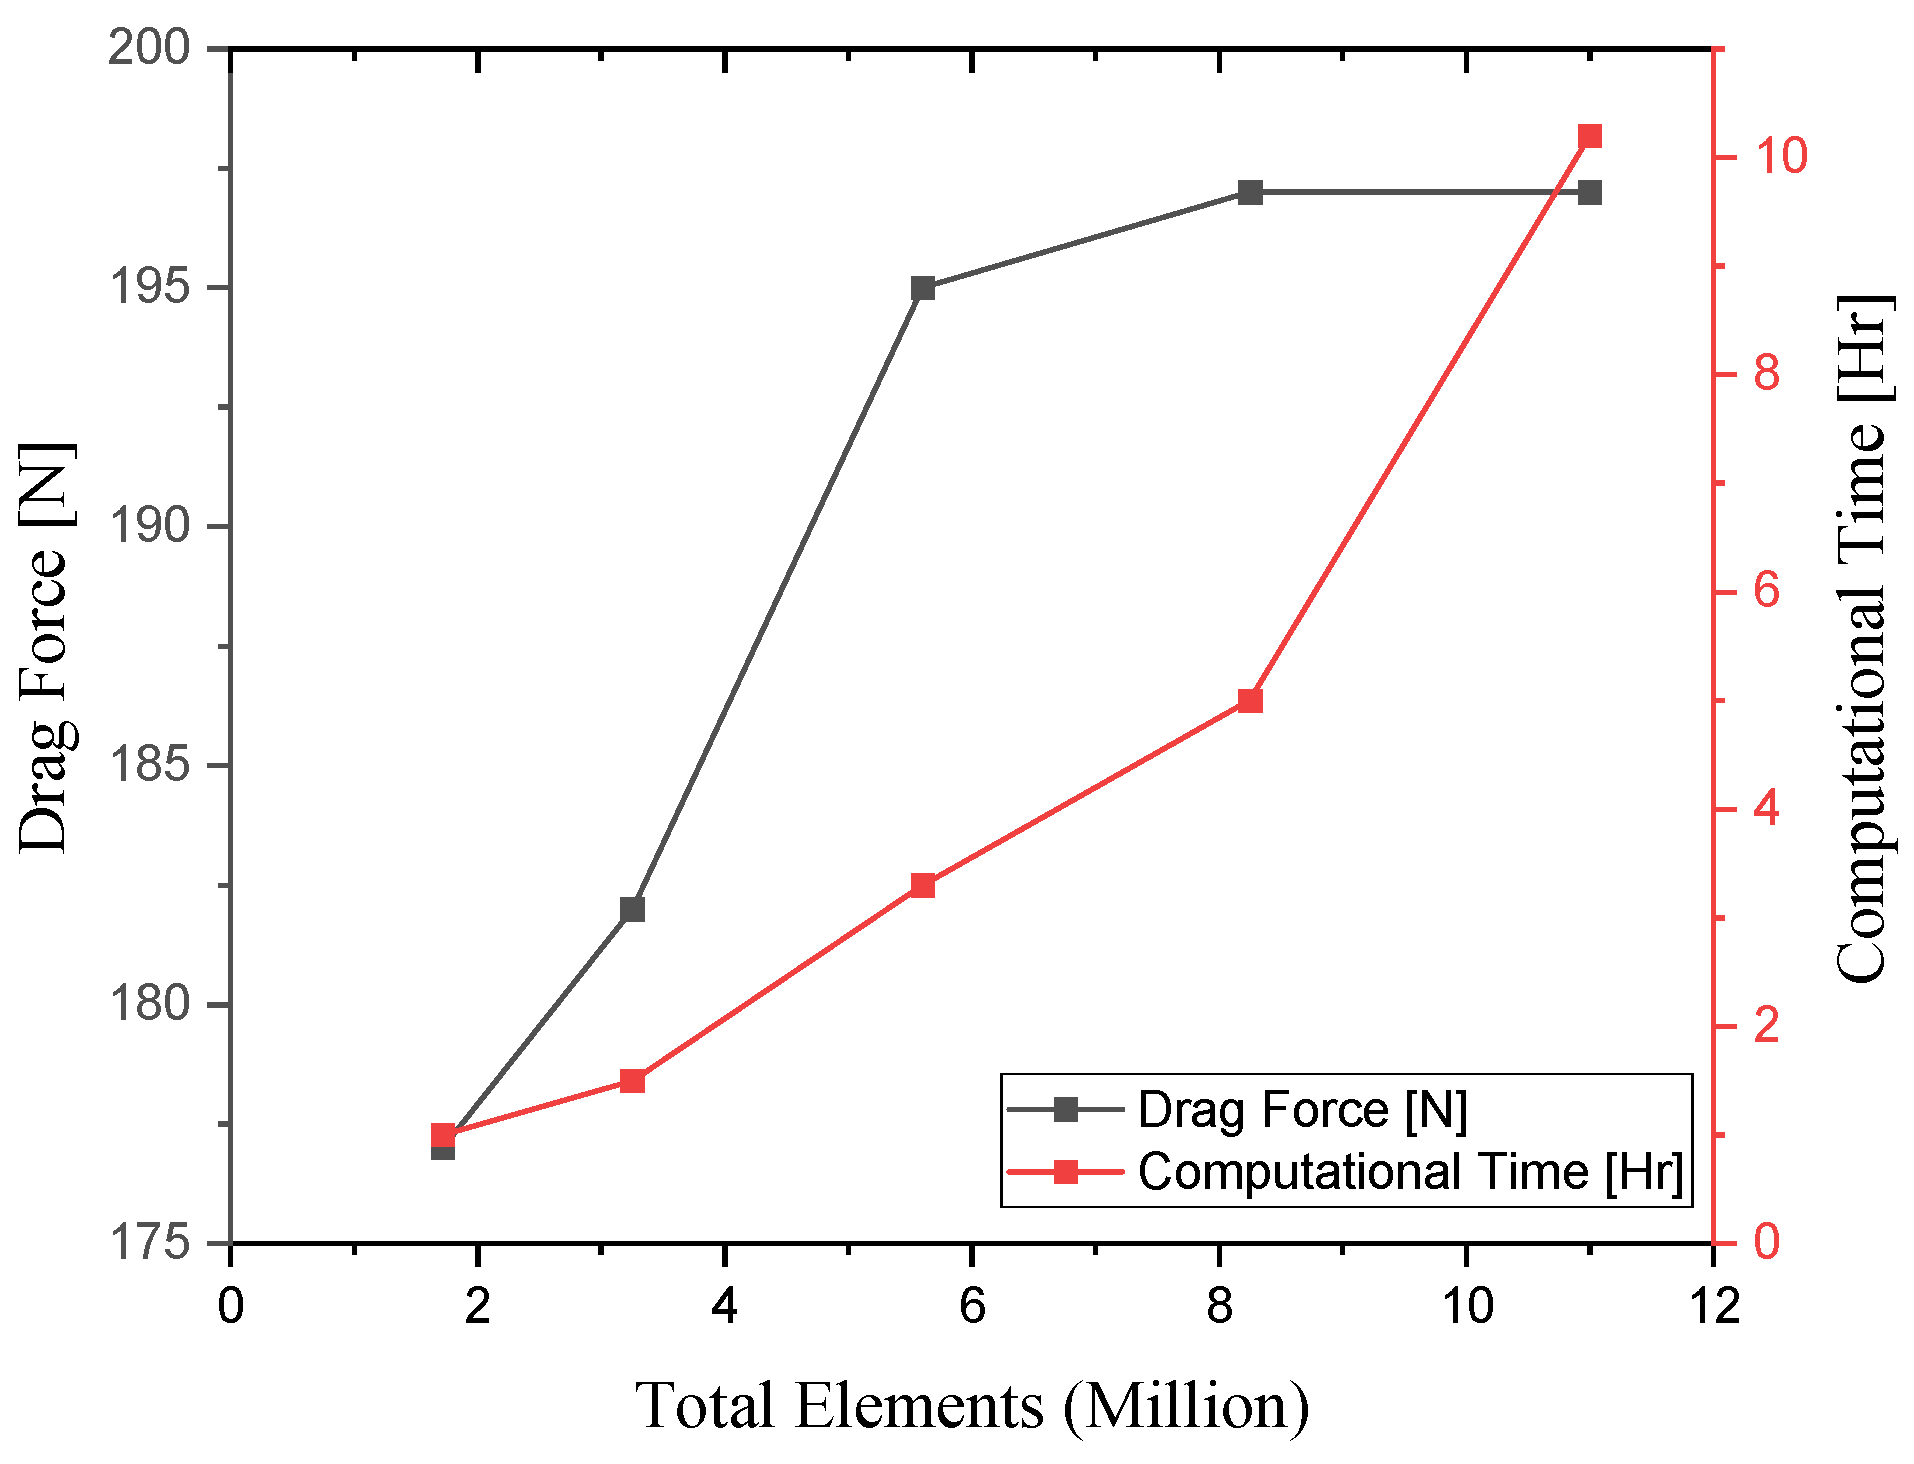
3.1. Mesh Sensitivity Study
3.2. CFD Simulation Results
3.2.1. Case Study 1 (CS-1): Influence of Lateral Vanes on Aerodynamic Performance
3.2.2. Case Study 2 (CS-2): Influence of Varying End-Flap Height on Aerodynamic Performance
3.2.3. Case Study 3 (CS-3): Influence of Adding Flap Underneath the Diffuser
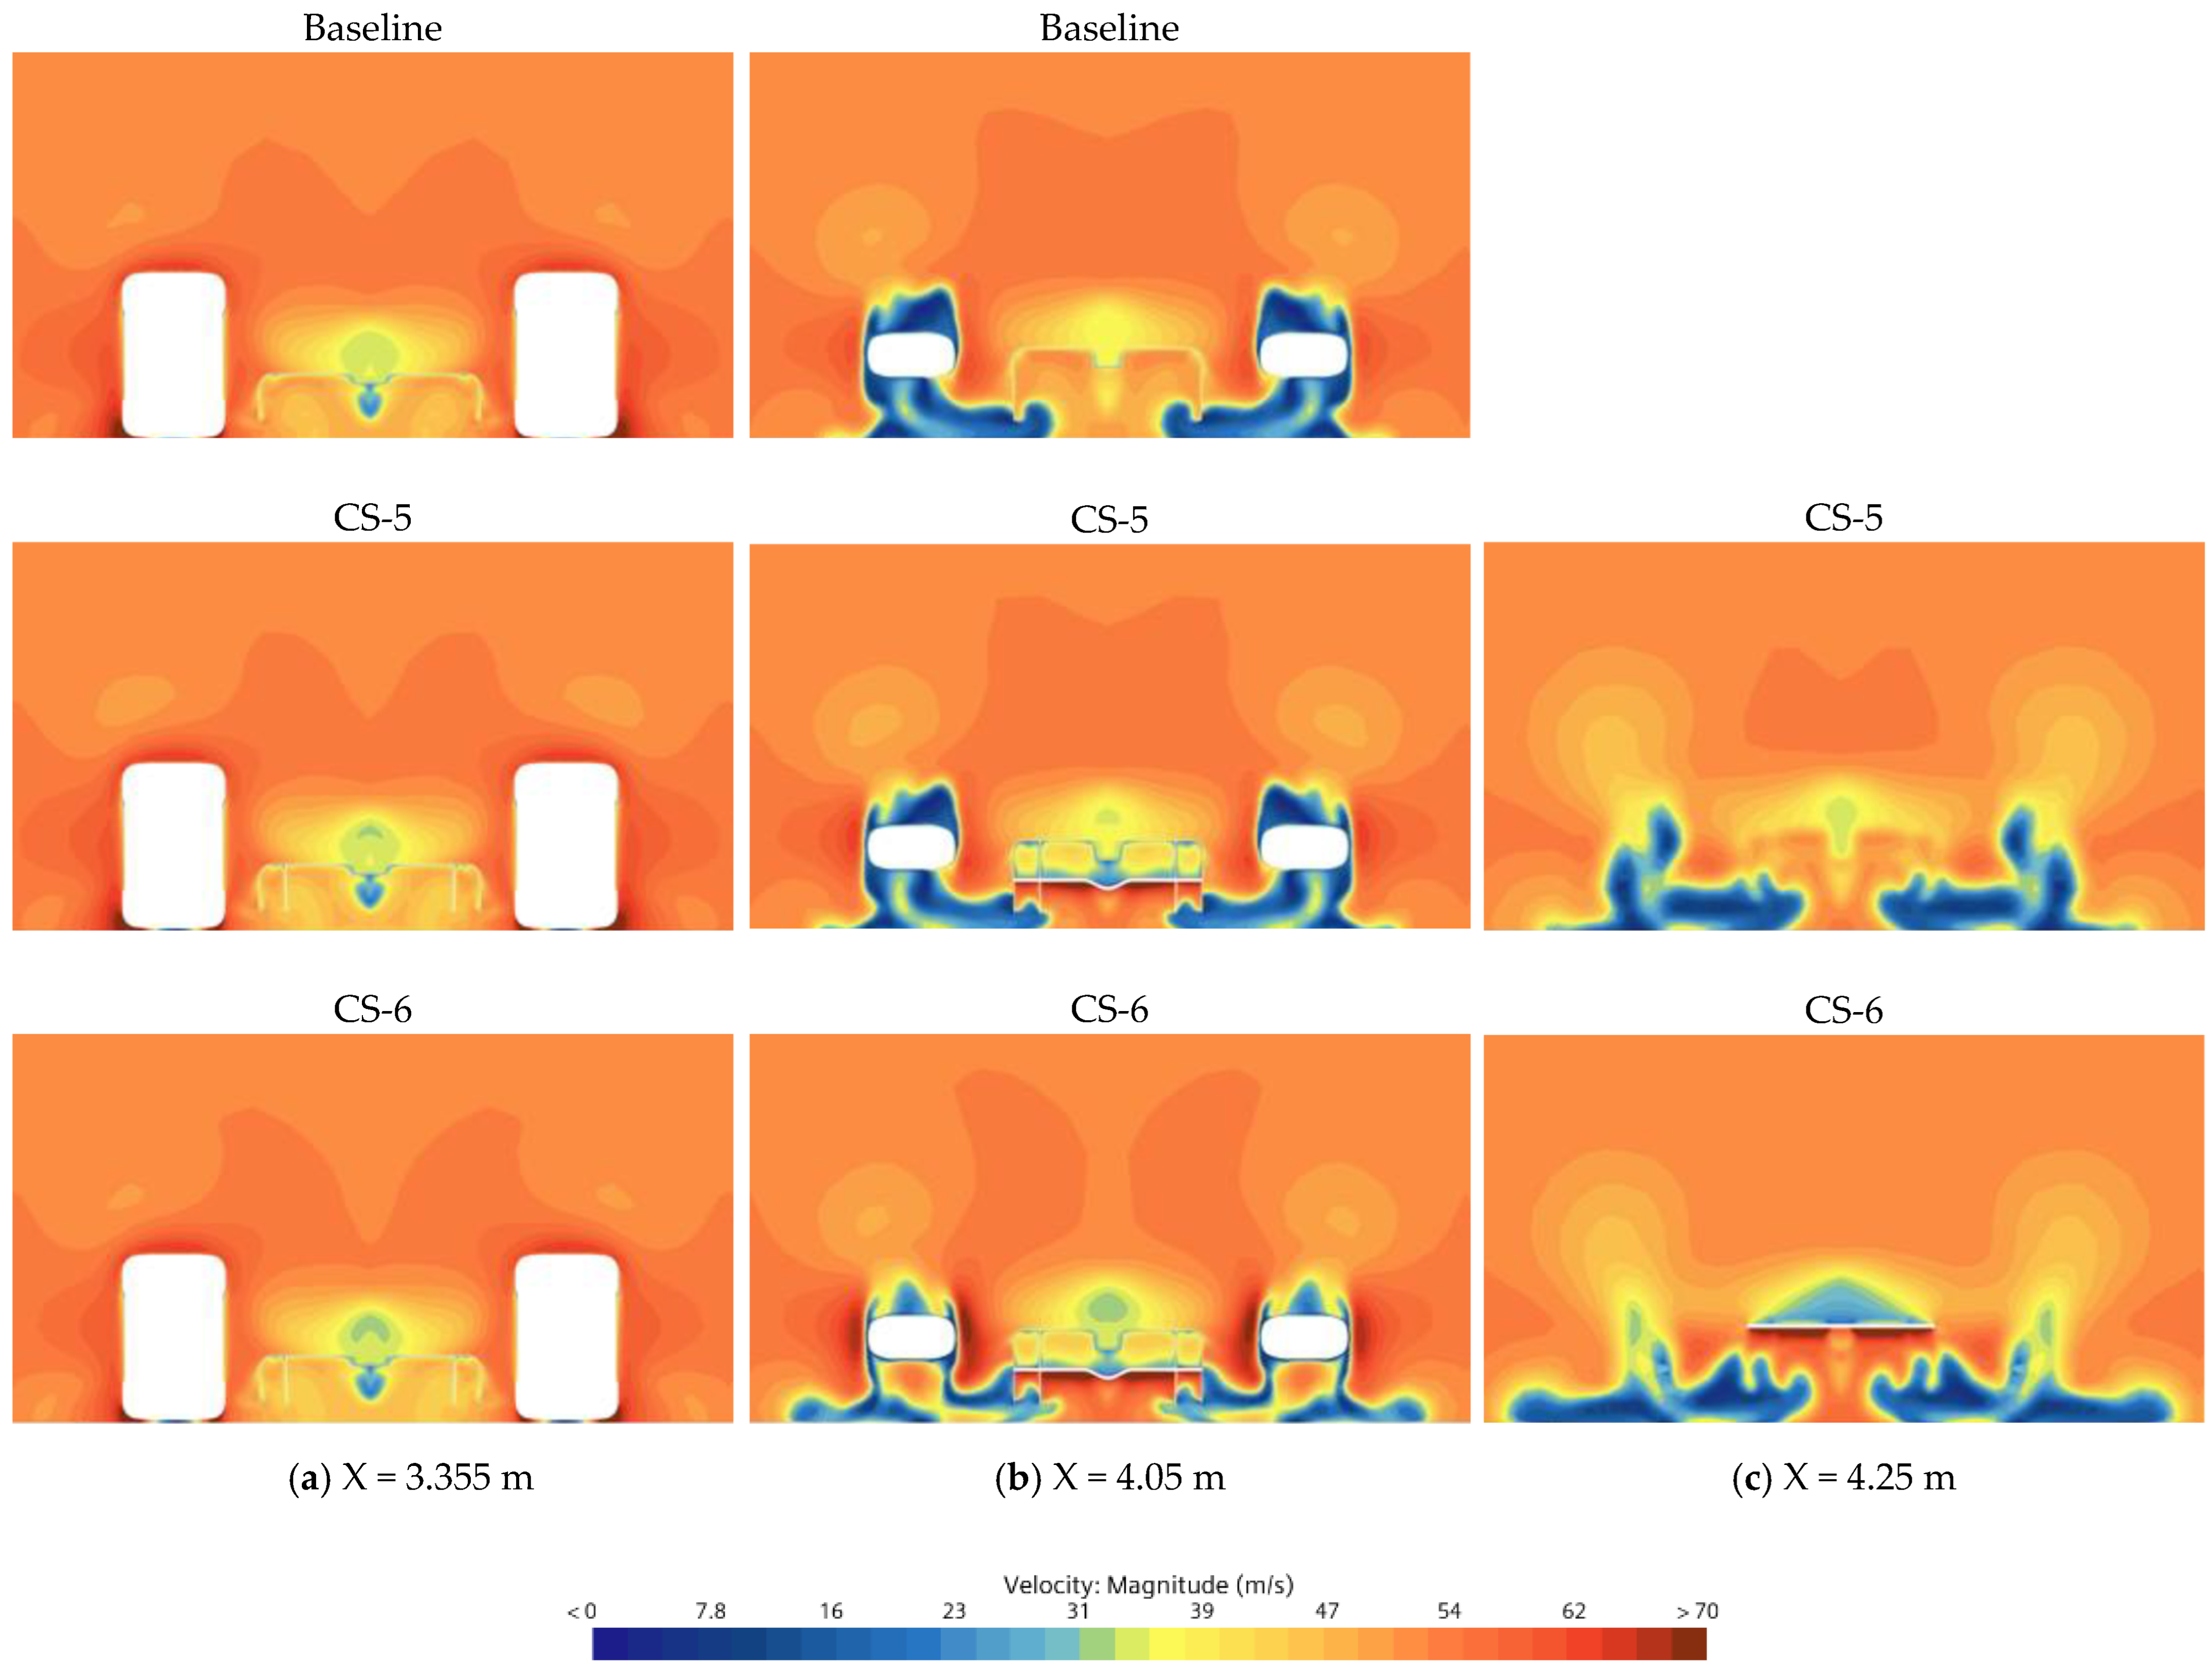
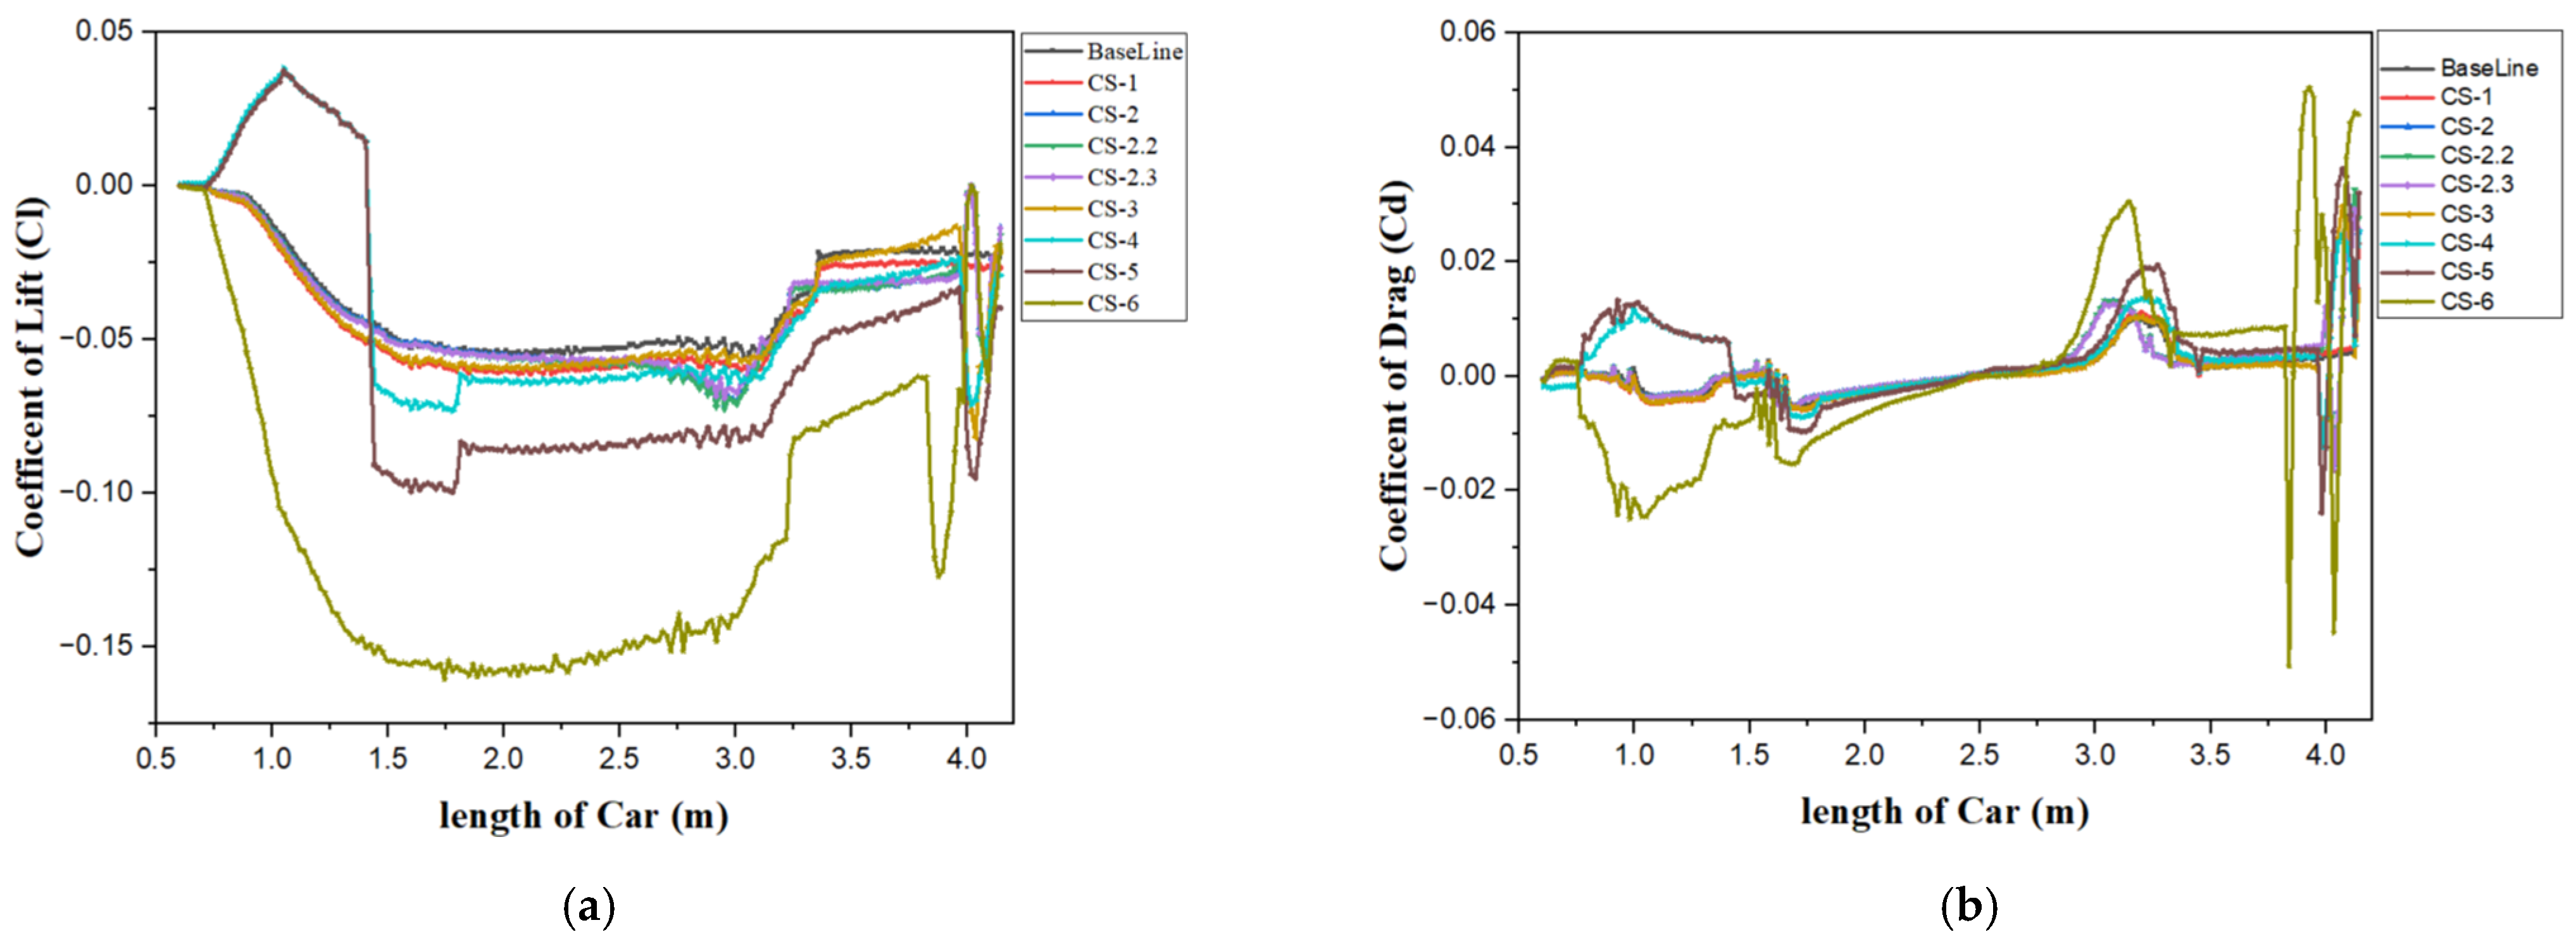
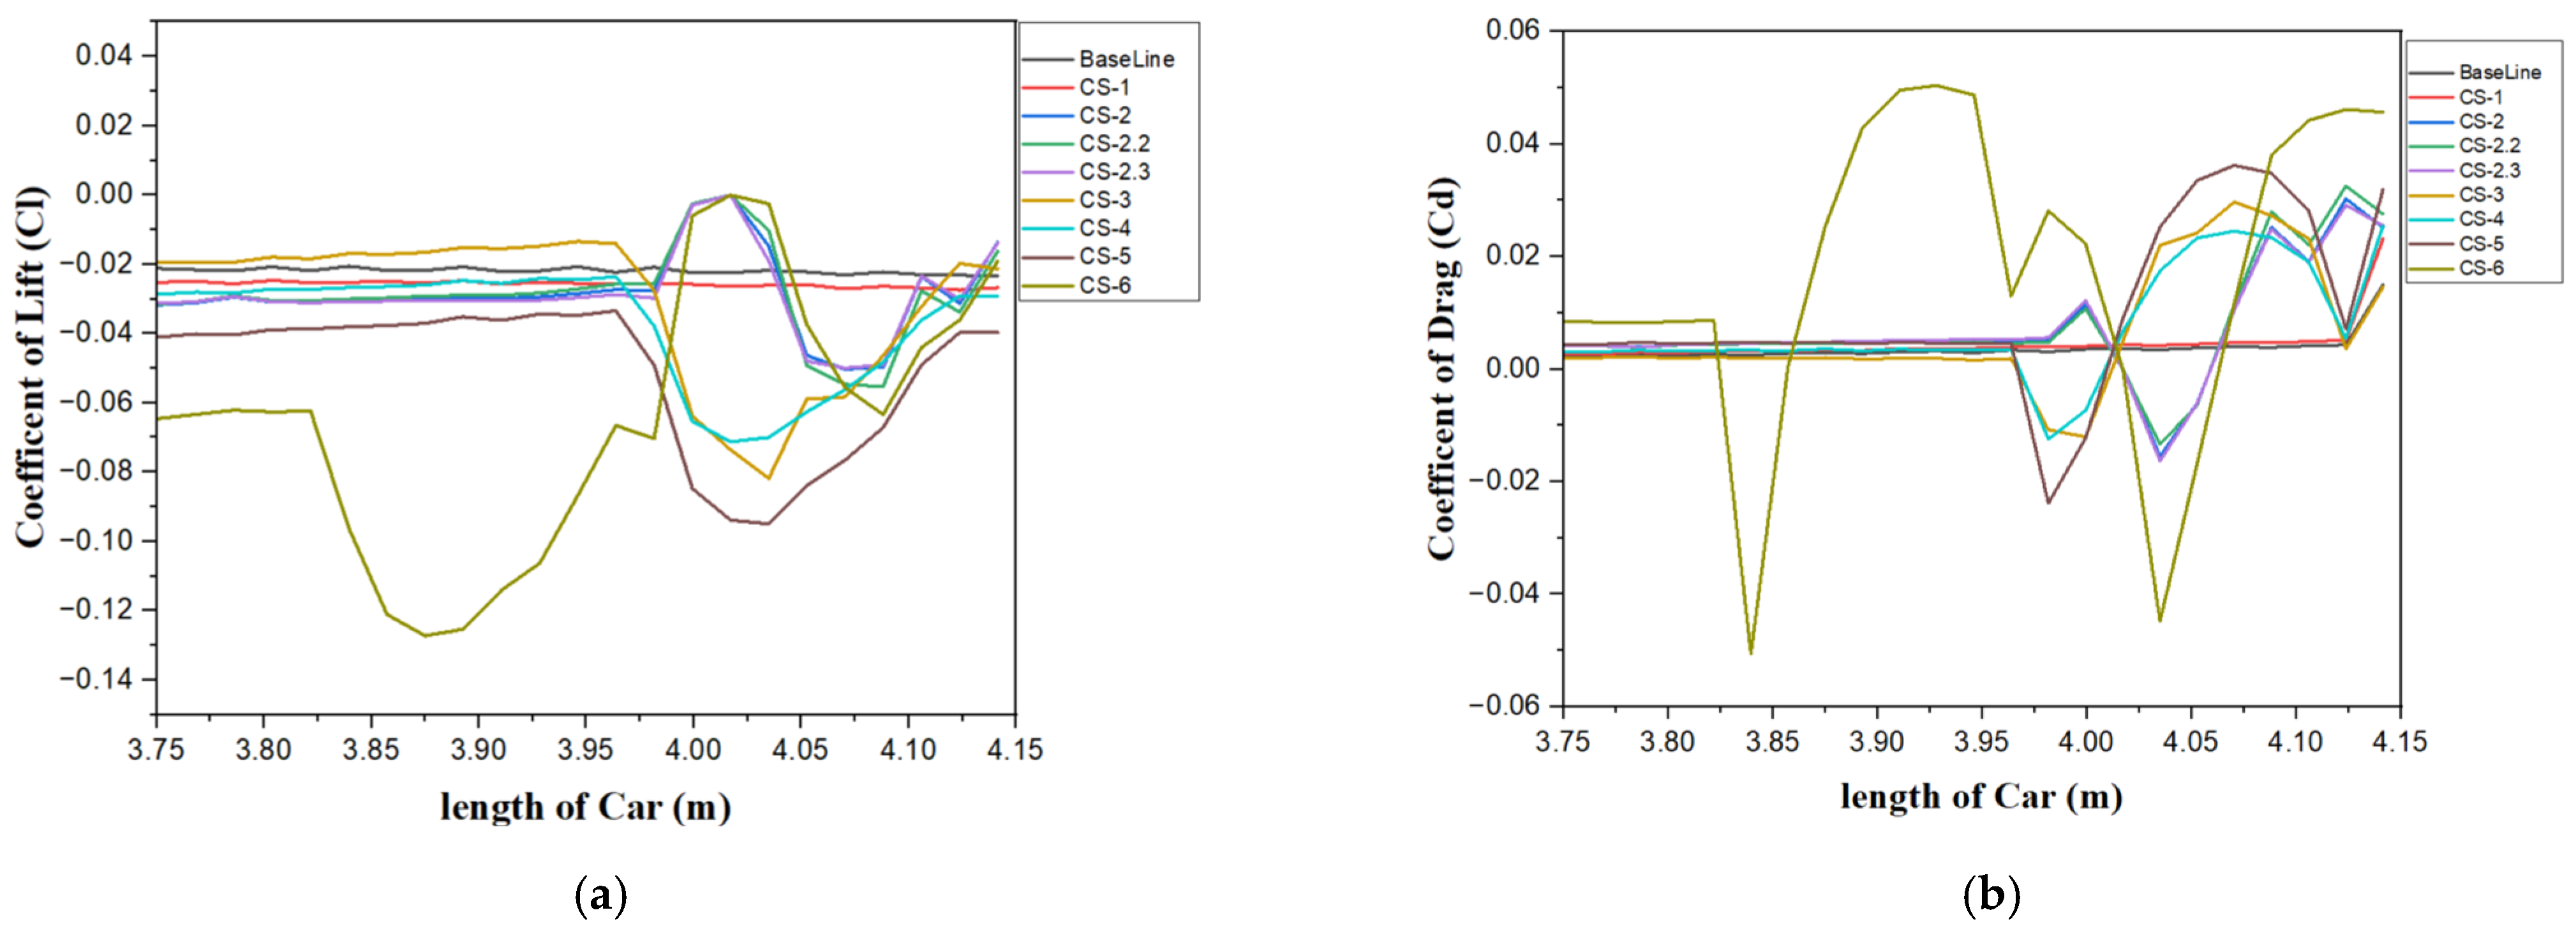
3.2.4. Case Study 4, 5, and 6 (CS-4, 5, 6): Influence on Performance on Adding Additional Structural Member Spontaneously
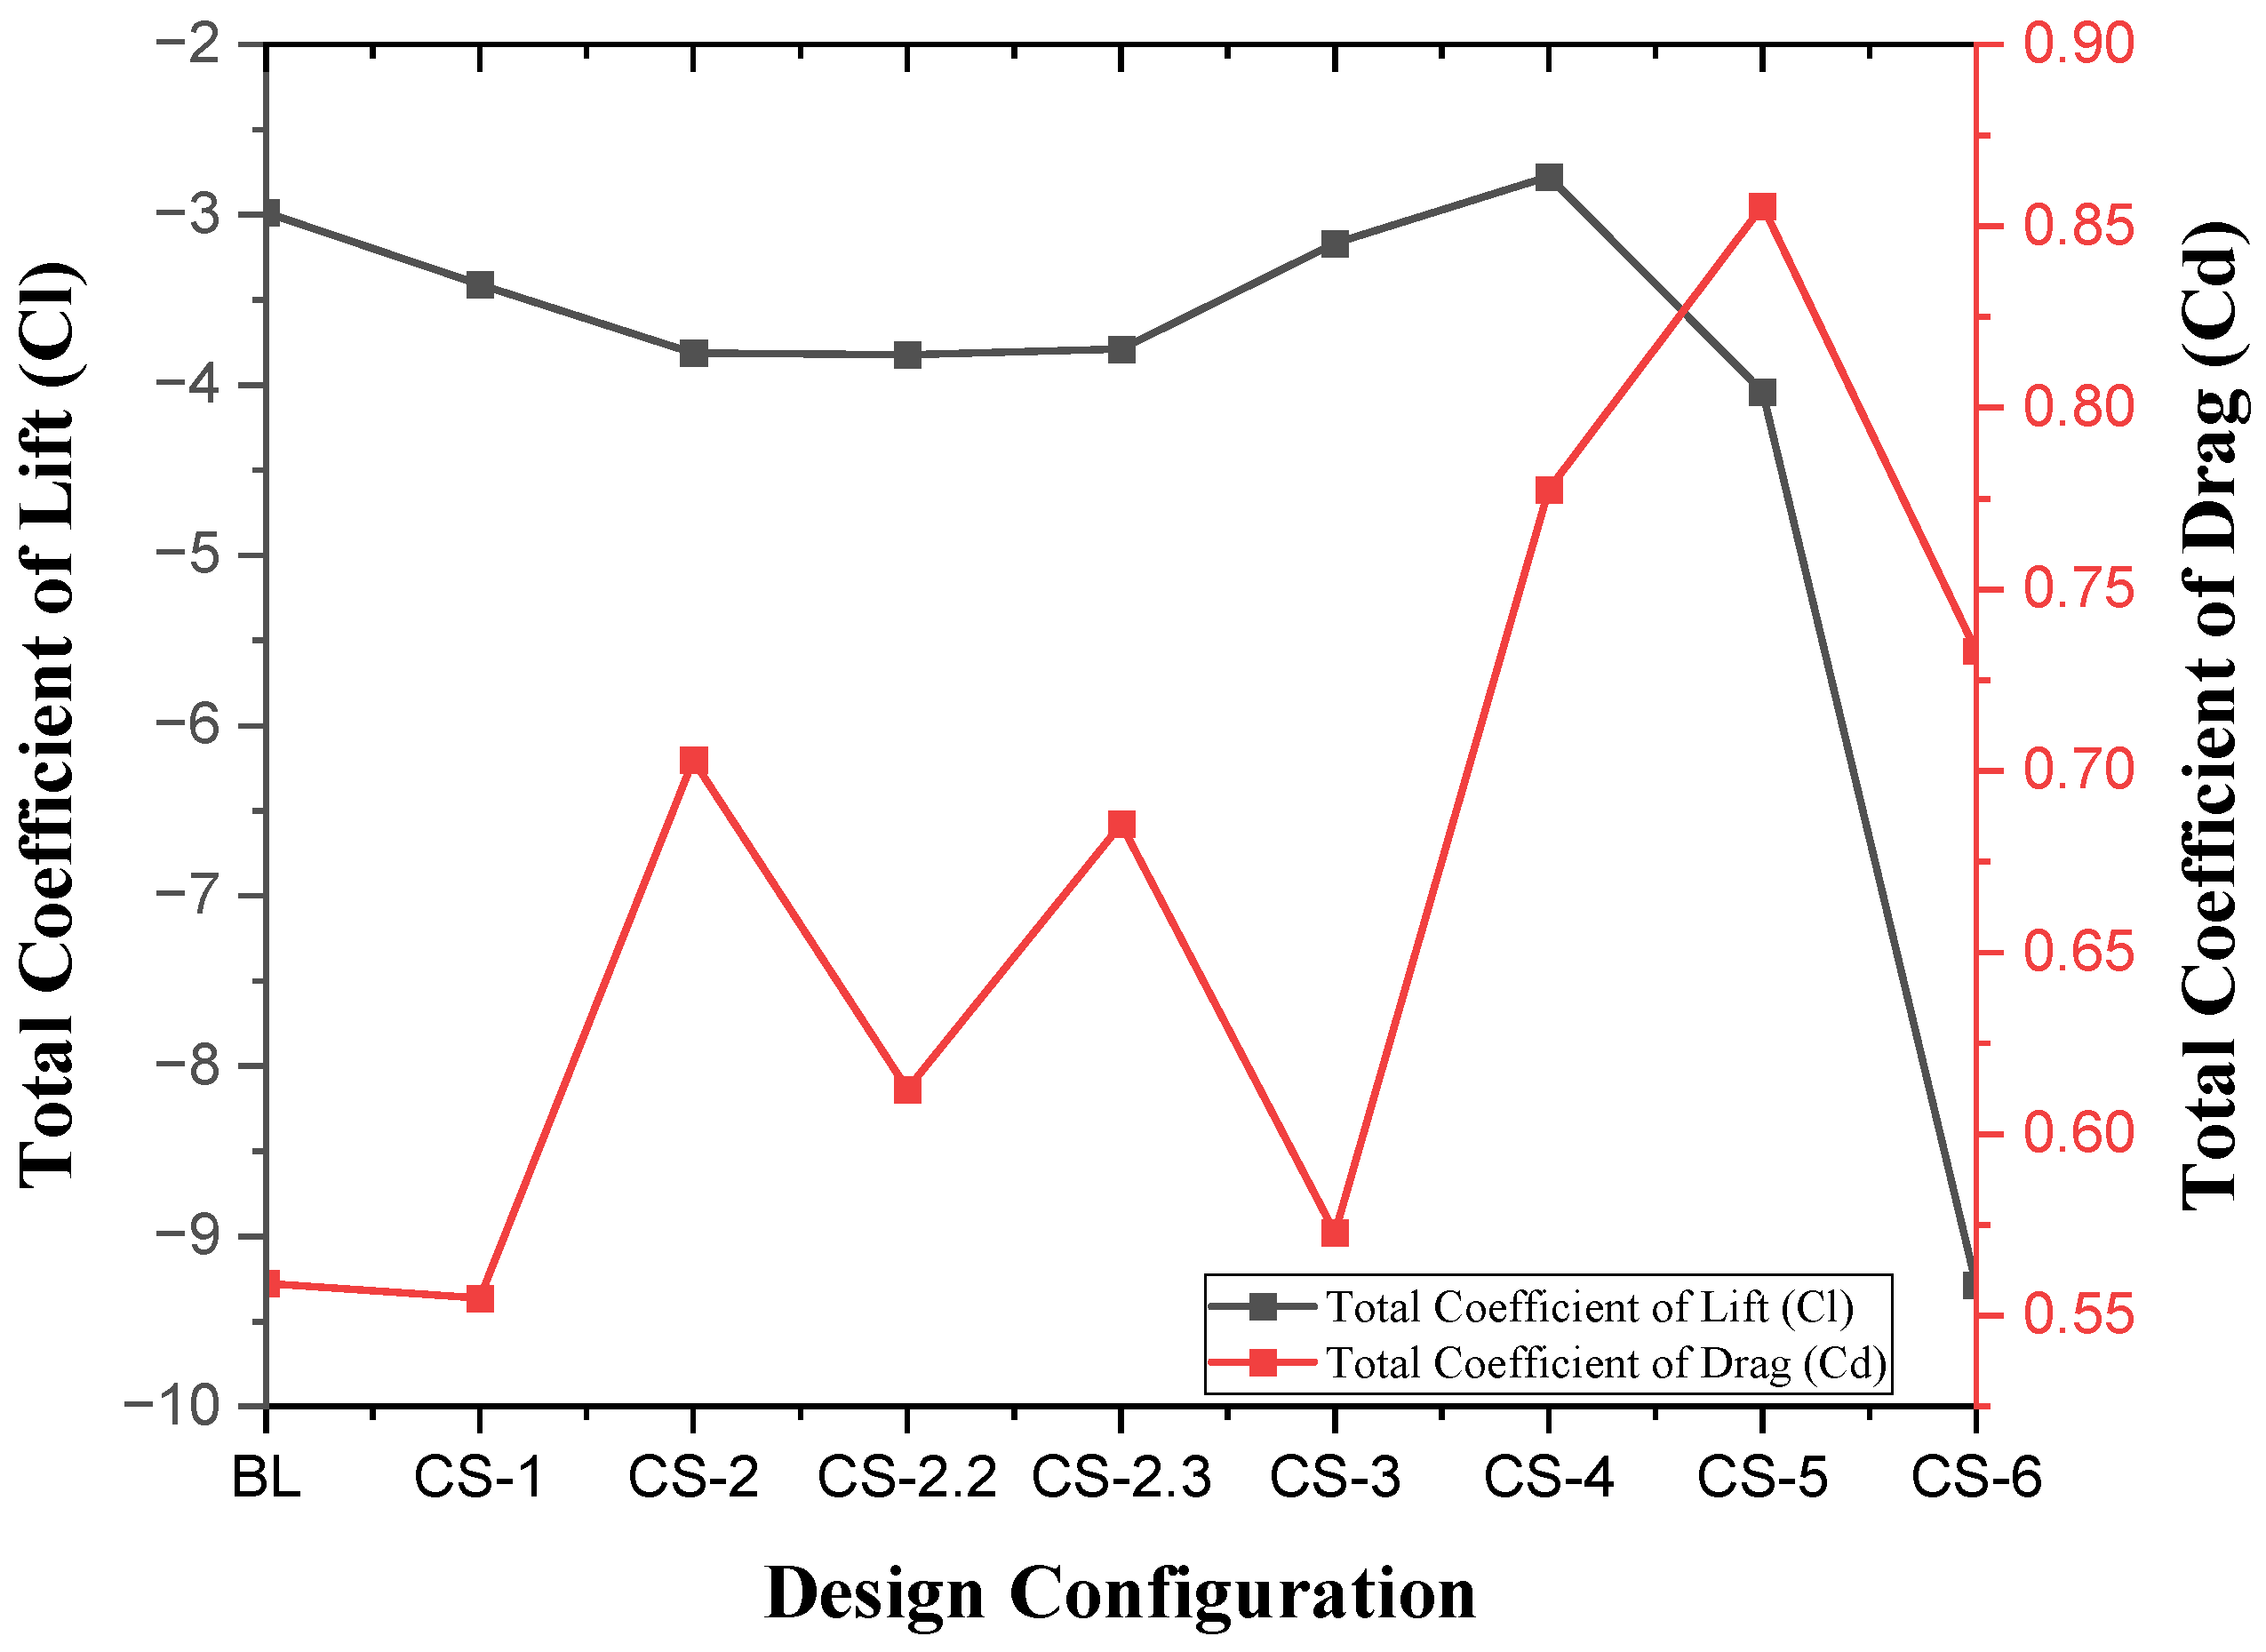
3.2.5. Performance Comparison
4. Conclusions
Author Contributions
Funding
Data Availability Statement
Acknowledgments
Conflicts of Interest
References
- Nath, D.S.; Pujari, P.C.; Jain, A.; Rastogi, V. Drag reduction by application of aerodynamic devices in a race car. Adv. Aerodyn. 2021, 3, 1–20. [Google Scholar] [CrossRef]
- Toet, W. Aerodynamics and aerodynamic research in Formula 1. Aeronaut. J. 2013, 117, 1–26. [Google Scholar] [CrossRef]
- Aerodynamics in F1 | RacingNews365. Available online: https://racingnews365.com/aerodynamics-f1 (accessed on 28 July 2024).
- Aerodynamics in Formula 1: The Key to Speed and Performance by Raptor Sport Medium. Available online: https://medium.com/@raptorf1sport/aerodynamics-in-formula-1-the-key-to-speed-and-performance-9fe269cd81c9 (accessed on 28 July 2024).
- Ogawa, A.; Mashio, S.; Nakamura, D.; Masumitsu, Y.; Minagawa, M.; Nakai, Y. Aerodynamics Analysis of Formula One Vehicles. In Development Methodologies for Formula One Aerodynamics; Honda R&D Co., Ltd.: Haga, Japan, 2009. [Google Scholar]
- Driven by Simulation, a Regulations Overhaul Promises a New Era of Racing in Formula 1. Available online: https://mobile.engineering.com/amp/23449.html. (accessed on 28 July 2024).
- Poutiainen, A. Undertray Design and Development Procedure with CFD an Optimization Study of Different Undertray Designs with CFD Computations. Master’s Thesis, KTH, School of Engineering Sciences, Stockholm, Sweden, 2021. [Google Scholar]
- Aerodynamics Focus: The Undertray—Monash Motorsport. Available online: https://www.monashmotorsport.com/blog/aerodynamics-focus-the-undertray (accessed on 17 December 2024).
- Cooper, K.R.; Bertenyi, T.; Dutil, G.; Syms, J.; Sovran, G. The Aerodynamic Performance of Automotive Underbody Diffusers. SAE Tech. Pap. 1998, 107, 150–179. [Google Scholar] [CrossRef]
- Cooper, K.R.; Syms, J.; Sovran, G.; Cooper, K.R.; Syms, J.; Sovran, G. Selecting Automotive Diffusers to Maximise Underbody Downforce. SAE Tech. Pap. 2000, 109, 497–512. [Google Scholar] [CrossRef]
- Desai, S.S.; Lo, C.M.B.; George, A.R. A Computational Study of Idealized Bluff Bodies, Wheels, and Vortex Structures in Ground Effect. SAE Tech. 2008, 1, 0327. [Google Scholar] [CrossRef]
- Khalighi, B.; Zhang, S.; Koromilas, C.; Balkanyi, S.R.; Bernal, L.P.; Laccarino, G.; Moin, P. Experimental and Computational Study of Unsteady Wake Flow Behind a Bluff Body with a Drag Reduction Device. SAE Tech. Pap. 2001, 110, 1209–1222. [Google Scholar] [CrossRef]
- Breslouer, O.J.; George, A.R.; Breslouer, O.J.; George, A.R. Exploratory Experimental Studies of Forces and Flow Structure on a Bluff Body with Variable Diffuser and Wheel Configurations. SAE Tech. Pap. 2008, 1, 0326. [Google Scholar] [CrossRef]
- Huminic, A.; Huminic, G. Computational Study of Flow in the Underbody Diffuser for a Simplified Car Model. SAE Tech. Pap. 2010, 1, 0119. [Google Scholar] [CrossRef]
- Katz, J. Aerodynamics of race cars. Annu. Rev. Fluid. Mech. 2006, 38, 27–63. [Google Scholar] [CrossRef]
- Unni, T.P.A. Numerical Investigation on Aerodynamic Effects of Vanes and Flaps on Automotive Underbody Diffusers. SAE Tech. Pap. 2017, 1, 2163. [Google Scholar] [CrossRef]
- Ehirim, O.; Knowles, K.; Saddington, A.; Finnis, M. Passive Flow Control on a Ground-Effect Diffuser Using an Inverted Wing. SAE Int. J. Passeng. Cars-Mech. Syst. 2018, 11, 273–296. [Google Scholar] [CrossRef]
- Tian, J.; Liu, X.; Zhang, Y.; Chen, Q. Numerical Analysis of Underbody Diffusers with Different Angles and Channels. SAE Tech. Pap. 2019. [CrossRef]
- Asgar, A.; Khokhar, S.; Shirolkar, S.S. Design and Analysis of Undertray Diffuser For a Formula Style Racecar. Int. J. Res. Eng. Technol. 2015, 04, 202–210. [Google Scholar] [CrossRef]
- Bhardwaj, A. Analysis of Ground Effect Diffuser on a Race Car to Optimize Aerodynamic Performance. Int. J. Innov. Sci. Res. Technol. 2021. Available online: www.ijisrt.com (accessed on 29 July 2024).
- Chandra, S. CFD Analysis of PACE Formula-1 Car. Comput. Aided Des. Appl. 2011, 8, 1–14. [Google Scholar] [CrossRef]
- Guerrero, A.; Castilla, R. Aerodynamic Study of the Wake Effects on a Formula 1 Car. Energies 2020, 13, 5183. [Google Scholar] [CrossRef]
- (PDF) Design and Manufacture of an Aerodynamic Undertray for Formula Student. Available online: https://www.researchgate.net/publication/350639990_Design_and_Manufacture_of_an_Aerodynamic_Undertray_for_Formula_Student (accessed on 21 December 2024).
- Gupta, A.; Abderrahmane, H.A.; Janajreh, I. Flow analysis and sensitivity study of vertical-axis wind turbine under variable pitching. Appl. Energy 2024, 358, 122648. [Google Scholar] [CrossRef]
- (PDF) Flow Around a Cylinder: A Comparative Study of Immersed Boundary and Arbitrary Lagrangian-Eulerian (ALE) Methods in OpenFOAM. Available online: https://www.researchgate.net/publication/388279282_Flow_Around_a_Cylinder_A_Comparative_Study_of_Immersed_Boundary_and_Arbitrary_Lagrangian-Eulerian_ALE_Methods_in_OpenFOAM. (accessed on 22 April 2025).
- (PDF) Towards the Optimal Performance of Vertical Wind Turbine: Numerical Simulation and Experimental Validation. Available online: https://www.researchgate.net/publication/388278907_Towards_the_Optimal_Performance_of_Vertical_Wind_Turbine_Numerical_Simulation_and_Experimental_Validation (accessed on 22 April 2025).
- Bazilevs, Y.; Takizawa, K.; Tezduyar, T.E. Computational Fluid-Structure Interaction: Methods and Applications; John Wiley & Sons, Publication: Hoboken, NJ, USA, 2013. [Google Scholar]
- 2023 FORMULA 1 TECHNICAL REGULATIONS; Fédération Internationale de l’Automobile: Paris, France, 2022.
- Federation Internationale de l’Automobile. Available online: https://www.fia.com/ (accessed on 16 March 2025).
- Marco, L. Best Practice Guidelines for Handling Automotive External Aerodynamics with Fluent; Marco Lanfrit: Darmstadt, Germany, 2025. [Google Scholar]
- Jakirlic, S.; Kutej, L.; Unterlechner, P.; Tropea, C. Critical Assessment of Some Popular Scale-Resolving Turbulence Models for Vehicle Aerodynamics. SAE Int. J. Passeng. Cars-Mech. Syst. 2017, 10, 235–250. [Google Scholar] [CrossRef]


| Boundary Name | Physical Condition | Value |
|---|---|---|
| Diffuser (Type: wall) | Shear Stress Specifications | No-Slip |
| Tangential Velocity Specification | Fixed | |
| Wall Surface Specification | Rough | |
| Roughness Height | 0.1 mm | |
| Ground (Type: wall) | Shear Stress Specifications | No-Slip |
| Tangential Velocity Specification | Vector | |
| Wall Surface Specification | Rough | |
| Roughness Velocity | 50 m/s | |
| Roughness Height | 5 mm | |
| Inlet (Type: velocity inlet) | Flow Direction Specifications | Boundary-Normal |
| Turbulence Specification | K-Omega SST | |
| Velocity Specification | Directional | |
| Specific Dissipation Rate | 1.531/s | |
| Turbulent Kinetic Energy | 0.375 J/kg | |
| Velocity Magnitude | 50 m/s | |
| Front and Rear Tire (Type: wall) | Reference Frame Specification | Local Reference Frame |
| Shear Stress Specification | No-Slip | |
| Wall Relative Velocity | −218.723 rad/s | |
| Roughness Height | 1 mm | |
| Rotation Direction | Z-Axis | |
| Rotation Axis | Tire Origin |
| Base Size [mm]. | Total Elements | Drag Force [N] | Computational Time [Hour] |
|---|---|---|---|
| 10 | 1.72 M | 177 | 1 |
| 7 | 3.25 M | 182 | 1.5 |
| 5 | 5.6 M | 195 | 3.3 |
| 4 | 8.25 M | 197 | 5 |
| 3 | 11 M | 197 | 10.2 |
| Model | Downforce on Floor [N] | % Improvement | Drag Force on Floor [N] | % Improvement |
|---|---|---|---|---|
| Baseline | −2334.100 | - | 43.93 | - |
| Case Study 1 | −2649.063 | 13.49 | 41.475 | 5.58 |
| Model | Downforce on R-Tire [N] | % Increment | Drag Force on F-Tire [N] | % Change |
| Baseline | 237.17 | - | 211.4 | - |
| Case Study 1 | 253.92 | 6.75 | 211.9 | 0.23 |
| Model | Downforce on Floor [N] | % Improvement | Drag Force on Floor [N] | % Increment |
|---|---|---|---|---|
| Baseline | −2334.100 | - | 43.93 | - |
| Case Study 2 | −2843.690 | 21.833 | 77.441 | 76.282 |
| Case Study 2.2 | −2813.304 | 20.53 | 75.348 | 71.501 |
| Case Study 2.3 | −2822.502 | 20.93 | 72.133 | 64.199 |
| Model. | Downforce [N] | Drag Force [N] |
|---|---|---|
| Case Study 2 | −81.802 | 31.60 |
| Case Study 2.2 | −86.226 | 35.56 |
| Case Study 2.3 | −83.110 | 30.81 |
| Model | Downforce on Floor [N] | % Improvement | Drag Force on Floor [N] | % Decrement |
|---|---|---|---|---|
| Baseline | −2334.100 | - | 43.93 | - |
| Case Study 3 | −2488.268 | 6.6 | 24.403 | 44.45 |
| Model | Downforce on Floor [N] | % Change from BL | Drag Force on Floor [N] | % Change from BL |
|---|---|---|---|---|
| Baseline (BL) | −2334.100 | - | 43.93 | - |
| Case Study 4 | −2265.378 | −2.96 | 171.59 | 289 |
| Case Study 5 | −3208.125 | 37.442 | 221.046 | 403 |
| Case Study 6 | −7001.713 | 200 | 60.223 | 37.14 |
Disclaimer/Publisher’s Note: The statements, opinions and data contained in all publications are solely those of the individual author(s) and contributor(s) and not of MDPI and/or the editor(s). MDPI and/or the editor(s) disclaim responsibility for any injury to people or property resulting from any ideas, methods, instructions or products referred to in the content. |
© 2025 by the authors. Licensee MDPI, Basel, Switzerland. This article is an open access article distributed under the terms and conditions of the Creative Commons Attribution (CC BY) license (https://creativecommons.org/licenses/by/4.0/).
Share and Cite
Nebot, E.P.; Gupta, A.; Mahak, M. Investigating the Impact of Structural Features on F1 Car Diffuser Performance Using Computational Fluid Dynamics (CFD). Mathematics 2025, 13, 1455. https://doi.org/10.3390/math13091455
Nebot EP, Gupta A, Mahak M. Investigating the Impact of Structural Features on F1 Car Diffuser Performance Using Computational Fluid Dynamics (CFD). Mathematics. 2025; 13(9):1455. https://doi.org/10.3390/math13091455
Chicago/Turabian StyleNebot, Eugeni Pérez, Antim Gupta, and Mahak Mahak. 2025. "Investigating the Impact of Structural Features on F1 Car Diffuser Performance Using Computational Fluid Dynamics (CFD)" Mathematics 13, no. 9: 1455. https://doi.org/10.3390/math13091455
APA StyleNebot, E. P., Gupta, A., & Mahak, M. (2025). Investigating the Impact of Structural Features on F1 Car Diffuser Performance Using Computational Fluid Dynamics (CFD). Mathematics, 13(9), 1455. https://doi.org/10.3390/math13091455