Abstract
In machine learning, when the labeled portion of data needs to be processed, a semi-supervised learning algorithm is used. A dataset with missing attribute values or labels is referred to as an incomplete information system. Addressing incomplete information within a system poses a significant challenge, which can be effectively tackled through the application of rough set theory (R-theory). However, R-theory has its limits: It fails to consider the frequency of an attribute value and then cannot the distribution of attribute values appropriately. If we consider partially labeled data and replace a missing attribute value with the multiset of all possible attribute values under the same attribute, this results in the emergence of partially labeled multiset-valued data. In a semi-supervised learning algorithm, in order to save time and costs, a large number of redundant features need to be deleted. This study proposes semi-supervised attribute selection algorithms for partially labeled multiset-valued data. Initially, a partially labeled multiset-valued decision information system (p-MSVDIS) is partitioned into two distinct systems: a labeled multiset-valued decision information system (l-MSVDIS) and an unlabeled multiset-valued decision information system (u-MSVDIS). Subsequently, using the indistinguishable relation, distinguishable relation, and dependence function, two types of attribute subset importance in a p-MSVDIS are defined: the weighted sum of l-MSVDIS and u-MSVDIS determined by the missing rate of labels, which can be considered an uncertainty measurement (UM) of a p-MSVDIS. Next, two adaptive semi-supervised attribute selection algorithms for a p-MSVDIS are introduced, which leverage the degrees of importance, allowing for automatic adaptation to diverse missing rates. Finally, experiments and statistical analyses are conducted on 11 datasets. The outcome indicates that the proposed algorithms demonstrate advantages over certain algorithms.
Keywords:
partially labeled multiset-valued data; p-MSVDIS; uncertainty measurement; semi-supervised attribute selection; dependence function; information entropy MSC:
68T09; 68T99; 68W40
1. Introduction
1.1. Research Background
Uncertainty measurement (UM) is applied extensively in various domains, such as data mining [1], medical diagnosis [2,3], image processing [4], and pattern recognition [5,6].
An information system (IS) was proposed by Pawlak [7] based on R-theory. A set-valued IS [8] refers to a system in which each sample or data point in a dataset is associated with one or more sets. These sets can be discrete or continuous, and they describe the categories or attributes to which each sample belongs. These systems often lose information due to human or mechanical reasons, sometimes involving feature values and sometimes involving sample labels. We refer to an IS in which some samples have labels, while those that do not are referred to as partially labeled data. Incomplete ISs are a common problem.
R-theory is widely used to measure information granularity in an IS. Many scholars have published research on this aspect. For instance, Liang et al. [9] studied information granulation in an IS. Qian et al. [10] investigated the measurement of fuzzy information granulation from five perspectives. Dai et al. [11] studied UM based on an incomplete decision IS. Zhang et al. [12] discussed applications and developments in the field of information fusion, focusing on the introduction and evaluation of multi-source information fusion methods based on R-theory. Yang et al. [13] explored how to effectively address uncertainty issues in multi-source fuzzy information systems through R-theory and uncertainty measurement methods.
In the current context, information plays a vital role in social development, but a significant amount of information is marked by useless attributes. In machine learning, in order to save time and costs, a large number of redundant features need to be deleted. Therefore, attribute selection is becoming increasingly important in data processing. The dimension of data can be reduced, and the original efficiency of the data can be maintained via attribute selection. Hu et al. [14] established a rough set model using a neighborhood and used it for attribute selection. Singh et al. [15] developed a method using a set-valued IS for attribute selection. Wang et al. [16] designed a novel attribute selection algorithm in view of local conditional entropy. Dai et al. [17] used information entropy to study the attribute selection of an interval-valued IS. Wang et al. [18] researched a greedy algorithm base for designing UMs for reduction.
Semi-supervised attribute selection fully improves data utilization by mining unlabeled data information so as to achieve the goal of improving classification accuracy. Many scholars are very interested in this field. Dai et al. [19] studied semi-supervised attribute selection for interval data and proposed a novel entropy structure in view of the misclassification cost for attribute selection. Liu et al. [20] proposed utilizing common methods to predict unknown labels and then constructed multiple fitness functions to assess the importance of attributes for reduction. Kim [21] obtained a semi-supervised dimensionality reduction framework that takes into account both the label and structural information. Li et al. [22] aimed to improve the effectiveness of feature selection by considering a subset of features of a specific category. Zhang et al. [23] integrated R-theory into an ensemble learning framework, leveraging labeled data to create an ensemble base classifier capable of both labeling unlabeled data and augmenting the existing labeled dataset. Ma et al. [24] presented a semi-supervised rough fuzzy Laplacian Eigenmaps method for the attribute selection of high-dimensional mixed data. The importance of each attribute was evaluated using defined information entropy measures. Han et al. [25] developed a semi-supervised attribute selection algorithm in view of spline regression, which can effectively handle video semantic recognition and other related problems. Compared to singular-value decomposition and non-negative matrix factorization, rank-revealing QR factorization is more computationally efficient. Thus, Moslemi et al. [26] presented a novel unsupervised feature selection technique that leverages rank-revealing QR factorization. Bohrer et al. [27] proposed a hybrid feature selection approach using a multi-objective genetic algorithm to enhance classification performance and reduce dimensionality across diverse classification tasks. Sheikhpour et al. [28] put forward a robust semi-supervised multi-label feature selection method that integrates shared subspace learning, graph Laplacian-based manifold learning, and norm minimization in both the loss function and regularization, and Sheikhpour et al. [29] also studied sparse feature selection using hypergraph Laplacian-based semi-supervised discriminant analysis.
However, attribute selection poses numerous challenges [30,31]: discretizing continuous attributes may compromise the structural integrity of the data, while the operational overhead of attribute selection increases with larger datasets, often resulting in diminished reduction quality.
1.2. Motivation and Contributions
Missing data are common in data mining and machine learning. Missing data raise uncertainty and can reduce the capacity of machine learning models. Missing data can be categorized into three classes: (1) missing completely at random (MCAR); (2) missing at random (MAR); and (3) missing not at random (MNAR). In this paper, we study MCAR. A common approach for handling missing data is to discard records with missing data (listwise deletion and pairwise deletion). This approach is convenient. However, some information can be lost, and this approach may lead to some bias in some circumstances. For the models that cannot deal with data with missing information values by themselves, missing data imputation is needed. In statistics, imputation is the process of filling missing information values by some reasonable rules. Imputation is a complicated task because it can create bias and can lead to inaccurate results, especially for MAR and MNAR.
Set-valued data are important for processing datasets with missing attributes [32]. Specifically, the use of set-valued data replaces missing attribute values with a set comprising all possible attribute values under the same attribute, while existing attribute values are represented by a single point set containing the actual attribute value. This process transforms a dataset with missing attribute values into a set-valued information system (SVIS). However, this approach has limitations: It do not consider the frequency of the attribute values. Here, the frequency of the attribute values can be interpreted as the importance or the attribute values. It can be calculated by the number of occurrences, which leads to the occurrence of multisets. To address this issue, a multiset-valued decision information system (MSVDIS) is proposed, in which missing attribute values are replaced with multisets. “Replacing missing attribute values with multisets” is more appropriate than “replacing missing attribute values with with a set comprising all possible attribute values under the same attribute”. By considering the frequency of attribute values, this method maximizes the extraction of useful information from datasets with missing attributes, offering a novel approach to handling incomplete data. Miyamoto [33] presented a model for information clustering based on fuzzy multisets, utilizing it to execute the clustering process. Zhao et al. [34] studied two rough set models and introduced loss functions for computing the expected costs of data in an MSVIS.
Multiset is an important concept of mathematics and computer science that extends the definition of traditional set. It allows elements to be repeated and record multiplicities, and it offers more powerful expression capabilities than traditional sets in data processing, algorithm design, mathematical modeling, and other fields.
This study investigates UMs in a partially labeled multiset-valued decision information system (p-MSVDIS) and considers semi-supervised attribute selection in a p-MSVDIS. Based on the above research motivation, the novel contributions of this article are as follows:
- (1)
- Merely substituting a missing attribute value with the set of all potential values is overly simplistic and risks losing valuable information. This study advocates for the utilization of multisets to address missing attribute values. Furthermore, it demonstrates the conversion of multisets into probability distribution sets, enabling the calculation of the Hellinger distance based on these distributions to measure the dissimilarity between attribute values in an MSVDIS.
- (2)
- This explains that p-MSVDIS can induce two MSVDISs: one of which is a l-MSVDIS, and the other is a u-MSVDIS.
- (3)
- Considering indistinguishable relations, distinguishable relations, and dependence functions, this study introduces two types of importance measures for each attribute subset within a p-MSVDIS. These measures are derived from the weighted sum of importance assigned to the induced l-MSVDIS and u-MSVDIS. This combined measure, termed UM, provides a comprehensive reflection of the importance or classification capability of the attribute subset within the given p-MSVDIS.
- (4)
- The performance of the defined importance on real datasets is examined. This study uses the datasets to construct two heuristic algorithms for semi-supervised attribute selection in a p-MSVDIS.
1.3. Organization
In Section 2, an MSDIS is recalled. In Section 3, a p-MSVDIS is introduced. In Section 4, two types of importance in a p-MSVDIS are defined. In Section 5, semi-supervised attribute selection in a p-MSVDIS is defined, and two corresponding algorithms are advanced. In Section 6, experiments on the performance of the proposed algorithms and effectiveness analysis are conducted. In Section 7, this study is summarized.
Figure 1 depicts a flow chart of this research.
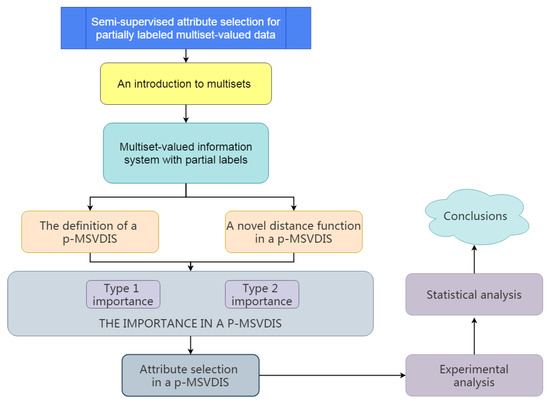
Figure 1.
Flow chart of research.
2. Preliminaries
In this section, an MSDIS is reviewed.
In this study, let , and is the cardinality of X.
2.1. Multisets and Probability Distribution Sets
Definition 1
([35]). A multiset M extract from X is proposed by a function .
If , this means that x appears m times in M, which is recorded as .
Given , if , then M is recorded as , i.e.,
Definition 2.
. Suppose If , , and , then S is referred to as a probability distribution set (PDS) on X. Moreover, if , is a rational number, S is referred to as a probability distribution set (RPDS) on X.
Definition 3
([36]). S and T are two PDSs on X. Denote
Then, the Hellinger distance between S and T is defined as
Definition 4.
and
is a multiset drawn from X. We inesrt
where . Then, is an RPDS on X.
2.2. Multiset-Valued Decision Information Systems
Let T be a finite sample set and a finite attribute set. is then referred to as an information system (IS) if is an information function, where , .
If is an IS and d is a decision attribute, then is referred to as a decision information system (DIS).
∗ shows the unknown information value. If , , but , then a DIS is an IDIS. , and we denote
Example 1.

Table 1 is an IDIS , where , ,

Table 1.
An IDIS .
Definition 5
([37]). An IDIS is referred to as an MSVDIS if ; is a multiset drawn from the same set.
Definition 6
([37]). is an IDIS with . Let . Denote . , expresses the number of occurrences of in , where is an ordinary set and is a multiset. If , then is taken the place of ; if , then is taken the place of . After this treatment, is an MSVDIS. It is the MSVDIS induced by the IDIS .
3. A Partially Labeled Multiset-Valued Information System
3.1. The Definition of a p-MSVDIS
Below, ∗ means the unknown information value, and ⋄ shows the unknown label.
is an IDIS. , and we denote
Insert
From the above, we know that denotes all known information values of a.
Definition 7.
is a DIS. Insert
Then, .
(1) is referred to as an l-MSVDIS if and , and exist.
(2) is referred to as a p-MSVDIS if and , , and exist.
(3) is referred to as a u-MSVDIS if and , and exist.
Obviously,
Denote
Since each sample has no label in a u-MSVDIS , we think that can be seen as .
Definition 8.
and are called the l-MSVDIS and u-MSVDIS induced by , respectively.
can be viewed as the result of the information fusion of and .
is referred to as the incomplete rate of labels.
Example 3.


Table 3.
A p-MSVDIS .
3.2. A Novel Distance Function in a p-MSVDIS
For effective discrimination between samples within a p-MSVDIS, a novel distance function is provided.
Definition 9.
For a p-MSVDIS , let and . Then, the distance between and is defined as
Definition 10.
For a p-MSVDIS , let , and we denote
Definition 11.
For a p-MSVDIS , let , and we denote
Then, is referred to as the relative discernibility relation of P relative to d on .
Definition 12.
For a p-MSVDIS , let . Then,
is referred to as the discernibility relation of P on .
For a p-MSVDIS , let . According to Kryszkiewicz’s ideal [38], is defined as follows:
Then, is referred to as generalized decision in .
Definition 13.
For a p-MSVDIS , if ∀, , then is referred to as δ-consistent; otherwise, is referred to as δ-inconsistent.
Proposition 1.
is a p-MSVDIS. Given and , then
Proof.
“⇒”: Let . Then, , . Suppose . Then, , . implies that . So, . Thus,
“⇐”: Let , . Suppose . Then, . Since and , . Then, . Thus, . This shows that . □
Proposition 2.
A p-MSVDIS is δ-consistent ⇔
Proof.
This is easily proven via Proposition 1. □
4. Importance in a p-MSVDIS
In this section, two types of importances in a p-MSVDIS are defined.
4.1. Type 1 Importance in a p-MSVDIS
Definition 14.
For a p-MSVDIS , let , and insert
Then, is referred to as the dependence of P on d in .
Proposition 3.
For a p-MSVDIS , denote
(1)
(2) .
(3) If , then
Proof.
(1) Obviously, , .
Since is a partition of , we have
Thus,
(2) This holds by (1).
(3) Suppose ; then, , . So,
This implies that
By (1),
□
Definition 15.
For a p-MSVDIS , let . The type 1 importance of P is then defined as
Example 4.
On the basis of the p-MSVDIS in Table 3, the incomplete rate is and . Let ; then,
;
;
;
;
; ; .
Thus, . Similarly, , and .
Since and , hence .
Similarly, , .
Proposition 4.
For a p-MSVDIS , we have the following:
(1) ;
(2) ;
(3) implies ;
(4) ⇔ , .
Proof.
“(1) and (2)” are obvious.
(3) Since ,
Then,
Thus,
Hence, .
(4) “⇐” is clear. Below, we prove “⇒”.
Suppose ; then,
This implies that
Note that , . Then, we have , . Then,
□
4.2. Type 2 Importance in a p-MSVDIS
Definition 16.
For a p-MSVDIS , let ; insert
Then, is referred to as the conditional information entropy of P to d in .
Proposition 5.
For a p-MSVDIS , let . If , then
Proof.
Denote
Then,
Obviously, ,
Then,
Let . then increases with respect to x and y, respectively.
Since we have
Thus,
□
Proposition 6.
For a p-MSVDIS , given , then .
Proof.
Obviously, . Since
we have
Thus, . □
Definition 17.
For a p-MSVDIS , let . The type 2 importance of P is then defined as
Example 5.
On the basis of the p-MSVDIS in Table 3 and Example 4, is calculated.
.
Similarly, , , and .
Since and , hence .
Similarly, , .
Proposition 7.
For a p-MSVDIS , we have the following:
(1) ;
(2) ;
(3) implies to ;
(4) ⇔ , .
Proof.
“(1) and (2)” are obvious.
(3) Since , we have
Then,
Thus,
Hence, .
(4) “⇐” is clear. Below, we prove “⇒”.
Suppose . Then,
This implies that
Note that , . Then, we have , . Then, the following is the case:
□
5. Semi-Supervised Attribute Selection in a p-MSVDIS
In this section, semi-supervised attribute selection in a p-MSVDIS is explored.
5.1. The Definition of Semi-Supervised Attribute Selection in a p-MSVDIS
Definition 18.
For a p-MSVDIS , let and . Then, P is referred to as a coordinate subset of A with respect to d in a p-MSVDIS ; if , .
The family of all coordinate subsets of A with respect to d in a p-MSVDIS is recorded as .
Definition 19.
For a p-MSVDIS , let and . P is then referred to as a reduct of A with respect to d in a p-MSVDIS ; if and , .
The family of all reducts of A with respect to d in a p-MSVDIS is recorded as .
Theorem 1.
For a p-MSVDIS , let . The following results can then be deduced from each other:
;
.
Proof.
The proof is obvious. □
Corollary 1.
For a p-MSVDIS , let and . The following results can then be deduced from each other:
(1) ;
(2) and , .
Proof.
This follows from Theorem 1. □
Lemma 1.
For a p-MSVDIS , let . If , then and j:
Proof.
If , then . Since , . Thus, .
If , then . Since , . Thus, . □
Lemma 2.
For a p-MSVDIS , let . If , then
Proof.
Since is a partition of , we have , .
Since , by Lemma 1, we have
Thus,
□
Proposition 8.
For a p-MSVDIS , let . The following results can be deduced from each other:
(1) ;
(2) .
Proof.
“(1) ⇒ (2)” is proved by Lemma 2.
(2) ⇒ (1). Suppose Then,
Suppose Then, , Denote
We have
It follows that
Note that
Then,
So,
This is a contradiction.
Thus,
□
Corollary 2.
For a p-MSVDIS , if is δ-consistent, then .
Proof.
This is proven by Propositions 2 and 8. □
Theorem 2.
For a δ-consistent p-MSVDIS , let . The following results can be deduced from each other:
(1) ;
(2) .
Proof.
(1) ⇒ (2). Suppose . Then, and . Thus, , .
By Proposition 3,
Obviously, , This implies that ,
Then, ,
It follows that ,
Thus, ,
is -consistent. From Proposition 2, we have
Therefore, ,
Let ; here, . Then, , This implies
By Proposition 8,
is -consistent, from Corollary 2, Then,
By Proposition 7, .
(2) ⇒ (1). Suppose . Then, by Proposition 7, .
Since , we have .
Since is -consistent, from Corollary 2, . Thus, By Proposition 8,
Suppose that ,
Then, Pick
It follows that
implies that . Then, . implies that . Thus, . So, . This is a contradiction.
Hence, ,
Obviously, ,
Then, ,
Thus,
Hence, .
□
Corollary 3.
For a δ-consistent p-MSVDIS , let . The following results can be deduced from each other:
(1) ;
(2) and , .
5.2. Semi-Supervised Attribute Selection Algorithms in a p-MSVDIS
Next, the proposed two UMs are used to devise algorithms for semi-supervised attribute selection in a p-MSVDIS (Algorithms 1 and 2).
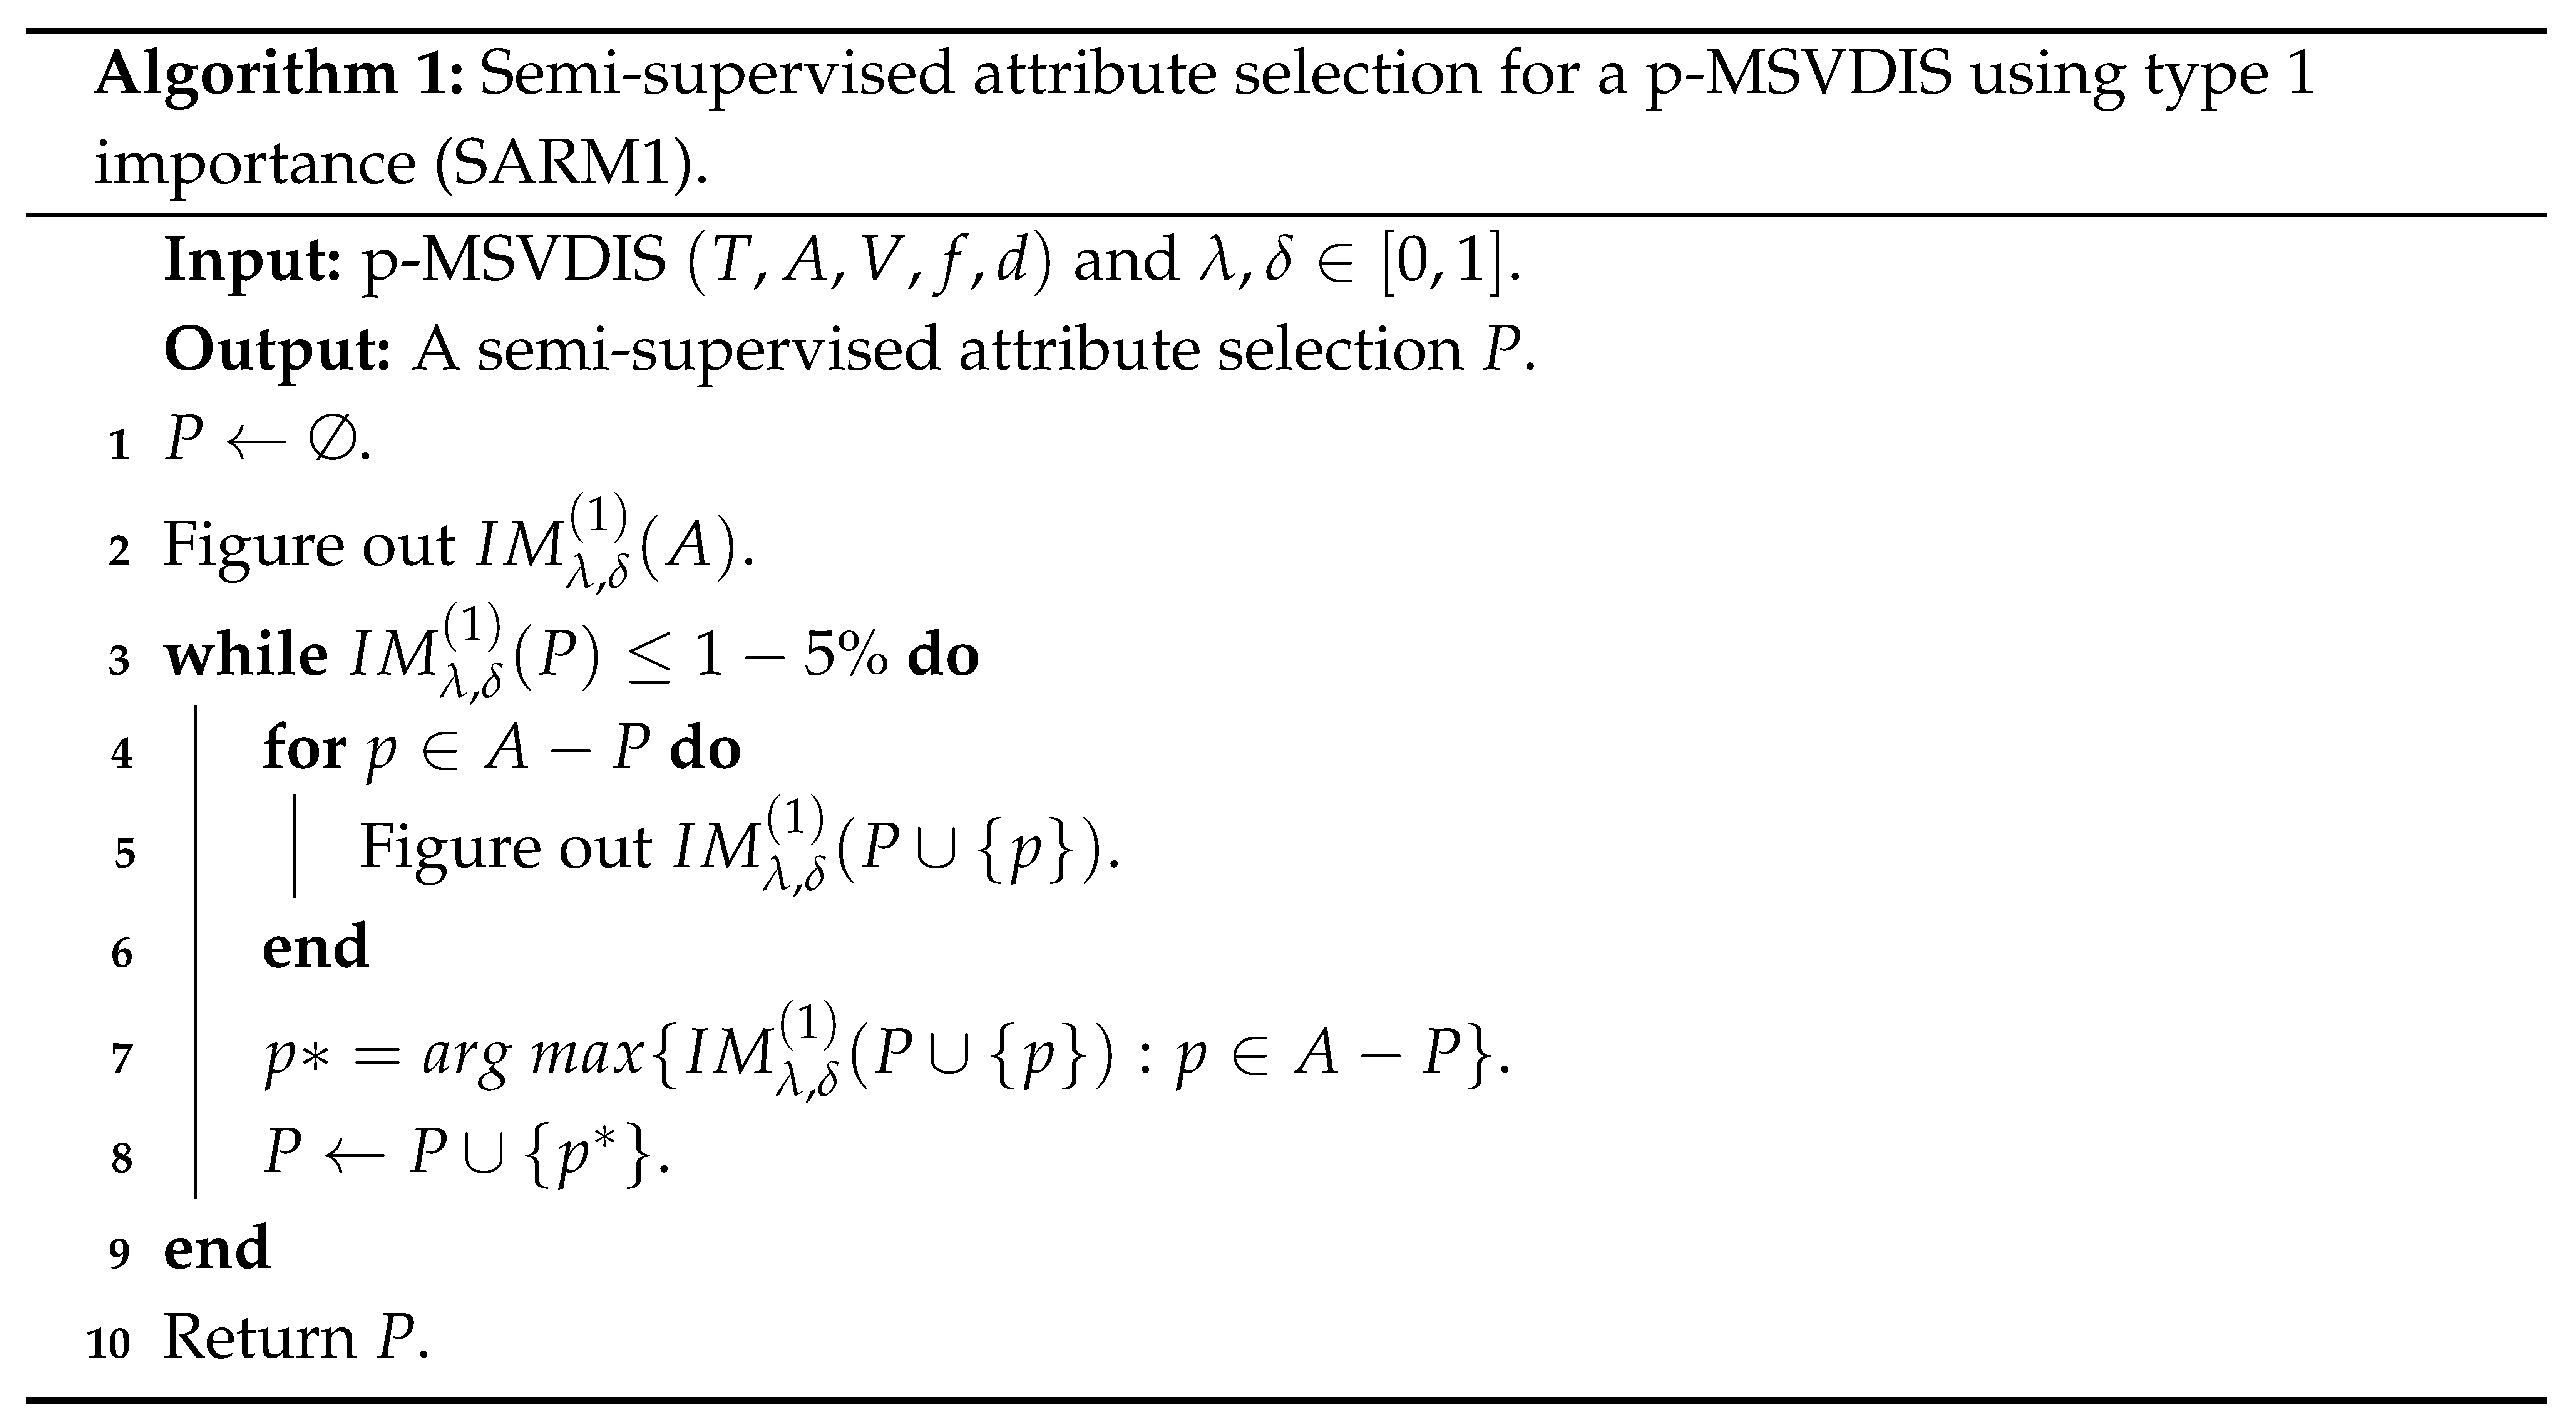
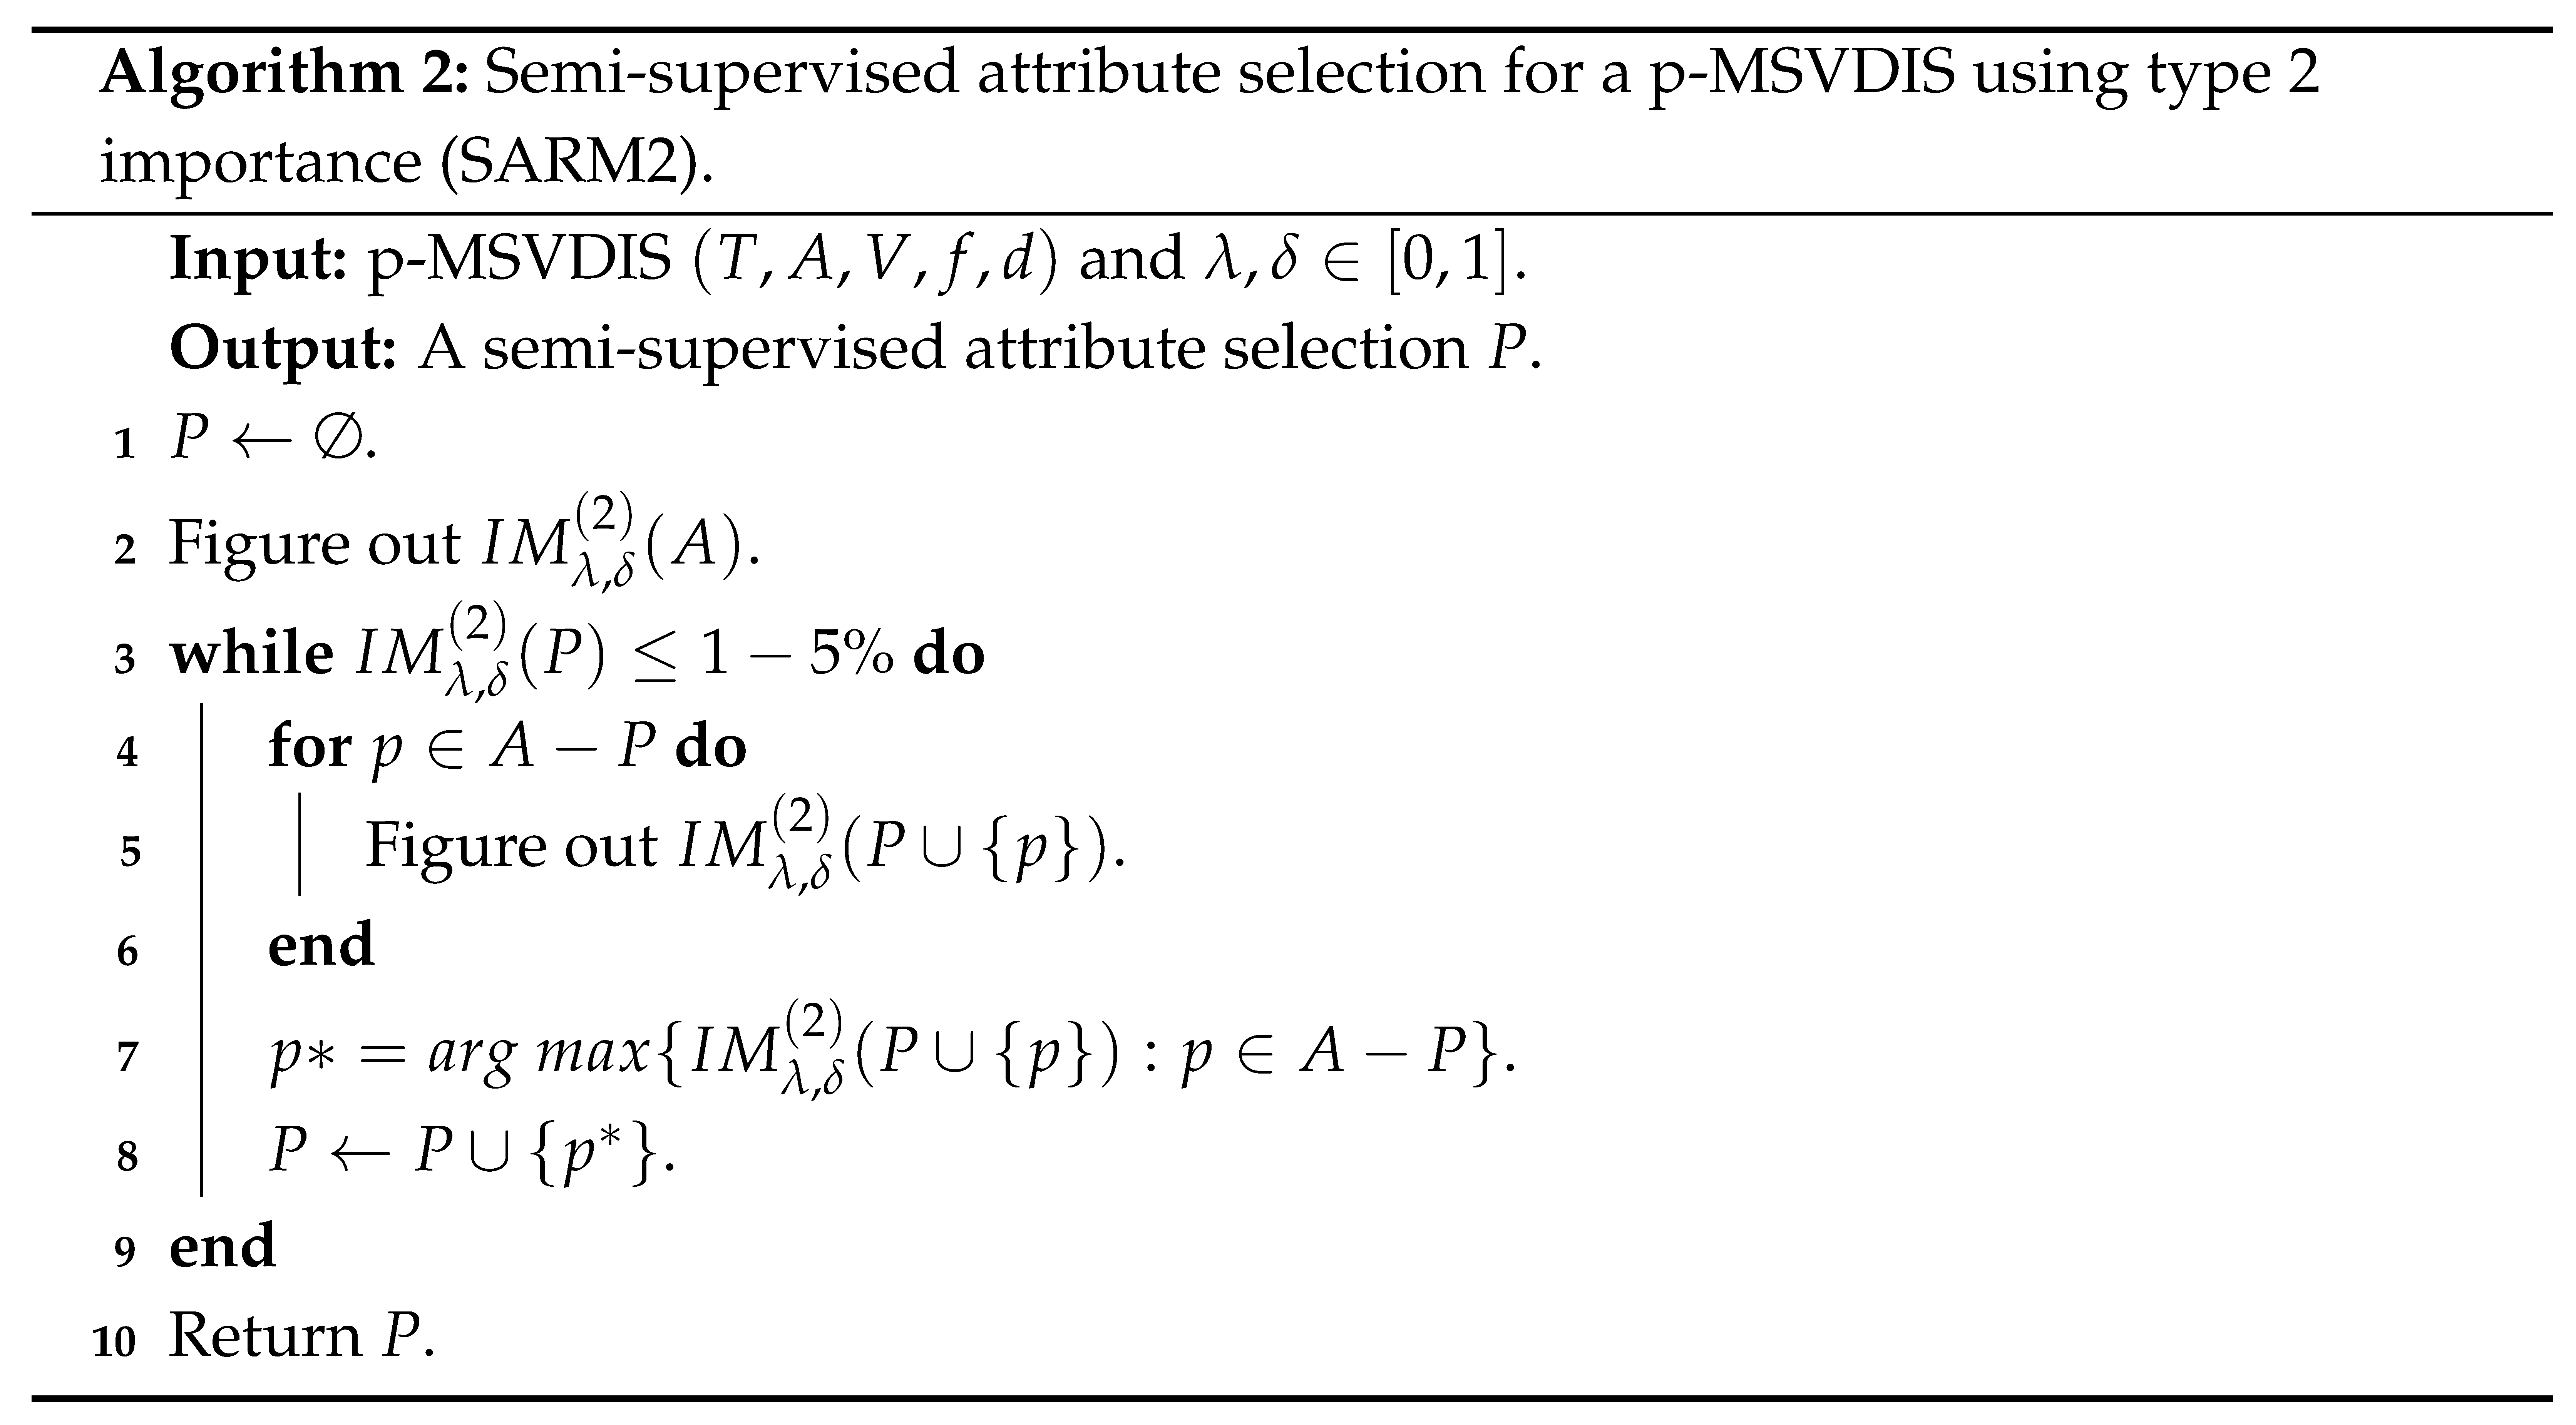


Since the time and space complexity of these two algorithms are the same, only one algorithm is discussed. These two algorithms are encoded in matrix format to obtain faster results in practical applications. Starting from the second step, the binary relations calculated on T are expressed in the form of matrices. Therefore, the time complexity of step 2 is . Steps 3–8 are . All the complexity of SARM1 is . After removing the low-order and constant terms, the complexity is . The spatial complexity of SARM1 is .
In the algorithms’ flow, the third step establishes the loop execution condition: The iteration operation is continuously performed while . During each cycle, an effective attribute is selected. The 5% here serves as a key parameter, which is used to control the final scale of selected attributes. If the number of filtered attributes is found to be excessive, this parameter value can be appropriately increased (e.g., from 5% to 10% or higher) to reduce the number of cycles, thereby effectively limiting the attribute count. Conversely, when the selected attributes are insufficient or the model’s classification accuracy is unsatisfactory, the parameter can be adjusted downward to 0%, allowing more feature attributes to be obtained through additional iterations.
6. Experimental Analysis
Many experiments conducted to illustrate the effectiveness of SARM1 and SARM2 are described in this section.
6.1. Numerical Experiment
To test the algorithm’s effectiveness on real datasets, we utilized SARM1 and SARM2, comparing them against existing algorithms. The experiments were conducted on a Lenovo computer equipped with an Intel(R) Core(TM) i7-9700 CPU running at 3.00 GHz, with 16 GB of memory and a Windows 10 operating system. MATLAB 2019 and SPSS 2018 were the software platforms used for computation. Table 4 presents the 11 datasets selected from the UCI Machine Learning Repository [39] for experimental analysis. Since it is difficult to find set-valued datasets in this database, we made some adjustments to the data. Real value datasets were rounded, and all datasets were randomly incomplete, missing 10% of the information values. This was set so that when incomplete information was encountered, it could be considered an MSVDIS (see Example 2). Due to the combined limitations of excessive sample sizes in the 11th dataset Con and insufficient computer memory, the algorithm’s execution is rendered unfeasible. To address this, repeated random sampling is adopted, whereby 50% of the samples are systematically selected for each experimental analysis.

Table 4.
Basic information about the datasets.
SARM1 and SARM2 both have two variables that need to be given in advance: One is , and the other is . represents the rate of incomplete labels. For convenient calculation, 20% of labels were randomly incomplete (). We need to observe how a change in affected the results. In order to study whether the attribute subsets can still maintain the classification accuracy of the original datasets, three classifiers, Bagged Trees (BT), Support Vector Machine (SVM), and K-nearest neighbors (KNN, with K = 5), are used for the accuracy analysis of the subset. The five-fold cross-validation method is applied for classification, and the average value is taken after the program ran 10 times. The relationship curves between the change in and the classification accuracy with three classifiers are shown in Figure 2. It can be seen that the curves of each subgraph are very oscillatory, which indicates that has a considerable impact on the subset and classification accuracy. Only the curves of PS and Aud are relatively smooth. According to Figure 2, we know how to choose to achieve the maximum accuracy for each dataset.
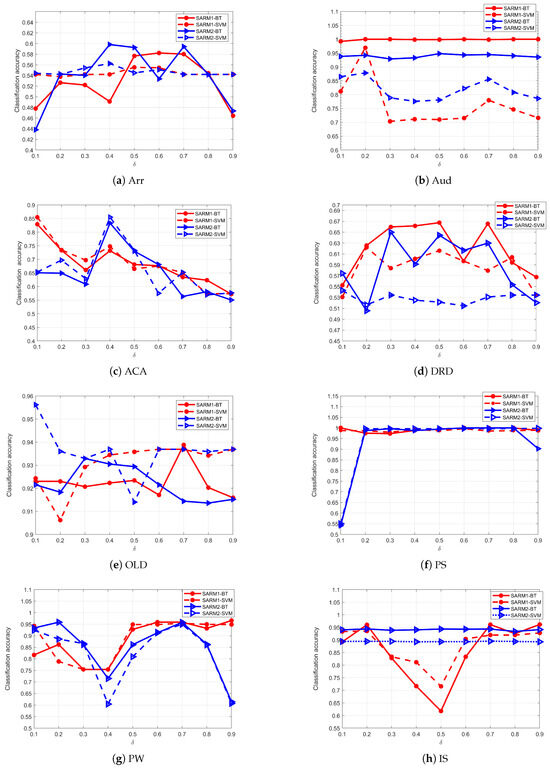
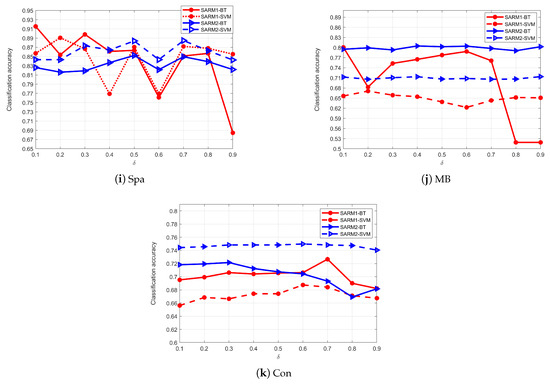
Figure 2.
The correlation between and accuracy.
Next, we need to verify whether SARM1 and SARM2 are more effective than other similar algorithms. Five algorithms are selected from some references for comparison with SARM1 and SARM2. Given the absence of directly comparable studies on p-MSVDIS, semi-supervised attribute selection algorithms and their related counterparts are selected for comparative analysis. The compared algorithms fall into three categories: (1) FSRS [15] and FSDIS [40] algorithms designed for set-valued information systems; (2) SADA [41] and FSFS [20] attribute selection algorithms specifically developed for p-MSVDIS; (3) the Semi2MNR [42] algorithm, a semi-supervised feature selection method based on the minimum neighborhood redundancy and maximum neighborhood relevance criteria.
All comparative algorithms are reimplemented and experimentally validated. The number of selected attributes by each algorithm is summarized in Table 5. The numbers in bold are the optimal values. The average number of attributes calculated by FSRS is the least, while that of SARM2 is the most. However, the PW dataset in FSRS displays 30, which is the same as the number of attributes in the original dataset, indicating that the algorithm is invalid for the dataset. Similarly, the Spa and Con datasets of FSRS are “—”, which means that there are no results. Because the computer ran out of memory when calculating the datasets, it could not continue. The average number of attributes of SARM1 and SARM2 is 7.64 and 8.27, respectively. Although the values are not excellent, they are close to those of other algorithms, and the average value of SARM1 is close to the best seven in FSRS. Consequently, we conclude that the attribute subset effect of the two proposed algorithms is acceptable.

Table 5.
Number of selected attributes.
Then, three classifiers are used for accuracy analysis based on the reduced subsets. Table 6, Table 7 and Table 8 present the comparative results of each algorithm under three different classifiers. Bold font indicates the optimal value. It can be seen from Table 6, Table 7 and Table 8 that SARM1 performed the best in a total of 18 out of these 33 experiments, while SARM2 performed the best 5 times. Notably, SARM1 outperformed all competitors, with sustained accuracy rates of 0.8518, 0.8015, and 0.8131 in the three classification frameworks.

Table 6.
Assessing the accuracy of classification with BT.

Table 7.
Assessing the accuracy of classification with SVM.

Table 8.
Assessing the accuracy of classification with KNN.
The experiments indicate that SARM1 in a p-MSVDIS outperforms the other algorithms in terms of accuracy. Of course, it is not enough to analyze the accuracy only; the Receiver Operating Characteristic (ROC) curve and Area Under Curve (AUC) must also be analyzed [43]. The ROC curve unites specificity and sensitivity via a graphic method, accurately reflecting their relationship. It is a comprehensive representative of classification accuracy. The ROC curve is a graph with the false-positive rate () on the horizontal axis and the true-positive rate () on the vertical axis. As the ROC curve approaches the upper left corner, the model’s performance improves because it indicates that a higher true-positive rate can be achieved while maintaining a low false-positive rate. The AUC represents the area under the ROC curve, serving as a quantitative measure of classifier performance. A higher AUC indicates superior classification performance. The ROC curves are depicted, accompanied by the calculated AUC values, in Figure 3 and Figure 4 and Table 9 and Table 10.
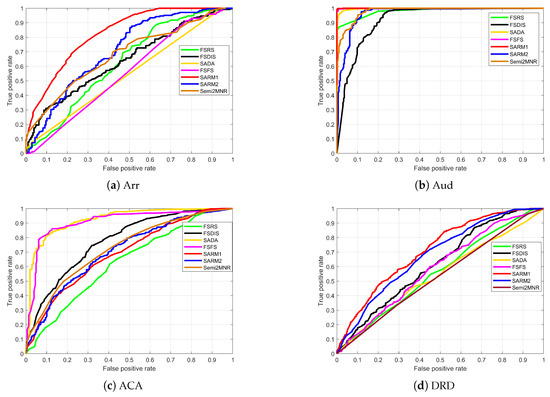
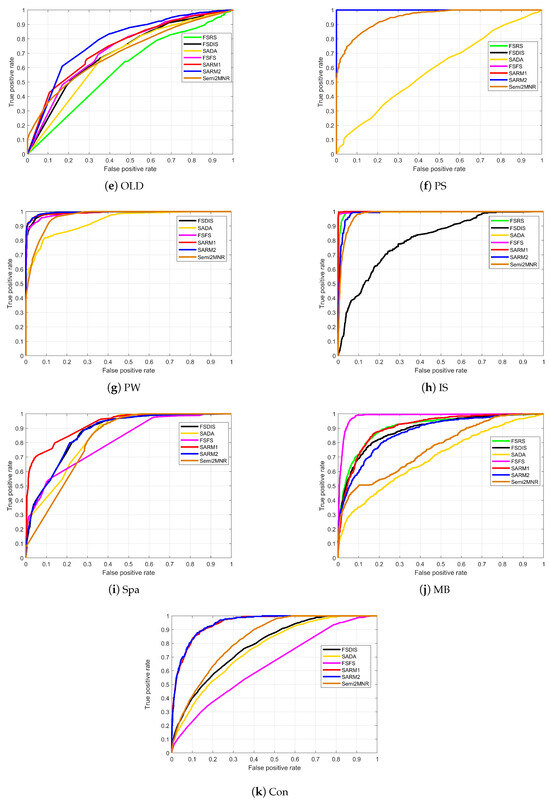
Figure 3.
ROC curve under classifier BT.
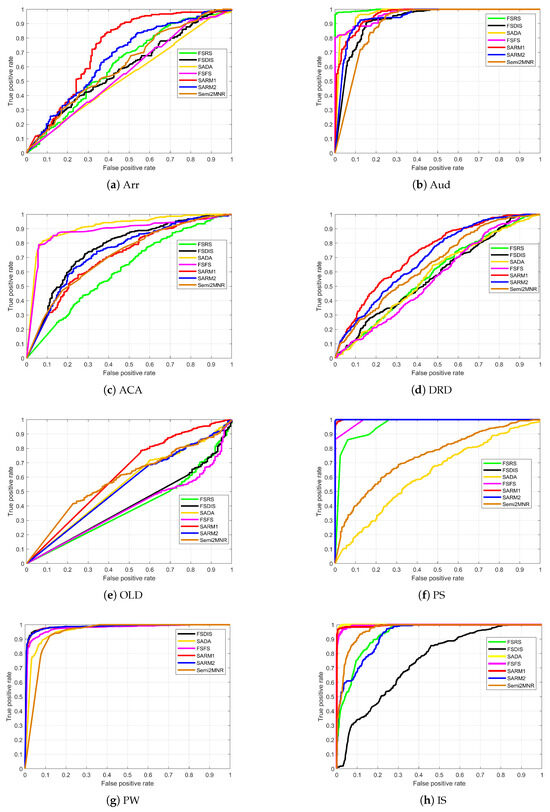
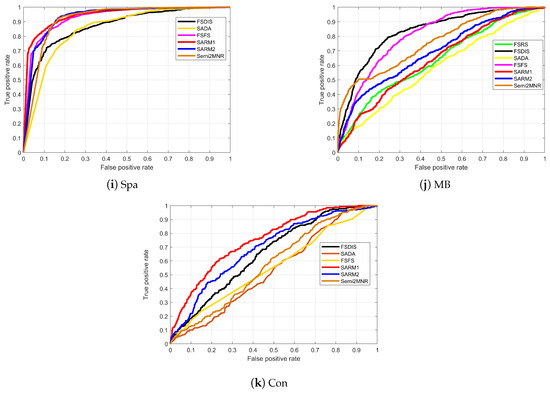
Figure 4.
ROC curve under classifier SVM.

Table 9.
AUC under classifier BT.

Table 10.
AUC under classifier SVM.
In Figure 3 and Figure 4, the red and blue lines represent SARM1 and SARM2, respectively. It can be seen that the red and blue lines in most of the subgraphs are closer to the upper horizontal border, which indicates that the algorithm in this study is significantly better. In subplots ACA and MB of Figure 3, the red and blue lines are not more convex relative to the frame than other lines, which is consistent with the calculated classification accuracy. The four curves in subplot PS of Figure 3 are overlapped, which shows that the classification effect of the four algorithms is very good. In the subplot OLD of Figure 4, the black, green, and magenta curves are concave, which indicates that the attribute subsets obtained by these three algorithms are poor and generate bad classification accuracy. Table 9 and Table 10 record the areas enclosed by the curves and x-axis in Figure 3 and Figure 4. As evident from the results, SARM1 consistently achieves optimal average AUC scores of 0.8855 and 0.8213 across different experimental conditions. By comparing Table 6 and Table 7 and Table 9 and Table 10, we find that the classification accuracy ranking of each algorithm aligns closely with the corresponding AUC value. This confirms that SARM1 and SARM2 do not suffer from significantly reduced accuracy due to the uneven distribution of samples.
Subsequently, computational time is adopted as an additional metric to evaluate algorithmic efficiency. Since FSRS failed to complete validation on datasets PW, Spa, and Con, the remaining available datasets are ultimately utilized for comparative efficiency analysis. As presented in Table 11 (unit: seconds), SARM1 demonstrated optimal time efficiency with an average execution time of merely 2.7914 s. SARM2 ranked second at 3.8629 s, while FSFS required substantially longer computation times (79.1526 s). These results confirm that SARM1 and SARM2 realize the dual optimization of classification accuracy and computational efficiency.

Table 11.
Comparison of computational speed (unit: seconds).
6.2. Statistical Analysis
Statistical analyses of the aforementioned results are described in this section. Further studies are required to determine whether SARM1 and SARM2 are more effective than other algorithms of this type. The Friedman test is applied to test the differences among the seven algorithms. The results of ranking the data in Table 6, Table 7 and Table 8 are shown in Table 12, Table 13 and Table 14. The data in Table 12, Table 13 and Table 14 were inputted into SPSS software for the Friedman test. Table 15 presents the calculation results. According to the data obtained by the three classifiers, the calculated p values are 0.0001, 0.00002, and 0.00006. When significance level is , then , , and . This indicates that significant differences exist among the seven algorithms.

Table 12.
The ranking of classification accuracies with BT.

Table 13.
The ranking of classification accuracies with SVM.

Table 14.
The ranking of classification accuracies with KNN.

Table 15.
Friedman test of experimental results under three classifiers.
Given the significant differences among these seven algorithms, it is necessary to conduct further tests to determine which performed best. The Nemenyi test is used for the post hoc test, which is required to calculate the critical range of the difference between the average order values. The domain value is calculated as follows: . Let ; then, from Tukey’s q table, we have . If seven algorithms and eleven datasets are known, then , and . The posterior results of these algorithms are plotted (see Figure 5). Subfigures (a), (b), and (c) in Figure 5 present the statistical analysis results based on the BT, SVM, and KNN classifiers, respectively. Figure 5 shows that the red and blue lines exhibit closer proximity to the y-axis compared to the other lines, indicating that the experimental results of SARM1 and SARM2 are better.
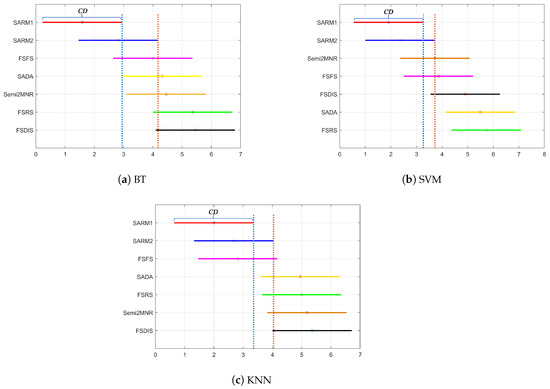
Figure 5.
Nemenyi test of experimental results under three classifiers.
From Figure 5a, the following conclusions are obtained:
- (a)
- The classification accuracy of SARM1 is significantly superior to SADA, Semi2MNR, FSRS, and FSDIS;
- (b)
- In terms of statistics, there is no significant difference among SARM1, SARM2, and FSFS;
- (c)
- There is no obvious difference among SARM2, FSFS, SADA, Semi2MNR, FSRS, and FSDIS.
From Figure 5b, we also obtain the following conclusions:
- (a)
- The classification accuracy of SARM1 is better than that of FSDIS, SADA, and FSRS;
- (b)
- SARM2 is significantly better than SADA and FSRS;
- (c)
- In terms of statistics, there is no significant difference among SARM1, SARM2, Semi2MNR, FSFS, and FSDIS.
From Figure 5c, we also obtain the following conclusions:
- (a)
- The classification accuracy of SARM1 is better than that of SADA, FSRS, Semi2MNR, and FSDIS;
- (b)
- In terms of statistics, there is no significant difference among SARM1, SARM2, and FSFS;
- (c)
- There is no significant difference among SARM2, FSFS, SADA, FSRS, Semi2MNR, and FSDIS.
Obviously, SARM1 realizes the best performance in the experiments under the three classifiers. Although the differences between SARM1, SARM2, Semi2MNR, and FSFS are statistically nonsignificant, SARM1 and SARM2 always rank first and second on average. In summary, we conclude that SARM1 and SARM2 are superior to other comparison algorithms.
6.3. Parameter Analysis
This section describes another parameter, , in SARM1 and SARM2. represents the rate of incomplete labels, and in the above experiments. In many real datasets, cannot be fixed to a value, and sometimes, only a small portion of labels is lost. We need to continue conducting experiments to explore the impact of on the attribute subsets. Given the initial condition, let in the algorithms; the reduced subsets are tested using the BT classifier. Let the incomplete rate , and the step size is 0.1. After executing the algorithms repeatedly, the reduced subsets are found on each value. The BT classifier is used to evaluate the subsets. Figure 6 displays the results. The red line indicates SARM1, and the blue line indicates SARM2. It can be seen from Figure 6 that the curves in most subgraphs are relatively stable and remain within a certain range except where they fluctuate slightly in the subgraph (Spa) and (MB). This indicates that no matter what value takes, the attribute subsets generated by SARM1 and SARM2 have little influence on the classification accuracy. Consequently, we can conclude that SARM1 and SARM2 exhibit relatively stable characteristics and effectiveness in a p-MSVDIS.
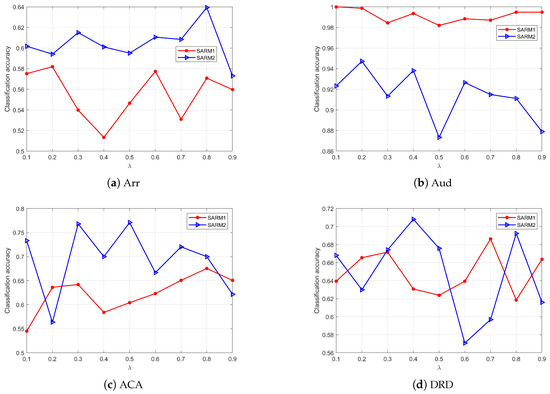
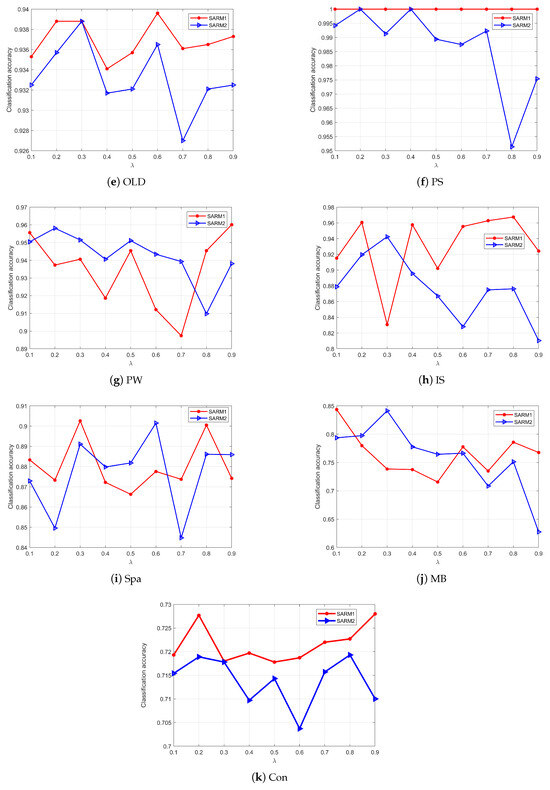
Figure 6.
The correlation between and accuracy with BT.
7. Conclusions
In this study, we presented semi-supervised attribute selection algorithms in a p-MSVDIS. First, a p-MSVDIS was divided into two multiset-valued decision information systems: l-MSVDIS and u-MSVDIS. Two uncertainty measurements on an attribute subset were then established using the concepts of indistinguishable relations, distinguishable relations, and dependence functions. According to the two proposed measurements, some theories and properties were proven, and two algorithms, namely SARM1 and SARM2, were provided for attribute selection. The incomplete label rate so as to evenly divide the system into two parts: l-MSVDIS and u-MSVDIS. In the experiment, five other algorithms of the same type were selected for comparison with SARM1 and SARM2, and 11 datasets, which were selected from UCI, were applied to examine the algorithms’ validity.
This study systematically evaluated SARM1 and SARM2 across 11 diverse datasets. The experimental results demonstrated that both algorithms achieved statistically significant improvements in computational efficiency (exhibiting the shortest average runtime) while simultaneously maintaining superior feature selection quality, outperforming baseline methods in classification accuracy across BT, SVM, and KNN classifiers (p < 0.05). Notably, SARM1 and SARM2 exhibited robust performance stability, as evidenced by consistently high AUC values during cross-dataset validation. These findings collectively indicate that the proposed algorithms possess inherent advantages in feature discriminability and model generalizability. Crucially, their enhanced computational efficiency was attained without compromising selection quality, demonstrating remarkable robustness against both data distribution variations and classifier selection.
While SARM1 and SARM2 demonstrate notable advantages in computational efficiency and accuracy, three key limitations warrant discussion: (1) Memory consumption scales linearly with sample size, potentially causing overflow when processing ultra-large datasets. (2) The parameter lacks theoretical selection criteria, requiring exhaustive grid search that increases time complexity. (3) Performance degradation occurs with low-quality input data, necessitating additional preprocessing modules. These identified constraints establish clear directions for future optimization, particularly in developing memory-efficient data streaming and automated hyperparameter tuning frameworks.
The algorithms discussed herein could benefit substantially from parallelization, potentially improving computational efficiency and reducing memory usage. However, their implementation would require careful management of output handling in parallel environments. We identify this as an important research direction worthy of methodical exploration in future studies. In future work, we plan to integrate approximation algorithms with parallel computing techniques to develop feature selection algorithms that achieve higher computational speed and lower memory consumption.
Author Contributions
Methodology and writing—original draft, Y.H.; methodology, editing, and investigation, J.H.; experiment and programming, H.L.; editing and investigation, Z.L. All authors have read and agreed to the published version of the manuscript.
Funding
This work is supported by Innovative Research on VR+Online Open Course–Research on the Model of Guangke Ideological and Political Course (2022ZXKC519), Doctoral Research of Guangdong University of Science and Technology (GKY-2024BSQDK-11), and Science Foundation in Guangdong University of Science and Technology (GKY-023KYZDK-1).
Informed Consent Statement
The data used or analyzed during the current study are available from the corresponding author after the paper is accepted for publication.
Data Availability Statement
The data presented in this study are openly available in Machine Learning Repository http://archive.ics.uci.edu/datasets, accessed on 20 January 2024.
Acknowledgments
The authors would like to thank the editors and the anonymous reviewers for their valuable comments and suggestions, which have helped immensely in improving the quality of the paper.
Conflicts of Interest
The authors declare that they have no conflicts of interest.
References
- Dai, J.H.; Xu, Q.; Wang, W.T.; Tian, H.W. Conditional entropy for incomplete decision systems and its application in data mining. Int. J. Gen. Syst. 2012, 41, 713–728. [Google Scholar] [CrossRef]
- Hempelmann, C.F.; Sakoglu, U.; Gurupur, V.P.; Jampana, S. An entropy-based evaluation method for knowledge bases of medical information systems. Expert Syst. Appl. 2016, 46, 262–273. [Google Scholar] [CrossRef]
- Wang, P.; Zhang, P.F.; Li, Z.W. A three-way decision method based on Gaussian kernel in a hybrid information system with images: An application in medical diagnosis. Appl. Soft Comput. 2019, 77, 734–749. [Google Scholar] [CrossRef]
- Navarrete, J.; Viejo, D.; Cazorla, M. Color smoothing for RGB-D data using entropy information. Appl. Soft Comput. 2016, 46, 361–380. [Google Scholar] [CrossRef]
- Cament, L.A.; Castillo, L.E.; Perez, J.P.; Galdames, F.J.; Perez, C.A. Fusion of local normalization and Gabor entropy weighted features for face identification. Pattern Recognit. 2014, 47, 568–577. [Google Scholar] [CrossRef]
- Swiniarski, R.W.; Skowron, A. Rough set methods in feature selection and recognition. Pattern Recognit. Lett. 2003, 24, 833–849. [Google Scholar] [CrossRef]
- Pawlak, Z. Rough sets. Int. J. Comput. Inf. Sci. 1982, 11, 341–356. [Google Scholar] [CrossRef]
- Guan, Y.Y.; Wang, H.K. Set-valued information systems. Inf. Sci. 2006, 176, 2507–2525. [Google Scholar] [CrossRef]
- Liang, J.Y.; Qian, Y.H. Information granules and entropy theory in information systems. Sci. China (Ser. F) 2008, 51, 1427–1444. [Google Scholar] [CrossRef]
- Qian, Y.H.; Liang, J.Y.; Wu, W.Z.; Dang, C.Y. Information granularity in fuzzy binary GrC model. IEEE Trans. Fuzzy Syst. 2011, 19, 253–264. [Google Scholar] [CrossRef]
- Dai, J.H.; Wang, W.T.; Xu, Q. An uncertainty measure for incomplete decision tables and its applications. IEEE Trans. Cybern. 2013, 43, 1277–1289. [Google Scholar] [CrossRef]
- Zhang, P.; Li, T.; Wang, G.; Luo, C.; Chen, H. Multi-source information fusion based on rough set theory: A review. Inf. Fusion 2021, 68, 85–117. [Google Scholar] [CrossRef]
- Yang, L.; Zhang, X.; Xu, W.; Sang, B. Multi-granulation rough sets and uncertainty measurement for multi-source fuzzy information system. Int. J. Fuzzy Syst. 2019, 21, 1919–1937. [Google Scholar] [CrossRef]
- Hu, Q.H.; Yu, D.R.; Liu, J.; Wu, C. Neighborhood rough set based heterogeneous feature subset selection. Inf. Sci. 2008, 178, 3577–3594. [Google Scholar] [CrossRef]
- Singh, S.; Shreevastava, S.; Som, T.; Somani, G. A fuzzy similarity-based rough set approach for attribute selection in set-valued information systems. Soft Comput. 2020, 24, 4675–4691. [Google Scholar] [CrossRef]
- Wang, Y.B.; Chen, X.J.; Dong, K. Attribute reduction via local conditional entropy. Int. J. Mach. Learn. Cybern. 2019, 10, 3619–3634. [Google Scholar] [CrossRef]
- Dai, J.H.; Hu, H.; Zheng, G.J.; Hu, Q.H.; Han, H.F.; Shi, H. Attribute reduction in interval-valued information systems based on information entropies. Front. Inf. Technol. Electron. Eng. 2016, 17, 919–928. [Google Scholar] [CrossRef]
- Wang, C.Z.; Huang, Y.; Shao, M.W.; Hu, Q.H.; Chen, D.G. Feature selection based on neighborhood self-information. IEEE Trans. Cybern. 2020, 50, 4031–4042. [Google Scholar] [CrossRef]
- Dai, J.H.; Liu, Q. Semi-supervised attribute reduction for interval data based on misclassification cost. Int. J. Mach. Learn. Cybern. 2022, 13, 1739–1750. [Google Scholar] [CrossRef]
- Liu, K.Y.; Yang, X.B.; Yu, H.L.; Mi, J.S.; Wang, P.X. Rough set based semi-supervised feature selection via ensemble selector. Knowl.-Based Syst. 2019, 165, 282–296. [Google Scholar] [CrossRef]
- Kim, K. An improved semi-supervised dimensionality reduction using feature weighting: Application to sentiment analysis. Expert Syst. Appl. 2018, 109, 49–65. [Google Scholar] [CrossRef]
- Li, Z.; Tang, J. Semi-supervised local feature selection for data classification. Sci. China (Ser. F) 2021, 64, 192108. [Google Scholar] [CrossRef]
- Zhang, W.; Miao, D.Q.; Gao, C.; Li, F. Semi-supervised attribute reduction based on rough-subspace ensemble learning. J. Chin. Comput. Syst. 2016, 37, 2727–2732. [Google Scholar]
- Ma, M.H.; Deng, T.Q.; Wang, N.; Chen, Y.M. Semi-supervised rough fuzzy Laplacian Eigenmaps for dimensionality reduction. Int. J. Mach. Learn. Cybern. 2019, 10, 397–411. [Google Scholar] [CrossRef]
- Han, Y.H.; Yang, Y.; Yan, Y.; Ma, Z.G.; Zhou, X.F. Semisupervised feature selection via spline regression for video semantic recognition. IEEE Trans. Neural Netw. Learn. Syst. 2015, 26, 252–264. [Google Scholar]
- Moslemi, A.; Ahmadian, A. Subspace learning for feature selection via rank revealing QR factorization: Fast feature selection. Expert Syst. Appl. 2024, 256, 124919. [Google Scholar] [CrossRef]
- Bohrer, J.D.S.; Dorn, M. Enhancing classification with hybrid feature selection: A multi-objective genetic algorithm for high-dimensional data. Expert Syst. Appl. 2024, 255, 124518. [Google Scholar] [CrossRef]
- Sheikhpour, R.; Mohammadi, M.; Berahmand, K.; Movahed, F.S.; Khosravi, H. Robust semi-supervised multi-label feature selection based on shared subspace and manifold learning. Inf. Sci. 2025, 699, 121800. [Google Scholar] [CrossRef]
- Sheikhpour, R.; Berahmand, K.; Mohammadi, M.; Khosravi, H. Sparse feature selection using hypergraph Laplacian-based semi-supervised discriminant analysis. Pattern Recognit. 2025, 157, 110882. [Google Scholar] [CrossRef]
- Liu, K.Y.; Yang, X.B.; Ding, W.P.; Ju, H.R.; Li, T.R.; Wang, J.; Yin, T.Y. A survey on rough feature selection: Recent advances and challenges. IEEE/CAA J. Autom. Sin. 2025, 12, 125231. [Google Scholar]
- Saberi-Movahed, F.; Berahman, K.; Sheikhpour, R.; Li, Y.F.; Pan, S. Nonnegative matrix factorization in dimensionality reduction: A survey. arXiv 2024, arXiv:2405.03615. [Google Scholar]
- Yao, Y.Y. Information granulation and rough set approximation. Int. J. Intell. Syst. 2001, 16, 87–104. [Google Scholar] [CrossRef]
- Miyamoto, S. Information clustering based on fuzzy multisets. Inf. Process. Manag. 2003, 39, 195–213. [Google Scholar] [CrossRef]
- Zhao, X.R.; Hu, B.Q. Three-way decisions with decision-theoretic rough sets in multiset-valued information tables. Inf. Sci. 2020, 507, 684–699. [Google Scholar] [CrossRef]
- Jena, S.P.; Ghosh, S.K.; Tripathy, B.K. On the theory of bags and lists. Inf. Sci. 2001, 132, 241–254. [Google Scholar] [CrossRef]
- Nikulin, M.S. Hellinger distance, in Hazewinkel, Michiel, Encyclopedia of Mathematics; Springer Science: Berlin/Heidelberg, Germany, 2001; ISBN 978–1-55608-010-4. [Google Scholar]
- Huang, D.; Lin, H.; Li, Z.W. Information structures in a multiset-valued information system with application to uncertainty measurement. J. Intell. Fuzzy Syst. 2022, 43, 7447–7469. [Google Scholar] [CrossRef]
- Kryszkiewicz, M. Rules in incomplete information systems. Inf. Sci. 1999, 113, 271–292. [Google Scholar] [CrossRef]
- UCI Machine Learning Repository. Available online: http://archive.ics.uci.edu/datasets (accessed on 20 January 2024).
- Ahmed, W.; Sufyan, M.M.B.; Ahmad, T. Entropy based feature selection for fuzzy set-valued information systems. 3D Res. 2018, 9, 1–17. [Google Scholar] [CrossRef]
- Zhong, W.C.; Chen, X.J.; Nie, F.P.; Huang, J.Z. Adaptive discriminant analysis for semi-supervised feature selection. Inf. Sci. 2021, 566, 178–194. [Google Scholar] [CrossRef]
- Qian, D.; Liu, K.; Zhang, S.; Yang, X. Semi-supervised feature selection by minimum neighborhood redundancy and maximum neighborhood relevancy. Appl. Intell. 2024, 54, 7750–7764. [Google Scholar] [CrossRef]
- Narkhede, S. Understanding auc-roc curve. Towards Data Sci. 2018, 26, 220–227. [Google Scholar]
Disclaimer/Publisher’s Note: The statements, opinions and data contained in all publications are solely those of the individual author(s) and contributor(s) and not of MDPI and/or the editor(s). MDPI and/or the editor(s) disclaim responsibility for any injury to people or property resulting from any ideas, methods, instructions or products referred to in the content. |
© 2025 by the authors. Licensee MDPI, Basel, Switzerland. This article is an open access article distributed under the terms and conditions of the Creative Commons Attribution (CC BY) license (https://creativecommons.org/licenses/by/4.0/).