Article

Emphasizing Grey Systems Contribution to Decision-Making Field Under Uncertainty: A Global Bibliometric Exploration

1
Department of Economic Informatics and Cybernetics, Bucharest University of Economic Studies, 0105552 Bucharest, Romania
2
Department of Accounting and Audit, Bucharest University of Economic Studies, 010552 Bucharest, Romania
*
Author to whom correspondence should be addressed.
Mathematics 2025, 13(8), 1278; https://doi.org/10.3390/math13081278
Submission received: 26 March 2025 / Revised: 8 April 2025 / Accepted: 11 April 2025 / Published: 13 April 2025
(This article belongs to the Special Issue Advanced Intelligent Algorithms for Decision Making under Uncertainty)

Abstract

:
Grey systems are applied in numerous domains, proving a high efficiency in predicting and investigating complex systems, where data is insufficient, unknown, or partially known. The systems have a strong contribution in the decision-making field under uncertainty, by identifying the connection between variables and optimizing the process of choosing the strategies. With time, the methods offered by the grey systems theory have faced a continuous adoption process in various research fields associated with decision-making. In this context, this paper aims to provide an in-depth bibliometric exploration, focusing on a filtered dataset, gathered from Clarivate Analytics’ Web of Science Core Collection database (WoS) for the purpose of better highlighting the adoption process faced by grey systems theory in the decision-making field under uncertainty. Based on the extracted dataset, the value registered for the annual growth rate is 17.1%, proving that the scientific community’s focus in this field is significant, and it has maintained academics’ interest for a long time. Also, the results of the bibliometric analysis showed that the Journal of Grey System was the most relevant source, while Sifeng Liu provided the greatest contribution to the field based on the number of published papers. Nanjing University of Aeronautics and Astronautics is ranked first in the top of most relevant affiliation based on the number of published papers, while China—the homeland of grey systems theory—assumes the leading contributor country place. The review of the top 10 most cited papers revealed the advantages of using grey systems theory in decision-making field under uncertainty.
MSC:
62-07; 90B50; 91B06; 93A30

1. Introduction

Decision-making problems are a type of problem dealing with selecting the best course of action when considering a set of criteria, from a given set of alternatives [1]. In order to address this type of problem, a series of methods have been used over time, by considering various theories. Among these theories, in this paper, the focus is on grey systems theory solutions for decision-making problems.
Even though grey systems theory shares a series of elements that bring it closer to the fuzzy systems, it shall be mentioned that in terms of solving decision-making problems, various differences occur. While fuzzy systems address ambiguity and vagueness in data, offering a decision-making solution based on the membership functions, grey systems theory addresses uncertainty from incomplete and insufficient data, offering methods to predict and decide when confronted with this limitation. Furthermore, while fuzzy involves rule-based inference processes, grey systems rely on prediction models and comparative analysis to deal with grey data. Moreover, fuzzy systems are mostly used in cases of data that is inherently subjective, while grey systems perform better in cases in which data is incomplete or sparse [2,3]. We invite the reader to consider various decision-making papers solved through the use of the two theories, fuzzy systems [4,5,6,7,8] and grey systems theory [9,10,11,12], for a better comparison between the two theories.
“Grey systems” was used, in the form well known nowadays to researchers worldwide, for the first time in an article published in March 1982, by Deng JL [13], where the author provided some general details about this type of system, and indicated that it originates from the “black box” concept. By using neutral colors, the scientist wanted to distinguish between the following three types of systems:
  • “black system”—a system where all data is unknown
  • “white system”—a system where all data is known
  • “grey system”—a system with both known and unknown data (incomplete information)
Apart from these, the professor also explained that a “grey matrix” is a matrix that has some known properties, and others unknown. Aspects such as controllability and stability are also demonstrated in the research paper using mathematical approaches [13].
From that moment onwards, this domain has attracted the attention of many scientists who further explored the concept and contributed to the scientific community with many papers, written across different topics [2,14,15,16,17].
As Javanmardi and Liu [16] stated, grey systems theory is a complex domain, and poor information could be the cause of a deficiency of human understanding regarding the implications. Due to the lack of information and understanding of humans, knowledge remains incomplete, and uncertainty has a crucial impact, especially in socio-economic systems. It shall be noted that the uncertainty comes from a series of factors such as personal subjective patterns, random behavior, ability for innovation, etc. [18].
Furthermore, as Javanmardi et al. [19] underlined, grey systems theory offers solutions to solving complex and uncertain problems, in sustainability, economic, environmental, or social systems. The advantage of grey systems theory is that it does not require classification rules, and is very efficient in sustainability calculations [19]. As a result of the research, the authors identified 10 major domains where grey systems theory has successfully been implemented, starting with sustainability assessment, followed by urban sustainability, industrial sustainability, business sustainability, social sustainability, tourism sustainability, agriculture sustainability, sustainable products, energy sustainability, and sustainability development.
Another advantage provided by the grey systems theory relies in the existence of a dynamic group of researchers involved in the grey systems theory adoption worldwide, which provide materials—such as explanatory papers of various aspects related to grey systems theory (e.g., grey models used in decision-making [20], grey numbers and its operations [21], grey forecasting models [22], grey incidence analysis models [23], grey clustering evaluation models” [24], terms of concepts and fundamental principles of grey systems [25], sequence operators and grey data mining [26]), or specialized books which discuss the advancements in this field [27,28,29,30,31,32,33], as well as two dedicated supporting journals and a series of international associations (e.g., International Association of Grey Systems and Decision Sciences (IAGSUA), Grey Systems Society of China (GSSC), Grey Systems Society of Pakistan (GSSP), Polish Scientific Society of Grey Systems (PSGS), Chinese Grey System Association (CGSA), Grey Systems Committee (IEEE Systems, Man, and Cybernetics Society), Centre for Computational Intelligence (De Montfort University), etc. [34,35,36,37,38]).
In order to provide an overview of the broad range of applications that have been solved over time through the use of the grey systems theory, especially in the area of decision-making, in the following, a series of papers have been extracted from scientific literature and briefly discussed. For example, referring to the papers written during the recent pandemic, the works of Toan et al. [39] and Shekhawat et al. [40] can be mentioned. Thus, after observing the impact that the COVID-19 pandemic had on the education sector, Toan et al. [39] conducted research about a multi-criteria decision-making (MCDM) problem, more specifically the efficient selection of e-learning platforms. By combining two popular methods, the grey analytic hierarchy process (G-AHP) and the grey technique for order preference by similarity to ideal solution (G-TOPSIS), the authors evaluated the e-learning platforms, taking into consideration multiple factors. Moreover, Shekhawat et al. [40] are oriented to the healthcare sector during a crisis situation, namely the COVID-19 virus’ spread prediction when information is incomplete, or partially known. The first part of the research paper is dedicated to the Cubic Polynomial-based simple grey model, and after that, there were used two Rolling horizon-based Cubic Grey Models (RCGMs) involving a series of data from distinct places in the proposed case study. The results showed greater efficiency compared to traditional approaches and the findings exposed here can help authorities in making better decisions in the outbreaks’ time.
In terms of urban-rural integration, Rao and Gao [41] present a new assessment method based on grey systems theory. The authors considered different factors (spatial, economic, social, and living environment), and used entropy weight, ranking algorithms, and an improved technique for order of preference by similarity to the ideal solution (TOPSIS) for China’s Hubei Province evaluation. Based on the findings, the authors suggested some strategies and policy recommendations for enhancing urban-rural integration. Furthermore, with the occurrence of the machine learning models and their wide use over multiple fields, Saxena et al. [42] investigated how grey machine learning models can improve the prediction accuracy of some sustainable development factors (CO2 emissions, consumption, and power generation), using augmented crow search algorithm (ACSA). Multiple case studies were involved, mathematical computations were presented, and the results demonstrated that the proposed approach outperforms traditional methods.
As can be observed, the mentioned papers represent some examples from academic literature that highlight the importance and the high contribution that grey systems have on decision-making under uncertainty, in complex systems with incomplete information, and during crisis situations.
By reviewing the current scientific literature, it is observed that the interest in conducting bibliometric studies around this topic is substantial. For instance, diverse partnerships and contributions to the scientific literature have been identified through the use of various bibliometric investigations oriented towards grey systems’ applications in economics and social sciences [43], economics and education [44], and supplier selection [1]. Nevertheless, Tao et al. [45] focused on grey systems’ impact on the engineering sector, while Jiang et al. [46] concentrated on the supply chain. Table 1 provides a summary of the previous bibliometric works featuring grey systems theory. As can be observed, all the listed studies have used WoS as their database due to its relevance to the academic community. In terms of software, it has been observed that either CiteSpace or Biblioshiny have been among the selected programs for conducting bibliometric analysis due to the features they offer in terms of analysis. Thus, we shall state that, to the best of our knowledge, so far, no bibliometric analysis has been conducted in the area of grey systems theory usage for decision-making under uncertainty, an area of crucial interest due to its real-world applicability and contribution to risk management assessment and scientific advancement.
Having all this in mind, this study aims to provide a comprehensive overview of the domain associated with grey systems and decision-making, focusing on the contribution that this technique has on making choices and selecting the best strategies for each sector, under uncertain circumstances. The answers to the below questions, but not limited to them, will be provided in this manuscript:
  • Q1. What is the impact and relevance of the papers related to grey systems and the decision-making field under uncertainty in the academic community? What details about the annual scientific production and citations are exposed?
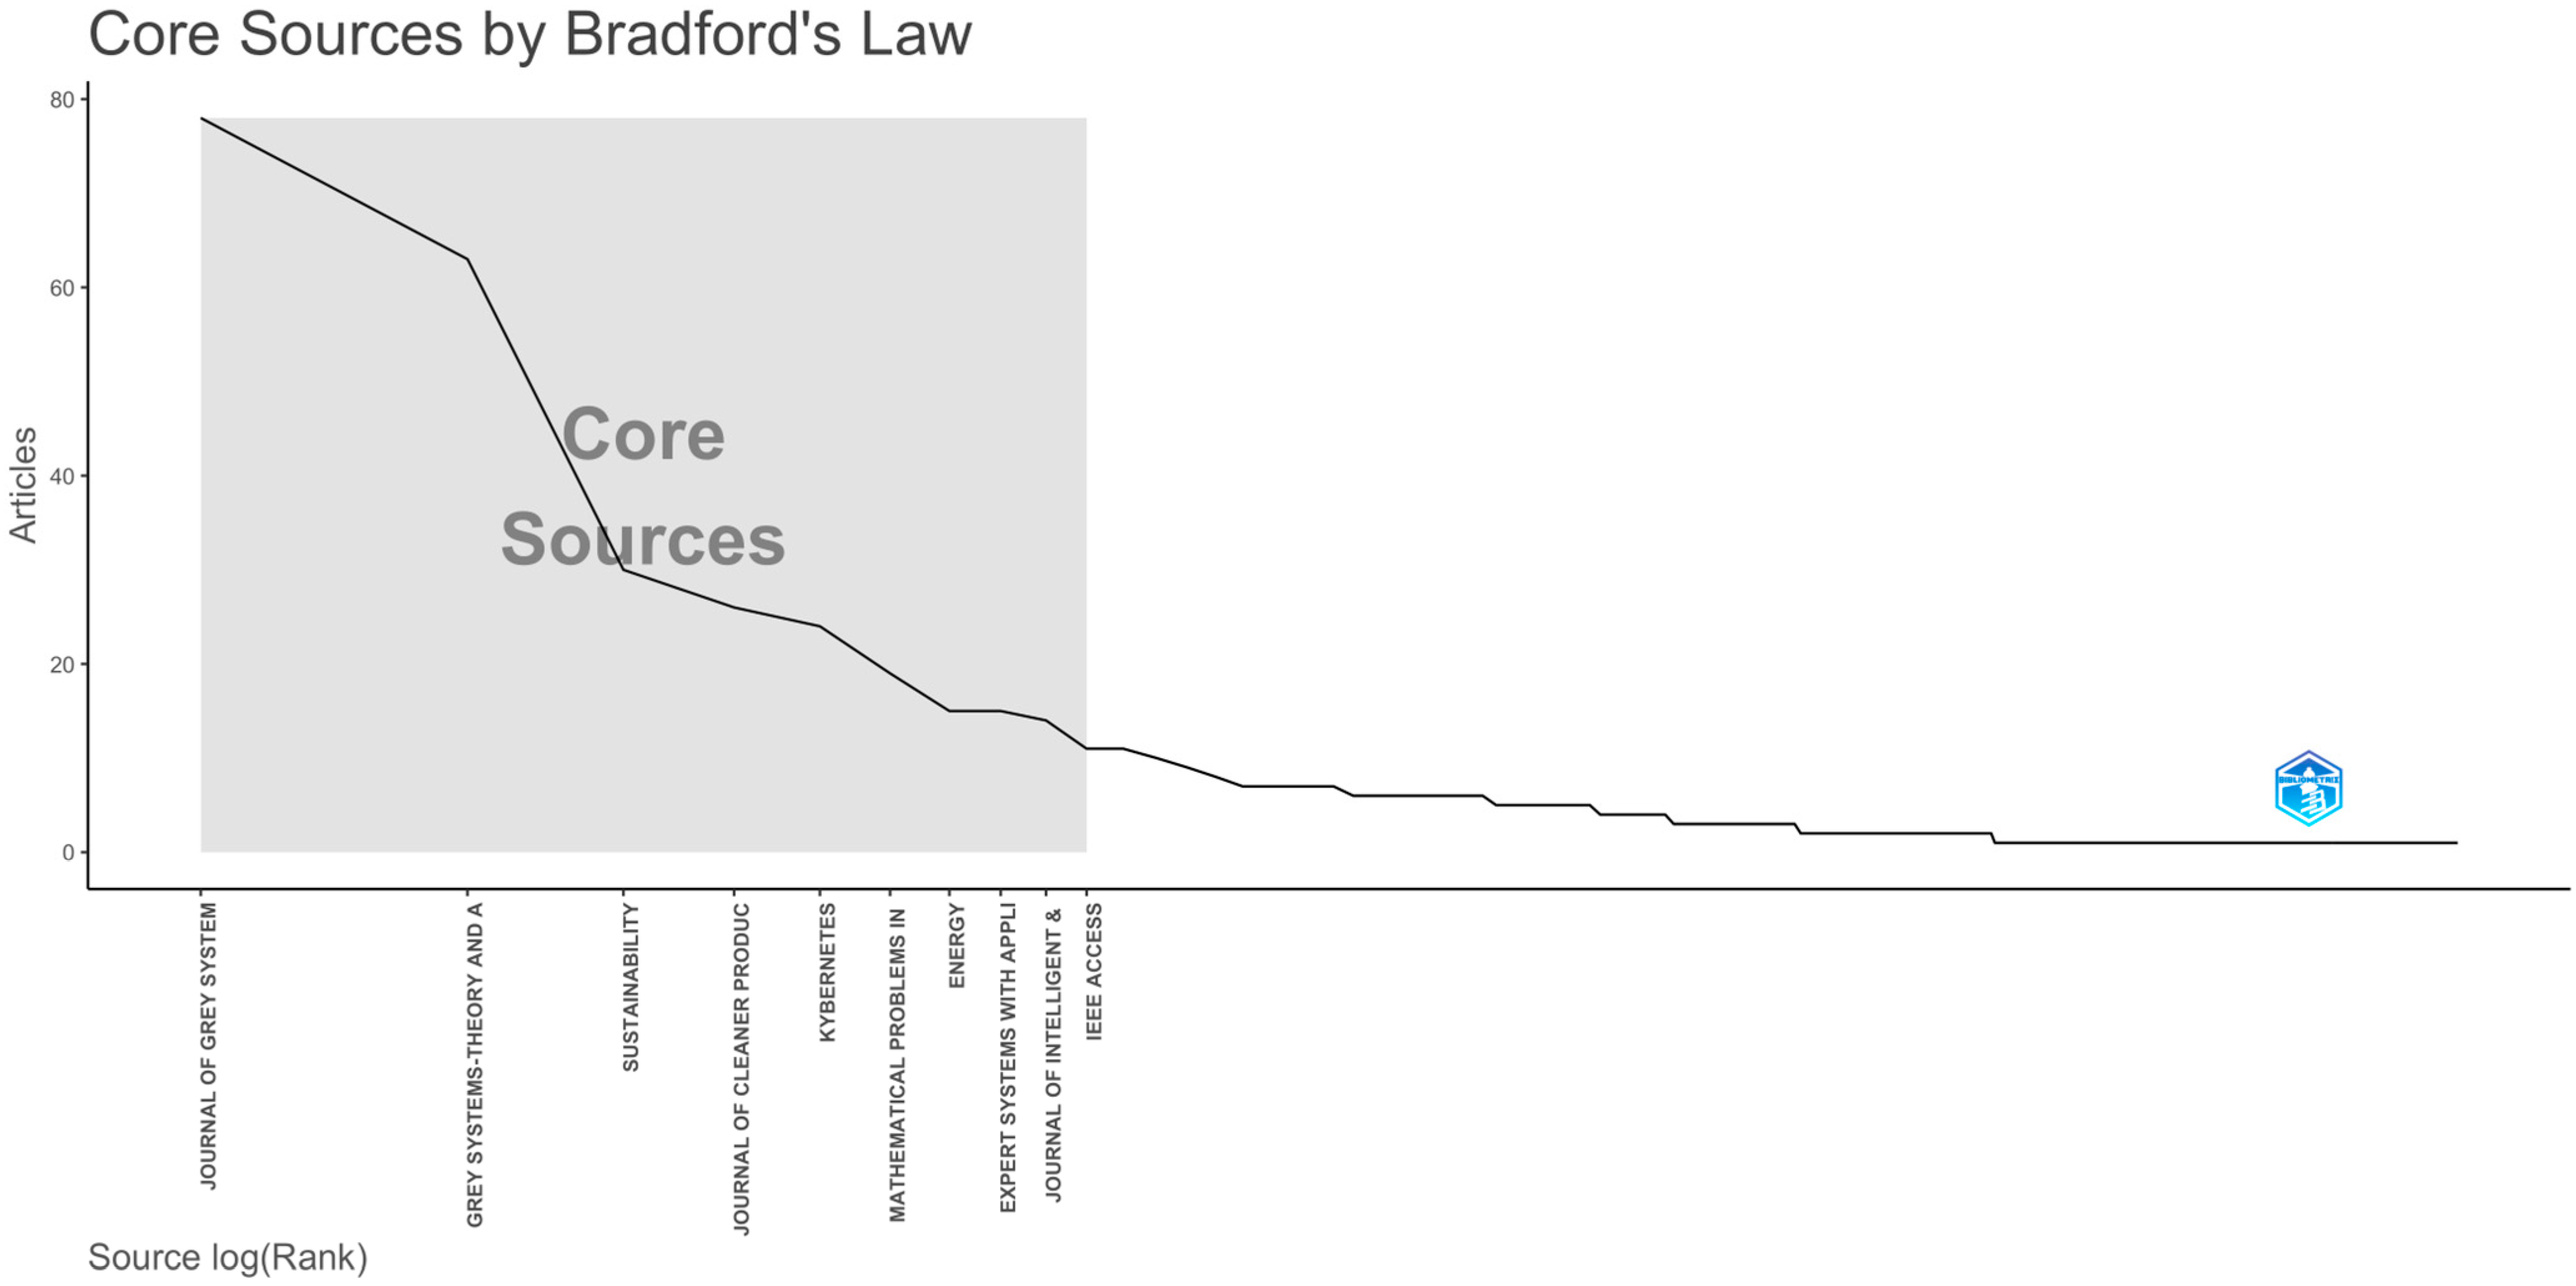
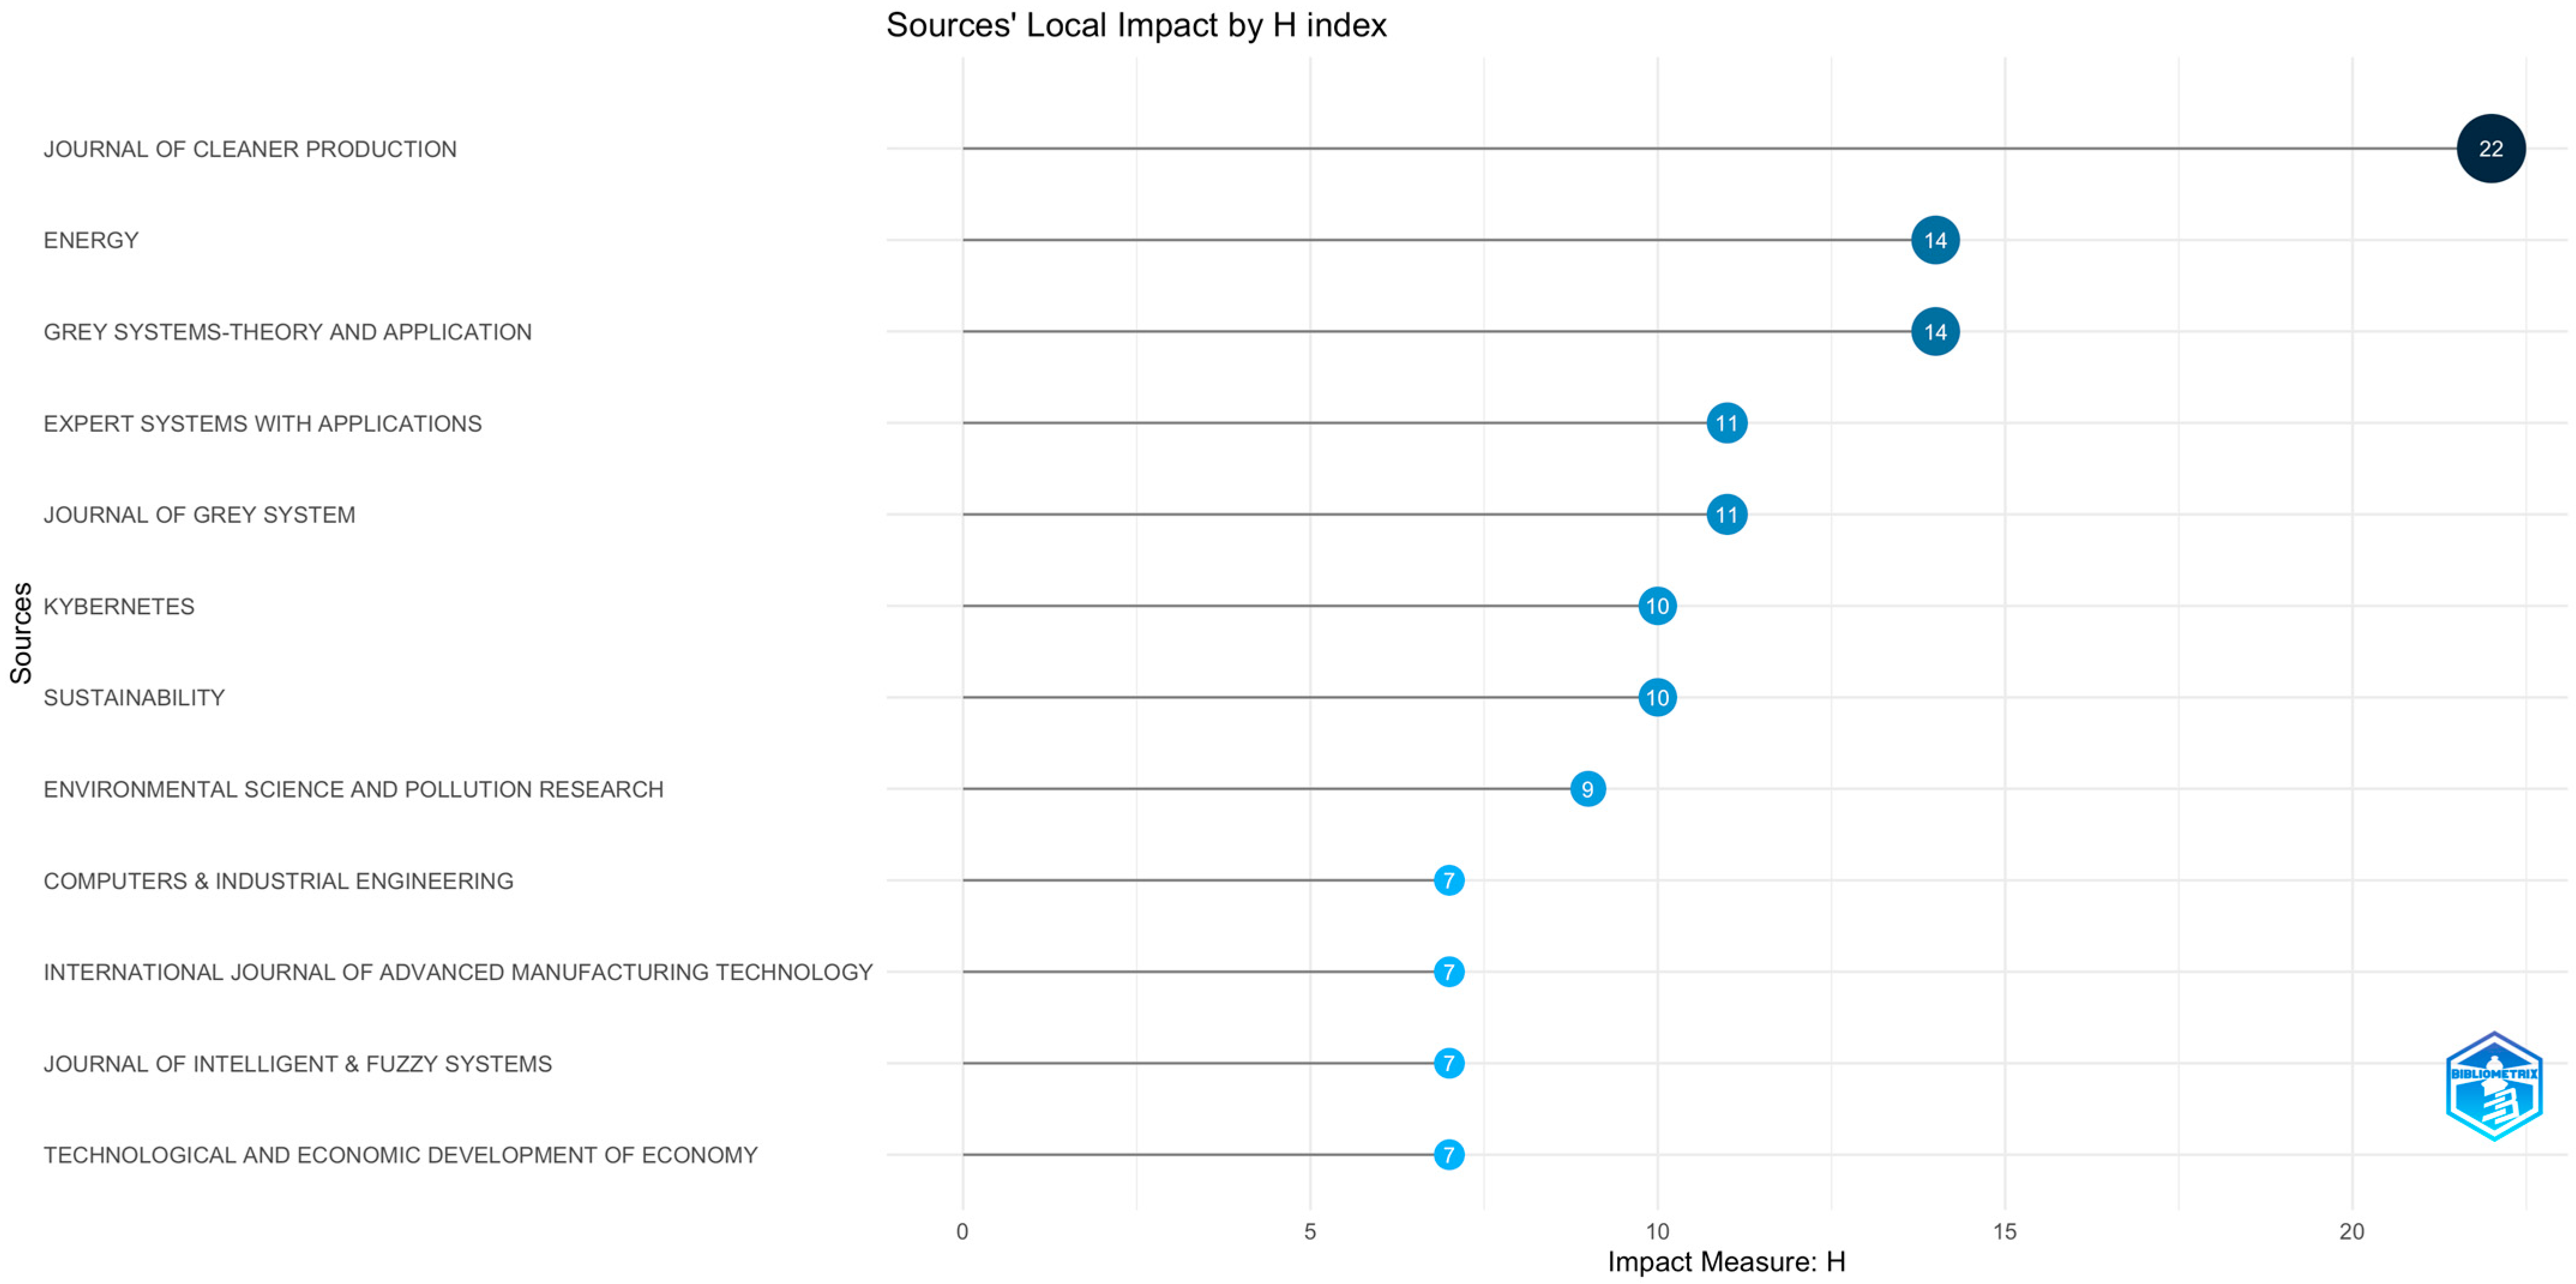
  • Q2. Which are the most relevant sources considering the number of published papers, and what is discovered based on Bradford’s law on source clustering and H-index analyses? How can the journals’ growth be characterized?
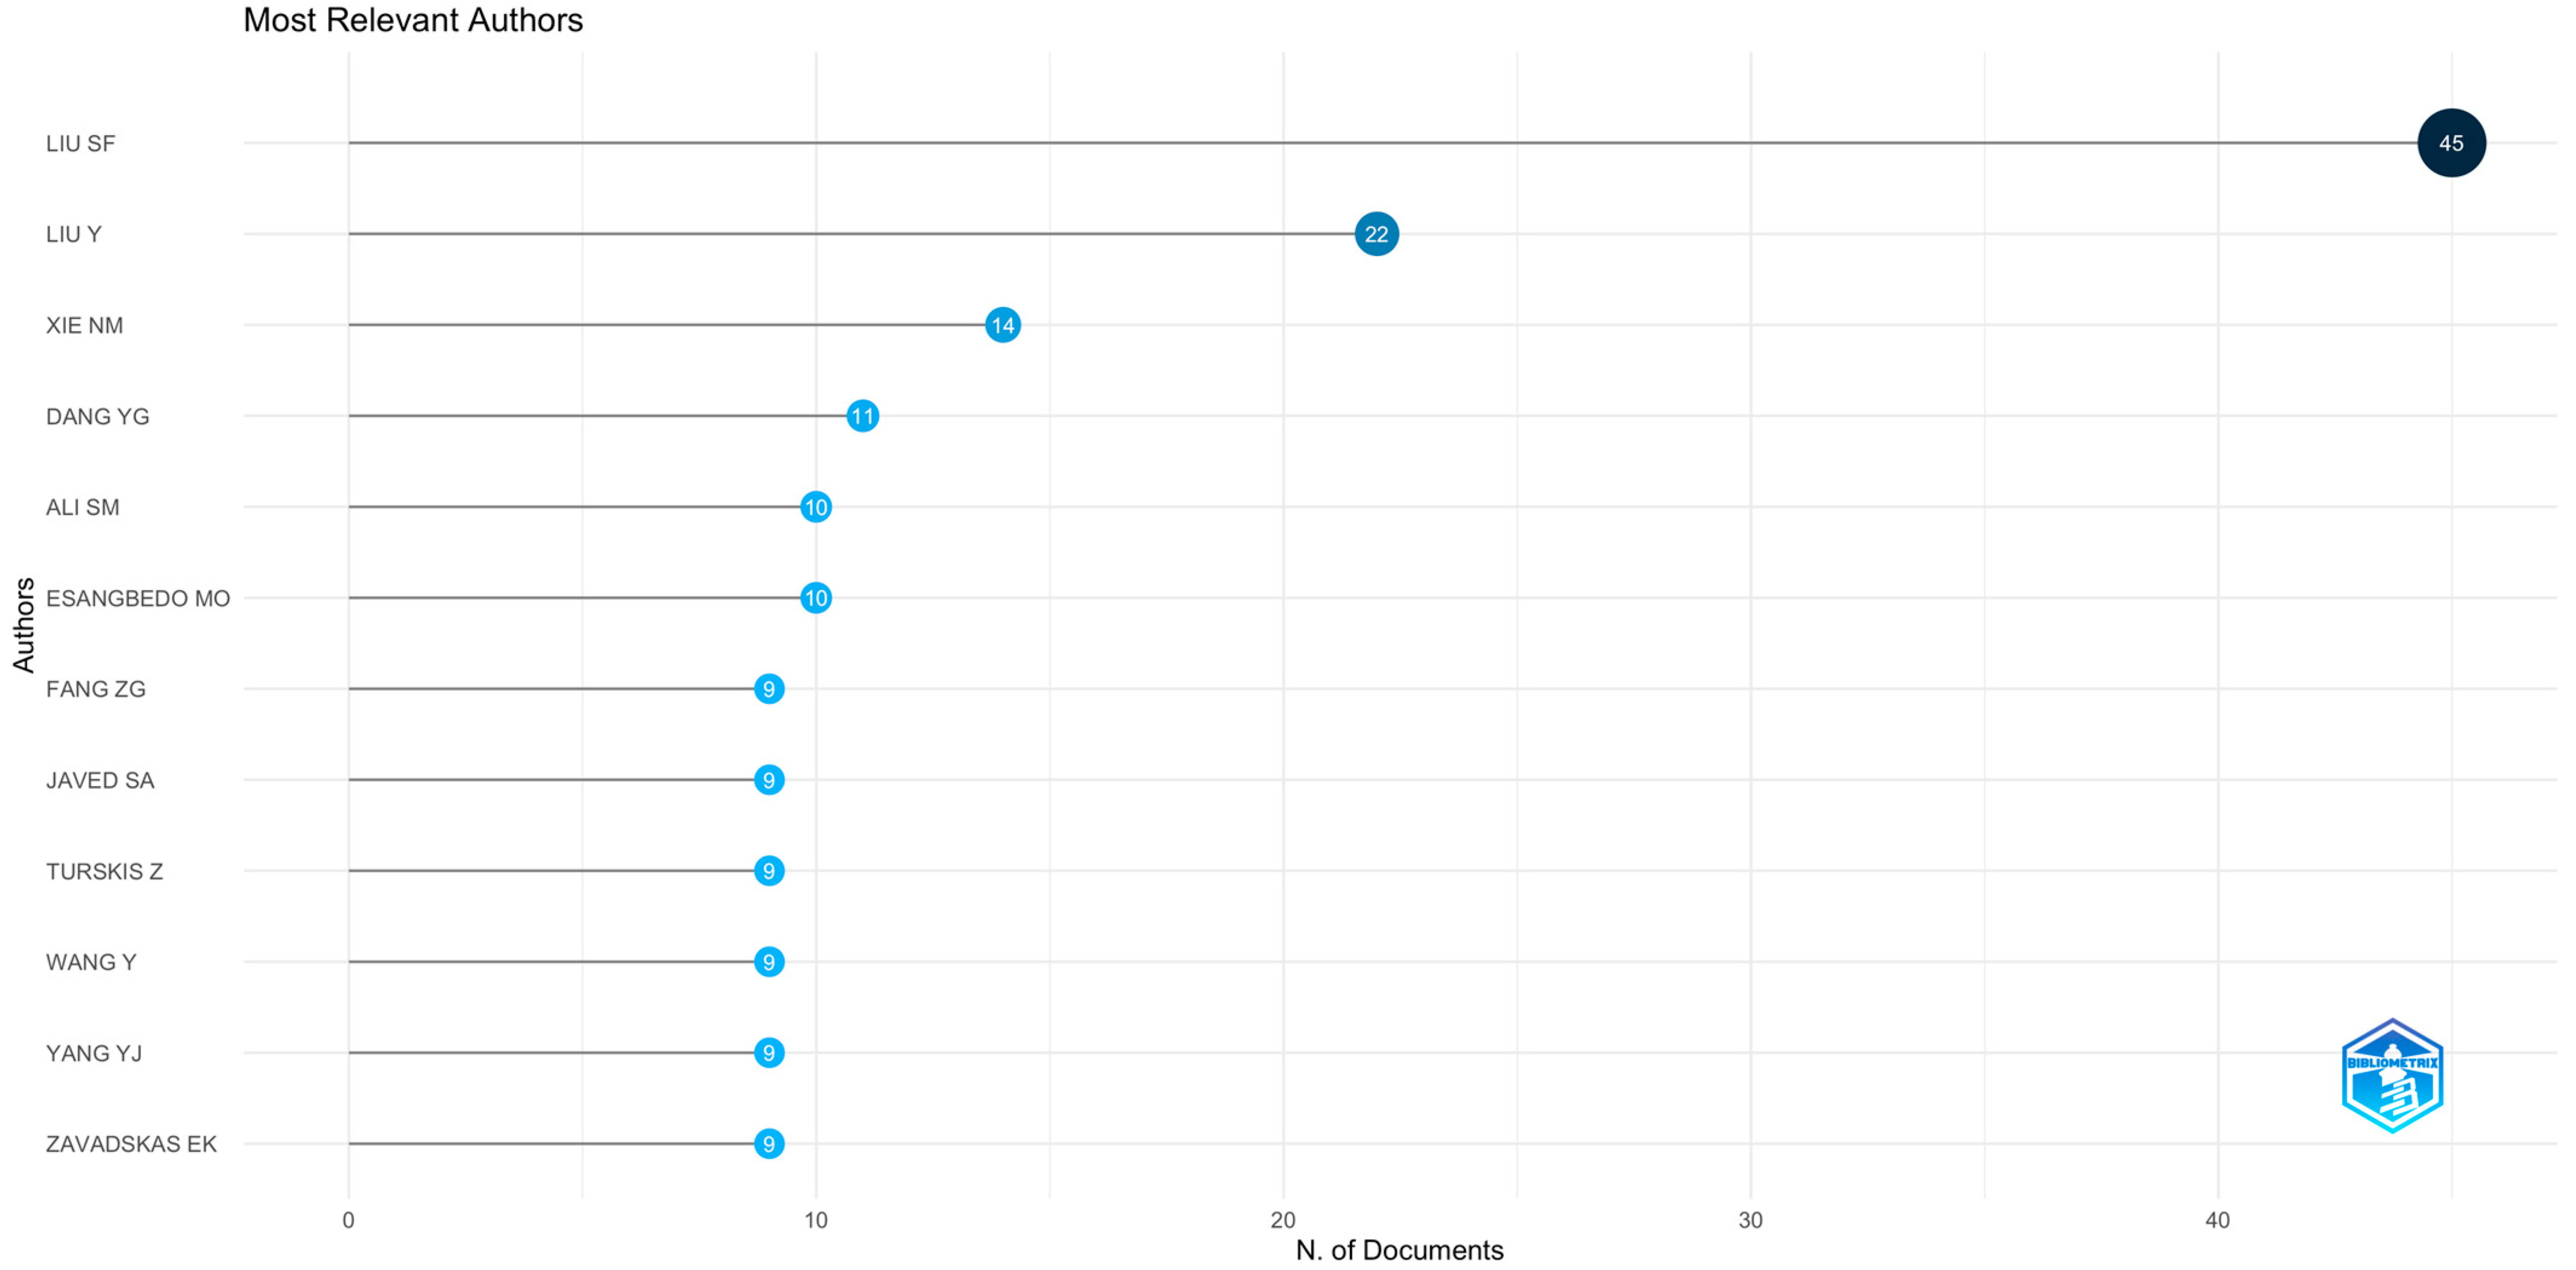
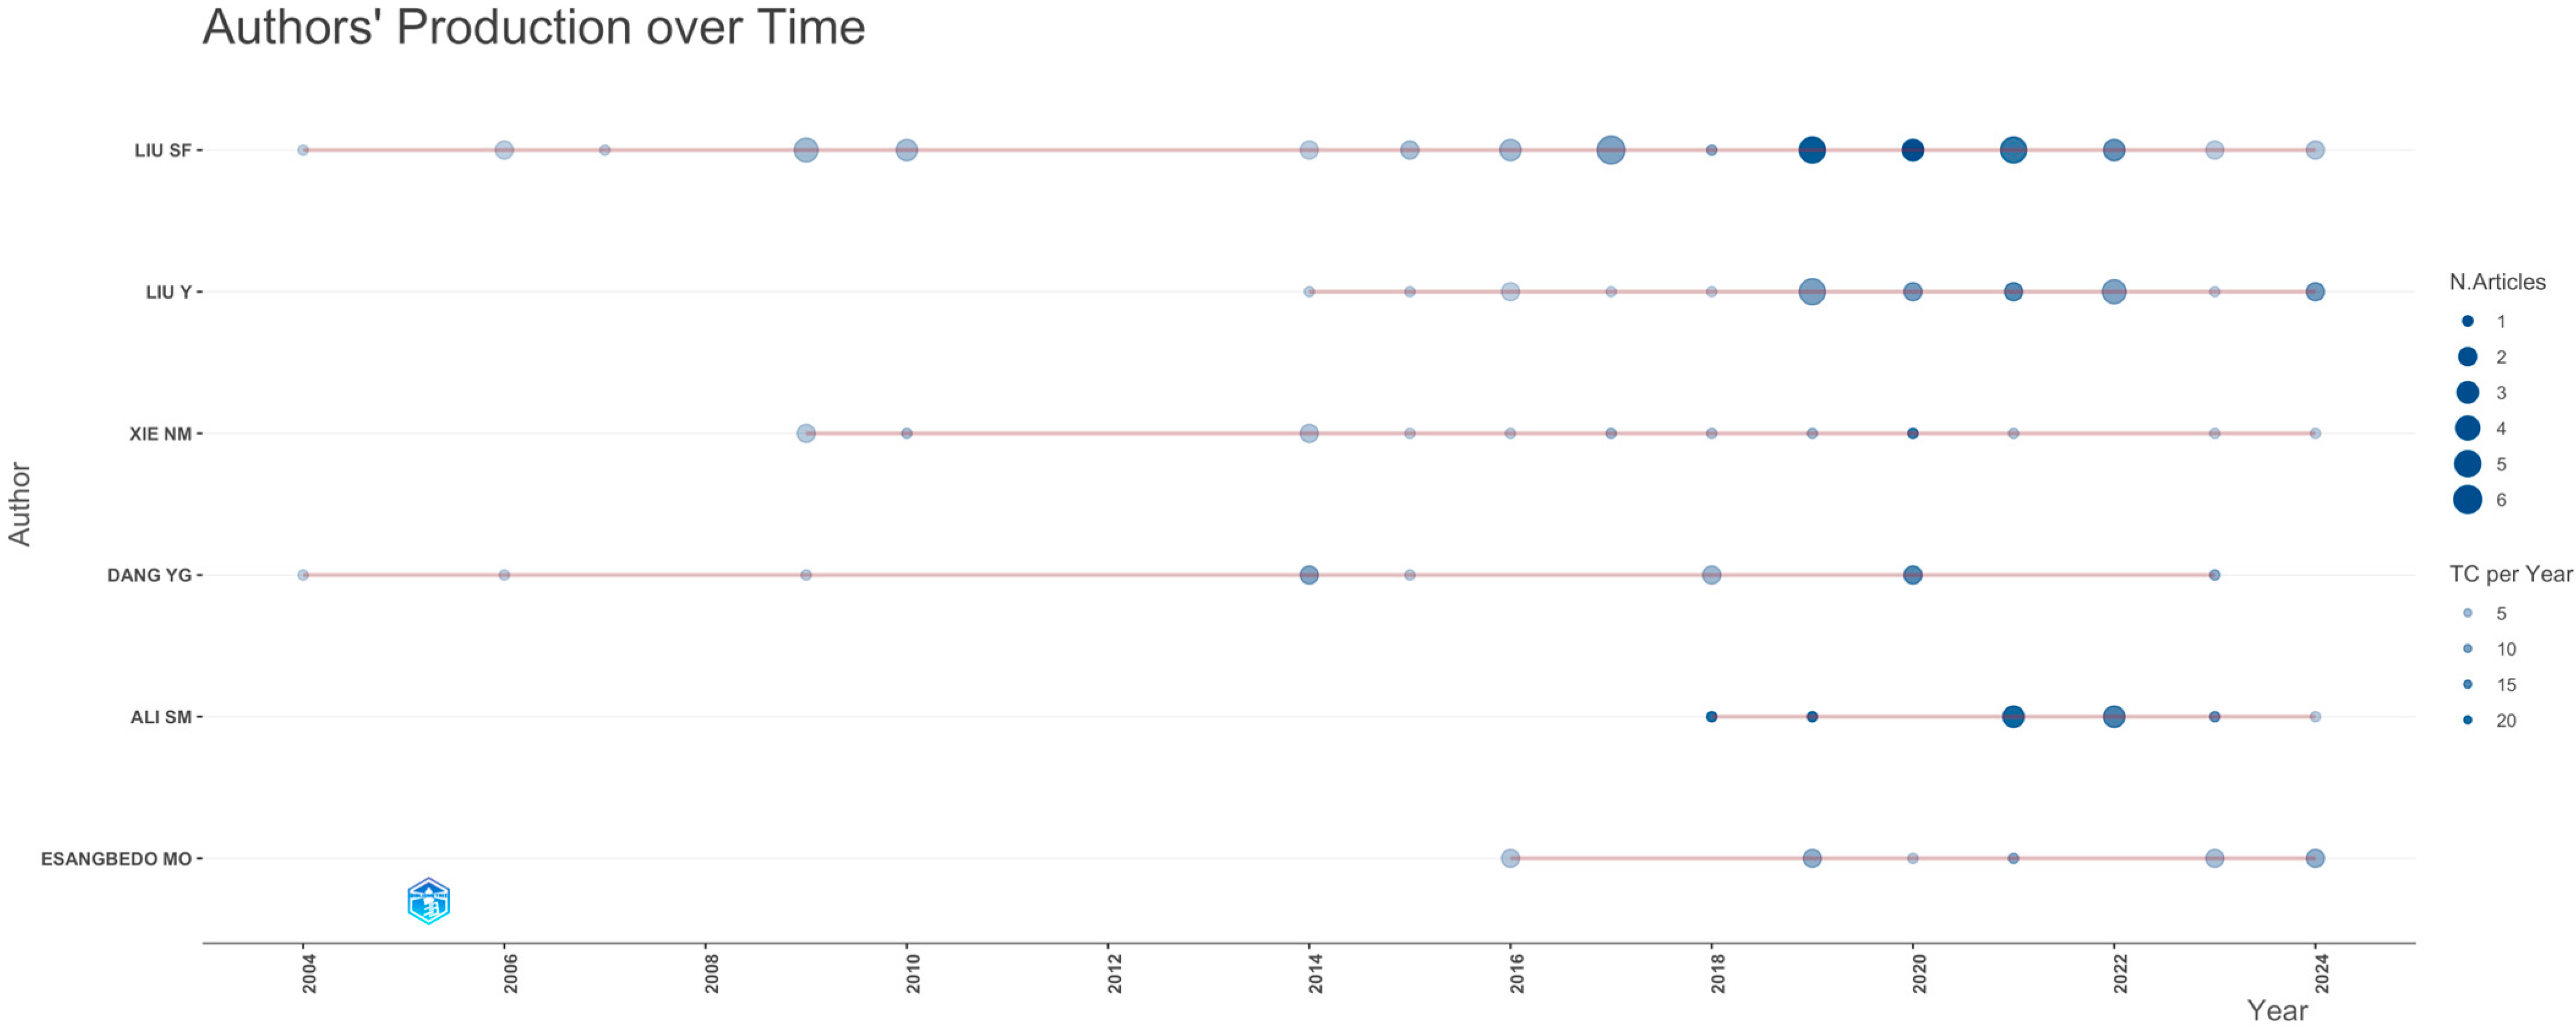
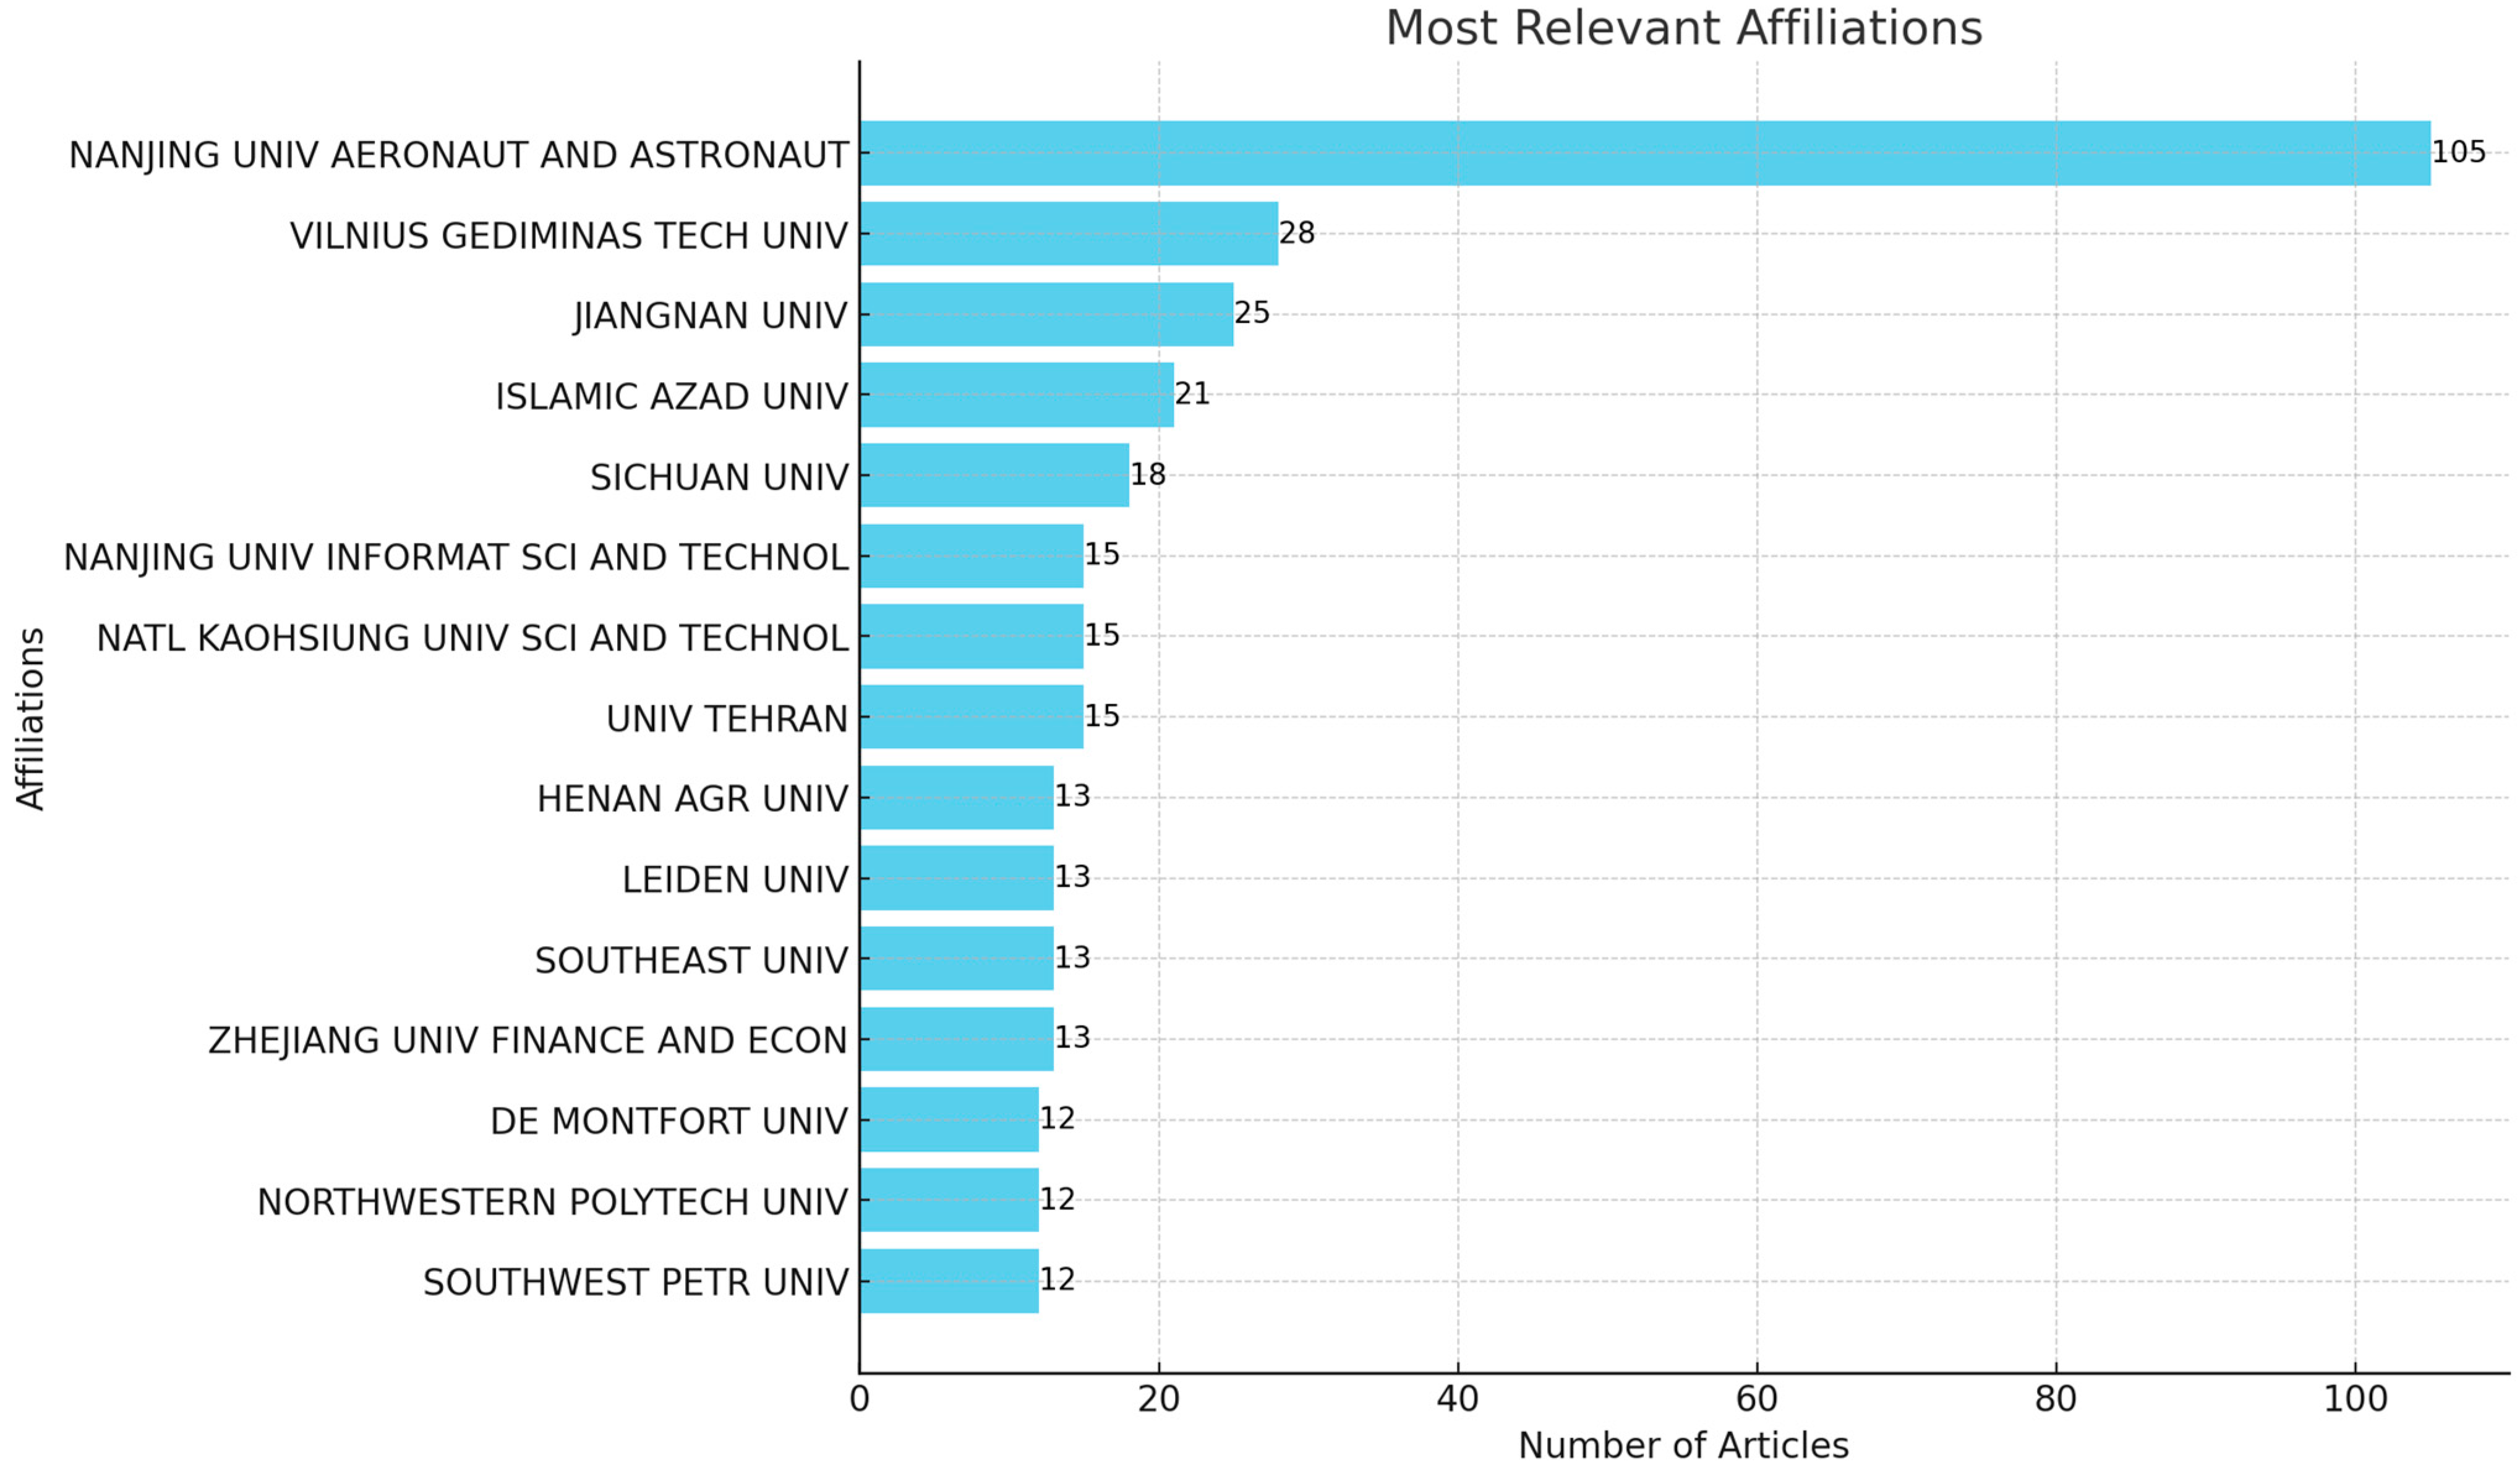
  • Q3. Who are the most prolific authors in this sector? What can be mentioned about their region of provenance and affiliations?
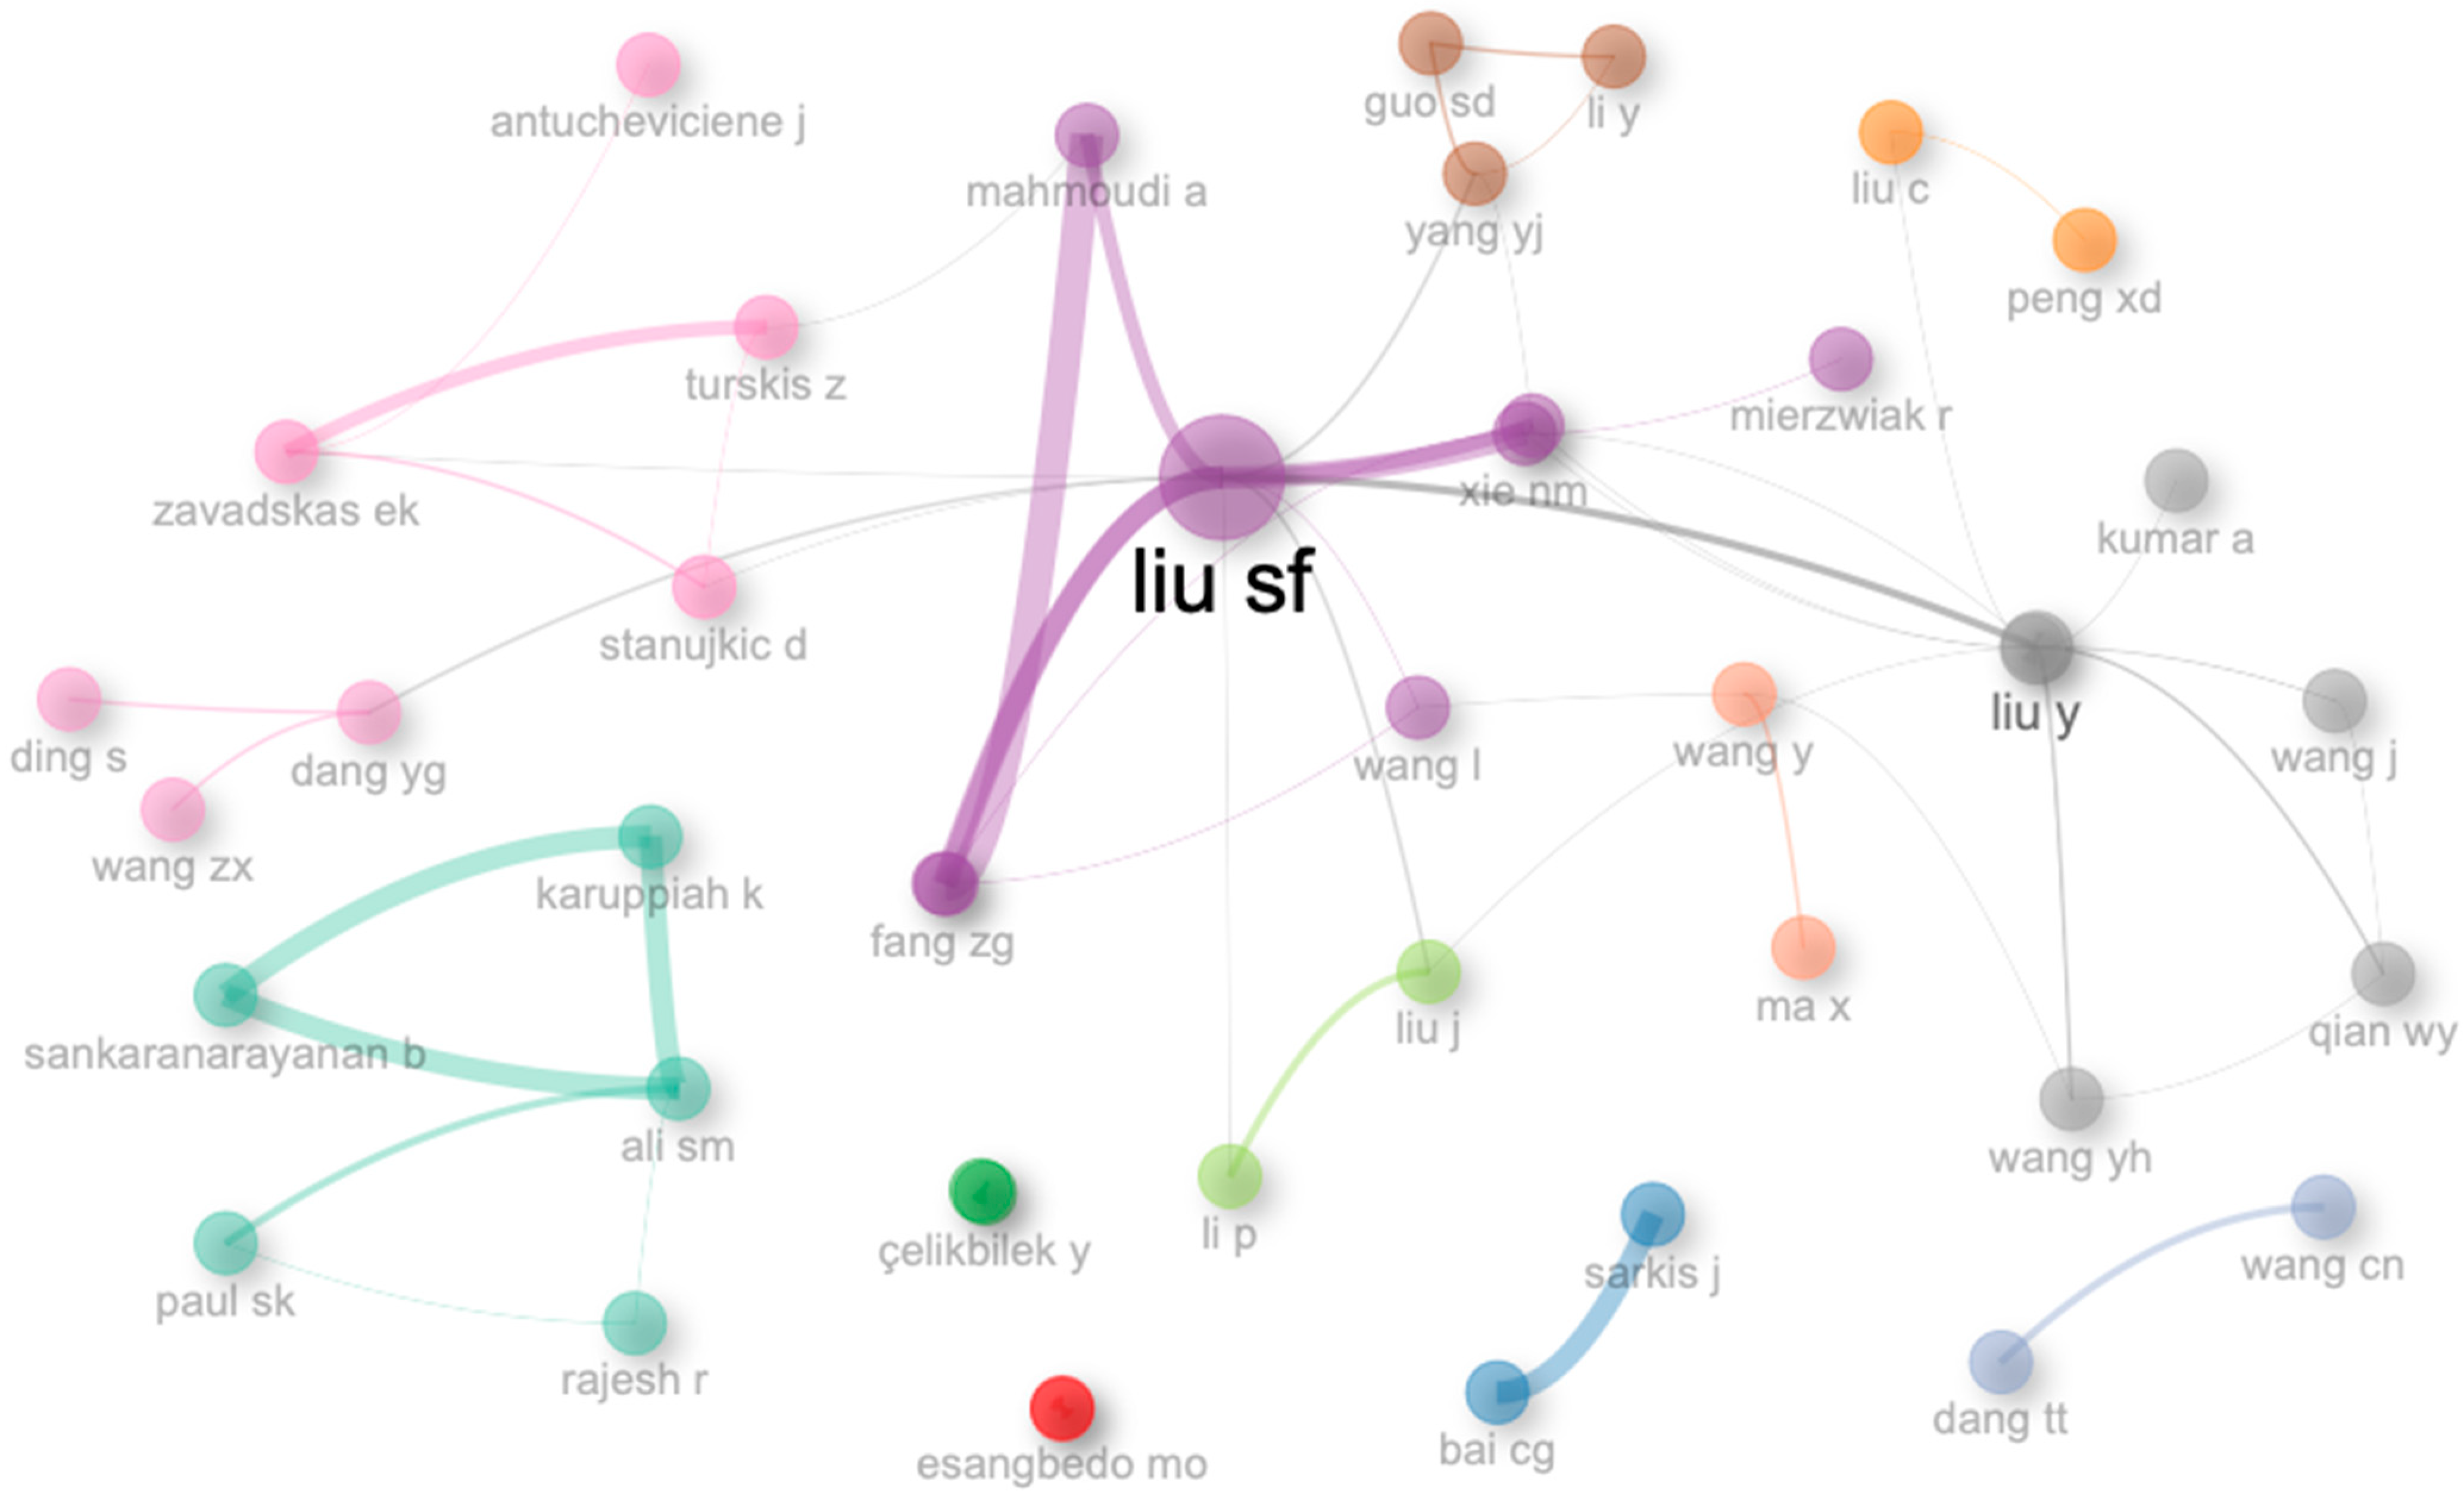
  • Q4. What was discovered regarding collaborations in writing articles around grey systems and decision-making?
  • Q5. What insights are uncovered by the analysis of the top 10 most cited papers in this domain, with respect to the number of citations, and what can be outlined about the contribution of grey systems in optimizing decision-making under uncertainty?
  • Q6. What key details are found after performing words and mixed analyses, considering the word clouds, co-occurrence networks, thematic maps, and three-field plots representations?
This article is divided into six distinct sections, briefly mentioned here in order of their appearance:
  • Introduction—the first section which provides general details about the field under analysis and the main purpose of the work.
  • Materials and Methods—the second section which discusses the main materials and methods used by the authors, along with the steps followed for selecting the data collection set.
  • Dataset Analysis—the third section which includes the actual bibliometric analysis, considering various facets and perspectives.
  • Discussions—the fourth section which goes through all the information discovered and outlines the key findings.
  • Limitations—the fifth section which offers an objective perspective on the paper’s creation, the incorporated restrictions, and future work directives.
  • Conclusions—the last section which summarizes everything and presents the concluding remarks.

2. Materials and Methods

This paper followed a similar practice as other bibliometric studies performed by international scientists [47,48]. Figure 1 defines the two primary stages of the analysis: the first step—dataset extraction, and the second step—bibliometric analysis.
As can be observed in Figure 1, it has been opted for the exclusive use of the Clarivate Analytics’ Web of Science Core Collection database (also known as Web of Science, or WoS) [49] for dataset extraction, a decision which will be discussed in the following paragraphs. Due to the options available in the database interface, it was possible to easily search only for the documents that contain titles, abstracts, or keywords, specific terms related to grey systems and decision making. Apart from these, the resulting dataset was filtered according to some conditions (language, document type, year of publication).
The second phase was dedicated to the bibliometric analysis, in which multiple perspectives were considered and investigated in greater detail, with the intention of offering all interested readers an overview of the domain addressed. The insights resulting from this bibliometric analysis represent important information that can be further exploited by the authorities and scientific community.
The two mentioned stages are going to be detailed in the next subsections.

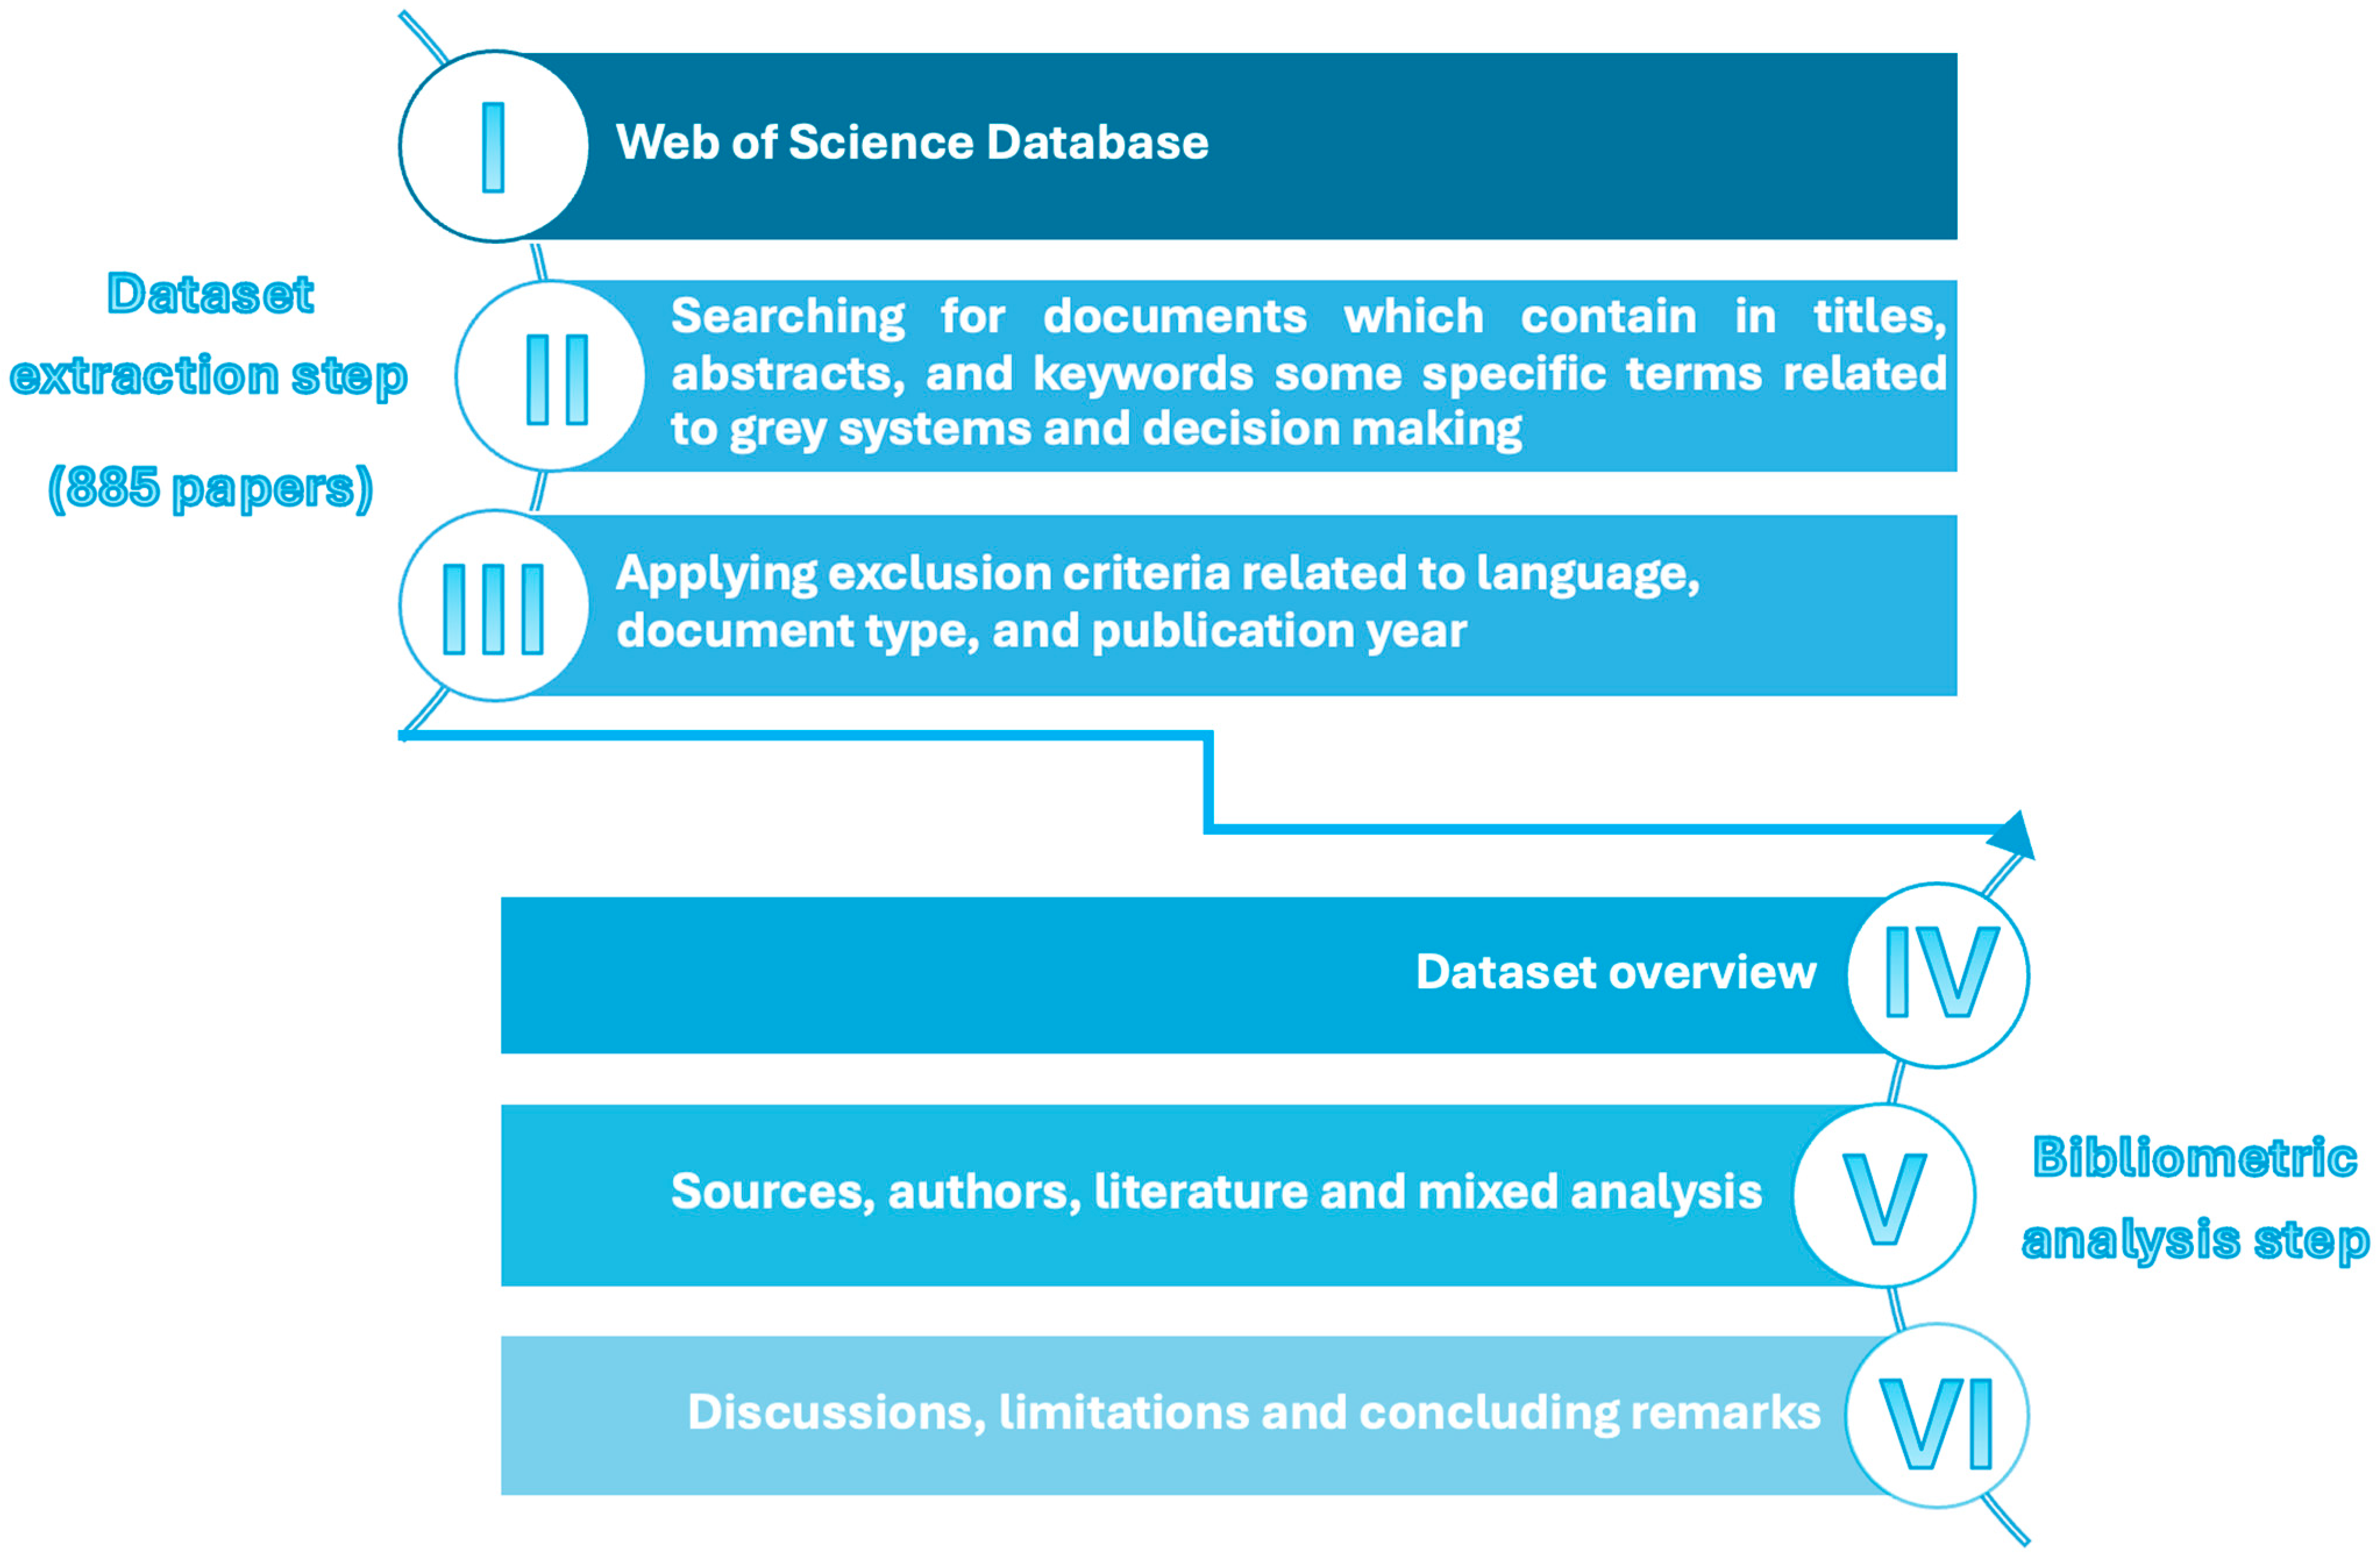
2.1. Dataset Extraction

The data was collected from the WoS database [49]. The choice for the use of this database was supported by a series of papers from the scientific community written by Cobo et al. [50], Mulet-Forteza et al. [51], and Bakir et al. [52]. The authors of these articles focused on the WoS database and highlighted its popularity, increased visibility, high usage, user-friendliness, and vast collection of international papers from a multitude of domains that address diverse topics.
This decision was further strengthened by considering other authors’ approaches in writing this type of investigation. It was noticed that in most of the bibliometric studies from the existing scientific literature (e.g., Twitter-related [53], grey systems theory in economics [54], machine learning [55], generative artificial intelligence in education [56], energy communities [57], prosumers [58], e-business and artificial intelligence [59]), the data collection set was gathered from a single database, with a great number of studies choosing WoS.
Since this paper incorporates various types of investigations, including individual analyses (e.g., most relevant journals/authors/affiliations, etc.), the use of a single database seems to be the best choice. Merging data from multiple sources would have complicated the process of establishing the hierarchies. Furthermore, the WoS database offers a specific type of keywords, named Keywords Plus [60], which are extracted based on the most used words in the references of the papers included in the dataset, which is a special feature useful in conducting words analysis that is not offered by other similar databases.
Additionally, WoS generates data in raw format, allowing it to be directly imported into the R tool used by the authors, Biblioshiny [61]. Most of the figures and tables included in this manuscript are extracted from this tool.
Furthermore, another key aspect regarding the use of the WoS database for bibliometric investigations is underlined by Liu [62] and Liu [63]. More precisely, the scientists suggest that a dataset collected from this database is relevant for the analysis, only if the authors were granted full access to the entire set of resources (all 10 indices). In our case, it has to be mentioned that we have benefited from full access to all indices.
Table 2 lists, in order, the steps followed for data selection, conducted in accordance with the scientific literature [64,65].
The first exploratory step was oriented toward searching within titles for specific terms associated with grey systems. Two queries were run at this point, considering both spellings: “grey”, the UK form (“grey_system*”, ”grey_number*”, ”grey_cluster*”, ”grey_control*”, “grey_decision*”, “grey_incidence*”, “grey_model*”, “grey_theor*”, “grey_sequence*”, “grey_prediction*”), which returned 3081 entries, and “gray”, the US form (”gray_system*”, ”gray_number*”, “gray_cluster*”, “gray_control*”, “gray_decision*”, “gray_incidence*”, “gray_model*”, “gray_theor*”, “gray_sequence*”, “gray_prediction*”), which returned 483 results.
The second exploratory step, focused on searching for the same list of words, this time in abstracts. Two queries were executed: one considering the UK form of the word—“grey” (6761 documents), and one considering the US form “gray” (2288 papers).
Similarly, the third exploration step consisted of two queries that searched for the list of terms in keywords: the first query returned 4526 results, while the second one 778.
The “*” which can be noticed at the end of some words, substitutes the next characters, supporting flexible searches (there were retrieved singular and plural forms).
The fourth exploration step comprises three distinct queries. The first query returned 10,278 publications identified in the previous six queries, that include any of the above-mentioned terms related to grey systems. The next query searched in titles, abstracts, and keywords sections for specific words associated with decision-making, taking into account both singular and plural forms (“decision_mak*”). After running this query, 649,586 entries resulted—this substantial number of documents proves the scientists’ increased interest in publishing papers around the topic of decision-making. The last query intersected the above two and returned only 1246 works, related to both grey systems and decision-making.
Language restriction is applied in the fifth exploratory step and reduced the data collection set by 13 papers. For this bibliometric investigation, there were considered only the papers written in English, since it is the most widely used language within the scientific community. This approach was also preferred by other scientists, such as Fatma et al. [66], Stefanis et al. [67], and Gorski et al. [68].
The following exploratory step was about filtering the dataset to include only the documents marked as “articles” by WoS. It is important to mention that conference proceedings were not excluded from the “article” category [69]. As a result, this constraint reduced the number of entries by more than 300, dropping to 898 papers. Interested readers can discover more insights about this step in the manuscript belonging to Donner [70].
In the last exploratory step, the constraint for publication year was applied. The authors decided not to take into consideration the articles published during the ongoing year at the moment of writing, which is 2025. Guided by the desire to obtain relevant results, only complete years, in terms of scientific publications, were included in the investigation. Consequently, 13 papers were eliminated.
That being stated, the final data collection set used for this investigation consists of 885 English-written articles related to both grey systems and decision-making. In the next pages, a comprehensive bibliometric analysis of this domain will be performed, including diverse perspectives.

2.2. Bibliometric Analysis

Going further with the discussion, the second phase of the analysis process, according to Figure 1, is related to the actual bibliometric examination.
The previously collected dataset will be in-depth examined through numerous facets and diverse perspectives, in order to better comprehend the grey systems’ contribution to the decision-making field under uncertainty. Interested details, trends, and hidden insights will be uncovered in this study, with the assistance of the R-tool, Biblioshiny. This manuscript can represent a powerful weapon for authorities and the scientific community, helping them to develop more effective strategies and further extend the domain.
By reviewing the existing scientific literature, one can easily notice Biblioshiny’s popularity within academics, a frequently utilized tool in these types of studies, across various domains [71,72,73,74,75], as it has the power to generate relevant graphs, figures, and tables.
The bibliometric analysis facets are depicted in Figure 2, each with its sections.
The first stage is represented by the dataset overview, where basic details related to timespan, sources, documents, citations, scientific production, authors, collaborations, etc., are analyzed.
The following stage is oriented toward sources, with an emphasis on the most relevant ones, their impact, and growth, including various analyses, such as H-index and Bradford’s law on source clustering.
The third facet is focused on the authors, highlighting the most prolific scientists involved in writing about grey systems’ contribution to the decision-making field under uncertainty, their affiliations, and corresponding countries. Apart from these, there are also some investigations related to countries, such as scientific production based on countries, top countries with the most citations, and country collaboration maps.
The fourth facet refers to paper analysis. As its name suggests, in this stage the papers are examined, there is provided a review of the most globally cited documents, and words analyses are conducted. Co-occurrence networks and thematic maps are also included in this section.
Finally, mixed analysis includes three-field plots, which emphasize the connection between several key categories.

3. Dataset Analysis

This section includes the actual bibliometric analysis, and it is focused on examining the data collection set, gathered from the WoS database, through multiple facets (dataset overview, sources, authors, papers, and mixed analyses). The tables and figures provided in this section were generated with the R-tool’s assistance (Biblioshiny).
By conducting a comprehensive investigation of the dataset, grey systems’ contribution to the decision-making field under uncertainty will be emphasized, and crucial insights will be uncovered.

3.1. Dataset Overview

The dataset collected from the WoS database includes numerous documents, more specifically 885 English-written articles, published within 353 sources, throughout a 33-year period (1992–2024). Based on these numerical values, it can be observed that the scientific community’s focus in this field is significant, and it has maintained academics’ interest for a long time.
The authors’ tendency to publish their articles about grey systems and decision-making in certain journals that focus on science and technology, is proved by the difference registered between the number of sources (353), and the number of documents (885).
Going further with the discussion, it is noticed that most of the papers included in the data collection set are recent scientific studies, an observation proved by the value registered for average years from publication (6.48).
The relevance, impact, and high interest in this domain are highlighted by the values obtained for average citations per document (25.52), average citations per year per document (3.32), and the substantial number of references (31,981).
The predominantly upward trend of the annual scientific production is visible in Figure 3. The research in this field had a gradual advancement, marked at the beginning by hesitation among academics. In the period between 1992 and 2005, there were published a maximum of two articles per year, also including several years without any publications (e.g., 1995, 1998).
Starting with the year 2006, there can be noticed a gradual increase in the number of published manuscripts in this area, reaching a maximum of 115 articles in 2022. This evident interest in grey systems’ contribution to decision-making under uncertainty, especially in the last 5 years, may be attributed to several factors such as the COVID-19 pandemic and its high impact on the economy and healthcare, along with the global crises, and technological advancements. The annual growth rate is 17.1%.
Figure 4 presents the evolution of the annual average article citations per year. The highest value, 12.9, was registered in 1992, and at the opposite pole, the lowest value, 1, was recorded in 2004.
The indicator’s increased values in the early years suggest that the papers published in that period were reviewed and cited by more academics, compared to the novel studies, which may not have been discovered by the entire target audience yet.
For the present data collection set, the values recorded for Keywords Plus and author’s keywords are listed here, in order: 1452 and 2720. The first remark that arises here is the fact that in comparison to Keywords Plus, the author’s keywords are close to twice.
The compact vocabulary is proved by the small value (1.64) resulting from the division between the number of Keywords Plus (1452) and the number of documents from the dataset (885). Similarly, the division between the author’s keywords and number of documents, results in a value of 3.07, which represents the average value of such terms per document.
The following topic that requires attention is the discussion about authors. The number of authors involved in publishing articles around grey systems and the decision-making field is 2245. By investigating the number of author appearances, which is 3184, one can easily notice that some of the academics contributed to more than one research paper in this area.
By quickly comparing the values recorded for authors of single-authored documents (69) and authors of multi-authored documents (2176), it comes to light an interesting aspect: the collaboration in this domain of research is substantial, and therefore, only a modest number of papers arise from individual contribution.
Going further with the discourse about collaborations, it is observed that the result of the division between authors of single-authored documents (69) and single-authored documents (84) is 0.82. In other words, the scientists who have written research in the area of grey systems and decision-making have, on average, done so for 0.82.
The documents per author indicator registered a low value of 0.39. This is an outcome of the discrepancy between the number of documents (885) and the number of authors (2245), in accordance with the extracted dataset.
The substantial degree of collaboration between authors in this area, previously highlighted, is further proved by the values recorded for the following indicators: authors per document (2.54), co-authors per document (3.6), and collaboration index (2.72).

3.2. Sources

The top 11 most relevant sources with respect to the number of published papers around grey systems and the decision-making field, are highlighted in Figure 5. For this hierarchy, there were considered only the journals with at least 11 published manuscripts in the mentioned domain.
In the first position is placed Journal of Grey System with 78 papers, followed closely, in the second place, by Grey Systems-Theory and Application with 63 papers.
Other journals found in the hierarchy are listed here, in order: Sustainability (30 papers), Journal of Cleaner Production (26 papers), Kybernetes (24 papers), Mathematical Problems in Engineering (19 papers), Energy and Expert Systems with Applications (both with 15 papers), Journal of Intelligent & Fuzzy Systems (14 papers), IEEE Access and Mathematics (both with 11 papers).
A remark that arises here is that all sources present in the top are mainly oriented on technology, artificial intelligence, engineering, and mathematical approaches, which demonstrates again the authors’ tendency to publish their work related to grey systems and decision-making in sources focused on this area of study.
Furthermore, the fact that Mathematics is also noticed among the most relevant sources in this domain further strengthens the relevance and compatibility of this bibliometric investigation with this journal.
Bradford’s law on source clustering is an essential analysis for bibliometric investigations. By clearly defining three main zones (Zone 1, in the core, including sources that are very productive, and often cited; Zone 2, in the center, including sources marked by moderate productivity; Zone 3, outside, including sources with lower impact and productivity), helps in classifying journals’ efficiency and relevance [76].
As expected, the journals noticed above at the top, are also placed in the core—Zone 1, according to Bradford’s law (please see Figure 6): Journal of Grey System, Grey Systems-Theory and Application, Sustainability, Journal of Cleaner Production, Kybernetes, Mathematical Problems in Engineering, Energy, Expert Systems with Applications, Journal of Intelligent & Fuzzy Systems, and IEEE Access.
The H-index indicator’s value demonstrates the source’s importance and relevance [77]. To be more precise, as the value of the indicator increases, so does the significance of the journal.
Figure 7 presents the journals’ impact based on the H-index, a top built considering only the sources that published a minimum of seven papers related to grey systems and the decision-making field under uncertainty.
It is observed that, again, most of the sources present in this top, are also located in Zone 1, based on Bradford’s law: Journal of Cleaner Production, Energy, Grey Systems-Theory and Application, Expert Systems with Applications, Journal of Grey System, Kybernetes, Sustainability, Environmental Science and Pollution Research, Computers & Industrial Engineering, and International Journal of Advanced Manufacturing Technology.
Journals’ growth (cumulative) based on the number of papers is depicted in Figure 8, and it was experienced by the subsequent sources: Grey Systems-Theory and Application, Journal of Cleaner Production, Journal of Grey System, Kybernetes, and Sustainability.

3.3. Authors

The authors’ hierarchy according to the number of published manuscripts about grey systems and the decision-making field under uncertainty can be seen in Figure 9. In this top, there were considered only the academics that were involved in writing at least nine papers associated with this topic.
In the first position is situated Liu SF with a substantial contribution to the scientific community, more specifically 45 papers. Professor Liu SF is a leading figure in the area of grey systems theory, being for many years the person in charge of the grey systems conferences organized by Nanjing University of Aeronautics and Astronautics.
The next place at the top is occupied by Liu Y, with 22 papers, followed by Xie NM with 14 manuscripts, Dang YG with 11 papers, Ali SM and Esangbedo MO, each with 10 works, and other six scientists with 9 papers—Fang ZG, Javed SA, Turskis Z, Wang Y, Yang YJ, and Zavadskas EK.
The visual representation from Figure 10 is focused on authors’ production over time and excludes all scientists with less than 10 works in this domain. As can be observed, the papers belonging to the first six academics, with respect to their productivity, were published between 2004 and 2024.
The leading position is held by Liu SF with 45 published manuscripts related to grey systems and decision-making, while the year with the highest publication rate was 2019.
The increased number of publications around this topic, more evident from the second half of the timeframe onwards, is not a coincidence. Several factors such as the COVID-19 pandemic, advancement of technology, and global crises, are just a few examples that made scientists more interested in this topic, leading to more research studies about grey systems and decision-making fields under uncertainty.
The top 16 most relevant affiliations with no less than 12 published papers related to the domain addressed in the current bibliometric examination, are visible in Figure 11. The first place in the ranking is held by Nanjing University of Aeronautics and Astronautics, with 105 manuscripts, which was an expected result due to the fact that the mentioned university is the home university for the grey systems theory.
Other affiliations noticed in the hierarchy are listed here, with respect to the number of published research papers: Vilnius Gediminas Technical University, Jiangnan University, Islamic Azad University, Sichuan University, Nanjing University of Information Science and Technology, National Kaohsiung University of Science and Technology, Tehran University, Henan Agricultural University, Leiden University, Southeast University, Zhejiang University of Finance and Economy, De Montfort University, Northwestern Polytechnic University, and Southwest Petroleum University.
Figure 12 brings to readers’ attention the most relevant corresponding author’s country. For conducting this analysis, two indicators were considered: SCP—Single Country Publications (painted in green), and MCP—Multiple Country Publications (painted in orange). Only the countries that published at least 12 papers, were included in the hierarchy.
It is not surprising China’s high involvement, as it was also a leading contributor in other bibliometric studies around different topics [73,78]. For the current scientific domain, China is ranked in the first position and contributed 524 documents (MCP = 92, SCP = 432), in the period between 1992 and 2024. Significantly behind, next are India (76 papers, MCP = 17 papers, SCP = 59 papers) and Iran (38 papers, MCP = 11 papers, SCP = 27 papers).
Please consider Figure 12 for the entire list of countries.
Figure 13 illustrates the map of the world, where each country is colored with respect to the number of published publications about grey systems and decision-making fields under uncertainty, using various shades of blue—with darker blue signifying higher contribution and lighter blue signifies lower contributions, while the countries marked in grey color provide no contribution with the respect of the extracted dataset.
An intense involvement is visible in the countries marked in navy blue (e.g., China, India, the USA), a moderate involvement is found in countries painted in pastel blue (e.g., Sweden, Denmark, Germany), while an insignificant or absent involvement is noticed in countries shaded in grey (e.g., Austria, Croatia, Cyprus). Even in this case, the leading role of China among the top contributors in this area was expected, being the home country of the grey systems theory.
The countries with the most citations are highlighted in Figure 14, where only the ones with more than 500 references in the field of grey systems and decision-making under uncertainty were included.
Being in line with expectations, China is positioned at the top of the hierarchy with an impressive number of citations, more specifically 10,531, proving once again its high involvement, visibility, impact, and strong recognition among academics, in the domain under investigation. The following two places are occupied by India, with 2252 citations, and Canada with 1452 citations. Please refer to the full list in Figure 14.
Going further with the discourse, another key aspect that needs to be addressed in bibliometric studies is the collaboration between countries, which is presented in Figure 15 using red lines between collaborating countries. As already mentioned above, the level of collaboration in this domain is impressive.
According to the visual representation, China, colored in the darkest blue on the global map, is the country that registered no less than 39 international collaborations with countries like Australia, the USA, the United Kingdom, Germany, France, etc.
The authors’ collaboration network in the field of grey systems and decision-making under uncertainty is visible in Figure 16.
Regarding the researchers included in Figure 16, it should be mentioned the top position occupied by Liu SF, one of the most central figures in the area of grey systems theory, and his research group, made by various researchers associated with the Nanjing University of Aeronautics and Astronautics, among which, the name of Xie NM should be mentioned.

3.4. Analysis of Literature

The current section is focused on the existing scientific literature in the domain of grey systems and decision-making under uncertainty, especially on investigating the top 10 most cited papers included in the data collection set, gathered from the WoS database. In the following pages, readers can observe that this section was divided into three subsections, in order to provide an organized discussion.
The first subsection includes a table with the top 10 papers with respect to the number of citations and offers an overview of each one of them. Main information about the manuscript (first author, year, journal, and reference), together with the number of authors involved in writing the research paper, and their region of provenance are underlined. Apart from these, some relevant indicators for understanding the papers’ impact and significance within the scientific community are provided: total citations (TC), total citations per year (TCY), and normalized TC (NTC). Regarding the selected indicators, some information should be given related to NTC as the meaning of this indicator and its formula is not as intuitive as the other two indicators. This indicator is determined by dividing the number of citations received by a paper by the average number of citations received by the other papers included in the dataset and published in the same year as the analyzed paper [55,73]. So, basically, the indicator shows how many times a paper has more or fewer citations than the average paper in the dataset, published in the same year as the mentioned paper.
The next subsection offers a brief review of each paper included at the top, focusing on key details, such as the article’s purpose, data collected, methods employed, and main results.
Lastly, the third subsection is oriented toward words analysis, providing the hierarchies for the most frequent words in Keywords Plus, authors’ keywords, bigrams, and trigrams in both abstracts and titles. Furthermore, visual representations for co-occurrence networks, thematic maps, and word clouds, are included and in-depth analyzed.
This section is important for any bibliometric investigation, since it provides hidden details about the dataset, uncovers preferred themes, approaches, and topics, and understands the gaps in the existing scientific literature, together with the areas that require future investigation.

3.4.1. Top 10 Most Cited Papers—Overview

Table 3 presents an overview of the top 10 most globally cited documents in the dataset gathered from the WoS database. The topics addressed in these papers are related to grey systems’ contribution to the decision-making field under uncertainty.
Based on the information provided in the table, a first observation arises: the most cited articles are published in journals focused on science and technology (e.g., The International Journal of Advanced Manufacturing Technology, Mathematical and Computer Modelling, etc.).
The high degree of collaboration between scientists in this sector is also evident at this point. Only two out of ten papers represent individual contributions [79,80].
When discussing scientists’ region of provenance, it is observed that in this domain exists both national and international partnerships, including countries from all over the world, such as China, India, France, Canada, the USA, Japan, Turkey, etc.
In order to better understand the papers’ impact, relevance, and visibility within the scientific community, the citation indicators must be examined:
  • The total citations indicator (TC) ranges between 219 and 517.
  • The total citations per year indicator (TCY) varies between 12.88 and 86.17.
  • The normalized total citations indicator (NTC) fluctuates between 1.00 and 15.27.
The first place in the hierarchy is occupied by the paper belonging to Raj A et al. [81], which registered top values for all three discussed indicators (TC = 517, TCY = 86.17, and NTC = 15.27), in a relatively short amount of time (5 years), compared to other articles written at the beginning of the 2000s. The second two places in the hierarchy belong to Wolbers M et al. [82] (TC = 494, TCY = 29.06, and NTC = 6.72), and Huang GH et al. [83] (TC = 438, TCY = 12.88, and NTC = 1.00). For all the values, please consult Table 3.
The significant number of citations gathered by the papers written around grey systems and the decision-making field under uncertainty suggests the authors’ high interest in this subject, along with the field’s essential importance and relevance.
Table 3. Top 10 most globally cited documents.
No.Paper (First Author, Year, Journal, Reference)Number of AuthorsRegionTotal Citations (TC)Total Citations per Year (TCY)Normalized TC (NTC)
1Raj A, 2020, International Journal of Production Economics, [81]5India,
France
51786.1715.27
2Wolbers M, 2009, Epidemiology, [82] 4Switzerland,
The Netherlands,
Vietnam
49429.066.72
3Huang GH, 2007, Civil Engineering Systems, [83]3Canada43812.881.00
4Hashemi SH, 2015, International Journal of Production Economics, [84]3Iran,
The USA,
Germany
38935.366.64
5Tosun N, 2006, The International Journal of Advanced Manufacturing Technology, [79]1Turkey34117.056.09
6Xia XQ, 2015, Journal of Cleaner Production, [85]3China,
Denmark
32929.915.62
7Li GD, 2007, Mathematical and Computer Modelling, [10]3Japan32417.055.10
8Tseng ML, 2009, Expert Systems with Applications, [80] 1Taiwan31618.594.30
9Zavadskas EK, 2008, Journal of Civil Engineering & Management, [86]4Lithuania30917.175.45
10Özcan T, 2011, Expert Systems with Applications, [87]3Turkey21914.605.37

3.4.2. Top 10 Most Cited Papers—Review

This section is dedicated to reviewing the top 10 most globally cited documents, present in Table 4, offering brief summaries, and highlighting the main important aspects: main topics addressed, datasets utilized, methods employed, key findings, and results.
The first paper found in the hierarchy is the one written by Raj et al. [81]. The scientists conducted research about the difficulties and challenges that were encountered in both developed countries and the ones in the developing process, with a particular focus on the manufacturing sector. In this paper, a hybrid approach was preferred, combining Grey Decision-Making Trial and Evaluation Laboratory (DEMATEL), which helped the scientists in examining the connections between barriers (cause-and-effect groups). Related to the dataset, it involved information from the literature review, together with experts’ responses. The results suggest that the main barrier encountered in this process was associated with the lack of strategic planning in digital strategy, combined with limited resources. For developed countries, the problem is the low maturity level of the technology, while in developing countries, the absence of rules and guidelines. The authors encourage future research to extend further the study, exclude the limitations considered in this paper, and involve more experts from different industries.
The following manuscript on the list belongs to Wolbers et al. [82], and it is oriented to the healthcare sector. In this study, the authors provide an investigation of coronary heart disease (CHD) and predict its risk of apparition. Multiple models such as Fine and Gray, cause-specific hazards, and standard Cox, were considered and applied to the data collection set gathered from the Rotterdam Study, which included relevant medical information about 4144 older women, with ages between 55 and 90 years old. These women did not have CHD at the beginning of the study. The findings showed that the Fine and Gray model and cause-specific hazards were more effective in predicting the risk of heart disease, while in the case of the Cox model, the risk was overestimated. This research is indeed useful, especially for the healthcare domain, and the authors highlight the need to investigate further this area, by improving the models for risk predictions and considering other factors, too.
Huang et al. [83] focused on offering a novel grey linear programming model (GLP) whose main purpose was to deal with and combat the challenges related to uncertainty in the domain of management planning associated with municipal solid waste. As for demonstrating its great performance compared to old methods, some hypothetical data for three municipalities, relevant to solid waste management was involved. The models proved to be very useful in optimizing the efficiency of the process.
The research performed by Hashemi et al. [84] is about green supply chain management (GSCM). The authors used analytic network process (ANP) and grey relational analysis (GRA) to create an efficient model, useful for choosing the top green suppliers, considering apart from the standard factors, also the economic and environmental ones. The dataset involved included a case study from the automotive industry, along with opinions from experts, and the results obtained proved that this approach enhances the decision-making process of supplier selection. Some ways of extending this study might involve the use of other methods such as decision-making trial and evaluation laboratory (DEMATEL) or interpretive structural modeling (ISM), and the exploration of other relevant factors (e.g., corporate social responsibility, political, and carbon management).
Tosun [79] conducted an experimental study in his paper about optimizing the drilling process. The experiments were performed on a Tezsan M35ES drilling machine and involved relevant factors, such as the speed of cutting, rate of feed, and drill’s point angles. Grey relational analysis (GRA) and the Taguchi method were involved, and the results proved the high influence that the mentioned factors have on the performance of the drilling process.
Xia et al. [85] identified and investigated in the research paper the barriers associated with remanufacturing in the domain of automotive, with a particular focus on a highly developed country, namely China. The difficulties in this sector were established based on discussions with experts and industrial managers and examined using the Grey Decision-Making Trial and Evaluation Laboratory (DEMATEL). The results showed that the main barriers are lack of funds, outdated technology, VAT’s high costs, and low number of recycled used engines. In terms of future research, the authors highlight the need to address the barriers’ impact and consider the use of other approaches and statistical validations.
Li et al. [10] introduced a novel grey-based decision-making approach for combating the challenge associated with the selection of suppliers under uncertainty. This problem was classified as being a multiple attribute decision-making (MADM) problem. Regarding data, the authors used simulated records related to six different suppliers, considering multiple factors. After the experiments were conducted, the model proved its high efficiency and performance in selecting and deciding upon top suppliers.
Tseng’s paper [80] is oriented to the real estate industry. The focus is on identifying the factors that affect the service quality and evaluating them using the grey-fuzzy DEMATEL method, in order to improve both customers’ satisfaction and decision-making processes. To obtain the data, a survey with 21 questions was created, and the responses from 280 customers were collected. The paper included various tables, formulas, and computations to prove the method’s efficiency in assessing the quality of the services. The results highlighted the main important factors that have a strong influence on customer satisfaction and on improving service quality (e.g., communication, reliability). For future studies, limitations should be addressed, and more factors must be considered.
Zavadskas et al. [86] addressed a challenge associated with the construction management sector. The authors examined multiple existing options for the external walls’ materials, considering various factors (e.g., expenditure, durability, thermal transmittance, etc.). For conducting this investigation, data from another research paper, along with the answers from 39 experts were used, while the method employed was grey theory complex proportional assessment of alternatives with grey relations (COPRAS-G). The findings proved the method’s high efficiency in ranking the alternatives, showing that masonry made of silicate bricks, with an outer finishing layer, is at the top of preferences. This study is useful for investors, improves decision-making processes, and has a high applicability.
The last paper found in the top 10 hierarchy based on the number of citations is the one written by Özcan et al. [87]. The authors focused on the analytic hierarchy process (AHP), techniques for order preference by similarity to ideal solution (TOPSIS), elimination and choice expressing reality (ELECTRE), and Grey Theory. At the beginning of the study, a detailed comparison of those four techniques was presented, followed by an experimental section, where these methods were used for solving the warehouse location selection problem, taking into consideration, various relevant factors (e.g., cost, infrastructure, environment, etc.). Similar outcomes were obtained in the case of AHP, TOPSIS, and ELECTRE, while grey theory adjusted stock-holding capacity limits, showing better results in warehouse selection.

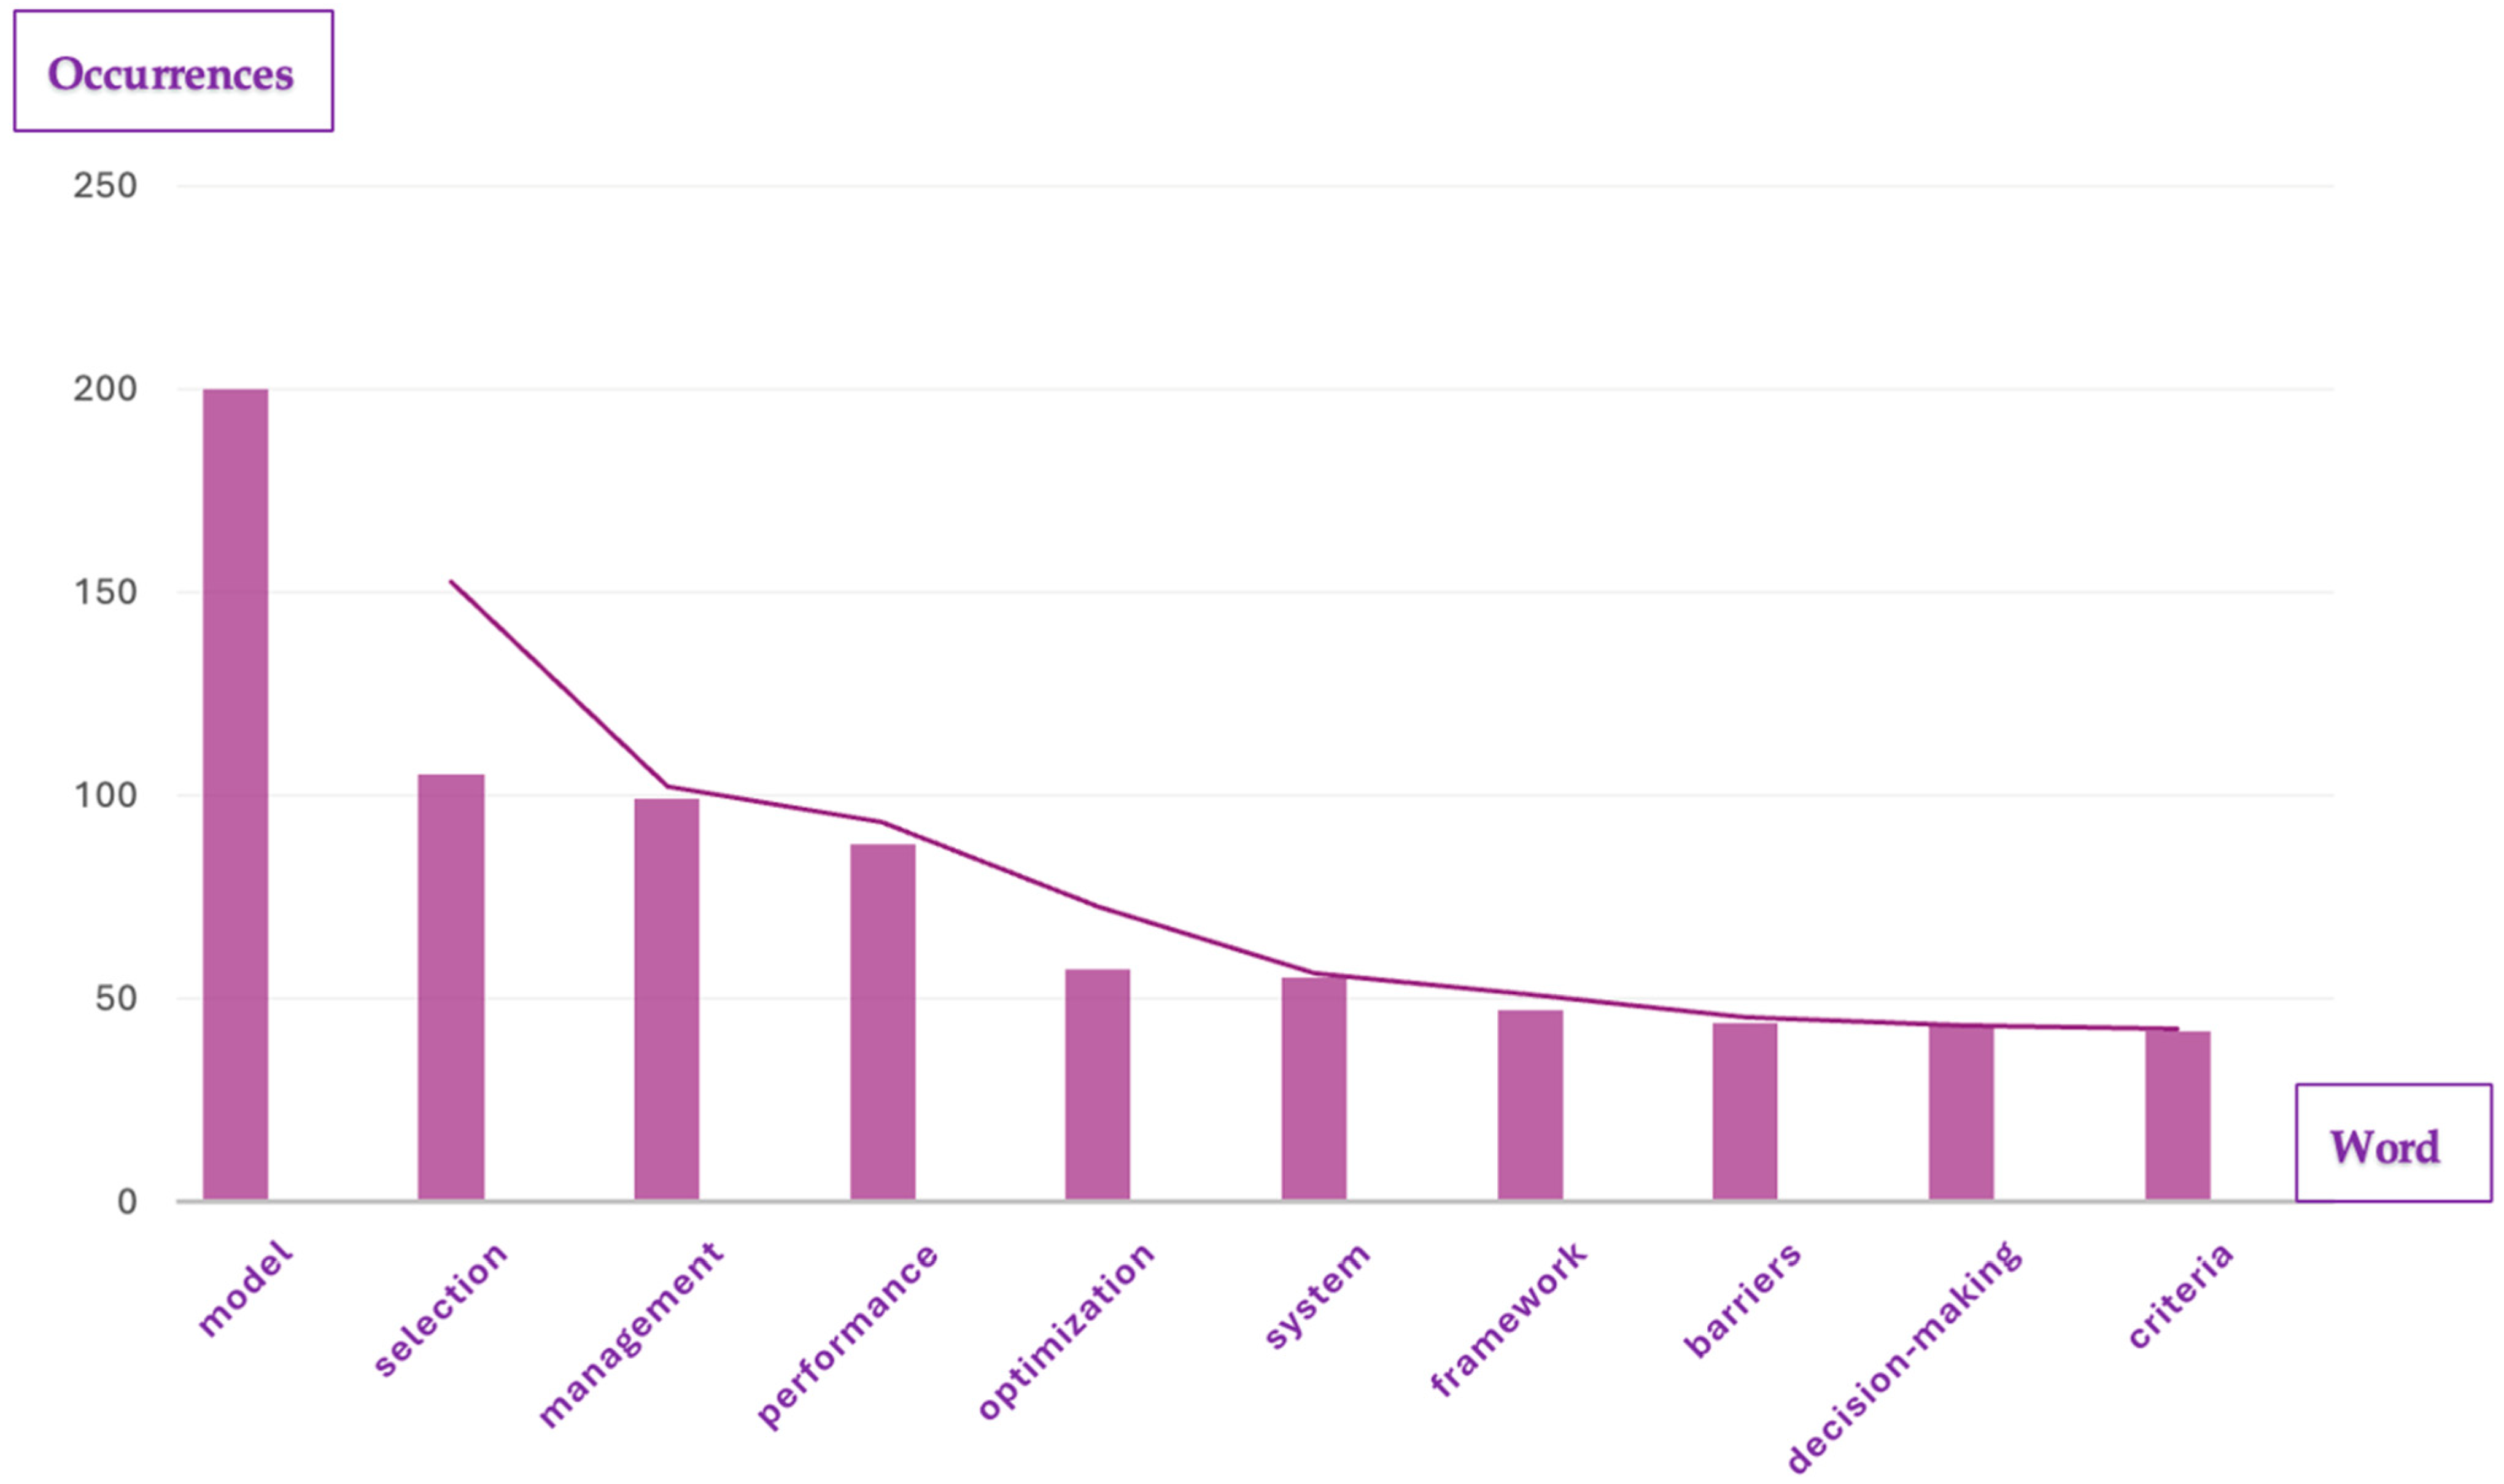
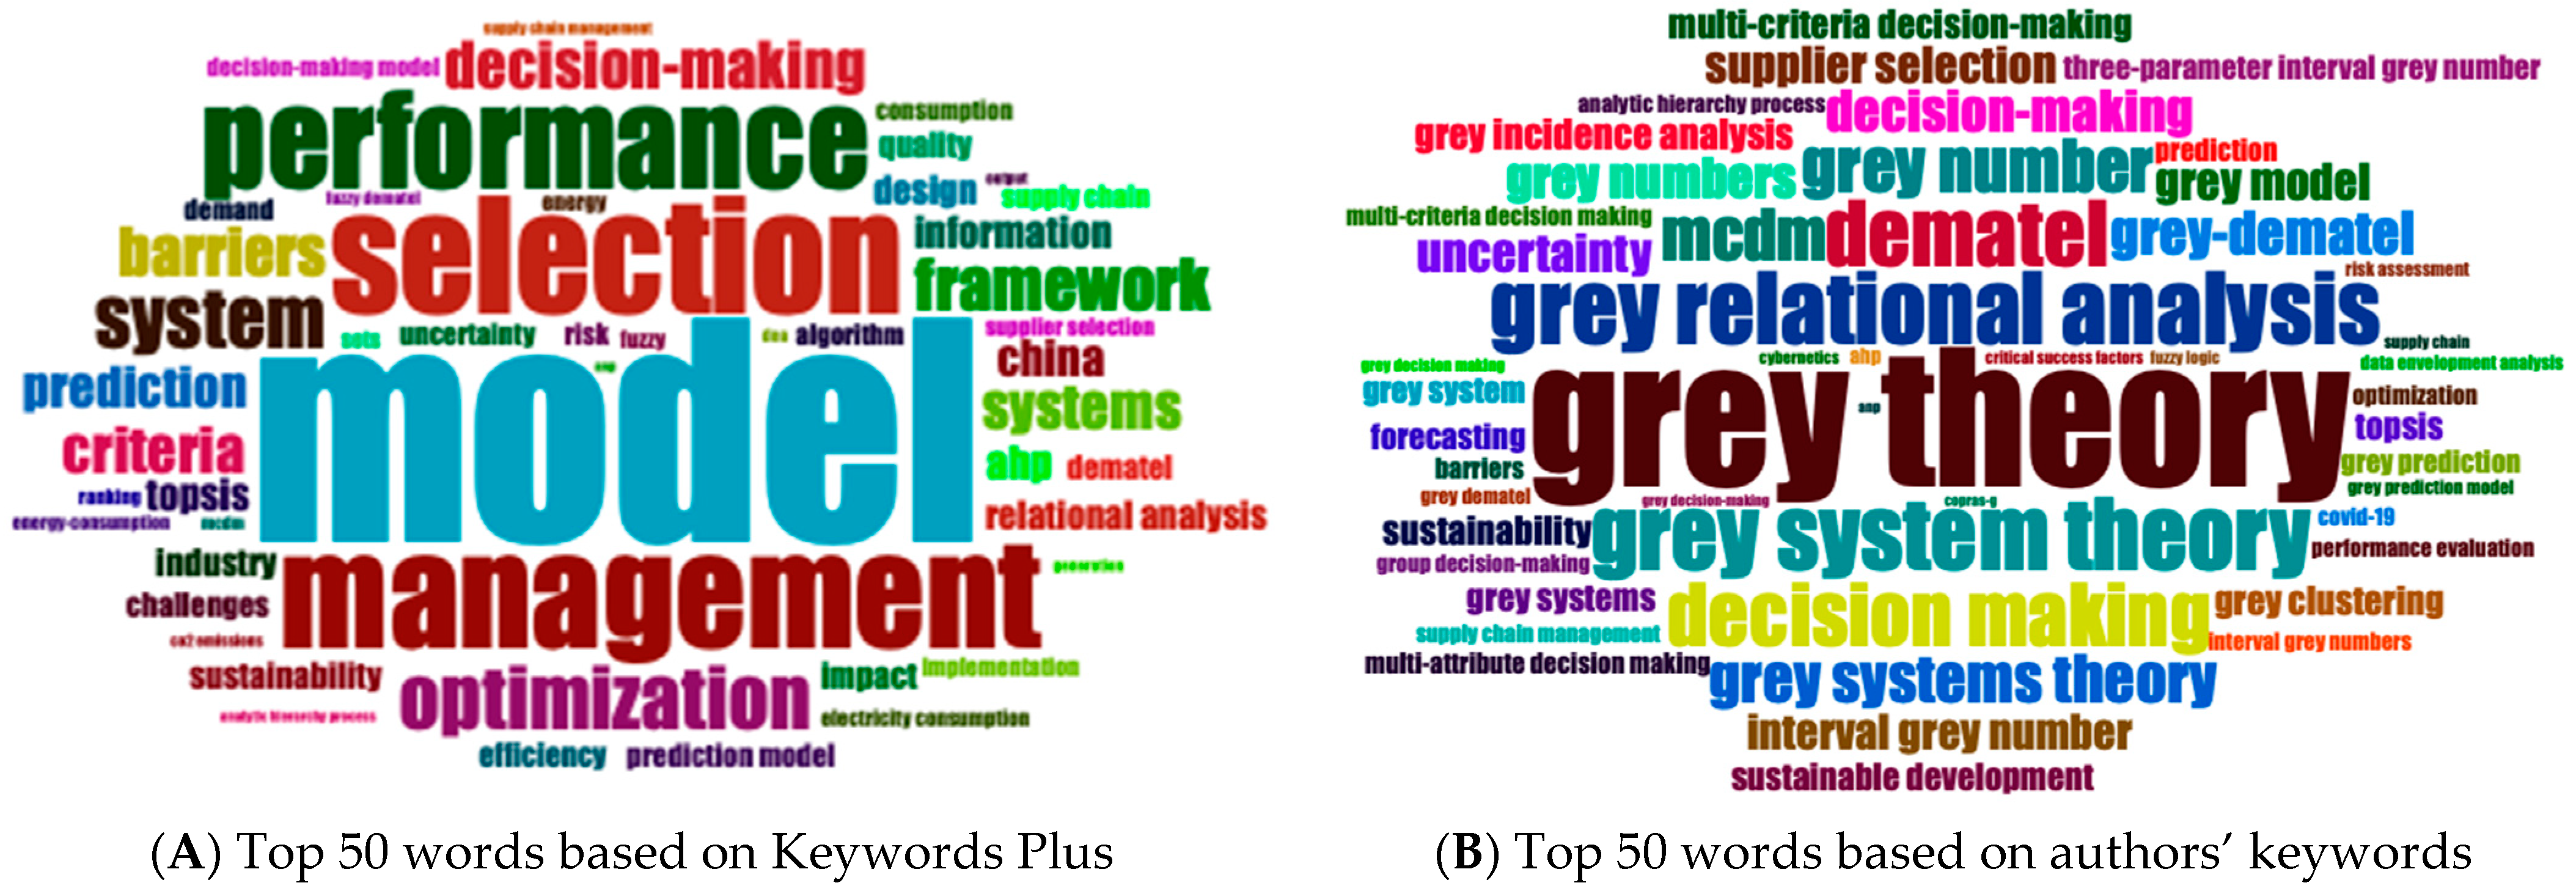
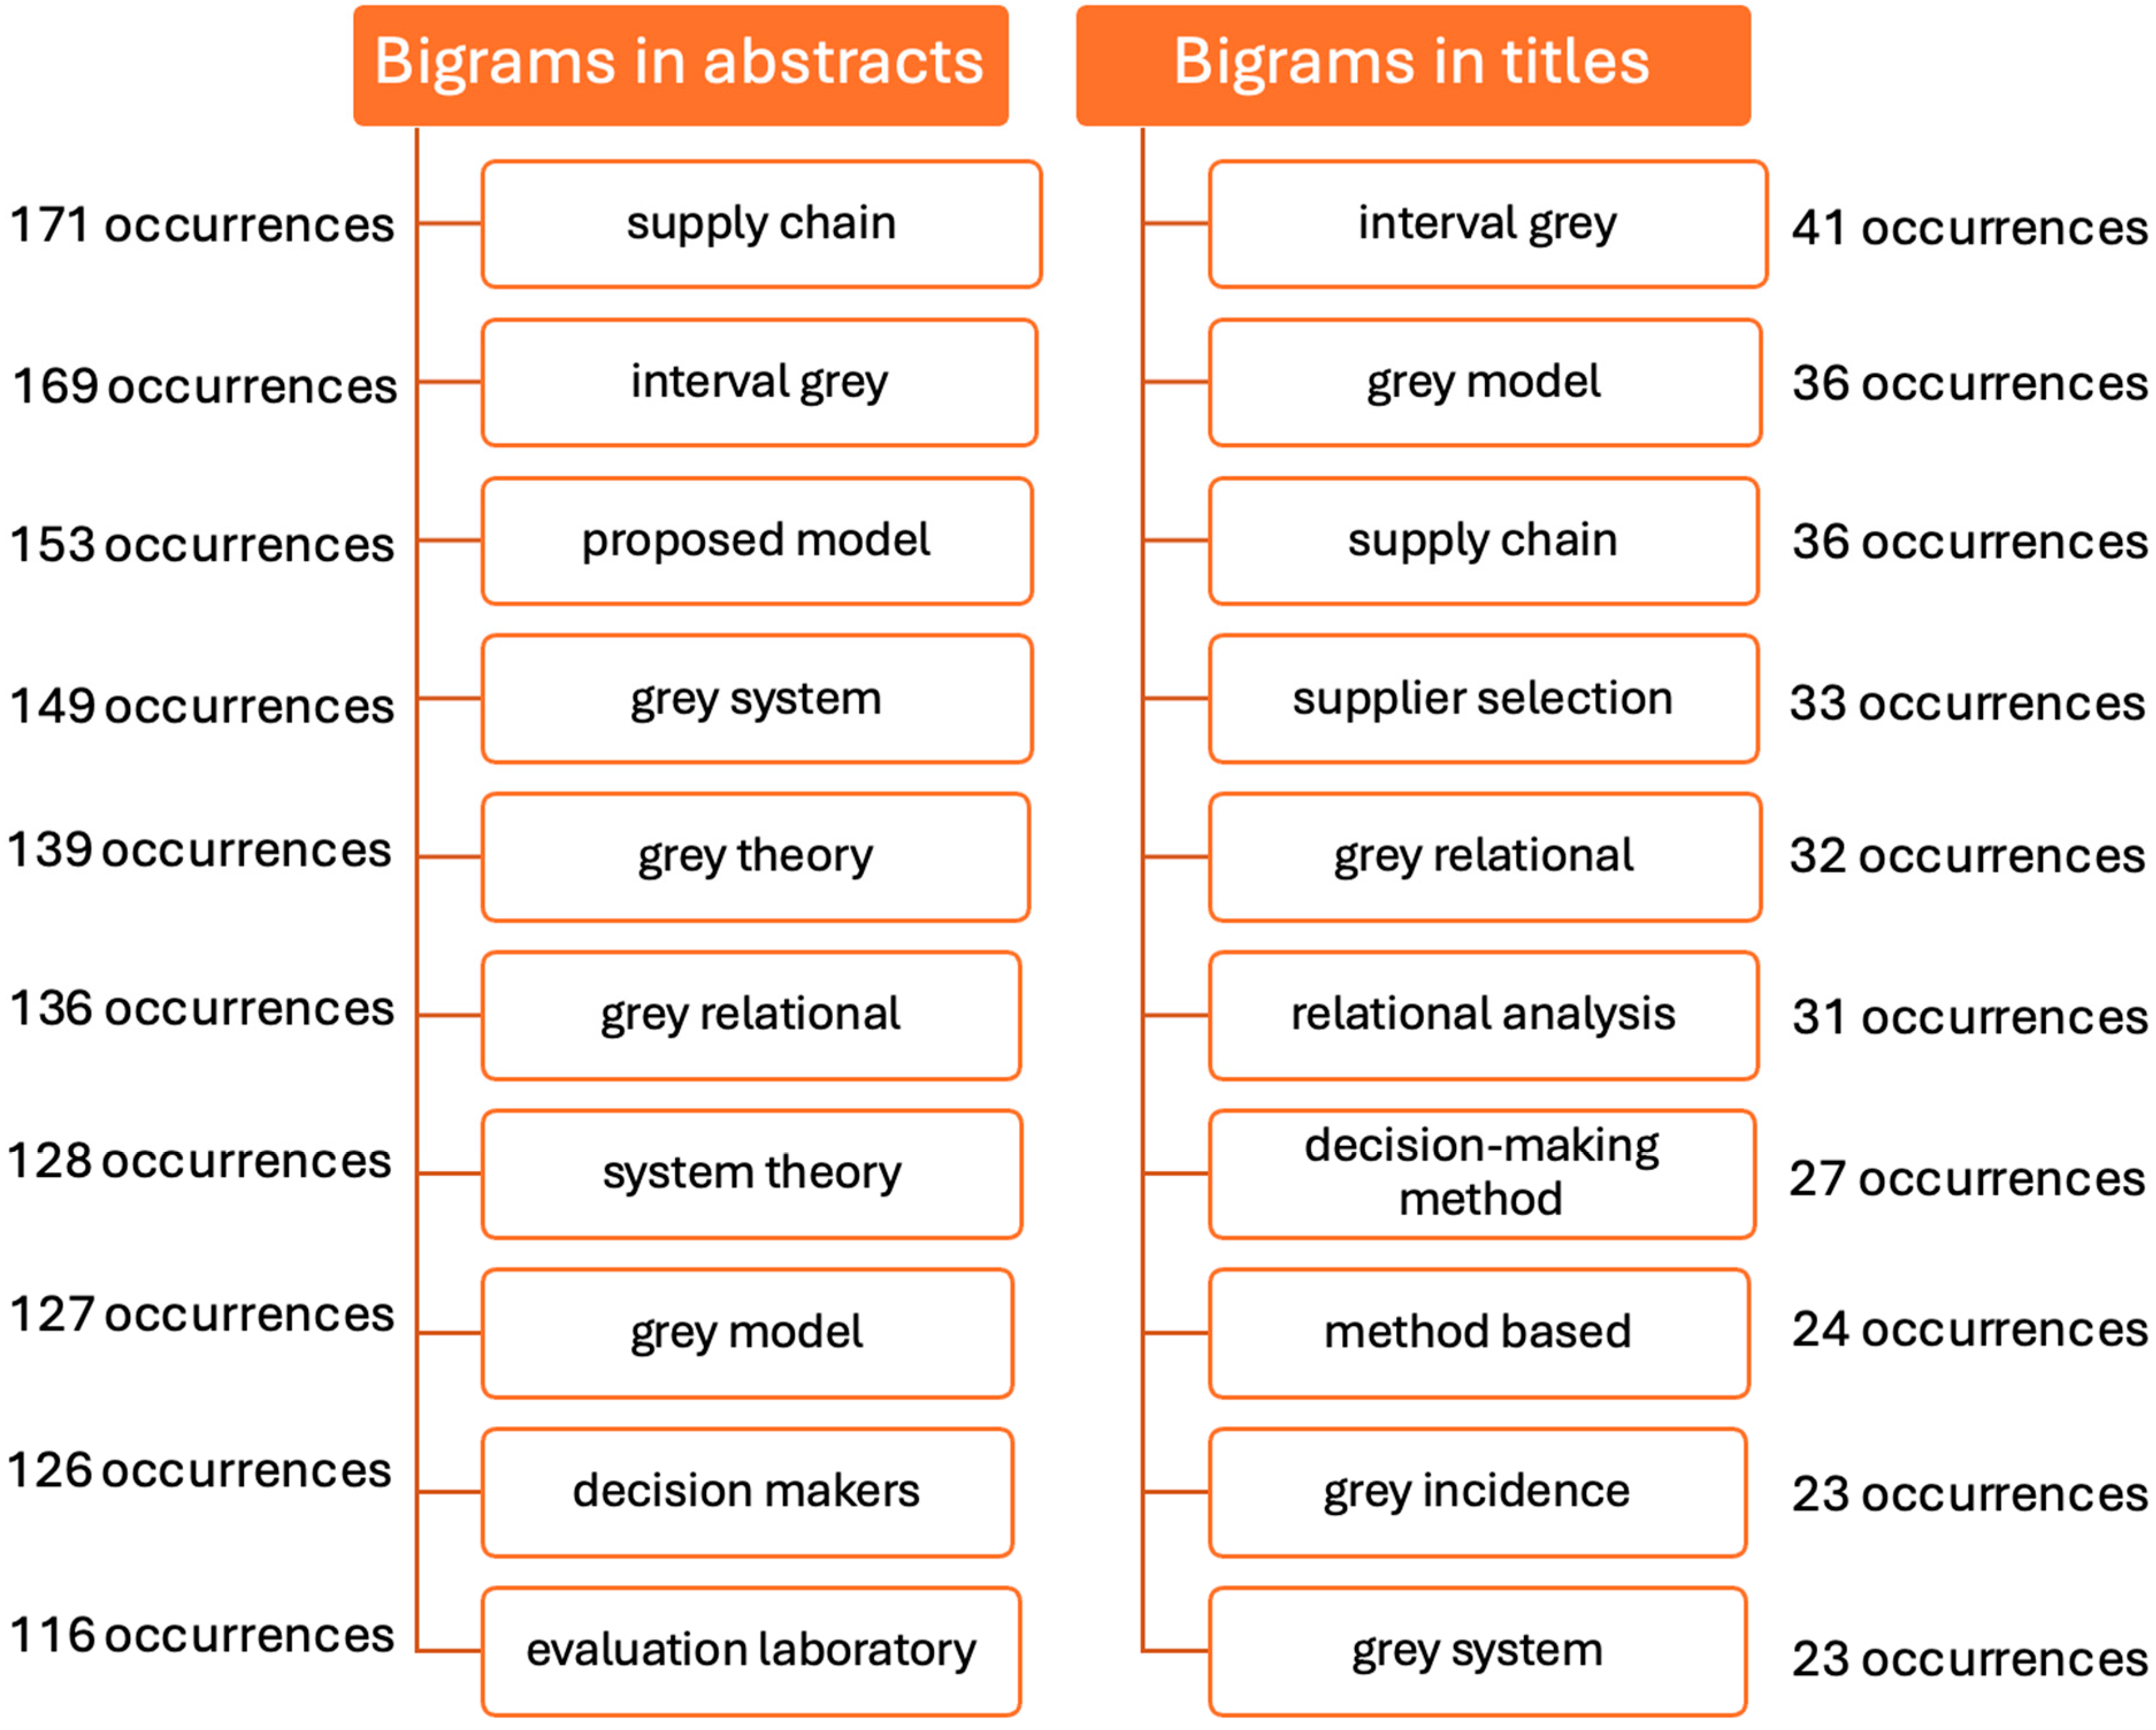
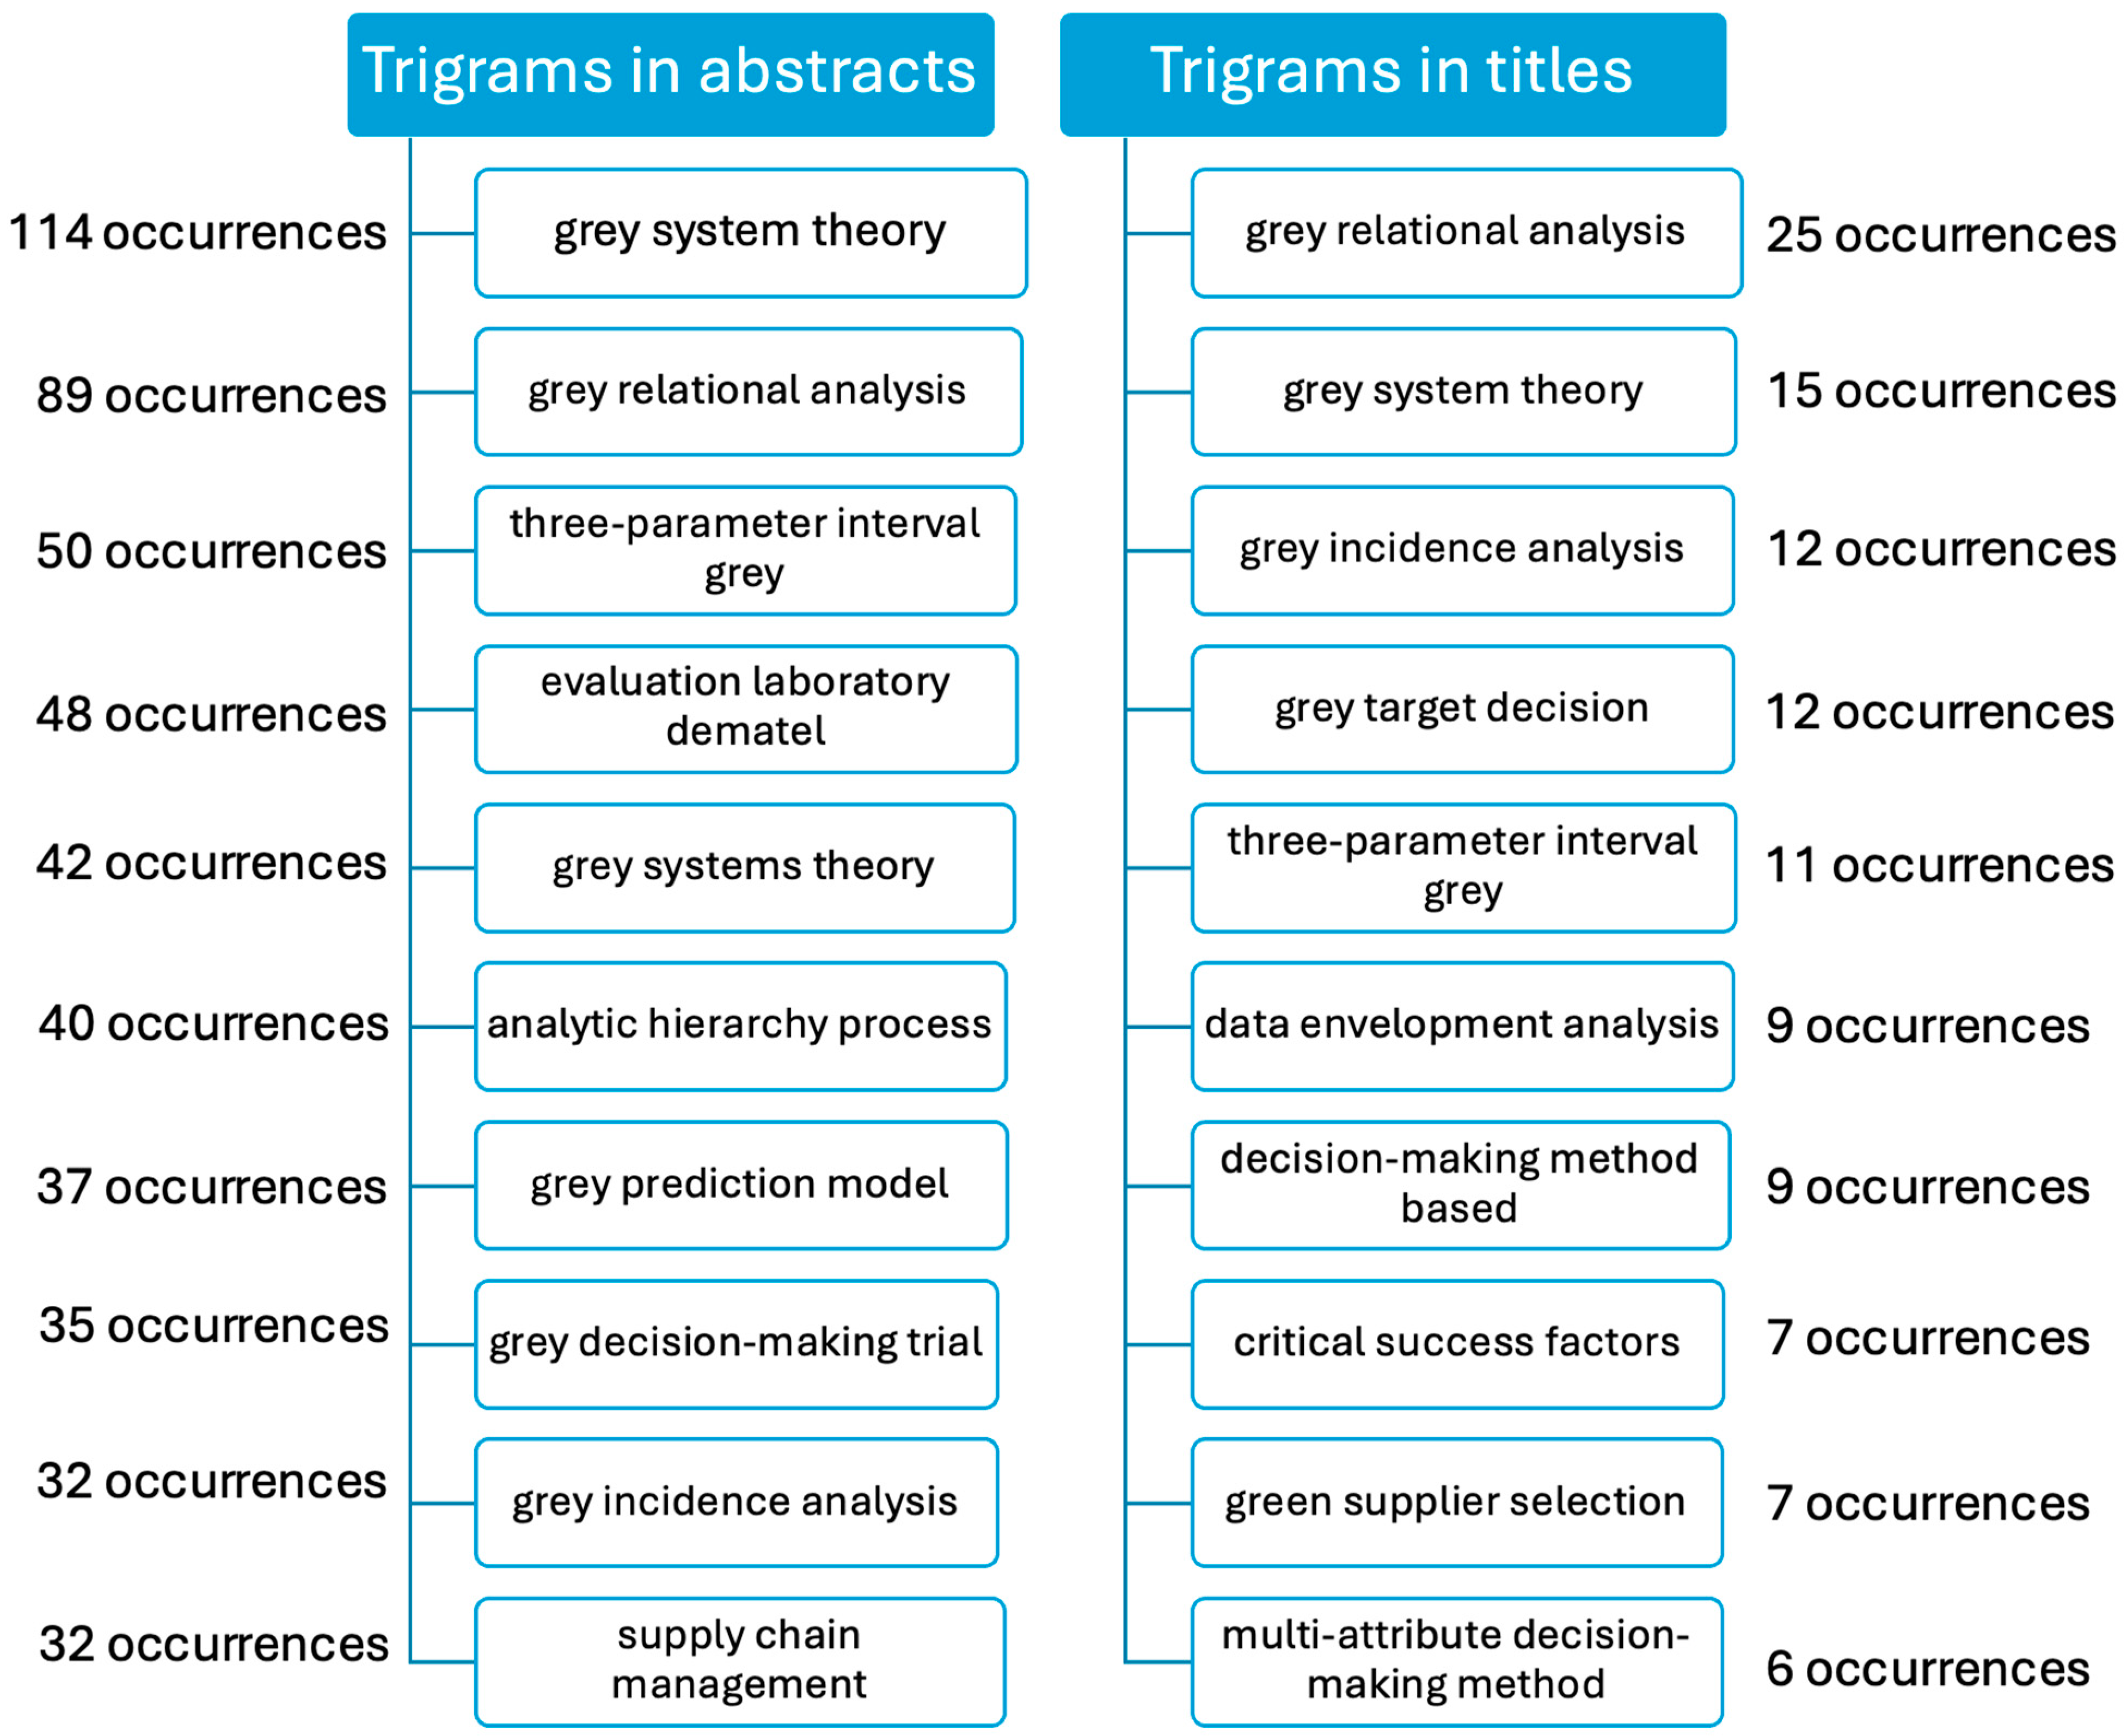
3.4.3. Words Analysis

This subsection is focused on performing a comprehensive words’ analysis, with the intention of highlighting the main topics addressed, trends, and unknown details in the domain of grey systems and decision-making under uncertainty.
The insights uncovered due to the various words’ examinations (Keywords Plus, authors’ keywords, bigrams, trigrams) and visual illustration (co-occurrence networks, thematic maps), represent crucial information, useful for both the authorities and scientific community. By offering an overview of this area, aspects in need of further attention or improvement, together with effective strategies can be easily identified, examined, and implemented.
The most used words in Keywords Plus are highlighted in Figure 17. Those terms provide interesting details about the documents’ content, highlighting the great results that grey systems have on decision-making under uncertainty, in terms of performance, by using various models and frameworks. Grey systems have a strong impact on complex systems, assisting in selection and optimization, being oriented to significant criteria, addressing barriers, and improving management.
The words are listed below, according to the number of occurrences:
  • “model” (200 occurrences)
  • “selection” (105 occurrences)
  • “management” (99 occurrences)
  • “performance” (88 occurrences)
  • “optimization” (57 occurrences)
  • “system” (55 occurrences)
  • “framework” (47 occurrences)
  • “barriers” (44 occurrences)
  • “decision-making” (43 occurrences)
  • “criteria” (42 occurrences)
The following analysis is oriented towards the top 10 most frequent words in authors’ keywords, captured in Figure 18. These terms further demonstrate that the papers’ key topics addressed are associated with grey systems’ contribution to the decision-making field under uncertainty, employing various approaches, such as grey system theory (GST) techniques, grey relational analysis, multi-criteria decision-making (MCDM) methods, decision-making trial and evaluation laboratory (DEMATEL), grey-DEMATEL, etc.
Please find below the complete list, ordered based on the number of occurrences:
  • “grey theory” (86 occurrences)
  • “grey relational analysis” (45 occurrences)
  • “grey system theory” (45 occurrences)
  • “DEMATEL” (41 occurrences)
  • “decision making” (39 occurrences)
  • “grey number” (33 occurrences)
  • “MCDM” (32 occurrences)
  • “grey systems theory” (30 occurrences)
  • “grey-DEMATEL” (27 occurrences)
  • “decision-making” (26 occurrences)
Please find below two word clouds in Figure 19, for both Keywords Plus and authors’ keywords. The terms’ size is influenced by their number of occurrences in the data collection set related to grey systems and the decision-making field under uncertainty.
Figure 20 captured the top 10 most frequent bigrams in abstracts and titles, together with their number of occurrences.
When discussing bigrams in abstracts, the competition at the top is close. On the first position, it is situated “supply chain”—171 occurrences, followed by “interval grey”—169 occurrences, “proposed model”—153 occurrences, “grey system”—149 occurrences, “grey theory”—139 occurrences, “grey relational”—136 occurrences, “system theory”—128 occurrences, “grey model”—127 occurrences, “decision makers”—126 occurrences, and “evaluation laboratory”—116 occurrences.
As for the bigrams in titles, the ranking distribution is listed here in order: “interval grey”—41 occurrences, “grey model” and “supply chain”—36 occurrences, “supplier selection”—33 occurrences, “grey relational”—32 occurrences, “relational analysis”—31 occurrences, “decision-making method”—27 occurrences, “method based”—24 occurrences, “grey incidence” and “grey system”—23 occurrences.
All those mentioned terms prove the dataset’s strong focus on the grey system’s application in decision-making under uncertainty, especially in the supply chain field.
Moreover, the top 10 most frequent trigrams in abstracts and titles were similarly extracted in Figure 21.
In the case of trigrams in abstracts, the following terms were noticed: “grey system theory”—114 occurrences, “grey relational analysis”—89 occurrences, “three-parameter interval grey”—50 occurrences, “evaluation laboratory DEMATEL”—48 occurrences, “grey systems theory”—42 occurrences, “analytic hierarchy process”—40 occurrences, “grey prediction model”—37 occurrences, “grey decision-making trial”—35 occurrences, “grey incidence analysis” and “supply chain management”—32 occurrences.
In the context of trigrams in titles, the ordered list is “grey relational analysis”—25 occurrences, “grey system theory”—15 occurrences, “grey incidence analysis” and “grey target decision”—12 occurrences, “three-parameter interval grey”—11 occurrences, “data envelopment analysis” and “decision-making method based”—9 occurrences, “critical success factors” and “green supplier selection”—7 occurrences, and “multi-attribute decision-making method”—6 occurrences.
These trigrams further strengthen the idea uncovered due to bigrams analysis: the manuscripts included in the dataset are oriented toward grey systems’ performance on decision-making under uncertainty, the optimal methods employed, and their high efficiency, especially in supply chain management.
Figure 22 represents a co-occurrence network for the terms in the author’s keywords, and distinguishes the following 10 different clusters:
  • Cluster 1 (marked in red): grey model, forecasting, prediction, data envelopment analysis. This first cluster indicates research oriented on grey models for forecasting and prediction, involving data envelopment analysis.
  • Cluster 2 (marked in blue): grey-DEMATEL, barriers, supply chain management. The second cluster highlights the performance of the grey-DEMATEL method in identifying and addressing challenges and barriers, especially in supply chain management.
  • Cluster 3 (marked in light grey): grey prediction, multi-criteria decision making. The third cluster is related to the use of grey prediction, together with multi-criteria decision making, considering multiple factors, in uncertain and complex situations.
  • Cluster 4 (marked in purple): decision making, grey number, grey systems theory, decision-making, grey numbers, uncertainty, interval grey number, grey systems, grey system, optimization, interval grey numbers, cybernetics, fuzzy logic, grey decision making, COPRAS-G. The fourth cluster is focused on grey systems theory and grey numbers, more specifically on their performance in decision-making under uncertainty, employing various techniques and methods, such as fuzzy logic, cybernetics, and COPRAS-G.
  • Cluster 5 (marked in light orange): three-parameter interval grey number, multi-attribute decision making. The fifth cluster discusses decision-making in uncertain or complex situations, by using three-parameter interval grey number and multi-attribute decision making.
  • Cluster 6 (marked in brown): grey clustering, group decision-making. The sixth cluster is oriented to the use of grey clustering methods in group decision-making to better manage the uncertainty.
  • Cluster 7 (marked in pink): grey theory, grey relational analysis, grey system theory, DEMATEL, MCDM, supplier selection, multi-criteria decision-making, sustainability, sustainable development, TOPSIS, analytic hierarchy process, COVID-19, performance evaluation, AHP, supply chain. The seventh cluster addresses the necessity of integrating grey systems in decision-making during uncertain and difficult situations, especially in establishing strategies for key domains, such as healthcare (COVID-19 pandemic), supply chain (supplier selection), sustainability, through the use of multiple techniques and methods (DEMATEL, MCDM, multi-criteria decision-making, TOPSIS, analytic hierarchy process)
  • Cluster 8 (marked in grey): grey-DEMATEL, critical success factors. The following cluster combines grey-DEMETEL with critical success factors, proving to be an efficient approach for making decisions, in case of incomplete data.
  • Cluster 9 (marked in dark green): grey incidence analysis. The next cluster focused on grey incidence analysis, a performant method that is very efficient in measuring similarity between variables.
  • Cluster 10 (marked in dark orange): ANP. The last cluster is oriented to another decision-making method, useful for multi-criteria decision-making, namely the analytic hierarchy process (ANP).
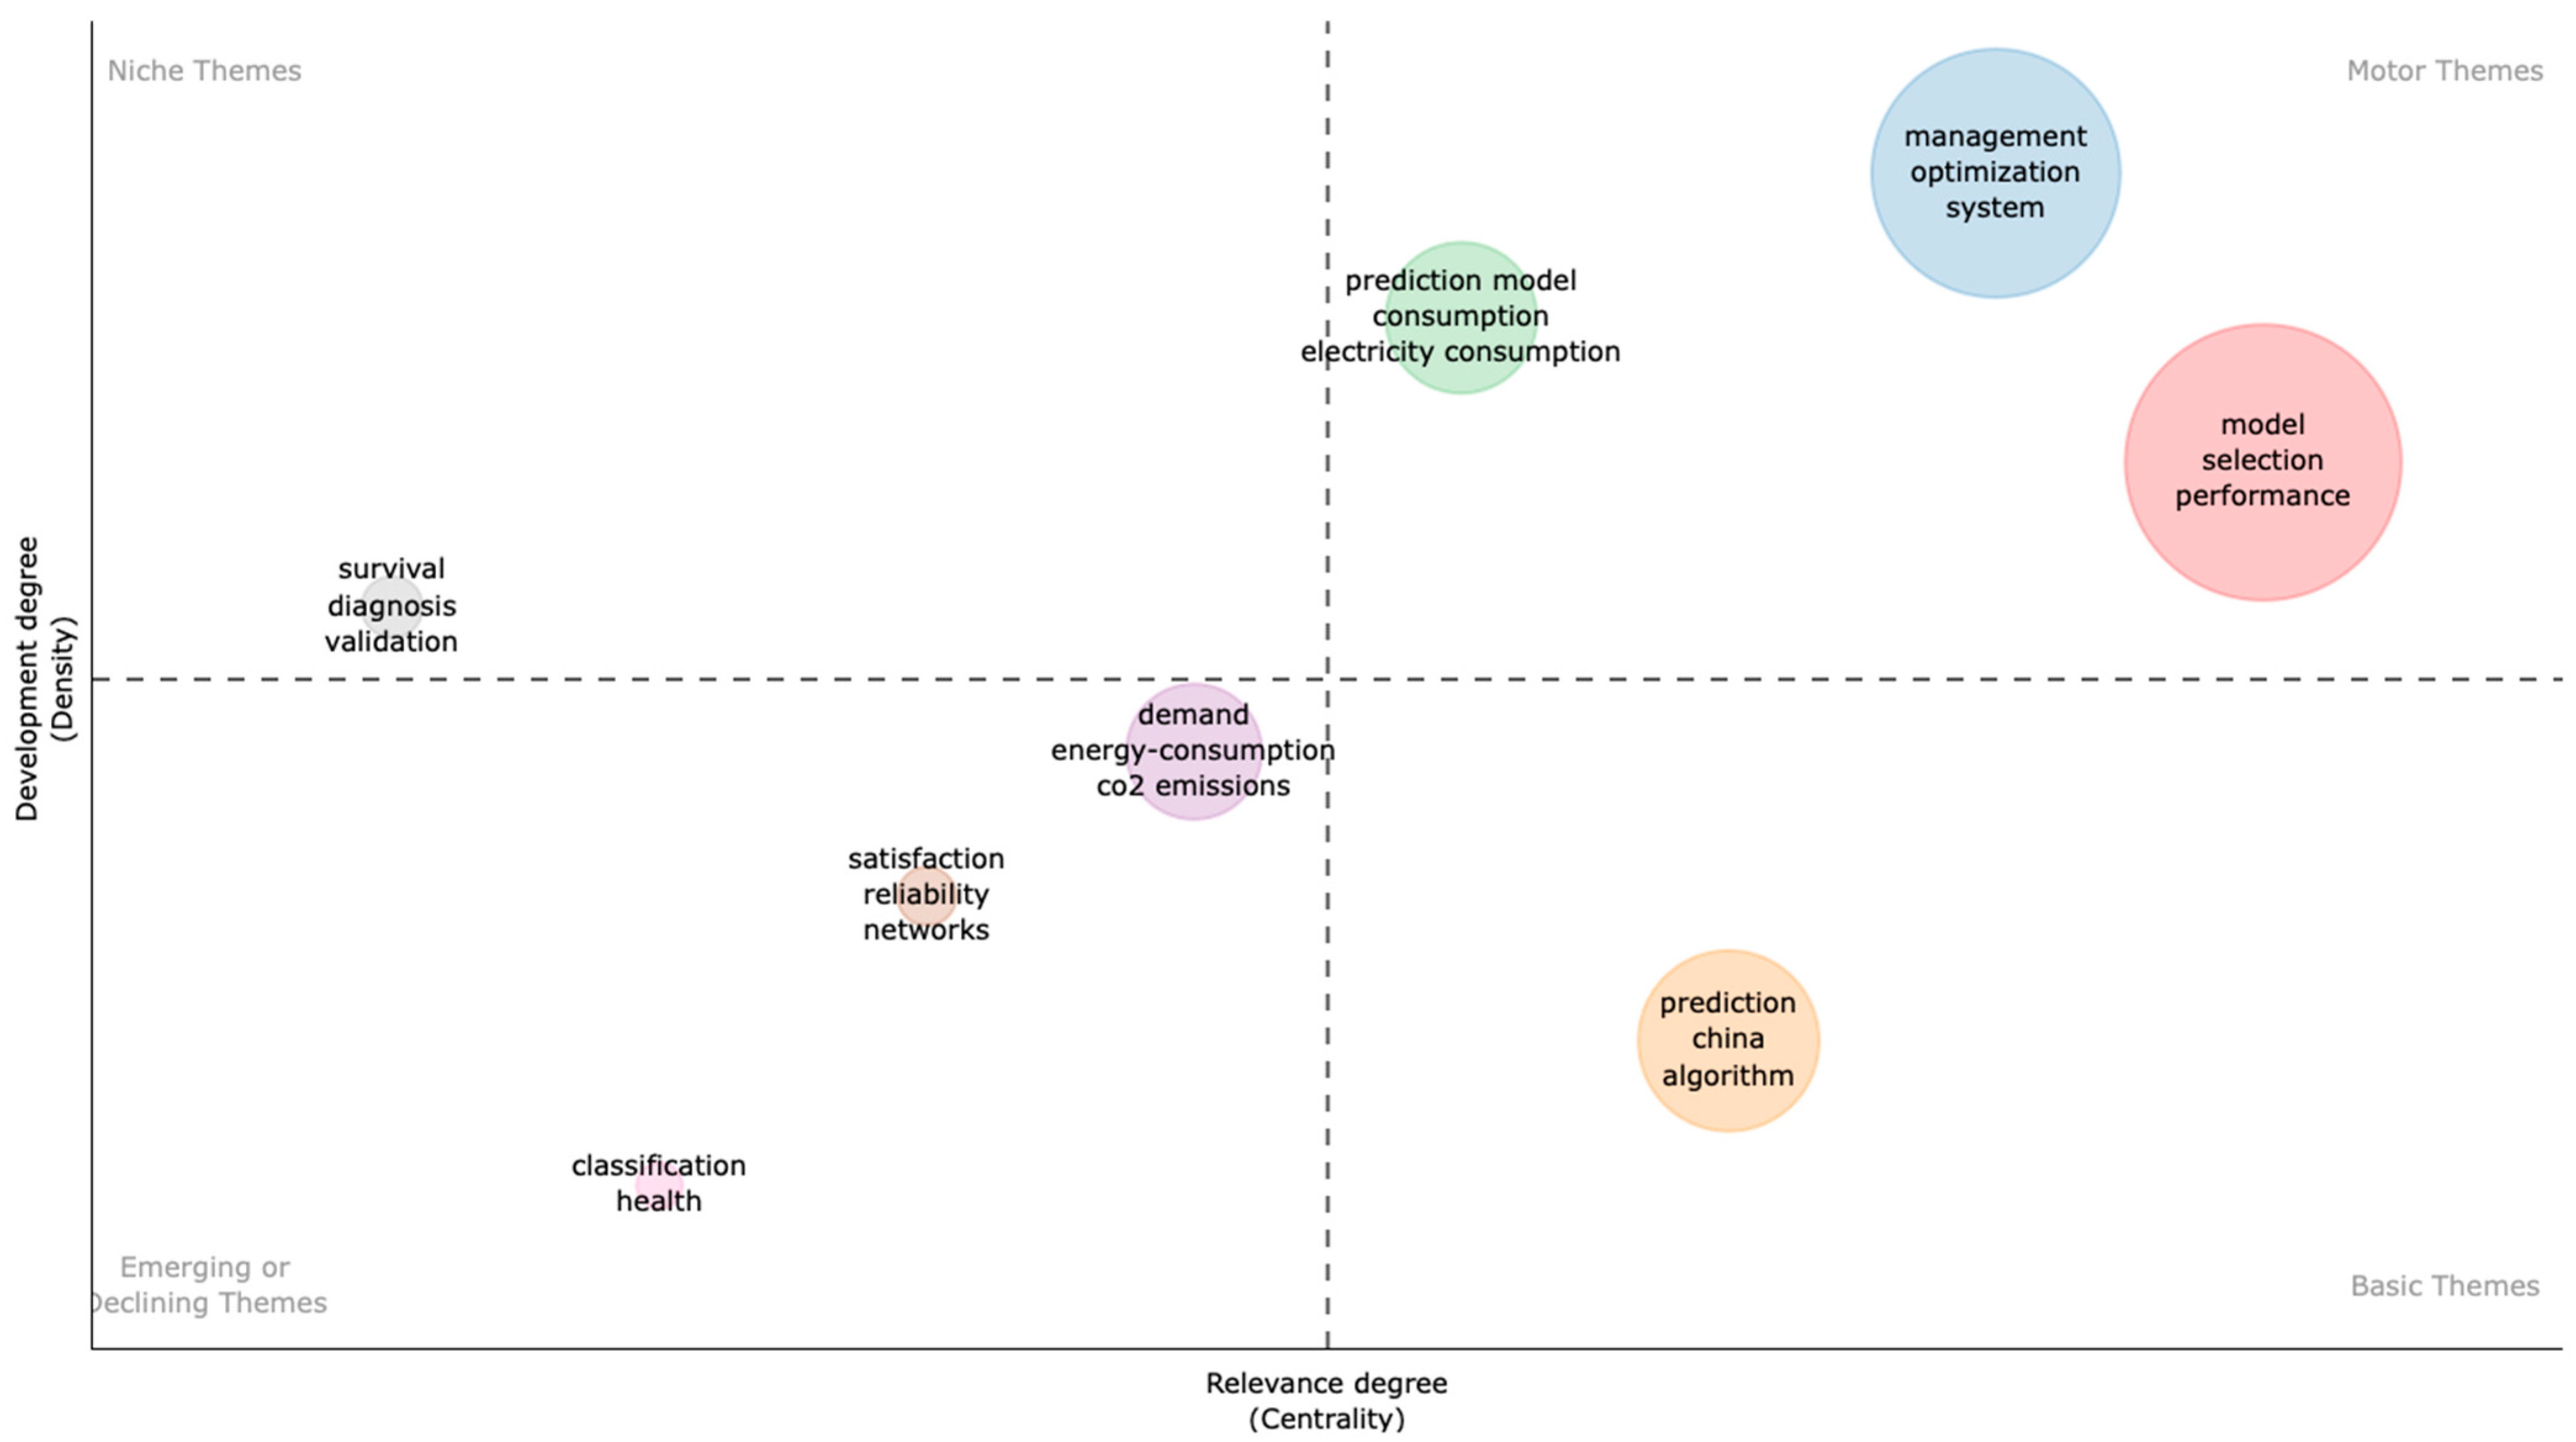
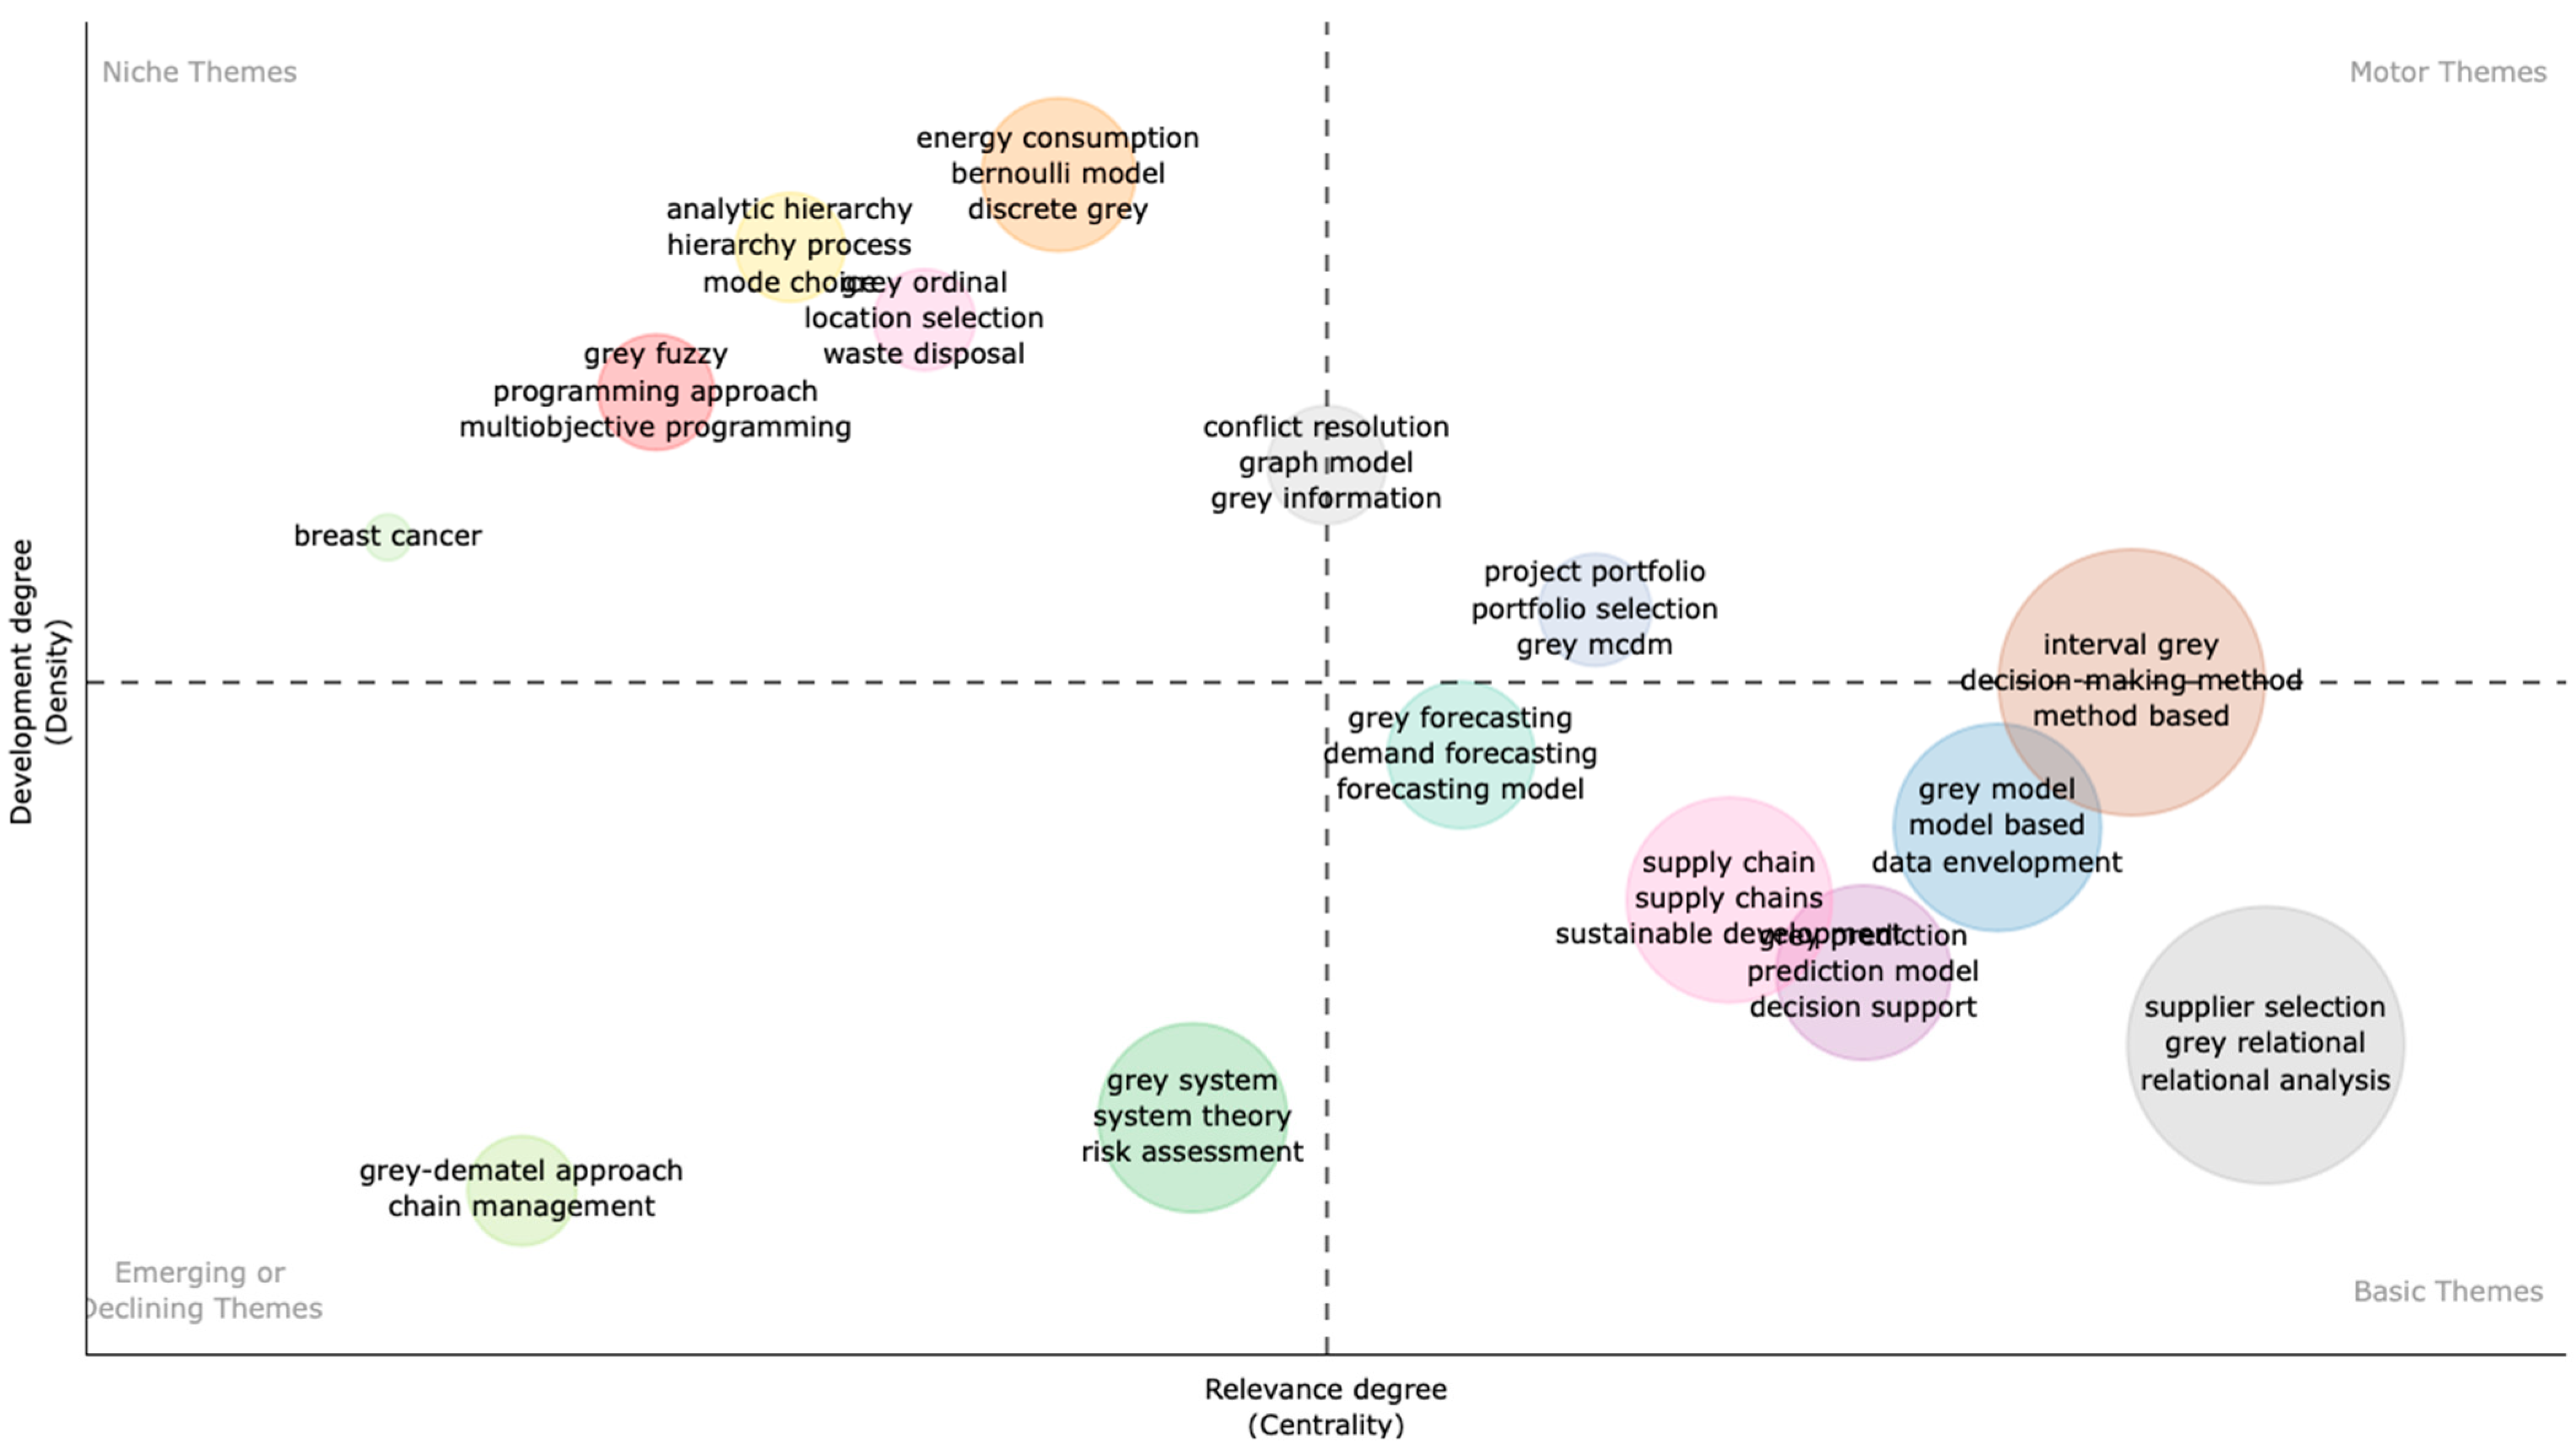
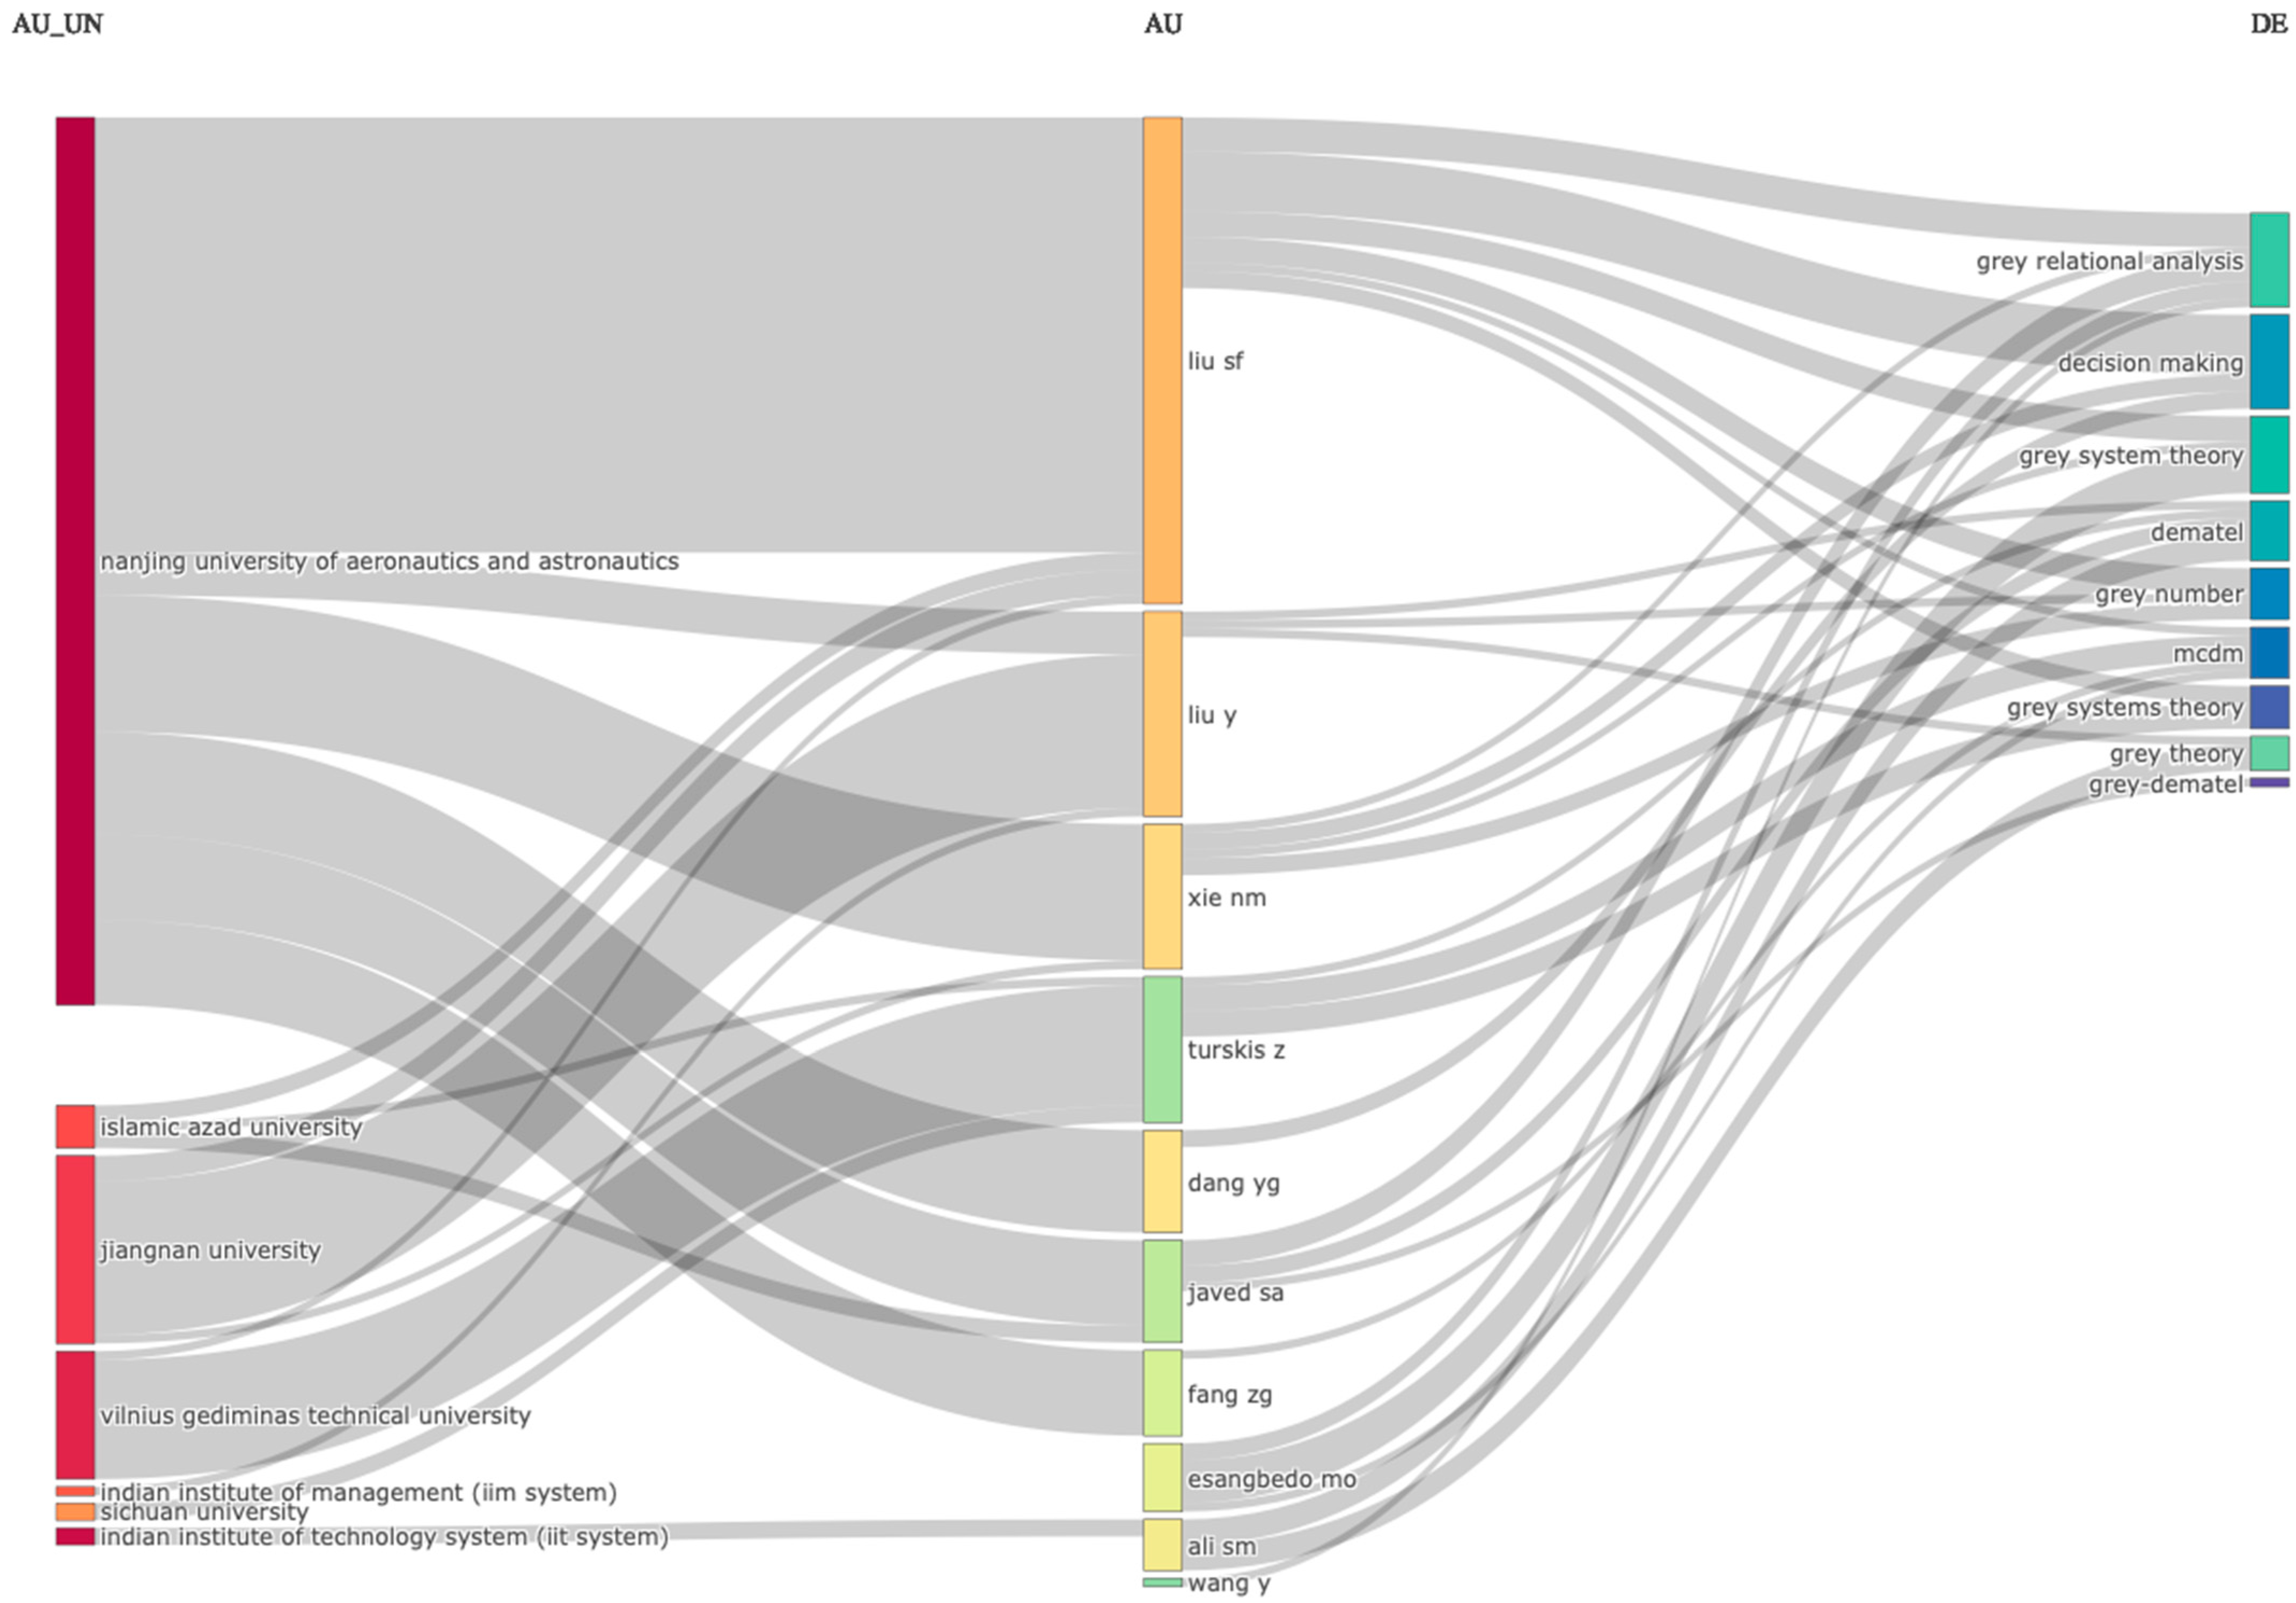
Figure 23 represents a thematic map based on Keywords Plus, highlighting four theme categories.
The first one—niche themes, noticed in the top left corner, includes three words related to grey systems’ power on decision-making under uncertainty, particularly in the healthcare context: “survival”, “diagnosis”, and “validation”.
The second category—motor themes, placed in the top right corner, consists of some Keywords Plus, associated with grey systems’ contribution to energy management decision-making processes: “prediction model”, “consumption”, “electricity consumption”, “management”, “optimization”, “system”, “model”, “selection”, and “performance”.
In the case of basic themes, found in the bottom right corner, the following words are noticed: “prediction”, “China”, and “algorithm”. These keywords suggest the efficiency of grey systems’ algorithms on prediction and decision-making, in uncertain or complex situations related to large countries, such as China.
Finally, emerging or declining themes, placed in the bottom left corner, include key domains in which grey systems have a significant contribution to decision-making during uncertain situations: “demand”, “energy-consumption”, “CO2 emissions”, “satisfaction”, “reliability”, “networks”, “classification”, and “health”.
In order to better comprehend this domain, another thematic map was included in the current bibliometric investigation, this time focused on titles—Figure 24.
Niche themes include topics associated with decision-making in various domains (e.g., healthcare, energy management), including different approaches and techniques: “energy consumption”, “Bernoulli model”, “discrete grey”, “analytic hierarchy”, “mode choice”, “grey ordinal”, “location selection”, “waste disposal”, “grey fuzzy”, “programming approach”, “multi-objective programming”, and “breast cancer”.
Motor themes highlight grey MDCM methods’ efficiency in project management: “project portfolio”, “portfolio selection”, and “grey MCDM”.
At the intersection between niche themes and motor themes, there are noticed keywords related to solving conflicts, employing graph models and grey information: “conflict resolution”, “graph model”, and “grey information”.
Basic themes consist of terms connected with forecasting and decision-making in the supply chain domain, employing grey models: “grey forecasting”, “demand forecasting”, “forecasting model”, “supply chain”, “supply chains”, “sustainable development”, “grey prediction”, “prediction model”, “decision support”, “grey model”, “model based”, “data envelopment”, “supplier selection”, “grey relational”, and “relational analysis”.
At the intersection between motor themes and basic themes, some approaches for the decision-making field under uncertainty are noticed: “interval grey”, “decision making method”, and “method based”.
Lastly, emerging or declining themes are oriented to engaging grey systems in the decision-making field, particularly focused on chain management: “grey-DEMATEL approach”, “chain management”, “grey system”, “system theory”, and “risk assessment”.

3.5. Mixed Analysis

The last subsection included in this section consists of some mixed analyses that will uncover interesting details and hidden aspects of the connection between various categories. The categories that will be considered are listed here: countries, authors, journals, affiliations, and keywords.
Figure 25 represents the first three-fields plot, which highlights the relationship between countries (left), authors (middle), and journals (right).
When discussing countries, as expected, China’s high involvement in writing scientific research around grey systems and the decision-making field under uncertainty is clearly visible. Other relevant countries that had a significant contribution in this domain, are listed here: the USA, the United Kingdom, Iran, India, Canada, and Australia.
In terms of authors, the top 3 most contributing scientists in this area, with respect to the number of published papers are Liu SF, Liu Y, and Xie NM.
Going further with the discourse, when analyzing the journals, one can observe that the scientists prefer to publish their research in certain sources that mainly focus on science and technology, relevant to their studies about grey systems and decision-making under uncertainty: Journal of Grey System, Grey Systems-Theory and Application, Kybernetes, Journal of Cleaner Production, Energy, Journal of Intelligent & Fuzzy Systems, Sustainability, Mathematical Problems in Engineering, and Expert Systems with Applications.
Furthermore, based on this illustration, there is a high tendency for national and international collaborations between authors. The scientists’ tendency to publish their studies in different sources, instead of focusing on a specific one, is also visible at this point.
To provide a comprehensive overview of this domain, another three-fields plot was designed in Figure 26, this time including the relationship between other categories: affiliations (left), authors (middle), and keywords (right).
In terms of affiliation, the most relevant one in this field, based on the number of published papers, is the Nanjing University of Aeronautics and Astronautics.
Similar to what was already discovered, the most involved authors are Liu SF, Liu Y, and Xie NM.
The most frequent keywords found in the data collection set are: “decision making”, “grey relational analysis”, “grey system theory”, “DEMATEL”, “grey number”, “MCDM”, “grey systems theory”, “grey theory”, and “grey-DEMATEL”. These terms describe some of the methods and techniques that have a significant contribution to the decision-making field under uncertainty.
Based on this visual representation, another remark becomes visible: there are scientists connected with multiple affiliations from the top 10 most relevant universities, and at the same time, authors who are not linked with any of them.

4. Discussion

This section is divided into two main subsections. The first one presents the key findings of the bibliometric analysis and compares them with other results found in similar papers, while the second one focuses on discussing how grey systems contribute to decision-making in fields of high importance.

4.1. Key Findings Discovered in This Research Paper and Cross-Examination with Similar Investigations from the Scientific Community

The most important findings revealed due to this bibliometric investigation are going to be highlighted and discussed in this section.
Considering the high interest in grey systems and the decision-making field under uncertainty, especially during these challenging times, the authors redirected their attention to this domain and conducted a comprehensive bibliometric examination of the existing scientific literature.
For gathering the data collection set, the WoS database was used, where predefined filters were applied in order to obtain only the relevant papers. Initially, the scientists searched for some specific terms associated with grey systems and decision-making and chose only the papers that included both concepts. At this step, plural forms of the words, and regional spelling variations (e.g., “grey”/“gray”) were taken into account. After this, language restriction was applied, retrieving only English-written papers, followed by the document type constraint for selecting only the works marked as “articles” in WoS database. Finally, the papers published within the ongoing year were excluded, considering it an incomplete year in terms of publications. As a result, a final data collection set composed of 885 manuscripts, written in English, and published within 353 sources, throughout a 33-year period (1992–2024), was selected for this bibliometric analysis.
The paper followed an organized structure and divided the bibliometric examination into multiple stages. In the beginning, there are provided general details about the dataset (dataset overview), followed by sources’ exploration, authors’ investigation, and review of the papers and their contents, together with mixed analysis. With the assistance of the R-tool Biblioshiny, the authors generated various tables, and visual representations, that were in-depth discussed and explained. The graph for the annual scientific production evolution, average article citations per year evolution, core sources by Bradford’s law, sources’ local impact based on H-index, most relevant authors’ representation, country scientific production, country partnerships, authors’ collaboration network, words’ analysis, word clouds, co-occurrence networks, thematic maps, and three-fields plots are just some examples of investigations found in this manuscript.
It is noticed that the grey systems’ power in the decision-making field under uncertainty is a topic that gained considerable interest from academics and captivated a large audience for a long time. The first paper from the dataset was published in 1992, and it was followed by many others until this moment, a fact which underlines the academic continuous involvement in this sector. This remark is also validated by the academic growth rate, more specifically 17.1%. Due to the evolution of technology, the techniques based on grey systems are more and more efficient in handling uncertainty, making choices in complex systems, predicting, selecting the best strategies, and assessing risks across various domains.
In terms of annual scientific production, it is visibly a predominantly upward trend, with the field experiencing a gradual advancement. In the early period, there were not published more than two papers per year, reaching up to 115 articles in 2022. This significant contribution in the last years may be a result of some economic and medical events, global crises, or even technological advancements. Apart from these, the high number of citations registered by these papers proves again the academics’ interest in this field of research (e.g., the average citations per document = 25.52, average citations per year per document = 3.32, number of references = 31,981).
The most relevant source with respect to the number of published papers is the Journal of Grey System, which published no less than 78 articles on the topic of grey systems and the decision-making field under uncertainty. A remark arises at this point: the authors choose to publish their manuscripts in journals that are oriented towards the addressed domain. Moreover, the impact and the high significance of a source are further strengthened by its regular presence in the hierarchy of the most relevant journals, found in other bibliometric studies, and oriented across various domains. By investigating the scientific community, it is observed that this journal is found at the top of other bibliometric studies as well [88,89].
Apart from these findings, it is noticed that Mathematics is also found in the top 10 most relevant sources not only in this study but also in other bibliometric papers [71], proving its high importance and substantial visibility in the scientific community. This further strengthens the authors’ accurate decision to publish the current research in this journal.
Bradford’s law on source clustering, positioned the top journals in the core, demonstrating their significant productivity and high relevance, as they are widely cited. Similarly, H-index analysis listed at the top, most of the sources found in Zone 1, according to Bradford’s law.
Going further with the discussion, the most prolific author considering the number of published papers is Liu SF, who contributed 45 articles related to grey systems and decision-making under uncertainty.
In terms of affiliations, the first place in the ranking is held by Nanjing University of Aeronautics and Astronautics, with 65 manuscripts.
The corresponding authors’ countries’ examination further uncovered interesting details. The leading contributors in this domain are China and India. This is not surprising since those regions are highly involved in writing papers across various subjects, being regularly placed in the top rankings of other bibliometric studies (e.g., [53,54,90,91,92,93]).
There was observed a high tendency of collaboration within countries, and partnerships between authors in conducting studies oriented towards grey systems and decision-making field under uncertainty. As a result, only a modest number of papers arise from individual contributions.
China is the region that registered 39 international collaborations with developed countries like Australia, the USA, the United Kingdom, Germany, France, and many more.
After conducting the analysis of the top 10 most globally cited papers, some details must be highlighted. It is noticed that only two out of ten manuscripts are the result of a single researcher’s effort, while the others involve no less than three academics. The diversity of culture, perspectives, increased impact, and visibility in these papers are proved by the international collaborations (most of the papers included at least two researchers that have another region of provenance).
All the papers included in the hierarchy involve different grey systems techniques for addressing the challenges in decision-making processes under uncertainty, in various domains and areas, including manufacturing, healthcare, automotive, municipal solid waste, supplier selection, drilling process, service quality, construction, and warehouse locations. The main methods discussed are grey decision-making trial evaluation laboratory (DEMATEL), grey-fuzzy DEMATEL, grey linear programming (GLP), analytic network process (ANP), grey relational analysis (GRA), complex proportional assessment of alternatives with grey relations (COPRAS-G), analytic hierarchy process (AHP), techniques for order preference by similarity to ideal solution (TOPSIS), and elimination and choice expressing reality (ELECTRE). The studies used data from either experts’ responses, different research papers, hypothetical data, experiments, or even surveys. The papers highlight the high efficiency of these methods and the improved results obtained by using these approaches. The above grey systems techniques proved to have a strong contribution in handling uncertainty, predicting, and optimizing decision-making processes by considering more criteria, improving risk assessment, and choosing the best strategies even in the case of unknown or incomplete data.
Words’ analysis confirms once again that the papers’ key topics addressed are associated with grey systems contribution to the decision-making field under uncertainty, employing various approaches (e.g., DEMATEL, GRA, multi-criteria decision-making methods, etc.), which registered significant results in various fields.
The co-occurrence network for the terms in the author’s keywords depicts 10 distinct clusters, each with specific keywords. Thematic maps strengthen the previous findings and provide the main topics (e.g., “diagnosis”, “prediction model”, “optimization”, “model”, “selection”, “algorithm”, “satisfaction”, “health”, “risk assessment”, etc.).
Apart from what was already mentioned, due to mixed analysis, some aspects become visible: scientists tend to publish their studies in different sources, instead of focusing on a specific one; there are scientists connected with multiple affiliations from the top 10 most relevant universities, and at the same time, authors which are not linked with any of them.

4.2. Grey Decision-Making in Fields of Research Importance

This subsection is dedicated to examining the contribution of grey systems to decision-making under uncertainty in fields of research importance.

4.2.1. Grey Decision-Making for Supplier Selection

The process of selecting suppliers is a domain that attracted the attention of many academics. Grey systems make a substantial contribution in this area and can help people involved in this process to make informed decisions considering various factors (e.g., price, quality of services, delivery time, etc.) and adopt efficient strategies, even in the case of incomplete information.
By analyzing the top 10 most globally cited papers present in the data collection set used in this bibliometric article, two out of ten papers are oriented to this sector ([10,84]).
Searching more within the academic literature, other relevant papers are noticed.
Song et al. [94] are focused on environmental protection and discuss the serious need to select the best green suppliers. The authors offered an efficient solution, namely a sequential group three-way decision-making (TWDM) method, that considers multiple attributes related to both suppliers’ services and ecology. A case study about a manufacturer oriented to automobiles is also presented and the approach’s efficiency is demonstrated. The suppliers are divided into three distinct categories (“accepted”, “rejected”, and the ones that need additional examination).
Baghizadeh et al. [95] address a challenge associated with supplier disruption, in the case of spare parts inventory administration. In order to address this, the authors used four algorithms (Grey Wolf Optimizer—GWO, Genetic—GA, Moth–Flame Optimization—MFO, and Differential Evolution—DE), and the one that registered the best results was GWO. The scientists recommend not focusing exclusively on reliable suppliers but also taking into account the ones that are unreliable since this might represent a good strategy in crisis situations.
Other relevant studies are about eco-friendly resilient supply chain [96], construction supply chain [97], and automotive [98].
As in the area of supplier selection, the sub-area of green supplier selection has started to get more and more attention from the scientific community. It is expected that future research in the applicability area of grey systems theory will focus more on aspects related to green supplier selection [1,84]. As for methodological approaches, it is expected that hybrid approaches will be created and tested in the area of supplier selection, in which the advantages offered by the grey systems theory will be combined with the advantages offered by the newly created artificial intelligence theories in order to obtain better solutions to the complex supplier selection problem [99,100].

4.2.2. Grey Decision-Making in Health Management

Health management is another key domain in which grey systems have an important contribution. The COVID-19 pandemic is one of the most recent medical events that affected the entire worldwide population and the usual course of daily activities. Such events have a major impact and demonstrate the necessity of fast adaptation to complex and general crisis situations.
By analyzing the top ten most globally cited papers present in the data collection set used in this bibliometric article, there is found one paper that investigates the risk prediction of coronary heart disease (CHD)’s apparition [82].
Javed et al. [101] used the power of grey relational analysis (GRA) models and the Hurwicz criteria to analyze a dataset related to health, including both public and private sectors in Pakistan. The manuscript provides insights into how service quality can influence patients’ satisfaction and demonstrates two main things, reliability and responsiveness, as the key factors and, in general, patients tend to opt for private clinics. Grey systems prove again their high efficiency and make great decisions, no matter the sample’s size.
Ceylan [102] wrote a manuscript around the recent global pandemic caused by the COVID-19 virus and focused on preventing its spread. A hybrid approach with Grey Modelling (1,1) and particle swarm optimization algorithm (PSO) was used for predicting the spread in the short term in three developed countries (the USA, Germany, and Turkey). This technique registers great accuracy, in comparison to traditional methods, and contributes to enhancing decision-making related to the allocation of resources in hospitals, and prevention strategies.
Other research papers discuss grey systems in medical tourism [103], drug production [104], and pharmaceutical care [105].
With the occurrence of various future disruptive events in the area of health and health management, it is expected that grey systems theory be more and more used in the analyses performed in this area in the years to follow, mostly due to its ability to work on small datasets and uncertainty conditions, which will enable its use on limited and noisy data.

4.2.3. Grey Decision-Making in Education

Another important field of interest is education. The rapid evolution of technology requires a constant adaptation in this area, by directly reporting to students’ needs and interests and facilitating the educational process by using the most suitable e-learning collaboration platforms and tools (e.g., digital whiteboards, virtual laboratories, e-books, etc.).
Lee et al. [106] redirects his attention to kindergarten’s selection. Nowadays, with the increasing number of kindergartens, it becomes more and more difficult for parents to decide upon the best option for their children. This study focuses on Taiwan country and provides support for parents, in ranking the available kindergartens and offering suggestions, using the power of two methods: grey relational grade (GRG) and GM (0,N).
Aria et al. [107] addressed the issue of burnout in the time of the COVID-19 pandemic when the classes were held in a virtual environment. After collecting the questionnaire responses from both undergraduate and graduate students, the Gray-DEMATEL technique was used to identify the main factors that cause burnout among students. These findings may represent crucial information in combating this challenge and can assist authorities in decision-making by finding the best strategies for reducing stress and exhaustion and improving the teaching process.
Other grey systems-oriented studies from the scientific community discuss e-learning platforms’ selection [39], teaching performance [108], and breakfast programs in schools [109].
Furthermore, as the new digital era and the occurrence of the COVID-19 pandemic have enabled distance learning and the development of Massive Open Online Courses (MOOCs), grey systems theory can be further used in the analyses related to this new education area, especially for analyzing the dropout situations and the determinants that have conducted to the manifestation of these situations [110].

4.2.4. Grey Decision-Making in the Economy

Similarly, grey systems have an important contribution to decision-making in the economy, too. They can help with predicting potential economic trends (e.g., inflation), planning strategies, improving processes, increasing production, estimating the effects generated by some economic measures, etc., using limited data.
Chen and Nguyen [111] focus on the inflation in Vietnam. Considering the fact that this issue affected the development of the economy in the mentioned country, the authors investigated the main factors that influence it using Grey Relational Analysis (GRA). The results uncovered interesting details and should be considered by the authorities in future decision-making.
Kokocińska et al. [112] introduced a novel indicator called “Synthetic Efficiency Indicator for Economic Growth” (“SEI-EG”). Its purpose is to measure the effect that economic growth expenses have on sustainable development. The authors used Grey System Theory and built the hierarchy of 15 European countries, based on the mentioned indicator, and it was observed that compared to larger countries, small ones show increased efficiency. These findings are very helpful for authorities and also for improving the decision-making processes and future sustainable growth strategies.
Other relevant studies around grey systems that should be mentioned here discuss the strength of the national economy [113], grey systems’ use in economic areas [43], and grey-green infrastructure systems [114].
As further research areas, grey systems theory can continue to be used in the above-mentioned economic areas, as well as can expand their use over the analysis of various economic aspects related to small businesses and family businesses as these entities are operating in turbulent and complex environments, with an increased degree of uncertainty [115,116].

4.2.5. Grey Decision-Making in Finance

When discussing finance, with the help of grey systems, there can be predicted financial events (e.g., market trends, stock prices) and even assessed financial risks related to investments or credits. Apart from these, with the assistance of grey systems, potential anomalies in financial transactions can be identified, credit scoring for customers can be improved, and decisions related to future actions (e.g., expansion of businesses) can be made.
Rathnayaka et al. [117] are focused on a financial domain, more specifically on using grey prediction models for forecasting short-term stock market trends in a particular region (Sri Lanka). As expected, the proposed approach performed better than traditional methods.
Yuan and Jing [118] wrote an article about the real estate industry, more specifically they were oriented to risk assessment in this domain, in Liaoning Province, over a timespan of 20 years (2001–2020). The authors involved multiple regression analysis, along with grey prediction methods and the results showed that the risks can be controlled in this region. Such investigations are very helpful for the ones interested in this domain since they provide insights on how to manage risk efficiently and make the best financial decisions.
Other papers in this area address the following topics: financial risks in China’s companies [119], enterprises with venture capital [120], financial risks in commercial banks [121], and portfolio management under capital market frictions [122].
Based on the above discussion and by further analyzing the current scientific literature, it was observed that many scientists opted to use hybrid approaches to decision-making using grey systems theory, since in this case the results are improved, compared to traditional methods. Interested readers can also read [99,123,124,125,126].

5. Limitations

This section is dedicated to discussing the research papers’ limitations. The first limitation is related to database selection. As previously mentioned, the WoS database has been selected based on various considerations such as the database’s high popularity, increased visibility, and usage in other similar studies. It should be stated that using another database could have resulted in obtaining slightly different results.
Furthermore, as a series of steps have been considered in dataset extraction, some papers might have been omitted due to the considered selection steps of the dataset. Extending or relaxing the selection steps could have conducted two different results than the ones presented in the paper.
Another limitation is represented by the language of the papers included in the dataset. By considering the papers written in other languages than English, the results might have been different. Also, the exclusion of the papers written in 2025—as this year has not been completed yet at the time of the analysis, namely February 2025, could also be mentioned among the study’s limitations.

6. Conclusions

The main purpose of this manuscript was to offer a comprehensive overview of the current scientific literature oriented towards grey systems and the decision-making field under uncertainty and to understand the contribution that these techniques and algorithms have on risk assessment, optimization, choosing alternatives, and even deciding upon most suitable and efficient strategies, in any given domain.
As for this bibliometric examination, a set of papers related to both grey systems and decision-making was collected exclusively from the WoS database. In order to ensure the relevance of the dataset, multiple filters were applied (keywords search, language, document type, and publishing year). After all these steps, a final set of 885 papers, written in English, and published within 353 sources, throughout a 33-year period (1992–2024), was selected. The investigation was divided into multiple sections (dataset overview, sources, authors, papers, and mixed analyses), and the creation of visual representations was done with the assistance of Biblioshiny.
The key findings are listed below and they respond to the formulated research questions:
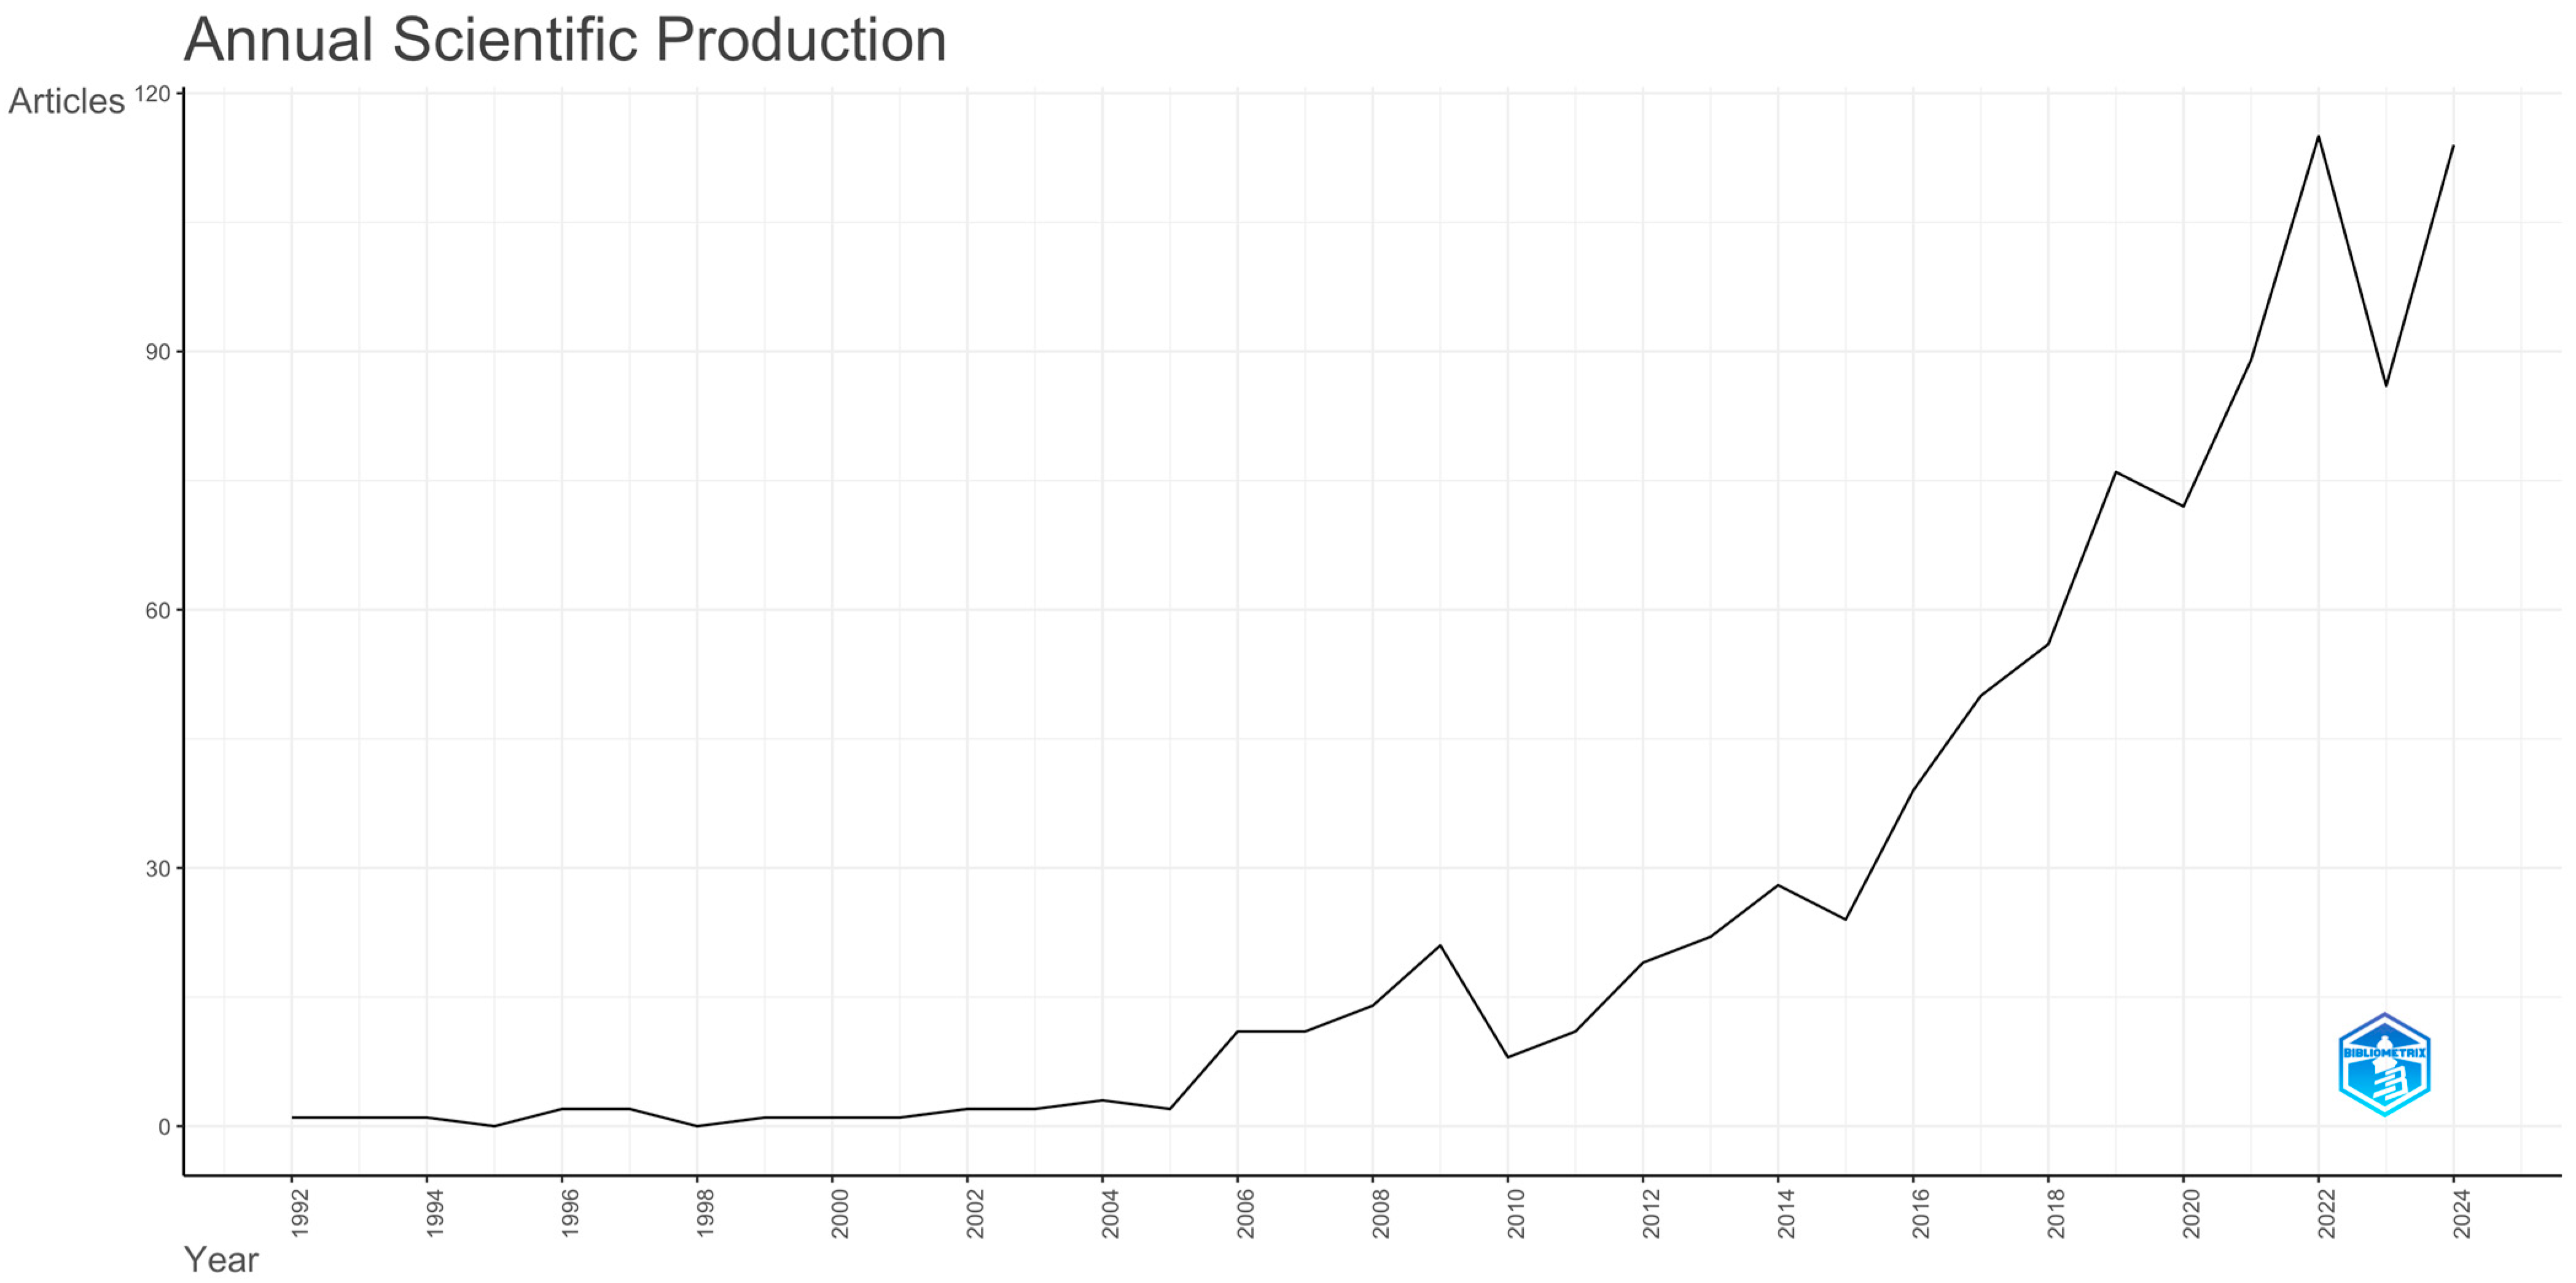
  • Grey systems’ power in the decision-making field under uncertainty is a topic that gained scientists’ interest for a long time, a statement validated by the annual growth rate value (17.15%).
  • The advancement of this domain was gradual. It had a modest beginning in 1992, reaching up to 115 articles in 2022.
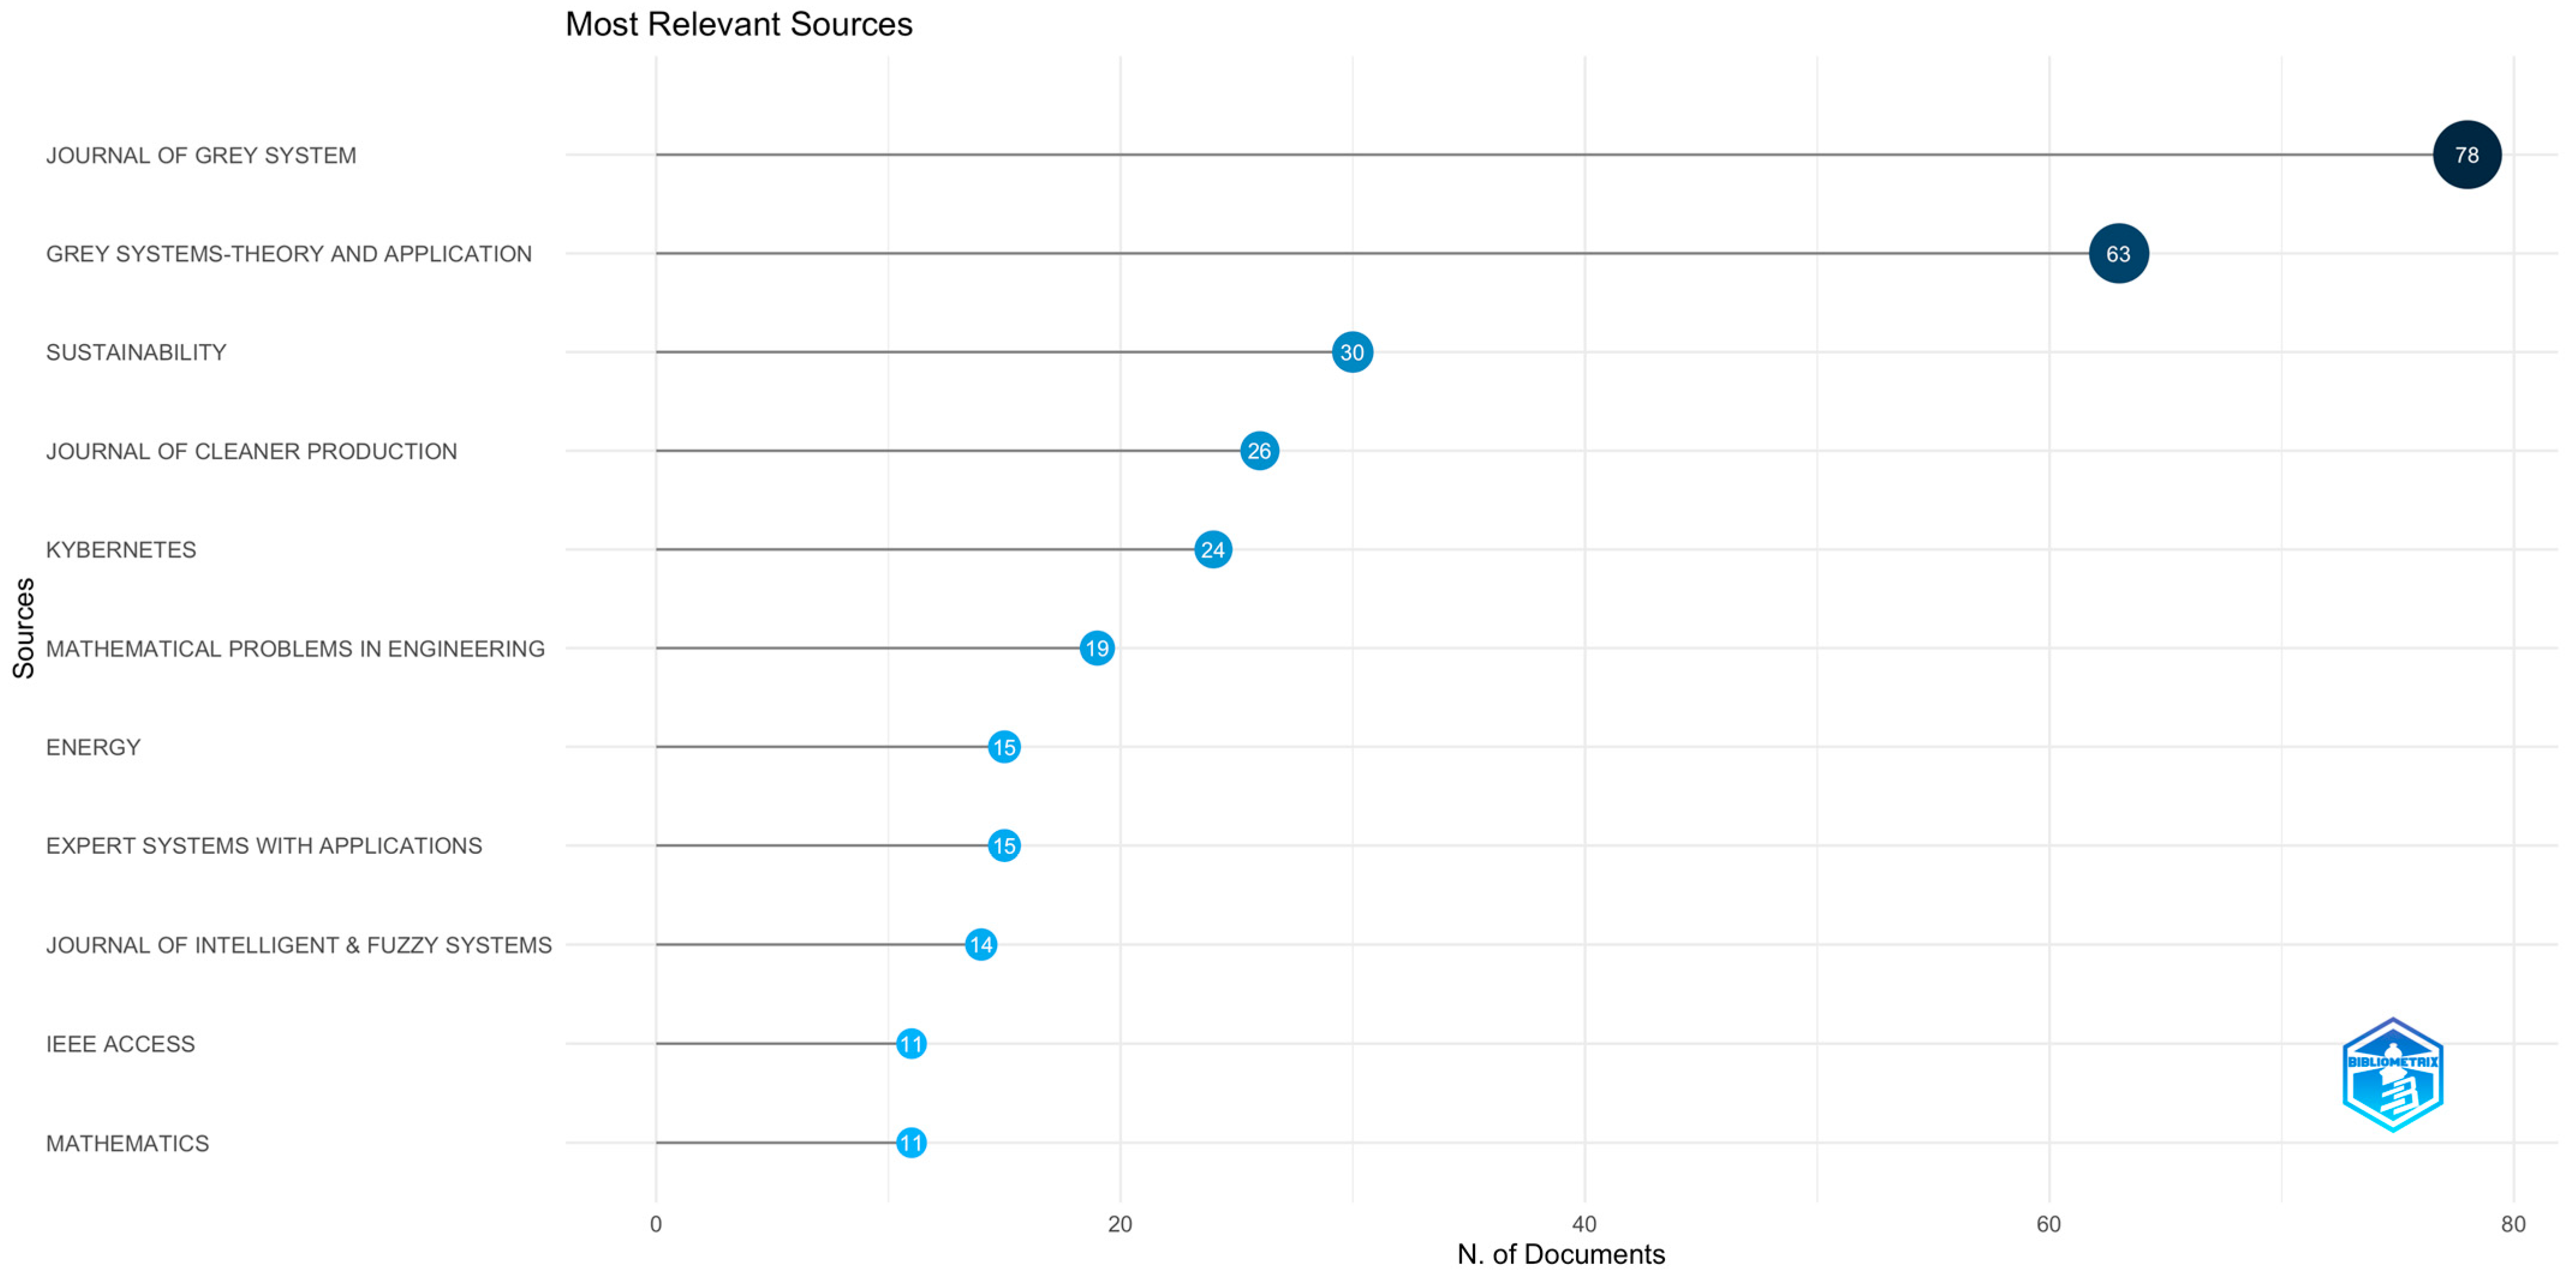
  • The Journal of Grey System was the most relevant source, considering the number of publications in this domain (78 articles).
  • The author with the greatest number of research papers conducted around grey systems and the decision-making field under uncertainty is Liu SF (45 articles).
  • The Nanjing University of Aeronautics and Astronautics is ranked first in the top of most relevant affiliations based on the number of published papers (65 manuscripts).
  • The leading contributors in this domain are China, followed by India.
  • The tendency of collaborations in this sector is significant, including both national and international partnerships.
  • The analysis of the top 10 most globally cited papers demonstrates that all of them are related to grey systems’ contribution to the decision-making field under uncertainty, employing various approaches (e.g., DEMATEL, GRA, ANP, AHP, ELECTRE, etc.), across different domains (e.g., manufacturing, healthcare, automotive, supplier selection, construction, etc.), and employing data from many sources (e.g., surveys, experts’ responses, hypothetical data, etc.).
  • Words’ analysis and thematic maps illustrations uncovered some key topics addressed in the data collection set: “diagnosis”, “prediction model”, “optimization”, “model”, “selection”, “algorithm”, “satisfaction”, “health”, “risk assessment”, etc.
That being said, nowadays, during these challenging times, it is crucial to adapt to the ongoing global change, in order to react appropriately during crisis situations, and make informed decisions. Considering the papers extracted and included in the dataset, it has been observed that grey systems techniques hybridization through the use of DEMATEL, ANP, AHP, TOPSIS, GLP, COPRAS-G, and ELECTRE proved to be very efficient in dealing with decision-making under uncertainty, optimizing processes, improving predictions, and successfully managing risks.
This study includes information and key insights that can be considered by both the academics who want to further explore this domain or extend this study, and authorities involved in decision-making processes. Grey systems have a strong contribution to modern problem-solving and can easily be integrated within almost all industries.

Author Contributions

Conceptualization, A.S., P.D., C.D., and A.D.; Data curation, A.S., P.D., and C.D.; Formal analysis, A.S., P.D., and C.D.; Investigation, A.S., P.D., C.D., and A.D.; Methodology, A.S., C.D., and A.D.; Resources, P.D., and C.D.; Software, A.S., C.D., and A.D.; Supervision, C.D.; Validation, A.S., P.D., C.D., and A.D.; Visualization, A.S., P.D., C.D., and A.D.; Writing—original draft, A.S., and C.D.; Writing—review and editing, P.D., and A.D. All authors have read and agreed to the published version of the manuscript.

Funding

The work is supported by a grant from the Romanian Ministry of Research, Innovation and Digitalization, project CF 178/31.07.2023—‘JobKG—A Knowledge Graph of the Romanian Job Market based on Natural Language Processing’.

Data Availability Statement

Data is contained within the paper.

Conflicts of Interest

The authors declare no conflicts of interest.

References

  1. Delcea, C.; Cotfas, L.-A. (Eds.) Supplier Selection Using Grey Systems Theory. In Advancements of Grey Systems Theory in Economics and Social Sciences; Springer Nature: Singapore, 2023; pp. 85–138. ISBN 978-981-19993-2-1. [Google Scholar]
  2. Liu, S.; Yang, Y.; Xie, N.; Forrest, J. New Progress of Grey System Theory in the New Millennium. Grey Syst. Theory Appl. 2016, 6, 2–31. [Google Scholar] [CrossRef]
  3. Mishra, S.; Datta, S.; Mahapatra, S.S. Grey-based and Fuzzy TOPSIS Decision-making Approach for Agility Evaluation of Mass Customization Systems. Benchmarking Int. J. 2013, 20, 440–462. [Google Scholar] [CrossRef]
  4. Traneva, V.; Atanassova, V.; Tranev, S. Index Matrices as a Decision-Making Tool for Job Appointment. In Proceedings of the Numerical Methods and Applications; Nikolov, G., Kolkovska, N., Georgiev, K., Eds.; Springer International Publishing: Cham, Switzerland, 2019; pp. 158–166. [Google Scholar]
  5. Traneva, V.; Tranev, S.; Mavrov, D. Interval-Valued Intuitionistic Fuzzy Decision-Making Method Using Index Matrices and Application in Outsourcing. In Proceedings of the 2021 16th Conference on Computer Science and Intelligence Systems (FedCSIS), Sofia, Bulgaria, 2–5 September 2021; pp. 251–254. [Google Scholar]
  6. Boukezzoula, R.; Coquin, D. A Decision-Making Computational Methodology for a Class of Type-2 Fuzzy Intervals: An Interval-Based Approach. Inf. Sci. 2020, 510, 256–282. [Google Scholar] [CrossRef]
  7. Ertugrul Karsak, E.; Tolga, E. Fuzzy Multi-Criteria Decision-Making Procedure for Evaluating Advanced Manufacturing System Investments. Int. J. Prod. Econ. 2001, 69, 49–64. [Google Scholar] [CrossRef]
  8. Dombi, J.; Fáró, J.; Jónás, T. A Group Consensus Measure That Takes into Account the Relative Importance of the Decision-Makers. Mathematics 2025, 13, 526. [Google Scholar] [CrossRef]
  9. Bai, X.P.; Wang, H.M. A New Integrated Model about Grey Theory GM (1,2) and Control Theory and Its Application in Decision-Making of Enterprises with Multi-Factors; Ma, Q., Jiao, R.J., Tseng, M.M., Zuo, M.J., Eds.; China Machine Press: Beijing, China, 2005; ISBN 978-7-111-03973-0. [Google Scholar]
  10. Li, G.-D.; Yamaguchi, D.; Nagai, M. A Grey-Based Decision-Making Approach to the Supplier Selection Problem. Math. Comput. Model. 2007, 46, 573–581. [Google Scholar] [CrossRef]
  11. Javed, S.A.; Mahmoudi, A.; Liu, S. Grey Absolute Decision Analysis (GADA) Method for Multiple Criteria Group Decision-Making Under Uncertainty. Int. J. Fuzzy Syst. 2020, 22, 1073–1090. [Google Scholar] [CrossRef]
  12. Kuo, Y.; Yang, T.; Huang, G.-W. The Use of Grey Relational Analysis in Solving Multiple Attribute Decision-Making Problems. Comput. Ind. Eng. 2008, 55, 80–93. [Google Scholar] [CrossRef]
  13. Ju-Long, D. Control Problems of Grey Systems. Syst. Control Lett. 1982, 1, 288–294. [Google Scholar] [CrossRef]
  14. Mi, C.; Tian, M.; Li, X. Study on Credibility Level of Trustworthy Software Development Process Based on Grey Nonlinear Cluster. Kybernetes 2012, 41, 908–919. [Google Scholar] [CrossRef]
  15. Jin, J.; Yu, Z.; Mi, C. Commercial Bank Credit Risk Management Based on Grey Incidence Analysis. Grey Syst. Theory Appl. 2012, 2, 385–394. [Google Scholar] [CrossRef]
  16. Javanmardi, E.; Javanmardi, S.; Xie, N.; Yuan, C. Applying Grey Absolute Degree of Incidence and TOPSIS to Evaluate Financial Performance: Case of Companies of Automotive Industry and Auto-Parts Manufacturing Group in Tehran Stock Exchange. J. Grey Syst. 2021, 33, 43. [Google Scholar]
  17. Domenteanu, A.; Crișan, G.-A.; Frăsineanu, C.; Delcea, C. Exploring Grey Systems in Uncertain Environments: A Bibliometric Analysis of Global Contributions and Research Themes. Sustainability 2025, 17, 2764. [Google Scholar] [CrossRef]
  18. Camelia, D. Grey Systems Theory in Economics—A Historical Applications Review. Grey Syst. Theory Appl. 2015, 5, 263–276. [Google Scholar] [CrossRef]
  19. Javanmardi, E.; Liu, S.; Xie, N. Exploring Grey Systems Theory-Based Methods and Applications in Sustainability Studies: A Systematic Review Approach. Sustainability 2020, 12, 4437. [Google Scholar] [CrossRef]
  20. Liu, S.; Fang, Z.; Xie, N.; Yang, Y. Explanation of Terms of Grey Models for Decision-Making. Grey Syst. Theory Appl. 2018, 8, 382–387. [Google Scholar] [CrossRef]
  21. Liu, S.; Rui, H.; Fang, Z.; Yang, Y.; Forrest, J. Explanation of Terms of Grey Numbers and Its Operations. Grey Syst. Theory Appl. 2016, 6, 436–441. [Google Scholar] [CrossRef]
  22. Liu, S.; Yang, Y. Explanation of Terms of Grey Forecasting Models. Grey Syst. Theory Appl. 2017, 7, 123–128. [Google Scholar] [CrossRef]
  23. Liu, S.; Zhang, H.; Yang, Y. Explanation of Terms of Grey Incidence Analysis Models. Grey Syst. Theory Appl. 2017, 7, 136–142. [Google Scholar] [CrossRef]
  24. Liu, S.; Yang, Y. Explanation of Terms of Grey Clustering Evaluation Models. Grey Syst. Theory Appl. 2017, 7, 129–135. [Google Scholar] [CrossRef]
  25. Liu, S.; Yang, Y.; Forrest, J.; Rui, H. Explanation of Terms of Concepts and Fundamental Principles of Grey Systems. Grey Syst. Theory Appl. 2016, 6, 429–435. [Google Scholar] [CrossRef]
  26. Liu, S.; Xie, N.; Yang, Y.; Forrest, J. Explanation of Terms of Sequence Operators and Grey Data Mining. Grey Syst. Theory Appl. 2016, 6, 442–447. [Google Scholar] [CrossRef]
  27. Delcea, C.; Cotfas, L.-A. Advancements of Grey Systems Theory in Economics and Social Sciences; Springer: Singapore, 2023; ISBN 978-981-19-9931-4. [Google Scholar]
  28. Liu, S.; Yang, Y.; Forrest, J. Grey Data Analysis; Computational Risk Management; Springer: Singapore, 2017; ISBN 978-981-10-1840-4. [Google Scholar]
  29. Mierzwiak, R. Methodological Aspects of Grey Systems Theory in Management Research; Series on Grey System; Springer Nature: Singapore, 2024; ISBN 978-981-97-2412-3. [Google Scholar]
  30. Xie, N.; Wei, B. Grey Forecasting: Mechanism, Models and Applications; Series on Grey System; Springer Nature: Singapore, 2024; ISBN 978-981-97-5322-2. [Google Scholar]
  31. Zeng, B.; Shi, Z. Grey Prediction Methods and Their Applications; Series on Grey System; Springer Nature: Singapore, 2024; ISBN 978-981-97-6614-7. [Google Scholar]
  32. Wu, L.; Chen, Y. Fractional Grey System Model and Its Application; Series on Grey System; Springer Nature: Singapore, 2025; ISBN 978-981-96-3267-1. [Google Scholar]
  33. Emerging Studies and Applications of Grey Systems; Yang, Y., Liu, S., Eds.; Series on Grey System; Springer Nature: Singapore, 2023; ISBN 978-981-19-3423-0. [Google Scholar]
  34. IAGSUA International Association of Grey Systems and Uncertainty Analysis|International Association of Grey Systems and Uncertainty Analysis. Available online: http://www.iagsua.org/ (accessed on 2 February 2025).
  35. GreySys Found. GSSP Grey Systems Society of Pakistan. Available online: https://greysystem.org/newsevent/ (accessed on 2 February 2025).
  36. Kayacan, E.; Ulutas, B.; Kaynak, O. Grey system theory-based models in time series prediction. Expert Syst. Appl. 2010, 37, 1784–1789. [Google Scholar] [CrossRef]
  37. (IEEE Systems, Man, and Cybernetics Society Grey Systems-IEEE SMC. Available online: https://www.ieeesmc.org/technical-activities/systems-science-and-engineering/grey-systems (accessed on 22 August 2022).
  38. Kozlowski, D.; Lannelongue, E.; Saudemont, F.; Benamara, F.; Mari, A.; Moriceau, V.; Boumadane, A. A Three-Level Classification of French Tweets in Ecological Crises. Inf. Process. Manag. 2020, 57, 102284. [Google Scholar] [CrossRef]
  39. Toan, P.N.; Dang, T.-T.; Hong, L.T. E-Learning Platform Assessment and Selection Using Two-Stage Multi-Criteria Decision-Making Approach with Grey Theory: A Case Study in Vietnam. Mathematics 2021, 9, 3136. [Google Scholar] [CrossRef]
  40. Shekhawat, S.; Saxena, A.; Zeineldin, R.A.; Mohamed, A.W. Prediction of Infectious Disease to Reduce the Computation Stress on Medical and Health Care Facilitators. Mathematics 2023, 11, 490. [Google Scholar] [CrossRef]
  41. Rao, C.; Gao, Y. Evaluation Mechanism Design for the Development Level of Urban-Rural Integration Based on an Improved TOPSIS Method. Mathematics 2022, 10, 380. [Google Scholar] [CrossRef]
  42. Saxena, A.; Zeineldin, R.A.; Mohamed, A.W. Development of Grey Machine Learning Models for Forecasting of Energy Consumption, Carbon Emission and Energy Generation for the Sustainable Development of Society. Mathematics 2023, 11, 1505. [Google Scholar] [CrossRef]
  43. Delcea, C.; Cotfas, L.-A. State of the Art in Grey Systems Research in Economics and Social Sciences. In Series on Grey System (SGS); Springer: Berlin/Heidelberg, Germany, 2023; pp. 1–44. [Google Scholar]
  44. Delcea, C.; Javed, S.; Florescu, M.S.; Ioanas, C. 35 Years of Grey System Theory in Economics and Education. Kybernetes 2023, 54, 649–683. [Google Scholar] [CrossRef]
  45. Tao, L.; Ailin, L.; Xie, N.; Liu, S. Grey System Theory in Engineering: A Bibliometrics and Visualization Analysis. Grey Syst. Theory Appl. 2022, 12, 723–743. [Google Scholar] [CrossRef]
  46. Jiang, P.; Dong, Z.; Sun, H.; Song, Y.; Zou, Q. Grey System Theory in Supply Chain: Emerging Hotspots and Trends. Grey Syst. Theory Appl. 2025, 15, 124–144. [Google Scholar] [CrossRef]
  47. Anaç, M.; Ayalp, G.G.; Erdayand, K. Prefabricated Construction Risks: A Holistic Exploration through Advanced Bibliometric Tool and Content Analysis. Sustainability 2023, 15, 1916. [Google Scholar] [CrossRef]
  48. Marín-Rodríguez, N.J.; González-Ruiz, J.D.; Valencia-Arias, A. Incorporating Green Bonds into Portfolio Investments: Recent Trends and Further Research. Sustainability 2023, 15, 4897. [Google Scholar] [CrossRef]
  49. WoS Web of Science. Available online: https://webofknowledge.com (accessed on 9 September 2023).
  50. Cobo, M.J.; Martínez, M.A.; Gutiérrez-Salcedo, M.; Fujita, H.; Herrera-Viedma, E. 25 Years at Knowledge-Based Systems: A Bibliometric Analysis. Knowl.-Based Syst. 2015, 80, 3–13. [Google Scholar] [CrossRef]
  51. Mulet-Forteza, C.; Martorell-Cunill, O.; Merigó, J.M.; Genovart-Balaguer, J.; Mauleon-Mendez, E. Twenty Five Years of the Journal of Travel & Tourism Marketing: A Bibliometric Ranking. J. Travel Tour. Mark. 2018, 35, 1201–1221. [Google Scholar] [CrossRef]
  52. Bakır, M.; Özdemir, E.; Akan, Ş.; Atalık, Ö. A Bibliometric Analysis of Airport Service Quality. J. Air Transp. Manag. 2022, 104, 102273. [Google Scholar] [CrossRef]
  53. Yu, J.; Muñoz-Justicia, J. A Bibliometric Overview of Twitter-Related Studies Indexed in Web of Science. Future Internet 2020, 12, 91. [Google Scholar] [CrossRef]
  54. Delcea, C. Grey Systems Theory in Economics—Bibliometric Analysis and Applications’ Overview. Grey Syst. Theory Appl. 2015, 5, 244–262. [Google Scholar] [CrossRef]
  55. Sandu, A.; Ioanăș, I.; Delcea, C.; Florescu, M.-S.; Cotfas, L.-A. Numbers Do Not Lie: A Bibliometric Examination of Machine Learning Techniques in Fake News Research. Algorithms 2024, 17, 70. [Google Scholar] [CrossRef]
  56. Întorsureanu, I.; Oprea, S.-V.; Bâra, A.; Vespan, D. Generative AI in Education: Perspectives Through an Academic Lens. Electronics 2025, 14, 1053. [Google Scholar] [CrossRef]
  57. Delcea, C.; Oprea, S.-V.; Dima, A.M.; Domenteanu, A.; Bara, A.; Cotfas, L.-A. Energy Communities: Insights from Scientific Publications. Oeconomia Copernic. 2024, 15, 1101–1155. [Google Scholar] [CrossRef]
  58. Oprea, S.-V.; Bâra, A. Generative Literature Analysis on the Rise of Prosumers and Their Influence on the Sustainable Energy Transition. Util. Policy 2024, 90, 101799. [Google Scholar] [CrossRef]
  59. Oprea, S.-V.; Bâra, A. Is Artificial Intelligence a Game-Changer in Steering E-Business into the Future? Uncovering Latent Topics with Probabilistic Generative Models. J. Theor. Appl. Electron. Commer. Res. 2025, 20, 16. [Google Scholar] [CrossRef]
  60. ISI, W. KeyWords Plus Generation, Creation, and Changes. Available online: https://support.clarivate.com/ScientificandAcademicResearch/s/article/KeyWords-Plus-generation-creation-and-changes?language=en_US (accessed on 2 March 2024).
  61. Aria, M.; Cuccurullo, C. Bibliometrix: An R-Tool for Comprehensive Science Mapping Analysis. J. Informetr. 2017, 11, 959–975. [Google Scholar] [CrossRef]
  62. Liu, F. Retrieval Strategy and Possible Explanations for the Abnormal Growth of Research Publications: Re-Evaluating a Bibliometric Analysis of Climate Change. Scientometrics 2022, 128, 853–859. [Google Scholar] [CrossRef]
  63. Liu, W. The Data Source of This Study Is Web of Science Core Collection? Not Enough. Scientometrics 2019, 121, 1815–1824. [Google Scholar] [CrossRef]
  64. Nica, I.; Chiriță, N.; Georgescu, I. Triple Bottom Line in Sustainable Development: A Comprehensive Bibliometric Analysis. Sustainability 2025, 17, 1932. [Google Scholar] [CrossRef]
  65. Nica, I. Bibliometric Mapping in the Landscape of Cybernetics: Insights into Global Research Networks. Kybernetes 2024. [Google Scholar] [CrossRef]
  66. Fatma, N.; Haleem, A. Exploring the Nexus of Eco-Innovation and Sustainable Development: A Bibliometric Review and Analysis. Sustainability 2023, 15, 2281. [Google Scholar] [CrossRef]
  67. Stefanis, C.; Giorgi, E.; Tselemponis, G.; Voidarou, C.; Skoufos, I.; Tzora, A.; Tsigalou, C.; Kourkoutas, Y.; Bezirtzoglou, E. Terroir in View of Bibliometrics. Stats 2023, 6, 956–979. [Google Scholar] [CrossRef]
  68. Gorski, A.-T.; Ranf, E.-D.; Badea, D.; Halmaghi, E.-E.; Gorski, H. Education for Sustainability—Some Bibliometric Insights. Sustainability 2023, 15, 4916. [Google Scholar] [CrossRef]
  69. WoS Document Types. Available online: https://webofscience.help.clarivate.com/en-us/Content/document-types.html (accessed on 5 February 2025).
  70. Donner, P. Document Type Assignment Accuracy in the Journal Citation Index Data of Web of Science. Scientometrics 2017, 113, 219–236. [Google Scholar] [CrossRef]
  71. Delcea, C.; Domenteanu, A.; Ioanăș, C.; Vargas, V.M.; Ciucu-Durnoi, A.N. Quantifying Neutrosophic Research: A Bibliometric Study. Axioms 2023, 12, 1083. [Google Scholar] [CrossRef]
  72. Domenteanu, A.; Delcea, C.; Florescu, M.-S.; Gherai, D.S.; Bugnar, N.; Cotfas, L.-A. United in Green: A Bibliometric Exploration of Renewable Energy Communities. Electronics 2024, 13, 3312. [Google Scholar] [CrossRef]
  73. Sandu, A.; Cotfas, L.-A.; Delcea, C.; Crăciun, L.; Molanescu, A.G. Sentiment Analysis in the Age of COVID-19: A Bibliometric Perspective. Information 2023, 14, 659. [Google Scholar] [CrossRef]
  74. Kamath, A.N.; Shenoy, S.S.; Kumar, S. An Overview of Investor Sentiment: Identifying Themes, Trends, and Future Direction through Bibliometric Analysis. Invest. Manag. Financ. Innov. 2022, 19, 229. [Google Scholar] [CrossRef]
  75. Ravšelj, D.; Umek, L.; Todorovski, L.; Aristovnik, A. A Review of Digital Era Governance Research in the First Two Decades: A Bibliometric Study. Future Internet 2022, 14, 126. [Google Scholar] [CrossRef]
  76. Viju, V.G.W. Application of Bradford’s Law of Scattering to the Literature of Application of Application of Bradford’s Law of Scattering to the Literature of Library & Information Science: A Study of Doctoral Theses Citations Submitted to the Universities of Maharashtra, India. Libr. Philos. Pract. 2013, 15, 1–45. [Google Scholar]
  77. Hirsch, J.E. An Index to Quantify an Individual’s Scientific Research Output. Proc. Natl. Acad. Sci. USA 2005, 102, 16569–16572. [Google Scholar] [CrossRef]
  78. Sandu, A.; Cotfas, L.-A.; Stanescu, A.; Delcea, C. Guiding Urban Decision-Making: A Study on Recommender Systems in Smart Cities. Electronics 2024, 13, 2151. [Google Scholar] [CrossRef]
  79. Tosun, N. Determination of Optimum Parameters for Multi-Performance Characteristics in Drilling by Using Grey Relational Analysis. Int. J. Adv. Manuf. Technol. 2005, 28, 450–455. [Google Scholar] [CrossRef]
  80. Tseng, M.-L. A Causal and Effect Decision Making Model of Service Quality Expectation Using Grey-Fuzzy DEMATEL Approach. Expert Syst. Appl. 2009, 36, 7738–7748. [Google Scholar] [CrossRef]
  81. Raj, A.; Dwivedi, G.; Sharma, A.; Lopes de Sousa Jabbour, A.B.; Rajak, S. Barriers to the Adoption of Industry 4.0 Technologies in the Manufacturing Sector: An Inter-Country Comparative Perspective. Int. J. Prod. Econ. 2020, 224, 107546. [Google Scholar] [CrossRef]
  82. Wolbers, M.; Koller, M.T.; Witteman, J.C.M.; Steyerberg, E.W. Prognostic Models With Competing Risks Methods and Application to Coronary Risk Prediction. Epidemiology 2009, 20, 555–561. [Google Scholar] [CrossRef]
  83. HUANG, G.; BAETZ, B.W.; PATRY, G.G. A Grey Linear Pro-Gramming Approach for Municipal Solid Waste Management Planning under Un-Certainty. Civ. Eng. Syst. 2007, 9, 319–335. [Google Scholar] [CrossRef]
  84. Hashemi, S.H.; Karimi, A.; Tavana, M. An Integrated Green Supplier Selection Approach with Analytic Network Process and Improved Grey Relational Analysis. Int. J. Prod. Econ. 2014, 159, 178–191. [Google Scholar] [CrossRef]
  85. Xia, X.; Govindan, K.; Zhu, Q. Analyzing Internal Barriers for Automotive Parts Remanufacturers in China Using Grey-DEMATEL Approach. J. Clean. Prod. 2015, 87, 811–825. [Google Scholar] [CrossRef]
  86. Zavadskas, E.K.; Kaklauskas, A.; Turskis, Z.; Tamošaitienė, J. Selection of the Effec-Tive Dwelling House Walls by Applying Attributes Values Determined at in-Tervals. J. Civ. Eng. Manag. 2010, 14, 85–93. [Google Scholar] [CrossRef]
  87. Özcan, T.; Çelebi, N.; Esnaf, Ş. Comparative Analysis of Multi-Criteria Decision Making Methodologies and Implementation of a Warehouse Location Selection Problem. Expert Syst. Appl. 2011, 38, 9773–9779. [Google Scholar] [CrossRef]
  88. Yin, M.-S. Fifteen Years of Grey System Theory Research: A Historical Review and Bibliometric Analysis. Expert Syst. Appl. 2013, 40, 2767–2775. [Google Scholar] [CrossRef]
  89. Pan, W.; Jian, L.; Liu, T. Grey System Theory Trends from 1991 to 2018: A Bibliometric Analysis and Visualization. Scientometrics 2019, 121, 1407–1434. [Google Scholar] [CrossRef]
  90. Petcu, M.A.; Ionescu-Feleaga, L.; Ionescu, B.-Ș.; Moise, D.-F. A Decade for the Mathematics: Bibliometric Analysis of Mathematical Modeling in Economics, Ecology, and Environment. Mathematics 2023, 11, 365. [Google Scholar] [CrossRef]
  91. Kumar, S.; Patil, R.R.; Kumawat, V.; Rai, Y.; Krishnan, N. A Bibliometric Analysis of Plant Disease Classifification with Artifificial Intelligence Using Convolutional Neural Network. Libr. Philos. Pract. E-J. 2021, 2021, 1–14. [Google Scholar]
  92. Bagane, P.; Mehta, N.; Parth, K.; Nisarg, B.; Sahni, I.; Kotrappa, S. Bibliometric Survey for Stock Market Prediction Using Sentimental Analysis and LSTM. Libr. Philos. Pract. E-J. 2021, 0_1, 21. [Google Scholar]
  93. Mahajan, R.; Gupta, P. A Bibliometric Analysis on The Dissemination of COVID-19 Vaccine Misinformation on Social Media. J. Content Community Commun. 2021, 14, 218–229. [Google Scholar] [CrossRef]
  94. Song, J.; Leng, X.; Liu, Z. Green Supplier Selection Based on Sequential Group Three-Way Decision Making. Mathematics 2023, 11, 4605. [Google Scholar] [CrossRef]
  95. Baghizadeh, K.; Ebadi, N.; Zimon, D.; Jum’a, L. Using Four Metaheuristic Algorithms to Reduce Supplier Disruption Risk in a Mathematical Inventory Model for Supplying Spare Parts. Mathematics 2023, 11, 42. [Google Scholar] [CrossRef]
  96. Malek, A.; Ebrahimnejad, S.; Tavakkoli-Moghaddam, R. An Improved Hybrid Grey Relational Analysis Approach for Green Resilient Supply Chain Network Assessment. Sustainability 2017, 9, 1433. [Google Scholar] [CrossRef]
  97. Wang, T.-K.; Zhang, Q.; Chong, H.-Y.; Wang, X. Integrated Supplier Selection Framework in a Resilient Construction Supply Chain: An Approach via Analytic Hierarchy Process (AHP) and Grey Relational Analysis (GRA). Sustainability 2017, 9, 289. [Google Scholar] [CrossRef]
  98. Dang, T.-T.; Nguyen, N.-A.-T.; Nguyen, V.-T.-T.; Dang, L.-T.-H. A Two-Stage Multi-Criteria Supplier Selection Model for Sustainable Automotive Supply Chain under Uncertainty. Axioms 2022, 11, 228. [Google Scholar] [CrossRef]
  99. Delcea, C.; Cotfas, L.-A. (Eds.) Hybrid Approaches Featuring Grey Systems Theory. In Advancements of Grey Systems Theory in Economics and Social Sciences; Springer Nature: Singapore, 2023; pp. 281–333. ISBN 978-981-19993-2-1. [Google Scholar]
  100. Garcez, T.V.; Cavalcanti, H.T.; de Almeida, A.T. A Hybrid Decision Support Model Using Grey Relational Analysis and the Additive-Veto Model for Solving Multicriteria Decision-Making Problems: An Approach to Supplier Selection. Ann. Oper. Res. 2021, 304, 199–231. [Google Scholar] [CrossRef]
  101. Javed, S.A.; Liu, S.; Mahmoudi, A.; Nawaz, M. Patients’ Satisfaction and Public and Private Sectors’ Health Care Service Quality in Pakistan: Application of Grey Decision Analysis Approaches. Int. J. Health Plann. Manag. 2018, 34, e168–e182. [Google Scholar] [CrossRef] [PubMed]
  102. Ceylan, Z. Short-Term Prediction of COVID-19 Spread Using Grey Rolling Model Optimized by Particle Swarm Optimization. Appl. Soft Comput. 2021, 109, 107592. [Google Scholar] [CrossRef] [PubMed]
  103. Dang, H.-S.; Nguyen, T.-M.-T.; Wang, C.-N.; Day, J.-D.; Dang, T.M. Grey System Theory in the Study of Medical Tourism Industry and Its Economic Impact. Int. J. Environ. Res. Public. Health 2020, 17, 961. [Google Scholar] [CrossRef]
  104. Ge, J.; Peng, B.; Wei, G.; Wan, A. Risk Assessment on Drug Production Safety Based on Grey-Analytic Network Process. Kybernetes 2021, 52, 1127–1148. [Google Scholar] [CrossRef]
  105. de Campos, E.A.R.; Tavana, M.; ten Caten, C.S.; Bouzon, M.; de Paula, I.C. A Grey-DEMATEL Approach for Analyzing Factors Critical to the Implementation of Reverse Logistics in the Pharmaceutical Care Process. Environ. Sci. Pollut. Res. 2021, 28, 14156–14176. [Google Scholar] [CrossRef]
  106. Lee, Y.-P.; Shih, C.-S.; Ding, H.-H.; Guan, Y.-P.; Chen, T.-Y.; Wen, K.-L. Apply Grey System Method in the Influence Factors Weighting Analysis in Kindergarten. In Proceedings of the 2010 Fourth International Conference on Genetic and Evolutionary Computing, Shenzhen, China, 13–15 December 2010. [Google Scholar] [CrossRef]
  107. Aria, A.; Jafari, P.; Behifar, M. Identification of Factors Affecting Student Academic Burnout in Online Education during the COVID-19 Pandemic Using Grey Delphi and Grey-DEMATEL Techniques. Sci. Rep. 2024, 14, 3989. [Google Scholar] [CrossRef]
  108. Murat Ar, I.; Hamzaçebi, C.; Baki, B. Business School Ranking with Grey Relational Analysis: The Case of Turkey. Grey Syst. Theory Appl. 2013, 3, 76–94. [Google Scholar] [CrossRef]
  109. Godin, K.; Stapleton, J.; Kirkpatrick, S.I.; Hanning, R.M.; Leatherdale, S.T. Applying Systematic Review Search Methods to the Grey Literature: A Case Study Examining Guidelines for School-Based Breakfast Programs in Canada. Syst. Rev. 2015, 4, 138. [Google Scholar] [CrossRef]
  110. Cișmașu, I.-D.; Cibu, B.R.; Cotfas, L.-A.; Delcea, C. The Persistence Puzzle: Bibliometric Insights into Dropout in MOOCs. Sustainability 2025, 17, 2952. [Google Scholar] [CrossRef]
  111. Chen, L.-H.; Nguyen, T.-L. Apply Grey Relational Analysis to Determine the Key Factors That Influence Vietnamese Inflation. J. Grey Syst. 2008, 20, 299–310. [Google Scholar]
  112. Kokocińska, M.; Nowak, M.; Łopatka, P. Measuring the Efficiency of Economic Growth towards Sustainable Growth with Grey System Theory. Sustainability 2020, 12, 121. [Google Scholar] [CrossRef]
  113. Lin, Y.; Liu, S. National Economic Strength as Evaluated Using Grey Systems Theory. Kybernetes 2007, 36, 89–97. [Google Scholar] [CrossRef]
  114. Xu, C.; Liu, Z.; Chen, Z.; Zhu, Y.; Yin, D.; Leng, L.; Jia, H.; Zhang, X.; Xia, J.; Fu, G. Environmental and Economic Benefit Comparison between Coupled Grey-Green Infrastructure System and Traditional Grey One through a Life Cycle Perspective. Resour. Conserv. Recycl. 2021, 174, 105804. [Google Scholar] [CrossRef]
  115. Więcek-Janka, E.; Majchrzak, J.; Wyrwicka, M.; Weber, G.W. Application of Grey Clusters in the Development of a Synthetic Model of the Goals of Polish Family Enterprises’ Successors. Grey Syst. Theory Appl. 2020, 11, 63–79. [Google Scholar] [CrossRef]
  116. Santos, E.; Tavares, V.; Tavares, F.O.; Ratten, V. How Is Risk Different in Family and Non-Family Businesses? A Comparative Statistical Analysis during the COVID-19 Pandemic. J. Fam. Bus. Manag. 2022, 12, 1113–1130. [Google Scholar] [CrossRef]
  117. Rathnayaka, R.M.K.T.; Seneviratna, D.M.K.N.; Jianguo, W. Grey System Based Novel Approach for Stock Market Forecasting. Grey Syst. Theory Appl. 2015, 5, 178–193. [Google Scholar] [CrossRef]
  118. Yuan, J.-L.; Jing, N. The Financial Risk of Real Estate Combined Factor Analysis with Grey Prediction in Liaoning Province. PLoS ONE 2024, 19, e0301526. [Google Scholar] [CrossRef]
  119. Tian, N.; Song, Q. Study on the Financial Risk Evaluation of Listed Companies Based on Grey System Theory. In Proceedings of the 2011 International Conference on Management and Service Science, Wuhan, China, 12–14 August 2011; pp. 1–4. [Google Scholar]
  120. Kung, C.-Y.; Wen, K.-L. Applying Grey Relational Analysis and Grey Decision-Making to Evaluate the Relationship between Company Attributes and Its Financial Performance—A Case Study of Venture Capital Enterprises in Taiwan. Integr. Decis. Support 2007, 43, 842–852. [Google Scholar] [CrossRef]
  121. Xu, S. Model for Evaluating the Commercial Banks Financial Risk with Interval Grey Uncertain Linguistic Variables. J. Intell. Fuzzy Syst. 2015, 28, 767–773. [Google Scholar] [CrossRef]
  122. Ţilică, E.V.; Dragotă, V.; Delcea, C.; Tătaru, R.I. Portfolio Management under Capital Market Frictions: A Grey Clustering Approach. Financ. Innov. 2024, 10, 110. [Google Scholar] [CrossRef]
  123. Peng, Y.; Dong, M. A Hybrid Approach of HMM and Grey Model for Age-Dependent Health Prediction of Engineering Assets. Expert Syst. Appl. 2011, 38, 12946–12953. [Google Scholar] [CrossRef]
  124. Sapnken, F.E. A New Hybrid Multivariate Grey Model Based on Genetic Algorithms Optimization and Its Application in Forecasting Oil Products Demand. Grey Syst. Theory Appl. 2023, 13, 406–420. [Google Scholar] [CrossRef]
  125. Wei, G. Grey Relational Analysis Model for Dynamic Hybrid Multiple Attribute Decision Making. Knowl.-Based Syst. 2011, 24, 672–679. [Google Scholar] [CrossRef]
  126. Ahmed, Q.I.; Attar, H.; Amer, A.; Deif, M.A.; Solyman, A.A.A. Development of a Hybrid Support Vector Machine with Grey Wolf Optimization Algorithm for Detection of the Solar Power Plants Anomalies. Systems 2023, 11, 237. [Google Scholar] [CrossRef]
Figure 1. Analysis steps.
Mathematics 13 01278 g001
Figure 2. Bibliometric analysis facets.
Mathematics 13 01278 g002
Figure 3. Annual scientific production evolution.
Mathematics 13 01278 g003
Figure 4. Annual average article citations per year evolution.
Mathematics 13 01278 g004
Figure 5. Top 11 most relevant journals.
Mathematics 13 01278 g005
Figure 6. Bradford’s law on source clustering.
Mathematics 13 01278 g006
Figure 7. Journals’ impact based on H-index.
Mathematics 13 01278 g007
Figure 8. Journals’ growth (cumulative) based on the number of papers.
Mathematics 13 01278 g008
Figure 9. Top 12 authors based on number of documents.
Mathematics 13 01278 g009
Figure 10. Top 6 authors’ production over time.
Mathematics 13 01278 g010
Figure 11. Top 12 most relevant affiliations.
Mathematics 13 01278 g011
Figure 12. Top 10 most relevant corresponding author’s country.
Mathematics 13 01278 g012
Figure 13. Scientific production based on country.
Mathematics 13 01278 g013
Figure 14. Top 10 countries with the most citations.
Mathematics 13 01278 g014
Figure 15. Country collaboration map.
Mathematics 13 01278 g015
Figure 16. Top 50 authors collaboration network.
Mathematics 13 01278 g016
Figure 17. Top 10 most frequent words in Keywords Plus.
Mathematics 13 01278 g017
Figure 18. Top 10 most frequent words in authors’ keywords.
Mathematics 13 01278 g018
Figure 19. Top 50 words based on Keywords Plus (A) and authors’ keywords (B).
Mathematics 13 01278 g019
Figure 20. Top 10 most frequent bigrams in abstracts and titles.
Mathematics 13 01278 g020
Figure 21. Top 10 most frequent trigrams in abstracts and titles.
Mathematics 13 01278 g021
Figure 22. Co-occurrence network for the terms in author’s keywords.
Mathematics 13 01278 g022
Figure 23. Thematic map based on Keywords Plus.
Mathematics 13 01278 g023
Figure 24. Thematic map based on titles.
Mathematics 13 01278 g024
Figure 25. Three-fields plot: countries (left), authors (middle), journals (right).
Mathematics 13 01278 g025
Figure 26. Three-fields plot: affiliations (left), authors (middle), keywords (right).
Mathematics 13 01278 g026
Table 1. Previous bibliometric research papers on grey systems theory.
ReferenceDatabaseSoftwareFocus
Tao et al. [45]WoSCiteSpaceGrey systems theory in engineering.
Jiang et al. [46]WoSCiteSpaceGrey systems theory in supply chain.
Delcea and Cotfas [43]WoSBiblioshinyGrey systems theory in economics and social sciences.
Delcea et al. [44]WoSBiblioshinyGrey systems theory in economics and education.
Domenteanu et al. [17]WoSBiblioshinyGrey systems theory in uncertain environments.
Delcea and Cotfas [1]WoSBiblioshinyGrey systems theory in supplier selection.
Table 2. Data selection steps.
Exploration StepsQuestions on WoSDescriptionQueryQuery NumberCount
1TitleContains one of the grey systems-specific keywords a(((((((((TI=(“grey_system*”)) OR TI=(“grey_number*”)) OR TI=(“grey_cluster*”)) OR TI=(“grey_control*”)) OR TI=(“grey_decision*”)) OR TI=(“grey_incidence*”)) OR TI=(“grey_model*”)) OR TI=(“grey_theor*”)) OR TI=(“grey_sequence*”)) OR TI=(“grey_prediction*”)#13081
Contains one of the grey systems-specific keywords b(((((((((TI=(“gray_system*”)) OR TI=(“gray_number*”)) OR TI=(“gray_cluster*”)) OR TI=(“gray_control*”)) OR TI=(“gray_decision*”)) OR TI=(“gray_incidence*”)) OR TI=(“gray_model*”)) OR TI=(“gray_theor*”)) OR TI=(“gray_sequence*”)) OR TI=(“gray_prediction*”)#2483
2AbstractContains one of the grey systems-specific keywords a(((((((((AB=(“grey_system*”)) OR AB=(“grey_number*”)) OR AB=(“grey_cluster*”)) OR AB=(“grey_control*”)) OR AB=(“grey_decision*”)) OR AB=(“grey_incidence*”)) OR AB=(“grey_model*”)) OR AB=(“grey_theor*”)) OR AB=(“grey_sequence*”)) OR AB=(“grey_prediction*”)#36761
Contains one of the grey systems-specific keywords b(((((((((AB=(“gray_system*”)) OR AB=(“gray_number*”)) OR AB=(“gray_cluster*”)) OR AB=(“gray_control*”)) OR AB=(“gray_decision*”)) OR AB=(“gray_incidence*”)) OR AB=(“gray_model*”)) OR AB=(“gray_theor*”)) OR AB=(“gray_sequence*”)) OR AB=(“gray_prediction*”)#42288
3KeywordsContains one of the grey systems-specific keywords a(((((((((AK=(“grey_system*”)) OR AK=(“grey_number*”)) OR AK=(“grey_cluster*”)) OR AK=(“grey_control*”)) OR AK=(“grey_decision*”)) OR AK=(“grey_incidence*”)) OR AK=(“grey_model*”)) OR AK=(“grey_theor*”)) OR AK=(“grey_sequence*”)) OR AK=(“grey_prediction*”)#54526
Contains one of the grey systems-specific keywords b(((((((((AK=(“gray_system*”)) OR AK=(“gray_number*”)) OR AK=(“gray_cluster*”)) OR AK=(“gray_control*”)) OR AK=(“gray_decision*”)) OR AK=(“gray_incidence*”)) OR AK=(“gray_model*”)) OR AK=(“gray_theor*”)) OR AK=(“gray_sequence*”)) OR AK=(“gray_prediction*”)#6778
4Title/Abstract/KeywordsContains one of the grey systems-specific keywords#1 OR #2 OR #3 OR #4 OR #5 OR #6#710,278
Contains specific words related to decision-making((TI=(decision_mak*)) OR AB=(decision_mak*)) OR AK=(decision_mak*)#8649,586
Contains keywords related to grey systems and decision-making#7 AND #8#91246
5LanguageContains papers in English(#9) AND LA=(English)#101233
6Type of paperInclude only documents marked as “article” by WoS(#10) AND DT=(Article)#11898
6Publication yearExclude 2025(#11) NOT PY=2025#12885
a terms containing “grey” words have been considered; b terms containing “gray” words have been considered.
Table 4. A brief summary of the content of the top 10 most globally cited documents.
No.Paper (First Author, Year, Journal, Reference)TitleMethods UsedDataPurpose
1Raj A, 2020, International Journal of Production Economics, [81]Barriers to the adoption of Industry 4.0 technologies in the manufacturing sector: An inter-country comparative perspectiveGrey Decision-Making Trial
Evaluation Laboratory (DEMATEL)
Data from experts’ responses and from different sources. Provides an overview of the difficulties encountered in the adoption of Industry 4.0 technologies, focusing especially on the domain of manufacturing.
2Wolbers M, 2009, Epidemiology, [82]Prognostic Models with Competing Risks
Methods and Application to Coronary Risk Prediction
Fine and Gray model.
Cause-specific hazards model. Standard Cox model.
Data was gathered from the Rotterdam Study, consisting of medical information about 4144 women, between 55 and 90 years old, who did not have CHD at the beginning of the study. Understand and predict how different factors can influence the apparition of coronary heart disease (CHD) in the case of older women.
3Huang GH, 2007, Civil Engineering Systems, [83]A grey linear programming approach for municipal solid waste management planning under uncertaintyGrey Linear Programming (GLP).
Simplex algorithm.
Hypothetical data for three municipalities.Offer a novel grey linear programming model (GLP) for dealing with uncertainty in the domain of management planning associated with municipal solid waste.
4Hashemi SH, 2015, International Journal of Production Economics, [84]An integrated green supplier selection approach with an analytic network process and improved grey relational analysisAnalytic network process (ANP).
Grey relational analysis (GRA).
A case study about the automotive industry and opinions from experts.Develop a model for green supplier selection making use of both ANP and GRA, taking into account more factors (economic, environmental).
5Tosun N, 2006, The International Journal of Advanced Manufacturing Technology, [79]Determination of optimum parameters for multi-performance characteristics in drilling by using grey relational analysisGrey relational analysis (GRA).
Taguchi method.
Experiments were performed on the Tezsan M35ES drilling machine, using multiple tool materials.Optimize the drilling process by making use of grey relational analysis, considering various factors.
6Xia XQ, 2015, Journal of Cleaner Production, [85]Analyzing internal barriers for automotive parts remanufacturers in China using the grey-DEMATEL approachGrey Decision-Making Trial and Evaluation Laboratory (DEMATEL).Internal
barriers for remanufacture, after discussing with experts and industrial managers.
Identify and analyze using grey DEMATEL the internal barriers for remanufacturing in the domain of automotive, with an emphasis on China.
7Li GD, 2007, Mathematical and Computer Modelling,
[10]
A grey-based decision-making approach to the supplier selection problemGrey theory.
Grey relational analysis (GRA).
Grey possibility degree.
Multiple attribute decision-making (MADM).
Normalization.
Simulated data related to six suppliers.Combat the challenge associated with the selection of suppliers under uncertainty, by proposing a grey-based decision-making approach.
8Tseng ML, 2009, Expert Systems with Applications, [80]A causal and effect decision-making model of service quality expectation using a grey-fuzzy DEMATEL approachGrey-fuzzy DEMATEL.The answer of 280 customers to a survey with 21 questions.Identify the factors that influence the service quality, employing the use of grey-fuzzy DEMATEL for customers’ satisfaction, in the real estate domain.
9Zavadskas EK, 2008, Journal of Civil Engineering & Management, [86]Selection of the effective dwelling house walls by applying attribute values determined at intervalsGrey theory.
Complex Proportional assessment of alternatives with grey relations (COPRAS-G).
Data from other research papers.
Experts’ opinions.
Addressing the challenges in decision-making processes related to the construction management sector, considering multiple factors.
10Özcan T, 2011, Expert Systems with Applications, [87]Comparative analysis of multi-criteria decision-making methodologies and implementation of a warehouse location selection problemAnalytic hierarchy process (AHP).
Techniques for order preference by similarity to ideal solution (TOPSIS).
Elimination and choice expressing reality (ELECTRE).
Grey Theory
Data about warehouses, and relevant factors for assessing their location selection.Offering an overview of the AHP, TOPSIS, ELECTRE, and Grey Theory, comparing and assessing them in selecting the best warehouse location, and considering relevant factors.
Disclaimer/Publisher’s Note: The statements, opinions and data contained in all publications are solely those of the individual author(s) and contributor(s) and not of MDPI and/or the editor(s). MDPI and/or the editor(s) disclaim responsibility for any injury to people or property resulting from any ideas, methods, instructions or products referred to in the content.

