Abstract
In order to assess the potential and suitability of a location to deploy a wind farm, it is essential to have a model of the joint probability density function of the wind speed and direction, fV,Θ(v,θ). The angular–linear model is widely used to obtain the analytical expression of the joint density from the parametric estimation of the probability density functions of wind speed, fV(v), and wind direction, fΘ(θ). In previous studies, the parameters of the marginal distributions were obtained by fitting the wind measurements to the cumulative distribution function (CDF) using the least squares method and then calculating the probability density function (PDF). In this study, we propose to directly fit the probability density function and then calculate the cumulative distribution function. It is shown that it has both computational and goodness-of-fit advantages. In addition, previous studies have been expanded, analysing the effect of the number of intervals on which wind speed and direction ranges are divided. The new parameter fitting method is evaluated and compared with the original proposal in terms of goodness of fit, using the coefficient of determination R2 as an estimator both in the probability density function (R2pdf) and in the cumulative distribution function (R2cdf). The computational times required to estimate the parameters using both methods will also be compared. The new approach is faster, and the goodness of the fitting is satisfactory for both estimators: it produces a better R2pdf, without significantly affecting the R2cdf, in contrast to the initial one where the R2pdf is smaller.
Keywords:
wind speed; wind direction; joint probability distributions; parameter estimation; computation time MSC:
62E10; 62H10; 62H11; 62J02; 62P12; 90C30; 90C90
1. Introduction
Studying the statistical behaviour of wind is a fundamental requirement when evaluating the location of a future wind farm [1,2,3]. Typically, this study has focused on modelling the probability distribution of wind speed, for which a multitude of models have been proposed [4]. From the probability distribution of the wind speed and the power curve of a wind turbine [5], it is possible to evaluate indicators such as wind energy density [6], sometimes also called wind power density [7], annual average energy, or capacity factor [8].
In addition to the wind speed, other wind variables and characteristics need to be studied. These include wind direction, which makes it possible to describe the variation in the direction of capture of a wind turbine, allowing the relative positions of the turbines within the wind farm to be selected, minimizing losses due to the wake effect [9,10] and thus maximizing the use of the wind resource. In addition, once the wind farm is in operation, knowledge of the wind direction allows it to be managed more efficiently in real time, reducing operating costs [11]. Through the joint assessment of wind speed and direction based on a joint probability distribution of both variables, it is possible to gain a more comprehensive understanding of the energy characteristics of wind, which is crucial for the effective design and planning of wind farms [12].
Many approaches and models have been proposed to estimate the joint distribution of wind speed and direction. They can be grouped according to the type of fitted statistical model: parametric or non-parametric. Some examples of the first type, which is the most classic one, are the isotropic Gaussian model [13,14], the anisotropic Gaussian model [15], the angular–linear model [12,16], and the Farlie–Gumbel–Morgenstern distribution [11], which consider the correlation between wind speed and direction. The availability of increased computational capacity and ease of recording empirical data have promoted the use of non-parametric statistical methods (data-driven). In this category, we can point out the kernel estimation of the density functions [17] and the multivariate kernel density estimation of wind speed and direction using the Bernstein empirical copula [18], which handles parametric marginal distributions, among many others.
This study will focus on the angular–linear model proposed in [12]. This model uses the linear probability density function of wind speed, fV(v), and the angular probability density function of wind direction, fΘ(θ), to construct the probability density function g(ζ), which models the relationship between wind speed and direction. All of them are used to obtain an analytical expression for the joint density function of wind speed and wind direction, fV,Θ(v,θ). The current proposal builds upon the methodology presented in [12] but introduces a key innovation: instead of estimating the parameters of the cumulative distribution functions FV(v), FΘ(θ), and G(ζ) and then deriving the probability density functions (PDFs), as performed in [12], we propose a direct estimation of the PDF parameters of fV(v), fΘ(θ), and g(ζ) using the least squares method.
This proposal is based on the fact that the CDFs of the distributions commonly used to model the statistical behaviour of wind speed and direction used in [12] have no analytical expression. Therefore, the parameter estimation problem formulated as an optimization nonlinear problem can be computationally expensive. However, the use of PDFs makes it possible to calculate an analytical expression, as will be shown in this article, resulting in shorter solving times. Moreover, from a statistical point of view, PDF-based estimation is often asymptotically efficient (it has the least variance among unbiased estimators). On the contrary, CDF-based estimation may be less efficient because it aggregates information into quantiles, potentially losing finer structural details present in the PDF. That is, PDF estimation directly models the local behaviour of the distribution, making it more sensitive to modes, skewness, and tail properties. In addition, in the case of estimating parametric distributions, PDF-based estimation is generally more statistically efficient and less biased when the model is correctly specified, because it uses all the local information in the data. It is difficult to analytically find the statistical efficiency and bias of the least squares estimator, so they are usually calculated by means of a simulation study in a specific family of distributions. These results confirm that it is better to adjust the PDF instead of the CDF; see, for example, [19]. The suitability of the proposed method is assessed in terms of computational time and goodness of fit, evaluated by the coefficient of determination R2, which is the percentage of variance in the experimental data explained by each fitted model.
This article is structured as follows. Section 2 provides a more detailed explanation of the angular–linear model. Section 3 presents the formulation of the two alternatives proposed to obtain the parameters of the distributions. Section 4 outlines the metrics that will be used to compare the results of the two used methodologies. Section 5 shows the numerical results. Finally, Section 6 describes the conclusions.
2. Angular–Linear Model
The angular–linear model [12] employs the method proposed by Johnson and Wehrly in [16] to obtain any angular–linear distributions, Equation (1), and provides satisfactory results for modelling the joint density function of the wind speed and wind direction [11,12,18]. However, it has not always been the best among all the examined models [11,18].
where fV(v) is the PDF of the wind speed v, fΘ(θ) is the PDF of the wind direction θ, and g(ζ) is the PDF of the circular variable ζ, which is defined according to Equation (2), where FV(v) and FΘ(θ) are the cumulative distribution functions of the wind speed and wind direction, respectively.
The selection of the type of distribution used to model wind speed and direction, as well as the circular variable, affected the accuracy of the resulting model. The original proposal employed a mixture of a lower truncated normal distribution with a Weibull distribution (TNW) for the wind speed and a finite mixture of von Mises distributions (mvM) for the wind direction (which is multimodal) and for the circular variable ζ. This article maintains these choices in order to evaluate whether the proposed new method for obtaining the parameters of the distributions improves the results of the original proposal.
In Section 2.1, fV(v) and FV(v) will be defined and their analytical expressions will be derived. The same will be carried out for fΘ(θ) and FΘ(θ) in Section 2.2, and finally, in Section 2.3, it will be explained how g(ζ) has been modelled.
2.1. Probability Density Function of the Wind Speed fV(v)
It is commonly accepted that wind speed behaviour can be modelled using Weibull or Rayleigh distributions [6]. However, these models have the drawback that they do not fit all wind regimes and cannot represent bimodal behaviours [20] or high probabilities of zero wind speed [21].
One way to overcome the above drawbacks is to use mixtures of distributions, being adequate a mixture of a lower truncated normal distribution with a Weibull distribution (TNW) [4,21].
The PDF of a TNW is defined in Equation (3), which is equivalent to that shown in [12,22].
where is the weight of the mixture of the lower truncated normal distribution, defined in the interval [0, 1], fVW(v) is the PDF of the Weibull distribution, fVN(v) is the PDF of the normal distribution, and FVN(v) is the CDF of the normal distribution given by Equations (4)–(6), respectively.
where β and α are the scale parameter and shape parameter of the Weibull distribution, ϕ1 and ϕ2 are the mean and standard deviation of the truncated normal distribution, respectively, and erf(x) is the error function, which is defined according to Equation (7).
Finally, Equation (8) shows the cumulative distribution function FV(v) of a TNW which is obtained by integrating Equation (3).
where FVW(v) is given by Equation (9).
2.2. Probability Density Function of the Wind Direction fΘ(θ)
Several studies have shown that the use of a finite mixture of von Mises distributions provides a flexible model for representing and studying wind direction, which is multimodal, and its use has become widespread [22,23,24]. Therefore, this option is chosen to model fΘ(θ) and FΘ(θ), defined by Equation (10) and Equation (11), respectively.
where N is the number of components in the mixture, μj is the mean direction, kj is the concentration parameter, ωj is the weight of component j in the mixture, and I0(kj) is the modified Bessel function of the first kind and order zero defined by Equation (12).
2.3. Probability Density Function of the Circular Variable g(ζ)
As ζ is a circular variable and also a multimodal variable that models the relationship between wind speed and wind direction, it is proposed to model g(ζ) as a finite mixture of von Mises distributions, in the same way as was carried out before for fΘ(θ), in Equations (10)–(12), but now with the parameters μs, ωs, and ks. There are other alternatives for modelling g(ζ), such as those proposed in [25,26]. However, in this paper, it has been decided to keep the original proposal as stated above.
3. Parameter Estimation
It is common to estimate the parameters of a probability distribution using one of the following methods: the maximum likelihood, method of moments, or method of least squares [4]. However, as argued in [21], the method of least squares is the most appropriate method to estimate the parameters of a TNW. In [21], the least squares method is also chosen to estimate the parameters of the mvM.
In addition, in [11,12,21,27], the least squares method was applied to the CDF of the empirical data. Instead, in this paper, we propose to obtain the parameters of the distributions by applying the least squares method to the PDF of the empirical data. This proposal was motivated by the following reasons:
- In order to obtain the joint density distribution of wind speed and wind direction fV,ϴ(v,θ), the PDFs of wind speed fV(v), wind direction fΘ(θ), and circular variable g(ζ) are needed. Therefore, we believe it may be more effective to obtain the parameters of the distributions by directly applying the method of least squares to these expressions. It is evident that to define the values of variable ζ, both FV(v) and FΘ(θ) are required.
- The cumulative probability distribution of the wind direction, FΘ(θ), is modelled as a mixture of von Mises distributions, with several integral terms that do not have an analytical expression. Therefore, it is expected that the computational cost of obtaining the parameters using the least squares method will be lower if the probability density distribution fΘ(θ) is used instead of the cumulative probability distribution FΘ(θ). The same argument can be made for the circular variable.
- According to the previous point, if an optimization solver based on the gradient of the cost function and constraints, such as the SQP (sequential quadratic programming) method, is used to solve the fitting problems, the presence of integral functions in the constraints or in the cost function, for example in Equation (11), to model both the wind direction and the circular variable makes it difficult calculate the gradients and subsequently the number of iterations to find the optimum increase, thus augmenting the time to reach the solution.
For clarity, Section 3.1 presents the formulations for obtaining the parameters of the distributions by applying the least squares method to the PDF, and Section 3.2 presents the formulation for obtaining the parameters of the distributions by applying the least squares method to the CDF.
3.1. Initial Proposal: Fitting the Parameters of the Cumulative Distribution Function
The three optimization problems proposed to obtain the parameters that define the distributions of wind speed, wind direction, and the circular variable from their experimental frequencies are P.1.a, P.1.b, and P.1.c, respectively.
The cumulative frequencies (VCDFi, θCDFk, ζCDFq) of the three variables from the data are obtained by dividing each dataset into a specified number of intervals (M and T). For each interval, the relative frequency is calculated and added to the relative frequencies of the preceding intervals. It is assumed that the cumulative frequency value for each interval corresponds to the upper bound of each interval.
Finally, we would like to emphasize that the cost function of optimization problems P.1.a, P.1.b, and P.1.c requires solving a numerical integration of, fV(v), fΘ(θ), or g(ζ) because there is no analytical expression for FV(v), FΘ(θ), or G(ζ). As will be discussed later, this fact generates convergence problems when gradient-based optimization solvers are used. However, our proposal does not have this drawback.
3.2. New Proposal: Fitting the Parameters of the Probability Density Function
The three optimization problems proposed to obtain the parameters that define the density functions of the wind speed, wind direction, and circular variable from their experimental frequencies are P.2.a, P.2.b, and P.2.c, respectively.
where VPDFi is the empirical frequency for interval i and fV(vi) is the value of the analytical expression of the probability density function for the same interval i.
where θPDFk is the empirical frequency for interval k and fΘ(θk) is the value of the analytical expression of the probability density function for the same interval k.
where ζPDFq is the empirical frequency for interval q obtained as previously described in Section 3.1 and g(ζq) is the value of the analytical expression of the probability density function for the same interval q.
The frequencies (VPDFi, θPDFk, ζPDFq) of the three variables from the empirical data are obtained by dividing each dataset into a specified number of intervals (M and T). For each interval, its relative frequency is calculated and then divided by the interval width. It is assumed that the probability density value for each interval is assumed to correspond to the upper bound of each interval.
3.3. Parameter Initialization
When solving nonlinear programming problems, as those proposed before, it is recommended to provide a suitable starting point for the search algorithm.
The initial values of the parameters of the TNW function (P.1.a or P.2.a) are obtained with Equations (24)–(28) according to [21].
where m, m′2, and m′3 are the first, second, and third moments, respectively, centred on the origin of the wind speed data sample for which we fit the distribution, s is the standard deviation of the data, and Γ(·) is the gamma function. On the other hand, to obtain the initial values for each component of the mvM (P.1.b, P.1.c, P.2.b, or P.2.c), one must first divide and group the sample data set, angles θj, into N sectors (N1 or N2) of size nj. Then, using Equations (29)–(33) as per [22], the initial values of the parameters μj, ωj, and kj or μs, ωs, and ks can be calculated.
where nj is the number of wind direction data points belonging to sector j, I0(kj) is the modified Bessel function of the first kind and order zero (12), and I1(kj) is the modified Bessel function of the first kind and order one. Since Equation (33) is implicit in kj, a numerical solution method would likely need to be used, with the consequent computational cost. However, as only an initial value for kj is being sought, an approximate equation proposed in [22] and shown in Equation (34) may alternatively be used.
4. Methodology
The results of both approaches will be compared in terms of calculation time and goodness of fit. The goodness of fit between the empirical data and estimated functions (cumulative distribution function or probability density function) is assessed with R2cdf and R2pdf, which are calculated according to Equations (35) and (36).
where Y is the variable under study and can be the wind speed (V), wind direction (θ), both (Vθ), or the circular variable (ζ). X is the is the number of intervals (M for wind speed, T for wind direction or circular variable, and M × T for both wind speed and direction).
5. Results
The two proposals to obtain the parameters of fV(v), fΘ(θ), g(ζ), and their final effect on fV,Θ(v,θ) will be tested and studied using simulated wind data from the New European Wind Atlas (NEWA) [28,29]. The database contains series of wind speed and direction at a specific location and at different heights from 2005 to 2018 in half-hourly time intervals, comprising 245,424 data points in total, of which 195 are missing. These data are available for download free of charge on the NEWA website [30].
This study is going to be carried out for two different locations, which correspond to the wind farms Páramo de Vega (WF1), located in the province of Burgos, Spain (Latitude 42° 30′ 59.6″, Longitude −3° 47′ 14.2″), and El Valle Valdenavarro (WF2), in the province of Navarra, Spain (Latitude 41° 55′ 18.9″, Longitude −1° 25′ 46.9″). For each location, the data series from 2005 to 2018 whose simulation height is closest to the height at which the wind turbine hub of the wind farms is located is chosen in the NEWA. For WF1, the height of 75 m is chosen, and for WF2, the height of 150 m is chosen, since the height at which the hubs are located are 78 and 150 metres, respectively [31,32].
The results are presented in the following outline: Section 5.1, wind speed modelling; Section 5.2, wind direction modelling; Section 5.3, ζ generation and circular variable modelling; and Section 5.4, joint wind speed and wind direction modelling.
The implementation and resolution of the problems have been carried out using the fmincon function from Matlab’s Optimization Toolbox [33,34] with the SQP algorithm as the optimization solver.
5.1. Wind Speed Modelling
In this section, we compare the results of modelling the wind speed when it is fitted to the parameters of the cumulative distribution function (P.1.a) or the parameters of the probability density function (P.2.a) for wind farms WF1 and WF2. For each wind farm, we have split the data with three different interval sizes. This decision was made because we want to test how the interval size affects the results, which would be fixed by the anemometer resolution in a study with real data.
Table 1 and Table 2 show the value of the coefficients R2pdf and R2cdf and the time taken to solve the optimization problem for wind farms WF1 and WF2, respectively.

Table 1.
Goodness-of-fit for wind speed modelling in WF1.

Table 2.
Goodness-of-fit for wind speed modelling in WF2.
At first sight, in both cases, it can be seen that fitting directly the parameters of the probability density function (P.2.a) gives better results for R2pdf than fitting the parameters using the cumulative distribution function (P.1.a). Conversely, the best results for R2cdf are obtained when (P.1.a) is used instead of (P.2.a), except for WF2 and I = 0.25 m/s, marked in red in Table 2.
As the size of the intervals I decreases, the value of R2pdf generally decreases, whether (P.2.a) or (P.1.a) is used. Conversely, R2cdf improves for (P.2.a) and remains almost constant for (P.1.a).
Regarding the time to obtain the value of the parameters, it can be seen how estimating the parameters of the probability density function (P.2.a) requires slightly less time with a time reduction of about 20%, with the exception of WF2 and I = 1 m/s, marked in red in Table 2.
Figure 1 and Figure 2 show the fitting of fV(v) and FV(v) and the corresponding frequencies of the empirical wind speed data (VPDF and VCDF) for an interval size I = 1 m/s and I = 0.25 m/s, according to the results of Table 1 and Table 2. It is evident that there are differences in the shape of fV(v) and FV(v) depending on the method used to find the parameters and that these differences decrease with decreasing interval size I. The observed discontinuity in Figure 1 is due to the interval size used to discretize the distribution. A larger interval size causes slight irregularities, especially at the peak, as the resolution of the discretized data affects the smoothness of the plotted curve.
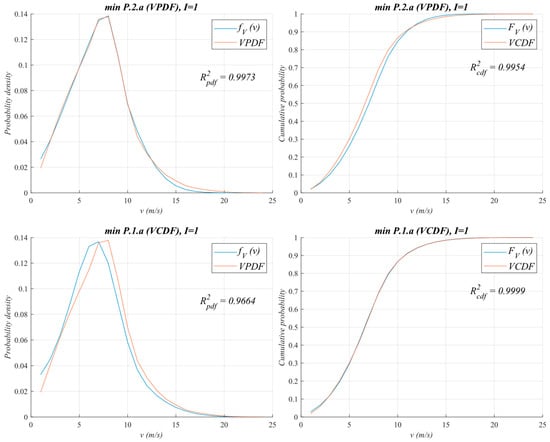
Figure 1.
Comparison of fV(v) and FV(v) for WF1 with I = 1 m/s when it is fitted using the PDF (P.2.a) and when it is fitted using the CDF (P.1.a).
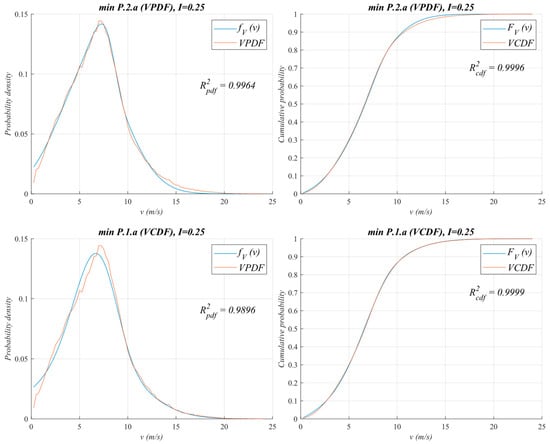
Figure 2.
Comparison of fV(v) and FV(v) for WF1 with I = 0.25 m/s when it is fitted using the PDF (P.2.a) and when it is fitted using the CDF (P.1.a).
In general, estimating the parameters of the probability density function (P.2.a) allows us to obtain a satisfactory fit both for PDF and CDF functions, as R2pdf and R2cdf show. However, estimating the parameters of the cumulative distribution function (P.1.a) allows us to obtain the best fitting but only for the CDF function.
5.2. Wind Direction Modelling
In [22], it is shown how the number of von Mises distributions (N) affects the goodness of fit of the data, and it is found that from N = 6 there is no relevant change in the goodness of fit when it is evaluated by R2.
In this paper, this comparison is repeated for different values of N (2, 3, 4, 5, and 6) for both P.1.b and P.2.b. Regarding the value of the number of intervals (T) into which the wind direction data samples are divided, it is important to choose a sufficiently large number. In this paper, it was decided to try dividing the data into 10, 36, 90, 180, or 360 intervals (36°, 10°, 4°, 2°, 1°). In the case of real data, the choice of this value would depend on the resolution of the measuring instrument.
Figure 3 and Figure 4 show as examples the settings obtained for fΘ(θ) and FΘ(θ) and their corresponding frequencies of empirical wind direction data (θPDF and θCDF) for the wind farm WF1 using T = 36 and N = 6 (Figure 3) and T = 360 and N = 6 (Figure 4) to solve P.2.b or P.1.b, whose numerical results are showed in Table A5.
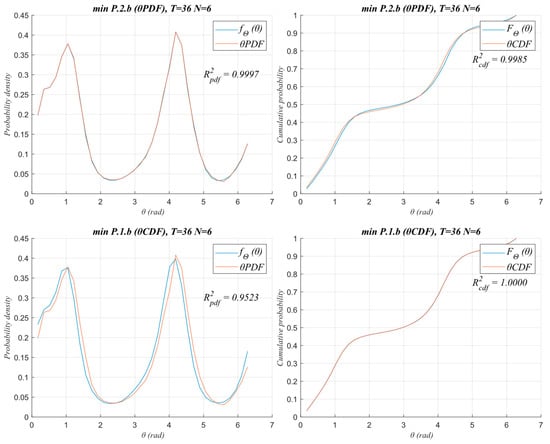
Figure 3.
Comparison of fΘ(θ) and FΘ(θ) for WF1 when fitting using PDF parameters (P.2.b) or CDF parameters (P.1.b) with T = 36 and N = 6.
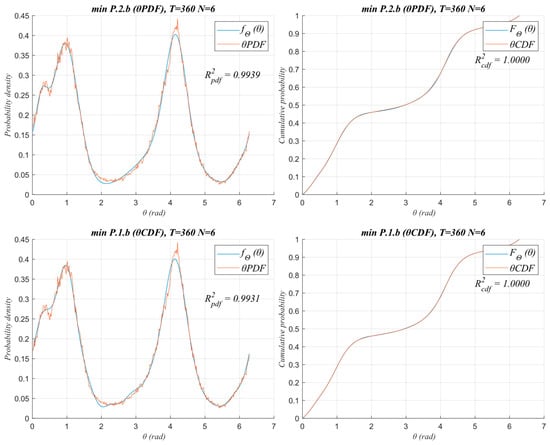
Figure 4.
Comparison of fΘ(θ) and FΘ(θ) for WF1 when fitting using PDF parameters (P.2.b) or CDF parameters (P.1.b) with T = 360 and N = 6.
From Figure 3, it is evident that fitting the parameters of the mixture of von Mises distributions by directly adjusting the cumulative probability distribution (P.1.b) yields worse results than directly fitting the parameters of the probability density function (P.2.b). This is evidenced by the fact that there is a significant difference between the two methods in the values of R2pdf: R2pdf = 0.9525 (P.1.b) and R2pdf = 0.9997 (P.2.b). Meanwhile, for R2cdf, there is hardly any difference: R2cdf = 0.9985 (P.1.b) and R2cdf = 1.0000 (P.2.b). From Figure 4, it can be seen that as the number of intervals into which the data sample (T) has been divided increases, the differences between fitting the parameters of the cumulative distribution function (P.1.b) or the probability density function (P.2.b) becomes insignificant for both R2pdf and R2cdf.
Figure 5, Figure 6 and Figure 7 show the graphical representation of the values of R2pdf, R2cdf and the time taken to fit the parameters as a function of the different values of N and T. In the case of R2pdf, Figure 5 shows that a better result is obtained for this indicator when the parameters of the probability density function have been directly fitted (P.2.b). There are some exceptions, such as in WF2 (T = 360, N = 6, min P2.b R2pdf = 0.960, min P.1.b R2pdf = 0.9950), as can be seen in Table A10. In the case of R2cdf, a better result for this indicator is obtained in all cases when the parameters of the cumulative probability function are fitted (P.1.b), as shown in Figure 6.
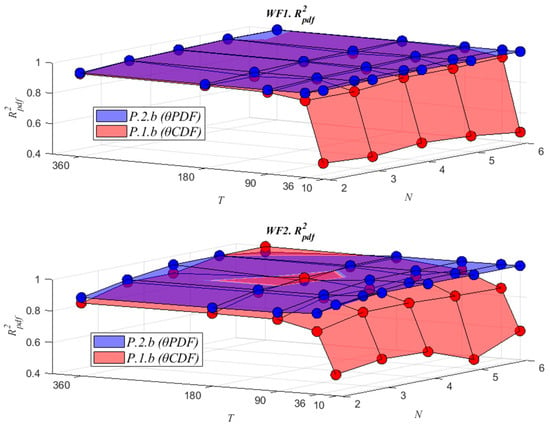
Figure 5.
Goodness-of-fit comparison of the fΘ(θ) for WF1 and WF2.
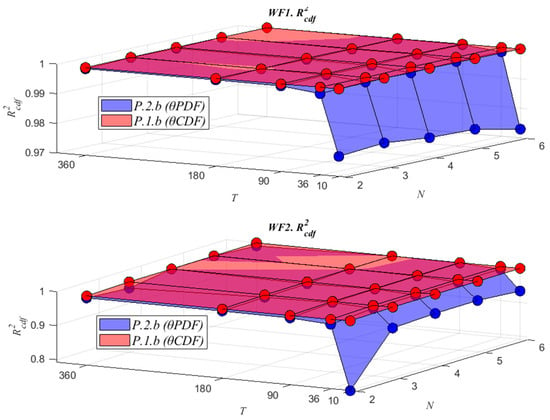
Figure 6.
Goodness-of-fit comparison of the FΘ(θ) for WF1 and WF2.
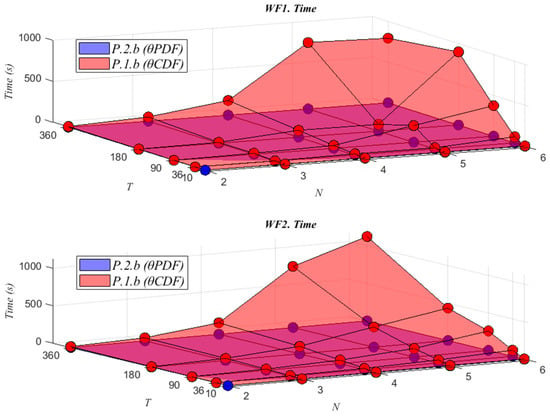
Figure 7.
Fitting calculation time comparison for WF1 and WF2.
For both R2pdf and R2cdf, the greatest differences between using P.2.b and P.1.b occur when the number of T intervals is reduced, with the difference being greater for R2pdf and for the original problem P.1.b.
With regard to the time required to fit the parameters, Figure 7 shows how the calculation time increases with an increase in the number of components in the mixture (N) or in the number of intervals (T) into which the data wind direction data are divided. It can also be observed that in the majority of cases directly adjusting the parameters of the probability density function (P.2.b) requires less computational time when compared with the formulation P.1.b, where the parameters of the cumulative distribution function are fitted.
It is evident that P.2.b exhibits superior scaling properties in comparison to P.1.b. As the number of components in the mixture (N) or the number of intervals (T) into which the data are divided increase, the computational time of the proposed approach (P.2.b) increases linearly, unlike the original method, which increases exponentially.
For example, to guarantee R2pdf and R2cdf values above 0.99, the first method P.1.b requires T = 180 or 360 and N = 5 or 6 with a computational time of about 800 s, but our approach (P.2.b) needs only 4.9 s in the worst case, as can be seen in Table A4 and Table A5 for WF1 and Table A9 and Table A10 for WF2, both in Appendix A.
5.3. ζ. Generation and Angular Variable Modelling
Samples of the circular variable ζ are generated from the historical wind speed and direction data and the fitted FV(v) and FΘ(θ). With these data samples, parameters must be fitted to the model g(ζ), using one of the two proposed methods (P.1.c or P.2.c). When using a mixture of von Mises functions to model g(ζ), as for fΘ(θ), the differences found between fitting the parameters of the probability density function (P.2.c) or fitting the parameters of the cumulative distribution function (P.1.c) remain, as in the case of wind direction modelling (Section 5.2), and the exact same conclusion can be reached. The numerical values of the fits are shown in Table A11 and Table A12 of Appendix A.
5.4. Joint Wind Speed and Wind Direction Modelling
Finally, by combining the results of Section 5.1, Section 5.2, and Section 5.3 in Equation (1), we obtain fV,Θ(v,θ), and we can evaluate the estimator R2pdf between the analytical expression obtained and the empirical data of wind speed and wind direction (VθPDF). As can be seen in Table 3 and Table 4, the best fit for fV,Θ(v,θ) (R2pdf) is obtained when the parameters of the probability density functions fV(v), fΘ(θ), and g(ζ) have been directly estimated (P.2).

Table 3.
Results for joint wind speed and wind direction modelling, fV,Θ(v,θ) and FV,Θ(v,θ), in WF1 with N = 6 and I = 0.25.

Table 4.
Results for joint wind speed and wind direction modelling, fV,Θ(v,θ) and FV,Θ(v,θ), in WF2 with N = 6 and I = 0.25.
As for the cumulative distribution of wind speed and direction, FV,Θ(v,θ), there is no analytical function, so a numerical method must be used to integrate it from fV,Θ(v,θ). As can be seen in Table 3 and Table 4, the goodness of the fit is very similar for both methods P.1 and P.2 with an R2cdf greater than 0.99.
However, in terms of computation time, calculated as the sum of the computation time of each fitting problem (P.1.a, P.1.b, and P.1.c or P.2.a, P.2.b, and P.2.c), solving P.1 to fit the parameters of the cumulative distribution functions is much longer than solving it using our approach (P.2), as shown in Table 3 and Table 4. For example, the best fit for the probability density function is R2pdf = 0.831 (T = 90) for solving P.1 in WF1 and takes 615 s, but under the same conditions, solving P.2 gives an R2pdf = 0.848 with a computation time of only 17 s.
As an example, Figure 8 and Figure 9 show the function fV,Θ(v,θ) generated for I = 0.25, N = 6, and T = 90 together with the histogram of the empirical data of wind speed and wind direction (VθPDF).
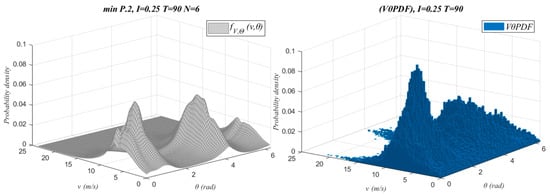
Figure 8.
fV,Θ(v,θ) vs. VθPDF for WF1.
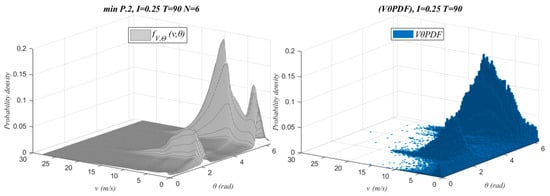
Figure 9.
fV,Θ(v,θ) vs. VθPDF for WF2.
Finally, Figure 10 and Figure 11 show, as an example, the FV,Θ(v,θ) generated for I = 0.25, N = 6 and T = 90, together with the histogram of the empirical data of wind speed and wind direction (VθCDF).
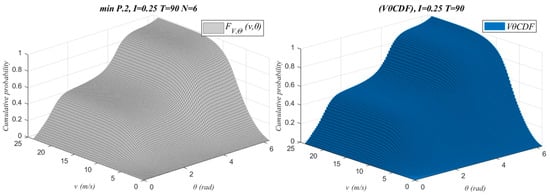
Figure 10.
FV,Θ(v,θ) vs. VθCDF for WF1.
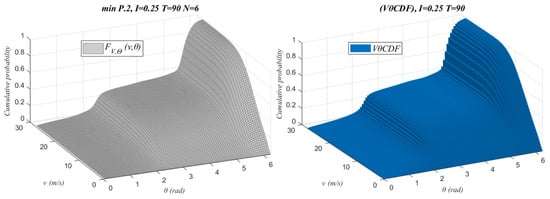
Figure 11.
FV,Θ(v,θ) vs. VθCDF for WF2.
6. Conclusions
One of the most commonly used models for modelling the joint probability density function of wind speed and wind direction fV,Θ(v,θ) is the angular–linear model, which is based on using the individual probability density functions of wind speed fV(v) and wind direction fΘ(θ). In this paper, it is proposed to directly estimate the parameters of the probability density functions (fV(v) and fΘ(θ)) instead of estimating the parameters of the cumulative distribution functions (FV(v) and FΘ(θ)) as an alternative, since the CDF used to model the wind speed and direction has no analytical expression.
In the case of wind speed, it has been shown that the fit of fV(v) fitting the probability density function (P.2.a) is slightly better than fitting the cumulative distribution function (P.1.a), regardless of the size of the interval (I) into which the data are divided. The computation time required to fit the parameters is slightly lower for the proposed approach; however, the absolute value remains low even for large problems. Thus, while the increase is notable in relative terms, it is not substantial. For the wind direction, the advantages of fitting using the probability density function (P.2.b) are that regardless of the number of intervals (T) into which the experimental data are divided, the parameters obtained always give similar or better fits than those obtained with the cumulative distribution function (P.1.b). Furthermore, as with wind speed, solving P.2.b is, in general, always much faster than solving P.1.b. Moreover, in this case, the differences in absolute computation time increase exponentially as the fitted model becomes more complex, in particular, as T and N increase.
Finally, once fV(v), fΘ(θ), and g(ζ), have been defined, it is possible to construct the joint function fV,Θ(v,θ), which provides a better fit and much less time consumption if the parameters of all probability density functions are fitted, that is, our proposal (P.2).
In summary, this paper has proposed the utilization of the least squares method with probability density functions as a novel approach to estimate the parameters of the marginal distributions that compose the joint distribution of wind speed and direction. This novel approach offers a slight improvement in goodness of fit. The most significant benefit of this method is that it enables the assessment of complex models, characterized by small interval sizes and a high number of von Mises mixtures (N), in a considerably shorter time than the conventional approach.
Author Contributions
Conceptualization S.M.-G. and L.A.S.; Investigation S.M.-G.; Methodology S.M.-G. and L.A.S.; Software S.M.-G.; Data curation A.M. and D.S.; Validation A.M., D.S. and R.R.-G.; Supervision D.S.; Project administration D.S.; Writing—original draft S.M.-G.; Writing—review and editing S.M.-G., L.A.S., A.M., D.S. and R.R.-G. All authors have read and agreed to the published version of the manuscript.
Funding
The paper is part of the projects “Optimal Real-Time Management of the Power-to-H2-to-Power cycle (OptiMaPH2P)”, TED2021-131220B-I00, funded by MCIN/AEI (Ministerio de Ciencia e Innovación del Gobierno de España/Agencia Estatal de Investigación) and by the European Union “NextGenerationEU”, “Optimal real-time management under uncertainty for digital twins (OptiDit)”, PID2021-123654OB-C33, funded by MCIN (Ministerio de Ciencia e Innovación del Gobierno de España) and by the European Union “FEDER”. This paper is also part of the Doctoral Thesis of Samuel Martínez-Gutiérrez, funded with a pre-doctoral contract for University Teacher Training (FPU), call 2022, awarded by the MUNI of Spain (Ministerio de Universidades del Gobierno de España).
Data Availability Statement
The original contributions presented in this study are included in the article. Further inquiries can be directed to the corresponding author(s). The raw data used in the article are open access through the NEWA website: https://map.neweuropeanwindatlas.eu/ (accessed on 23 February 2025).
Conflicts of Interest
The authors declare that they have no known competing financial interests or personal relationships that could have appeared to influence the work reported in this paper.
Abbreviations
The following abbreviations are used in this manuscript:
| CDF | cumulative distribution function |
| mvM | mixture of von Mises distributions |
| NEWA | New European Wind Atlas |
| probability density function | |
| SQP | sequential quadratic program |
| TNW | lower truncated normal distribution with a Weibull distribution |
| WF1 | Wind Farm 1 |
| WF2 | Wind Farm 2 |
Appendix A

Table A1.
Goodness-of-fit for wind direction modelling, fΘ(θ) and FΘ(θ), in WF1 and N = 2.
Table A1.
Goodness-of-fit for wind direction modelling, fΘ(θ) and FΘ(θ), in WF1 and N = 2.
| WF1 | ||||||
|---|---|---|---|---|---|---|
| N = 2 | R2pdf | R2cdf | Time (s) | |||
| min P.2.b | min P.1.b | min P.2.b | min P.1.b | min P.2.b | min P.1.b | |
| T = 10 | 0.9847 | 0.5055 | 0.9768 | 0.9995 | 0.5875 | 0.4373 |
| T = 36 | 0.9575 | 0.9069 | 0.9974 | 0.9996 | 0.5666 | 0.8899 |
| T = 90 | 0.9544 | 0.9390 | 0.9989 | 0.9996 | 0.5686 | 2.1501 |
| T = 180 | 0.9533 | 0.9444 | 0.9991 | 0.9996 | 0.6168 | 3.7769 |
| T = 360 | 0.9519 | 0.9454 | 0.9992 | 0.9996 | 0.6364 | 8.7883 |

Table A2.
Goodness-of-fit for wind direction modelling, fΘ(θ) and FΘ(θ), in WF1 and N = 3.
Table A2.
Goodness-of-fit for wind direction modelling, fΘ(θ) and FΘ(θ), in WF1 and N = 3.
| WF1 | ||||||
|---|---|---|---|---|---|---|
| N = 3 | R2pdf | R2cdf | Time (s) | |||
| min P.2.b | min P.1.b | min P.2.b | min P.1.b | min P.2.b | min P.1.b | |
| T = 10 | 0.9953 | 0.4888 | 0.9781 | 0.9999 | 0.5994 | 2.3977 |
| T = 36 | 0.9776 | 0.9069 | 0.9981 | 0.9996 | 0.6 | 2.1133 |
| T = 90 | 0.9748 | 0.9650 | 0.9994 | 0.9998 | 0.6692 | 14.2521 |
| T = 180 | 0.9739 | 0.9444 | 0.9996 | 0.9996 | 0.7683 | 12.0320 |
| T = 360 | 0.9726 | 0.9709 | 0.9997 | 0.9998 | 0.9041 | 52.0740 |

Table A3.
Goodness-of-fit for wind direction modelling, fΘ(θ) and FΘ(θ), in WF1 and N = 4.
Table A3.
Goodness-of-fit for wind direction modelling, fΘ(θ) and FΘ(θ), in WF1 and N = 4.
| WF1 | ||||||
|---|---|---|---|---|---|---|
| N = 4 | R2pdf | R2cdf | Time (s) | |||
| min P.2.b | min P.1.b | min P.2.b | min P.1.b | min P.2.b | min P.1.b | |
| T = 10 | 1.0000 | 0.5194 | 0.9766 | 1.0000 | 0.6354 | 3.0979 |
| T = 36 | 0.9854 | 0.9385 | 0.9979 | 0.9999 | 0.6597 | 15.2572 |
| T = 90 | 0.9849 | 0.9705 | 0.9993 | 0.9999 | 0.8836 | 36.0721 |
| T = 180 | 0.9848 | 0.9802 | 0.9995 | 0.9999 | 1.0116 | 85.6814 |
| T = 360 | 0.9838 | 0.9809 | 0.9996 | 0.9999 | 1.4091 | 179.1024 |

Table A4.
Goodness-of-fit for wind direction modelling, fΘ(θ) and FΘ(θ), in WF1 and N = 5.
Table A4.
Goodness-of-fit for wind direction modelling, fΘ(θ) and FΘ(θ), in WF1 and N = 5.
| WF1 | ||||||
|---|---|---|---|---|---|---|
| N = 5 | R2pdf | R2cdf | Time (s) | |||
| min P.2.b | min P.1.b | min P.2.b | min P.1.b | min P.2.b | min P.1.b | |
| T = 10 | 1.0000 | 0.5042 | 0.9762 | 1.0000 | 0.5736 | 3.0452 |
| T = 36 | 0.9975 | 0.9386 | 0.9985 | 0.9999 | 1.0714 | 15.17452 |
| T = 90 | 0.9960 | 0.9878 | 0.9998 | 1.0000 | 1.4712 | 205.0244 |
| T = 180 | 0.9924 | 0.9749 | 0.9997 | 0.9999 | 1.8937 | 85.1508 |
| T = 360 | 0.9938 | 0.9929 | 1.0000 | 1.0000 | 3.2127 | 812.8730 |

Table A5.
Goodness-of-fit for wind direction modelling, fΘ(θ) and FΘ(θ), in WF1 and N = 6.
Table A5.
Goodness-of-fit for wind direction modelling, fΘ(θ) and FΘ(θ), in WF1 and N = 6.
| WF1 | ||||||
|---|---|---|---|---|---|---|
| N = 6 | R2pdf | R2cdf | Time (s) | |||
| min P.2.b | min P.1.b | min P.2.b | min P.1.b | min P.2.b | min P.1.b | |
| T = 10 | 1.0000 | 0.4691 | 0.9730 | 1.0000 | 0.5304 | 3.1694 |
| T = 36 | 0.9997 | 0.9523 | 0.9985 | 1.0000 | 1.6397 | 76.2945 |
| T = 90 | 0.9984 | 0.9895 | 0.9998 | 1.0000 | 2.3712 | 374.2246 |
| T = 180 | 0.9977 | 0.9942 | 0.9999 | 1.0000 | 3.9549 | 894.5340 |
| T = 360 | 0.9939 | 0.9927 | 1.0000 | 1.0000 | 4.9048 | 791.7207 |

Table A6.
Goodness-of-fit for wind direction modelling, fΘ(θ) and FΘ(θ), in WF2 and N = 2.
Table A6.
Goodness-of-fit for wind direction modelling, fΘ(θ) and FΘ(θ), in WF2 and N = 2.
| WF2 | ||||||
|---|---|---|---|---|---|---|
| N = 2 | R2pdf | R2cdf | Time (s) | |||
| min P.2.b | min P.1.b | min P.2.b | min P.1.b | min P.2.b | min P.1.b | |
| T = 10 | 0.9809 | 0.5358 | 0.7919 | 0.9978 | 0.5248 | 0.5052 |
| T = 36 | 0.9170 | 0.8012 | 0.9818 | 0.9963 | 0.6105 | 1.2996 |
| T = 90 | 0.9033 | 0.8587 | 0.9890 | 0.9962 | 0.5367 | 2.8707 |
| T = 180 | 0.9004 | 0.8641 | 0.9899 | 0.9961 | 0.6113 | 5.5376 |
| T = 360 | 0.8995 | 0.8647 | 0.9900 | 0.9961 | 0.5995 | 12.4109 |

Table A7.
Goodness-of-fit for wind direction modelling, fΘ(θ) and FΘ(θ), in WF2 and N = 3.
Table A7.
Goodness-of-fit for wind direction modelling, fΘ(θ) and FΘ(θ), in WF2 and N = 3.
| WF2 | ||||||
|---|---|---|---|---|---|---|
| N = 3 | R2pdf | R2cdf | Time (s) | |||
| min P.2.b | min P.1.b | min P.2.b | min P.1.b | min P.2.b | min P.1.b | |
| T = 10 | 1.0000 | 0.5776 | 0.9385 | 1.0000 | 0.5769 | 2.0221 |
| T = 36 | 0.9699 | 0.8666 | 0.9906 | 0.9995 | 0.5632 | 7.9804 |
| T = 90 | 0.9580 | 0.9375 | 0.9962 | 0.9995 | 0.5796 | 16.6834 |
| T = 180 | 0.9573 | 0.9412 | 0.9926 | 0.9995 | 0.7047 | 28.5370 |
| T = 360 | 0.9566 | 0.9397 | 0.9808 | 0.9994 | 0.9006 | 41.7003 |

Table A8.
Goodness-of-fit for wind direction modelling, fΘ(θ) and FΘ(θ), in WF2 and N = 4.
Table A8.
Goodness-of-fit for wind direction modelling, fΘ(θ) and FΘ(θ), in WF2 and N = 4.
| WF2 | ||||||
|---|---|---|---|---|---|---|
| N = 4 | R2pdf | R2cdf | Time (s) | |||
| min P.2.b | min P.1.b | min P.2.b | min P.1.b | min P.2.b | min P.1.b | |
| T = 10 | 1.0000 | 0.5671 | 0.9431 | 1.0000 | 0.5317 | 3.2113 |
| T = 36 | 0.9974 | 0.8679 | 0.9918 | 0.9995 | 0.7737 | 16.6579 |
| T = 90 | 0.9952 | 0.9375 | 0.9980 | 0.9995 | 0.8159 | 49.1095 |
| T = 180 | 0.9574 | 0.9763 | 0.9942 | 0.9998 | 0.9415 | 101.3827 |
| T = 360 | 0.9941 | 0.9397 | 0.9991 | 0.9994 | 1.4965 | 153.2017 |

Table A9.
Goodness-of-fit for wind direction modelling, fΘ(θ) and FΘ(θ), in WF2 and N = 5.
Table A9.
Goodness-of-fit for wind direction modelling, fΘ(θ) and FΘ(θ), in WF2 and N = 5.
| WF2 | ||||||
|---|---|---|---|---|---|---|
| N = 5 | R2pdf | R2cdf | Time (s) | |||
| min P.2.b | min P.1.b | min P.2.b | min P.1.b | min P.2.b | min P.1.b | |
| T = 10 | 1.0000 | 0.4604 | 0.9436 | 1.0000 | 0.6374 | 5.4395 |
| T = 36 | 0.9991 | 0.8553 | 0.9923 | 1.0000 | 0.9597 | 41.4387 |
| T = 90 | 0.9971 | 0.9631 | 0.9982 | 1.0000 | 1.2076 | 115.3523 |
| T = 180 | 0.9970 | 0.9878 | 0.9996 | 1.0000 | 1.7334 | 271.4960 |
| T = 360 | 0.9946 | 0.9933 | 0.9994 | 1.0000 | 2.396 | 817.3426 |

Table A10.
Goodness-of-fit for wind direction modelling, fΘ(θ) and FΘ(θ), in WF2 and N = 6.
Table A10.
Goodness-of-fit for wind direction modelling, fΘ(θ) and FΘ(θ), in WF2 and N = 6.
| WF2 | ||||||
|---|---|---|---|---|---|---|
| N = 6 | R2pdf | R2cdf | Time (s) | |||
| min P.2.b | min P.1.b | min P.2.b | min P.1.b | min P.2.b | min P.1.b | |
| T = 10 | 1.0000 | 0.5849 | 0.9331 | 1.0000 | 0.6029 | 3.6831 |
| T = 36 | 0.9996 | 0.8480 | 0.9924 | 1.0000 | 1.4218 | 82.5337 |
| T = 90 | 0.9982 | 0.9457 | 0.9987 | 0.9996 | 1.8090 | 260.5667 |
| T = 180 | 0.9977 | 0.9875 | 0.9997 | 1.0000 | 3.1589 | 434.5785 |
| T = 360 | 0.9604 | 0.9950 | 0.9911 | 1.0000 | 3.4800 | 1127.9038 |

Table A11.
Goodness-of-fit for circular variable modelling, gζ(ζ) and Gζ(ζ), in WF1 and N = 6.
Table A11.
Goodness-of-fit for circular variable modelling, gζ(ζ) and Gζ(ζ), in WF1 and N = 6.
| WF1 | ||||||
|---|---|---|---|---|---|---|
| N = 6 | R2pdf | R2cdf | Time (s) | |||
| min P.2.c | min P.1.c | min P.2.c | min P.1.c | min P.2.c | min P.1.c | |
| T = 10 | 0.9985 | −0.6080 | 1.0000 | 1.0000 | 0.1469 | 2.6798 |
| T = 36 | 0.9878 | 0.9602 | 1.0000 | 1.0000 | 1.5429 | 122.6574 |
| T = 90 | 0.9652 | 0.9592 | 1.0000 | 1.0000 | 14.7182 | 240.3376 |
| T = 180 | 0.9383 | 0.9348 | 1.0000 | 1.0000 | 28.6691 | 717.9321 |
| T = 360 | 0.8954 | 0.8862 | 1.0000 | 1.0000 | 63.4637 | 968.2772 |

Table A12.
Goodness-of-fit for circular variable modelling, gζ(ζ) and Gζ(ζ), in WF2 and N = 6.
Table A12.
Goodness-of-fit for circular variable modelling, gζ(ζ) and Gζ(ζ), in WF2 and N = 6.
| WF2 | ||||||
|---|---|---|---|---|---|---|
| N = 6 | R2pdf | R2cdf | Time (s) | |||
| min P.2.c | min P.1.c | min P.2.c | min P.1.c | min P.2.c | min P.1.c | |
| T = 10 | 1.0000 | 0.8534 | 0.9901 | 1.0000 | 0.3657 | 5.5427 |
| T = 36 | 0.9993 | 0.9813 | 0.9989 | 1.0000 | 3.2684 | 71.4667 |
| T = 90 | 0.9970 | 0.9934 | 0.9998 | 1.0000 | 5.0959 | 157.6568 |
| T = 180 | 0.9951 | 0.9940 | 0.9999 | 1.0000 | 8.5651 | 1341.1430 |
| T = 360 | 0.9877 | 0.9894 | 1.0000 | 1.0000 | 46.3624 | 1680.6885 |
References
- Drew, D.R.; Barlow, J.F.; Cockerill, T.T.; Vahdati, M.M. The Importance of Accurate Wind Resource Assessment for Evaluating the Economic Viability of Small Wind Turbines. Renew. Energy 2015, 77, 493–500. [Google Scholar] [CrossRef]
- Koeppl, G.W. Putnam’s Power from the Wind; Van Nostrand Reinhold Inc.: New York, NY, USA, 1982. [Google Scholar]
- Wang, J.; Hu, J.; Ma, K. Wind Speed Probability Distribution Estimation and Wind Energy Assessment. Renew. Sustain. Energy Rev. 2016, 60, 881–899. [Google Scholar] [CrossRef]
- Carta, J.A.; Ramírez, P.; Velázquez, S. A Review of Wind Speed Probability Distributions Used in Wind Energy Analysis: Case Studies in the Canary Islands. Renew. Sustain. Energy Rev. 2009, 13, 933–955. [Google Scholar] [CrossRef]
- Carrillo, C.; Obando Montaño, A.F.; Cidrás, J.; Díaz-Dorado, E. Review of Power Curve Modelling for Wind Turbines. Renew. Sustain. Energy Rev. 2013, 21, 572–581. [Google Scholar] [CrossRef]
- Mathew, S. Wind Energy: Fundamentals, Resource Analysis and Economics; Springer: Berlin/Heidelberg, Germany, 2007; ISBN 3540309055. [Google Scholar]
- Herrero-Novoa, C.; Pérez, I.A.; Sánchez, M.L.; García, M.Á.; Pardo, N.; Fernández-Duque, B. Wind Speed Description and Power Density in Northern Spain. Energy 2017, 138, 967–976. [Google Scholar] [CrossRef]
- Abed, K.A.; El-Mallah, A.A. Capacity Factor of Wind Turbines. Energy 1997, 22, 487–491. [Google Scholar] [CrossRef]
- Samorani, M. The Wind Farm Layout Optimization Problem; Springer: Berlin/Heidelberg, Germany, 2013; pp. 21–38. ISBN 978-3-642-41080-2. [Google Scholar]
- Vermeer, L.J.; Sørensen, J.N.; Crespo, A. Wind Turbine Wake Aerodynamics. Prog. Aerosp. Sci. 2003, 39, 467–510. [Google Scholar] [CrossRef]
- Erdem, E.; Shi, J. Comparison of Bivariate Distribution Construction Approaches for Analysing Wind Speed and Direction Data. Wind Energy 2011, 14, 27–41. [Google Scholar] [CrossRef]
- Carta, J.A.; Ramírez, P.; Bueno, C. A Joint Probability Density Function of Wind Speed and Direction for Wind Energy Analysis. Energy Convers. Manag. 2008, 49, 1309–1320. [Google Scholar] [CrossRef]
- McWilliams, B.; Newmann, M.M.; Sprevak, D. The Probability Distribution of Wind Velocity and Direction. Wind Eng. 1979, 3, 269–273. [Google Scholar]
- McWilliams, B.; Sprevak, D. The Estimation of the Parameters of the Distribution of Wind Speed and Direction. Wind Eng. 1980, 4, 227–238. [Google Scholar]
- Weber, R. Estimator for the Standard Deviation of Wind Direction Based on Moments of the Cartesian Components. J. Appl. Meteorol. Climatol. 1991, 30, 1341–1353. [Google Scholar] [CrossRef]
- Johnson, R.A.; Wehrly, T.E. Some Angular-Linear Distributions and Related Regression Models. J. Am. Stat. Assoc. 1978, 73, 602–606. [Google Scholar] [CrossRef]
- Zhang, J.; Chowdhury, S.; Messac, A.; Castillo, L. A Multivariate and Multimodal Wind Distribution Model. Renew. Energy 2013, 51, 436–447. [Google Scholar] [CrossRef]
- Wang, H.; Xiao, T.; Gou, H.; Pu, Q.; Bao, Y. Joint Distribution of Wind Speed and Direction over Complex Terrains Based on Nonparametric Copula Models. J. Wind Eng. Ind. Aerodyn. 2023, 241, 105509. [Google Scholar] [CrossRef]
- Mukherjee, I.; Dey, S.; Maiti, S.S. Comparison of Estimators of the PDF and CDF of the Generalized Exponential Distribution. In Proceedings of the 10th International Conference of IMBIC on Mathematical Science for Advancement of Science and Technology, Kolkata, India, 20–22 December 2016; Adhikari, A., Adhikari, M.R., Eds.; pp. 226–281. [Google Scholar]
- Jaramillo, O.A.; Borja, M.A. Wind Speed Analysis in La Ventosa, Mexico: A Bimodal Probability Distribution Case. Renew. Energy 2004, 29, 1613–1630. [Google Scholar] [CrossRef]
- Carta, J.A.; Ramírez, P. Use of Finite Mixture Distribution Models in the Analysis of Wind Energy in the Canarian Archipelago. Energy Convers. Manag. 2007, 48, 281–291. [Google Scholar] [CrossRef]
- Carta, J.A.; Bueno, C.; Ramírez, P. Statistical Modelling of Directional Wind Speeds Using Mixtures of von Mises Distributions: Case Study. Energy Convers. Manag. 2008, 49, 897–907. [Google Scholar] [CrossRef]
- Masseran, N.; Razali, A.M.; Ibrahim, K.; Latif, M.T. Fitting a Mixture of von Mises Distributions in Order to Model Data on Wind Direction in Peninsular Malaysia. Energy Convers. Manag. 2013, 72, 94–102. [Google Scholar] [CrossRef]
- Yang, Z.; Lin, Y.; Dong, S. Joint Model of Wind Speed and Corresponding Direction Based on Wind Rose for Wind Energy Exploitation. J. Ocean. Univ. China 2022, 21, 876–892. [Google Scholar] [CrossRef]
- García-Portugués, E.; Crujeiras, R.M.; González-Manteiga, W. Exploring Wind Direction and SO2 Concentration by Circular-Linear Density Estimation. Stoch. Environ. Res. Risk Assess. 2013, 27, 1055–1067. [Google Scholar] [CrossRef]
- Qin, X.; Zhang, J.; Yan, X.; Jia, Q.; Zi, H. A New Circular Distribution and Its Application to Wind Data. J. Math. Res. 2010, 2, 12. [Google Scholar] [CrossRef]
- Basile, S.; Burlon, R.; Morales, F. Joint Probability Distributions for Wind Speed and Direction. A Case Study in Sicily. In Proceedings of the 2015 International Conference on Renewable Energy Research and Applications, ICRERA 2015, Palermo, Italy, 22–25 November 2015; pp. 1591–1596. [Google Scholar] [CrossRef]
- Hahmann, A.N.; Sile, T.; Witha, B.; Davis, N.N.; Dörenkämper, M.; Ezber, Y.; Garciá-Bustamante, E.; Fidel González-Rouco, J.; Navarro, J.; Olsen, B.T.; et al. The Making of the New European Wind Atlas—Part 1: Model Sensitivity. Geosci. Model Dev. 2020, 13, 5053–5078. [Google Scholar] [CrossRef]
- Dörenkämper, M.; Olsen, B.T.; Witha, B.; Hahmann, A.N.; Davis, N.N.; Barcons, J.; Ezber, Y.; Garciá-Bustamante, E.; Fidel González-Rouco, J.; Navarro, J.; et al. The Making of the New European Wind Atlas—Part 2: Production and Evaluation. Geosci. Model Dev. 2020, 13, 5079–5102. [Google Scholar] [CrossRef]
- New European Wind Atlas. Available online: https://map.neweuropeanwindatlas.eu/ (accessed on 16 October 2023).
- Bocyl Sumario del Boletín 33/2008|Boletín Oficial de Castilla Y León. Available online: https://bocyl.jcyl.es/boletin.do?fechaBoletin=18/02/2008 (accessed on 23 February 2025).
- BOE BOE-A-2019-6691 Resolución de 12 de Abril de 2019, de la Dirección General de Biodiversidad y Calidad Ambiental, por la Que Se Formula Declaración de Impacto Ambiental Del Proyecto Parque Eólico Puylobo de 62,37 MW, Situado en Borja y Mallén (Zaragoza) y Cortes (Navarra). Available online: https://www.boe.es/diario_boe/txt.php?id=BOE-A-2019-6691 (accessed on 23 February 2025).
- Optimization Toolbox; The MathWorks Inc.: Natick, MA, USA, 2024.
- MATLAB, Version 24.1 (R2024a); The MathWorks Inc.: Natick, MA, USA, 2024.
Disclaimer/Publisher’s Note: The statements, opinions and data contained in all publications are solely those of the individual author(s) and contributor(s) and not of MDPI and/or the editor(s). MDPI and/or the editor(s) disclaim responsibility for any injury to people or property resulting from any ideas, methods, instructions or products referred to in the content. |
© 2025 by the authors. Licensee MDPI, Basel, Switzerland. This article is an open access article distributed under the terms and conditions of the Creative Commons Attribution (CC BY) license (https://creativecommons.org/licenses/by/4.0/).