Abstract
This paper proposes a hybrid steel plate–bolt dry and wet jointing method, where the dry jointing part is a steel plate–bolt connector joint and the wet jointing part is a cast-in-place concrete. The novel precast concrete shear wall (PCW) combines the advantages of both dry and wet connections. A steel plate–bolt dry–wet hybrid connection shear wall model was developed using the finite element method, and a low circumferential reciprocating load was applied to the PCW. By analyzing the force and deformation characteristics of the wall, the results showed that the failure mode of novel PCWs was bending-shear failure. Compared to the concrete wall (CW), the yield load, peak load, and ductile displacement coefficient were 6.55%, 7.56%, and 21.49% higher, respectively, demonstrating excellent seismic performance. By extending the wall parameters, it was found that the increased strength of the novel PCW concrete slightly improved the load-bearing capacity, and the ductility coefficient was greatly reduced. As the axial compression ratio increased from 0.3 to 0.4, the wall ductility decreased by 22.85%. Increasing the reinforcement rate of edge-concealed columns resulted in a severe reduction in ultimate displacement and ductility. By extending the connector parameters, it was found that there was an increased number of steel joints, a severe reduction in ductility, enlarged distribution spacing, weld hole plugging and bolt yielding, reduced anchorage performance, and weakening of the steel plate section, which reduced the load-bearing capacity and initial stiffness of the wall, with little effect on ductility.
Keywords:
precast concrete shear wall (PCW); connector parameters; steel plate–bolt dry–wet hybrid connection; finite element analysis; seismic performance MSC:
65Z05
1. Introduction
In the context of global carbon-neutral development, the increase in floor space will lead to a further increase in carbon emissions from the construction industry. Precast concrete structures have the advantages of low energy consumption and simple and efficient on-site assembly processes, providing a solution to reduce carbon emissions from the construction industry [1,2,3]. In precast concrete structures, PCWs, as the main load-bearing elements in the structure, carry vertical forces and take into account seismic performance. To date, research into precast concrete shear wall structures has focused on sandwich panel materials and joints for precast shear walls [4,5,6,7,8]. Sandwich wall panels and various precast shear wall connections increase the stiffness and load-bearing capacity of shear walls [9], but failure of precast shear wall connections is the main cause of structural collapse [10].
Joint connection mainly includes steel connector connection, grout sleeve connection, rebar overlap connection, and horizontal joints without connection but using a reinforcing edge member rebar diameter, and so on [11,12,13,14,15,16,17].
In the study of steel connectors, the combination of steel connectors and bolts is important. Guo [18] proposed a connection by combining a finite slip bolt with a steel plate and carried out tests and numerical simulations, which showed that the connection dissipates energy by transferring lateral forces and has a good energy dissipation capacity, and the wall as a whole is in an elastic state. Malla’s numerical study of the behavior of vertical bolts in precast walls showed that the diameter and strength of the steel bolts greatly influenced the strength of the joint [19]. Yang [20] conducted an experimental study on the new prefabricated shear wall with an angle steel connector, and the results showed that its load-bearing capacity was significantly better than that of the cast-in-place shear wall, the horizontal connector slipped very little during the loading process, and the cracks in the connector were mainly concentrated on the upper side. Xiong [21] designed and developed a new type of bolted horizontal joint device based on the principle of energy consumption, which consumes energy through friction, effectively reduces the overall deformation of the structure, and ensures the stability of the main structure.
In the study of grouted sleeve connections, Cheng [22] conducted proposed static tests on precast concrete grouted sleeve connections using large straight reinforcing bars, and the results showed that the strength of the connection was 90 percent, and there was a significant improvement in the seismic performance of shear walls connected with large straight reinforcing bars. Xiao’s study of the seismic performance of prefabricated shear walls associated with defective grout sleeves showed that there was no difference between defective shear walls with 92 percent or more of their load-bearing capacity and no shear walls [23]. Zhi [24] investigated the seismic performance of shear walls with two different types of grouted joints. The results showed that the two types of joints provided better restraint of the spliced reinforcement and the surrounding concrete, and the shear wall with metal bellows at the joints had better structural performance than the shear wall with expanded metal mesh.
In the study of overlapping rebar connections, Sørensen [25] used U-shaped rebars to connect precast concrete structures and derived an upper bound solution for the load-bearing capacity of the connection, giving a solution based on two failure mechanisms. Liang [26] conducted an experimental study on 21 specimens of double-ended steel overlap joints for precast concrete members, and the results showed that the tensile capacity of the joints increased with the increase of the restrained hoop ratio, and the head reinforcement had little effect on the tensile properties of the joints. Liao [27] proposed a new type of shear wall with non-connected, vertically distributed reinforcement to improve the performance of the new wall by adding edge elements, and the experimental results showed that the displacement ductility and energy dissipation of the prefabricated shear wall were higher than those of the cast-in-place shear wall.
The above study investigated the load-bearing capacity and seismic performance of shear wall connections consisting of both dry and wet connections [28]. Dry joints have the advantage of high construction efficiency, but there are problems, such as loose bolts, steel corrosion treatment, etc. [29]. Wet joints are beneficial to the overall performance of the shear wall, but do not achieve the optimum potential of precast concrete structures [30]. The use of wet/dry hybrid joints brings out the best in both dry and wet joints, slowing steel corrosion and increasing construction efficiency, thus improving the overall durability of the structure.
In this paper, a novel prefabricated shear wall with a steel plate–bolt dry and wet hybrid vertical connection is proposed by combining dry and wet connections. A novel PCW first adopts dry connection to meet the load-bearing capacity and seismic requirements and then adopts post-cast concrete to solve the corrosion of steel connectors and the requirement of wall integrity. The novel PCW and CW are modeled using the finite element method and subjected to cyclic loading to analyze the seismic performance of both. In addition, the parameters of the PCW and connectors are extended and analyzed to investigate the effects of different design parameters on the seismic performance of the PCW with mixed steel plate–bolt dry and wet connections.
2. Finite Element Modeling of PCW
2.1. Hybrid Steel Plate–Bolt Dry and Wet Jointing
The hybrid wet/dry steel plate and bolt connection means that steel connectors were used to connect the vertical joints at key points, and then concrete was poured to join both sides of the precast elements together. Considering the simplicity of the design and the overall dimensions of the CW, the width of the vertical joint was 200 mm, the vertical spacing of the two sets of steel plate embedded parts was 350 mm, the embedded parts were perforated and plug-welded to the horizontally distributed reinforcement bars inside the precast wall on both sides, and the concrete was poured together with the reinforcement bars.
The steel connectors were made of Q235 steel, consisting of embedded parts, steel plates, and bolts. The thickness of the steel plate of the embedded parts was taken as 10 mm, a cross-rib was welded on the back of the embedded parts as a shear key, the thickness of the cross-rib was taken as 16 mm, the thickness of the steel plate was taken as 8 mm, and the bolts were arranged in line. The final dimensions of each part of the steel connector were designed as shown in Figure 1. Embedded parts had to be perforated with the horizontal reinforcement of the wall plug welding holes according to the diameter of 8 mm bolt holes for the design, and the design size of the steel plate was taken as 190 mm × 120 mm. In the area of the vertical joint connection, after the installation was completed, bolts of grade 4.8 with nominal diameter M16 were used to fix the steel plate to the embedded parts in accordance with the requirements of the Technical Specification for Bolting of Steel Structures [31].
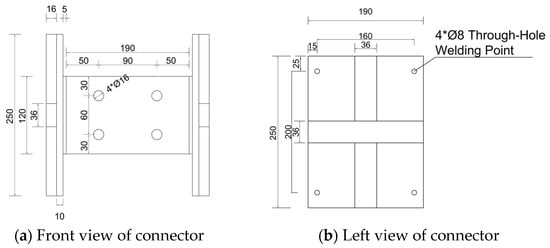
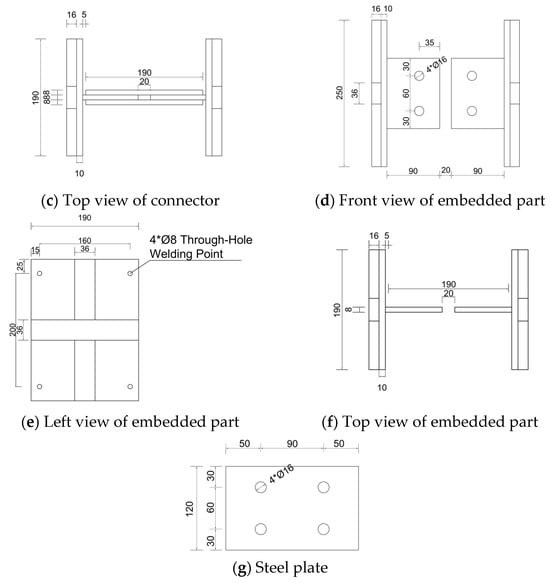
Figure 1.
Steel plate–bolt connections’ dimensional design details.
2.2. Finite Element Model and Meshing
The PCW-1 precast concrete shear wall and the CW precast concrete shear wall with mixed dry and wet steel plate bolting were designed and consisted of three parts: the load beam, the wall, and the floor beam [32,33,34]. The concrete was selected as C40, the size of the load beam was 300 mm × 1700 mm × 300 mm, the hoop reinforcement of the load beam was C8@150, the horizontal longitudinal reinforcement was 4C16, the anchorage length of the wall reinforcement in the load beam was 280 mm, the size of the floor beam was 600 mm × 2300 mm × 600 mm, the hoop reinforcement of the floor beam was C8@150, the horizontal longitudinal reinforcement was 6C16, the setting was C8@300 tie reinforcement, and the anchorage length of the wall reinforcement in the floor beam was 580 mm. The CW size was 2100 mm × 1500 mm × 200 mm, of which the edge member cross-section size was 400 mm × 200 mm, the horizontal distribution of reinforcement and vertical distribution of reinforcement for the wall was C8@200, two kinds of edge member hoops, a large and a small, were spaced for the C8@400, and the longitudinal reinforcement was 6C16 (6 pieces of 16 mm diameter rebar). The wall dimensions on both sides of PCW-1 were 2100 mm × 740 mm × 200 mm, and the reinforcement of the edge elements was the same as that of CW—both were made of HRB400 reinforcing steel and C40 concrete, and the detailed reinforcement of the precast wall is shown in Figure 2.
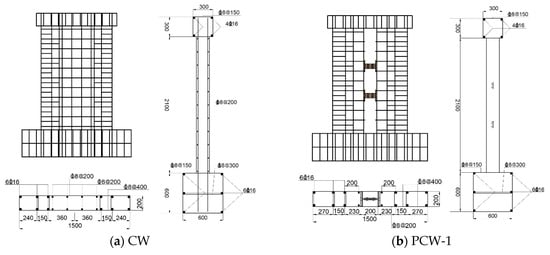
Figure 2.
Dimensions and reinforcement for CW and PCW-1.
The PCW-1 model is shown in Figure 3. In the finite element study of the shear wall, a 3D 2-node truss element (T3D2) was selected for the steel reinforcement because of its large length and small cross-sectional area, which only needs to be considered for its axial tensile and compressive effects. For the concrete, the 3D linear reduced integration cubic element (C3D8R) was used due to its regular shape [35]. T3D2 was used for the reinforcement in the PCW finite element model and C3D8R for the concrete and PCW connectors.
Figure 3.
PCW-1 finite element model.
Based on multiple calculations and literature reports, the global dimensions of the wall panel and reinforcement were 50 mm [36]. The mesh refinement of the loading beam and ground beam did not affect the performance of the shear wall, so a mesh size of 100 mm improved the computational efficiency while ensuring accuracy [37]. For post-cast vertical joints, a 30 mm mesh size provides considerable precision while maintaining relatively fast convergence [38]. An excessively high concrete mesh density increases the computation time without offering improvements in accuracy. Previous studies have investigated the impact of mesh sizes ranging from 10 mm to 50 mm on the ultimate bearing capacity of shear walls, indicating that a 10 mm mesh can meet high-precision requirements [39]. In this study, the mesh size of shear wall connectors was set to 10 mm to ensure high accuracy.
2.3. Material Constitutive Model and Parameter Selection
In this paper, the concrete damaged plasticity model (CDPM) was selected for the concrete structure, the damage index was introduced to discount the elastic stiffness to simulate the stiffness degradation of concrete, and the stress–strain curve of concrete was calculated according to the Code for the Design of Concrete Structures [40].
The CDPM selected five parameters: dilatancy angle, eccentricity, the ratio of initial equibiaxial compressive yield stress to initial uniaxial compressive yield stress, viscosity coefficient, and invariant stress ratio. The dilatancy angle was 36°, the viscosity coefficient was 0.001, the eccentricity was 0.1, the ratio of initial equibiaxial compressive yield stress to initial uniaxial compressive yield stress was 1.16, and the invariant stress ratio was 2/3 [41,42].
The recovery coefficient of tensile and compressive damage (Wt, Wc) characterizes the degree of stiffness degradation of concrete. It is assumed that the stiffness of concrete can be fully restored after it has been subjected to tensile damage and then compressed. Wt is set to the default value of 1, and the influence of Wc on the simulation results is embodied in the different fullness of the hysteresis curve and the fluctuation of the eigenvalue of the skeleton curve. In this paper, Wc was 0.5.
A representative system for the tensile and compressive strength of concrete is given in [40]. The stress–strain curve of concrete in uniaxial tension is determined by Equations (1)–(6):
The stress–strain curve for uniaxial compression of concrete is determined by Equations (7)–(14):
where is the representative value of the uniaxial tensile strength of concrete, is the representative value of the uniaxial compressive strength of concrete, and is the cubic compressive strength of concrete. and are the peak tensile and compressive strains of concrete corresponding to the representative value of the uniaxial tensile and compressive strengths, while is a variable that is the ratio of the strain at any point to the peak strain, generally starting at 0.4 for ≤ 1 and increasing by 0.1 as the extreme deviation, and increasing by 0.2 for > 1, with the maximum value not exceeding 3. and are the parameter values of the descending portion of the uniaxial concrete tensile and compressive stress–strain curves, is the parameter used to derive the formula, which is of no practical significance, and are the parameters for the evolution of damage of the uniaxial concrete tensile and compressive strength, and are the tensile and compressive stress, and are the tensile and compressive strain, and is the modulus of elasticity.
As the stresses and strains in the concrete constitutive expressions given in the specification were different from those to be entered in ABAQUS 2020, the software defaulted to inelastic strains, and the conversion formula is given in Equations (15)–(18):
where is the compressive plastic strain, is the tensile inelastic strain to be entered into the software, is the compressive plastic strain, is the compressive inelastic strain to be entered into the software, D is the damage factor, and E0 is the modulus of elasticity.
Based on the principle of energy equivalence, the damage factor, D, is given by Equations (19) and (20) [40]:
The rebar utilizes the improved constitutive model for buckling and crushing of steel bars, developed by Fang [43]. The effect of hysteresis on energy consumption varies with the magnitude of the expression in Equations (21) and (22):
The unloading stiffness, Esr, varies with the value of and is given by Equation (23) [44]:
where Es is the initial stiffness, Ɛm is the maximum strain, Ɛ0 is the strain at the intersection of the tensile and compressive unloading segments and the strain coordinate axis, and Ɛy is the strain at any point.
The steel constitutive model was selected as the bifold constitutive model. Its stress–strain curve mainly included the elastic stage before yielding and the plastic stage after yielding, and the latter was simplified as an inclined straight line, before and after the slope of the curve relationship between the slope of Es′ = 0.01 E, as shown in Equation (24) [43]:
where E is the modulus of elasticity of steel, taken to be 2.1 × 10⁵ MPa, Es′ is the modulus of elasticity of steel at the strengthening stage, is the strain of steel, is the yield strain of steel, is the stress of steel, and is the yield stress of steel.
2.4. Boundary Conditions
The contact relationships that existed in the PCW components were load-bearing beams to the top of the wall, bottom beams to the bottom of the wall, reinforcing steel to concrete, and precast elements to in situ concrete. “Tie” constraints were applied between the load beam and the top of the wall, and between the foundation beam and the bottom of the wall. The interaction between the reinforcement and concrete was set to “embedded region”. The interface between precast components and post-cast concrete was defined using the “surface-to-surface” contact to model the interaction between the new and old concrete, with a friction coefficient of 0.6.
The contact between steel components was defined using the “general contact” constraint, with normal contact defined as “hard” and tangential contact defined using the “penalty” method. The friction coefficient at the steel-to-steel interface was set to 0.35. The horizontal distribution rebar within the wall was perforated and plug-welded to the steel plate using the “coupling” constraint. The boundary conditions are shown in Figure 4.
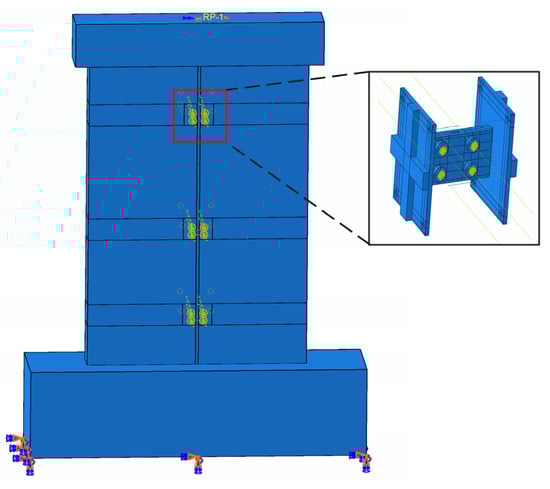
Figure 4.
Boundary conditions.
2.5. Loading Protocol and Analysis Step Settings
According to the “Code for Seismic Design of Buildings”, the shear wall was subjected to low-cycle reciprocating loading with an axial compression ratio of 0.3. The applied axial load was calculated as shown in Equation (25) [45]:
where fc is the design value of the axial compressive strength of concrete, bw is the width of the wall limb, hw is the height of the wall limb, 1.2 is the subdivision coefficient, and N is the axial pressure of the wall limb.
The loading protocol for the wall is shown in Figure 5. Cyclic loading was applied to CW and PCW-1 at multiples of the wall yield displacement, y.
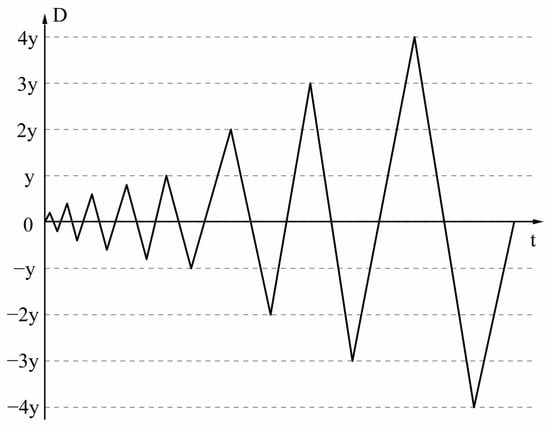
Figure 5.
Loading protocol.
In PCW-1, the steel connections used grade 4.8 M16 bolts tightened to a torque of 100 N·m, giving a bolt load of 40 kN. The bolt load was applied in two stages. PCW-1 included all analysis steps, while CW did not include Step-1 and Step-2. The specific analysis steps are as follows:
Initial: the bottom of the floor beam is set as a fixed constraint, i.e., U1 = U2 = U3 = UR1 = UR2 = UR3 = 0.
Step-1: Apply a bolt load of 1 kN to the bolt (PCW-1).
Step 2: Apply the full 40 kN bolt load (PCW-1) to the bolt.
Step-3: Establish reference point RP-1 at the center of the top surface of the load beam. Couple the top surface with reference point RP-1 and apply a vertical load at RP-1. Maintain a constant magnitude of the vertical load throughout the process.
Step-4: Establish reference point RP-2 at the center of the left end of the load beam. Couple the left end surface with reference point RP-2 and apply a horizontal displacement load at RP-2.
To determine the yield displacement, y, of CW and PCW-1 in this study, a horizontal pushover analysis was conducted with a step size of 1 mm and a total displacement of 20 mm. The yield displacements of CW and PCW-1 were then determined using the equal energy method [46], and the yield point of CW was 5.24 mm and that of PCW-1 was 4.53 mm.
3. PCW Seismic Performance
3.1. Failure Mode
Figure 6 illustrates the plastic damage of PCW-1 and stress distribution of steel connectors. As PCW-1 reached yield, a small number of cracks began to appear in the concrete on the lower two sides of the wall, and a small portion of the longitudinal reinforcement in the area of the concealed columns on either side bent under pressure. As the wall reached its peak load, the diagonal cracks in the wall increased in length. The tensile damage to the concrete of the wall was symmetrically distributed in a “V” shape, and the damage to the concrete in the center of the vertical joint area was small. When PCW-1 reached the limit load, the concrete damage of the wall panel was severe, and the crack distribution was roughly “Y” shaped, representing a bending-shear failure. Damage developed around the steel connection and was concentrated near the interface between old and new concrete.
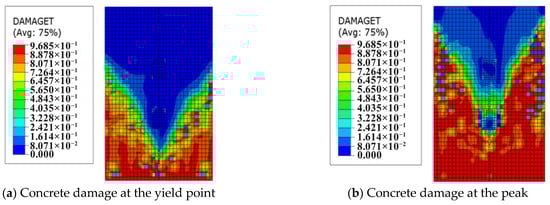
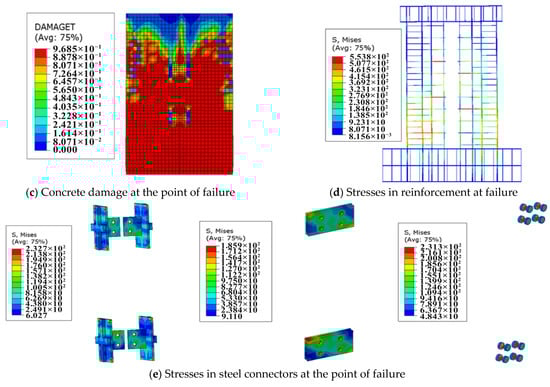
Figure 6.
PCW-1 plastic damage and stress distribution.
In the case of wall failure, stress concentrations were observed at the corners of the embedded parts, at the diagonal of the steel plate and at the bolts. However, none of these would reach the point of yielding. This phenomenon indicates that the steel plate connectors acted as an effective medium for the transfer of horizontal loads and stresses in the rebars.
3.2. Hysteresis Loops and Skeletal Curves
Figure 7a illustrates the hysteresis loops for PCW-1 and CW. In the initial stages of loading, both PCW and CW were in the elastic phase, with the area of the hysteresis loops being minimal and almost linear, indicating that there was no significant change in overall stiffness. As the application of displacement loads persisted in the later stages, the area of the hysteresis loops gradually increased, indicating an enhanced capacity for energy dissipation. The trend of stiffness degradation stabilized, and the pinching effect of the curves became more pronounced. The skeletal curves of PCW-1 and CW are illustrated in Figure 7b. At the beginning of displacement loading, the trends of the skeleton curves of PCW-1 and CW were consistent and almost overlapping. As the loading proceeded, the load-bearing capacity of both reached a peak value almost simultaneously, with the peak load-bearing capacity of CW being 590.47 kN. The load-bearing capacity of PCW-1 remained relatively stable, with the peak load increasing by 7.56%. Following the loading to the peak displacement, the rate of reduction in bearing capacity was faster for CW than for PCW-1. This indicated that PCW-1 had a higher bearing capacity and better ductility than CW, which ensured the integrity of the wall limb and reduced the deformation of the wall.
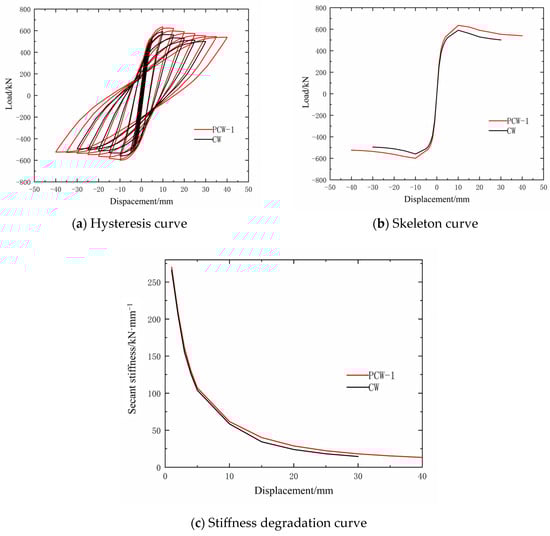
Figure 7.
The curves of PCW-1 and CW.
3.3. Stiffness Degradation
In this study, the secant stiffness was used as the equivalent stiffness to represent the stiffness degradation behavior of the structure, calculated as follows:
where Fi is the peak load in the positive direction during the i-th cycle, −Fi is the peak load in the negative direction during the i-th cycle, is the peak displacement in the positive direction during the i-th cycle, and is the peak displacement in the negative direction during the i-th cycle.
The stiffness degradation of PCW-1 and CW is shown in Figure 7c. As displacement increased, the lateral stiffness of both PCW-1 and CW exhibited nonlinearity. In the initial loading stage, the rate of stiffness degradation was relatively rapid. As loading progressed to the later stages, the trend of stiffness degradation stabilized. In the early stages of loading, the stiffness degradation rate of PCW-1 was not significantly different from that of CW. However, in the later stages of loading, the stiffness degradation rate of PCW-1 was slower than that of CW, resulting in greater stiffness. This indicated that the use of the steel plate–bolt improved the lateral stiffness of the PCW.
3.4. Load-Bearing Capacity and Ductility
As shown in Table 1, PCW-1 exhibited a 6.55% increase in yield load and a 7.56% increase in peak load compared to CW, indicating an overall improvement in load-bearing performance. The yield displacements of PCW-1 and CW were similar, with PCW-1 exhibiting a 24.23% higher ultimate displacement compared to CW. Additionally, PCW-1 showed a larger ductility coefficient, with an increase of 21.49% compared to CW.

Table 1.
Skeleton curve characteristics of CW and PCW-1.
3.5. Energy Dissipation
The energy dissipation evaluation indices for the wall were selected as the energy dissipation coefficient, E, and the equivalent viscous damping ratio.
The energy dissipation evaluation indices of PCW-1 and CW are shown in Table 2.
Table 2.
Load characteristic point energy dissipation index.
During the loading process, the energy dissipation coefficients of both PCW-1 and CW showed an increasing trend. CW had a higher growth rate of the energy dissipation coefficient compared to PCW-1. The value of the energy dissipation coefficient at the yield point for PCW-1 was higher than that of CW, indicating that PCW-1 had a better energy dissipation performance than CW during the initial loading phase. In the later stages of loading, CW exhibited superior energy dissipation performance, with an energy dissipation coefficient at failure 5.03% higher than that of PCW-1.
4. Parameter Extension Analysis
4.1. Parameter Extension
The PCW parameter extension is shown in Table 3. The PCW concrete strengths were selected as C45, C50, and C55. The axial compression ratios for PCW were chosen as 0.2, 0.4, and 0.5. Different longitudinal reinforcement ratios for PCW edge-concealed columns were adjusted by varying the longitudinal bar diameters, specifically 18 mm and 14 mm, corresponding to reinforcement ratios of 1.91% and 1.15%, respectively.
Table 3.
The configuration of parameter extensions.
The number of connectors was 2, 3, and 4, respectively. Two distinct distribution forms were employed for the PCW with 3 connectors. The spacing between the steel connectors was 750 mm and 1150 mm, respectively. The specific configuration of the connectors is illustrated in Figure 8.
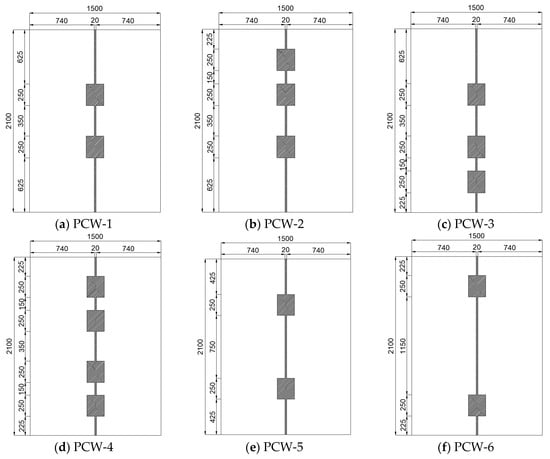
Figure 8.
Distribution of the connectors.
The dimensions of the steel plate were determined by the length of the plate, the diameter of the round hole, the length of the square hole, and the width of the square hole. The relationship between these dimensions was 5:1:1:0.8. The opening form was primarily designed for semicircular holes, round holes, square holes, and combinations of semicircular and square holes. The specific form of the opening is illustrated in Figure 9.
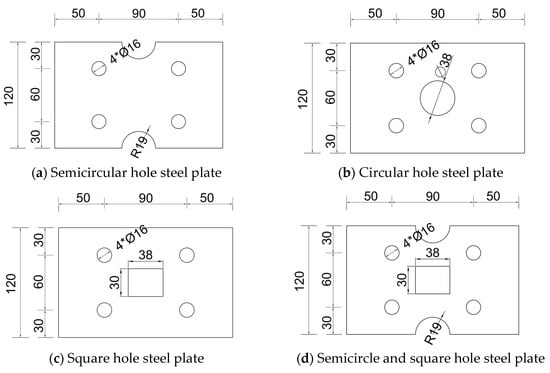
Figure 9.
Steel plates with different openings.
4.2. Results and Discussion
Table 4 presents the mechanical indexes of the characteristic points, calculated using different PCW parameters.
Table 4.
Characteristic values of skeleton curves for different wall parameters.
4.2.1. Wall Parameters
The concrete strength exhibited a gradual change from C40 to C55, accompanied by a corresponding increase in the yield load and peak load of the wall. The yield load of the wall increased by 0.07%, 4.59%, and 6.93%, while the peak load of the wall increased by 0.65%, 5.14%, and 7.19%. This resulted in a notable enhancement in the bearing capacity. The ductility coefficient of the wall exhibited a gradual decline as the concrete strength class increased. The ductility coefficient of PCW-C55 was observed to decrease by 25.18% in comparison to PCW-1. Upon a change in concrete strength from C45 to C50, the horizontal bearing capacity of the connection node exhibited a notable increase, accompanied by a more pronounced decline in ductility. The ductility coefficient experienced a 2.70% reduction from C40 to C45 and a 16.41% decline from C45 to C50.
A change in the axial compression ratio from 0.20 to 0.50 resulted in an increase in the yield load of the wall from 479.24 kN to 535.68 kN, 536.35 kN, and 568.12 kN, representing an increase of 11.78%, 11.92%, and 18%. The peak load of the wall was increased from 580.16 kN to 635.26 kN, 638.18 kN, and 662.81 kN, by 9.50%, 10.00%, and 14.25%, respectively. It can be observed that the yield load and peak load were increasing. A reduction in the axial compression ratio from 0.2 to 0.3 resulted in a 7.08% decrease in the ductility coefficient. A further reduction from 0.3 to 0.4 led to a 22.85% decrease, while a reduction from 0.4 to 0.5 resulted in a 10.19% decrease. An increase in the axial compression ratio had a significant impact on the load-bearing capacity of the wall, while simultaneously limiting the potential for cracking.
The load-bearing capacity of the wall was enhanced with an increase in the reinforcement ratio of the longitudinal bars of the edge-concealed columns. The peak load of the wall exhibited a 14.01% increase in the reinforcement ratio range of 1.15% to 1.51%, and an 8.35% increase in the range of 1.51% to 1.91%. This indicated a deceleration in the rate of increase. An increase in the reinforcement rate was observed to result in a reduction in the deformation capacity of the wall, which in turn affected the ductility. This was evidenced by a decrease in the ultimate displacement of the PCW, which was found to be 7.66% lower in the process of the reinforcement rate from 1.15% to 1.51%, and 31.79% lower in the process of 1.51% to 1.91%. The latter also resulted in a decrease in ductility of 8.54% and 53.30%, respectively. An increase in the reinforcement rate of the longitudinal reinforcement of the edge members had a significant impact on the load-bearing capacity of the wall. However, this increase in load-bearing capacity was accompanied by a reduction in the deformation capacity of the wall and a weakening of its ductility. The greatest reduction in ductility and weakening of the wall occurred at a reinforcement rate of 1.91%.
4.2.2. Connector Parameters
The stress distribution of the connectors when the PCW was damaged is illustrated in Figure 10. The stress distribution was primarily concentrated in the vertical joint of the lower position of the steel connectors, with minimal changes observed in the stress levels near the top of the wall connectors. Stress concentration was still evident in the corners of the steel plate, holes, and bolts when the number of connectors was 3 or 4. In the vicinity of the lowermost wall connectors, the stress concentration was more pronounced in the vicinity of the plug weld holes. In certain areas, the yield state was reached, indicating a reduction in the anchoring effect of the connectors. However, the majority of the steel connectors remained in an elastic state, demonstrating that the connection effect was not compromised. Nevertheless, the majority of the connector area remained in an elastic state, thereby maintaining its connecting effect.
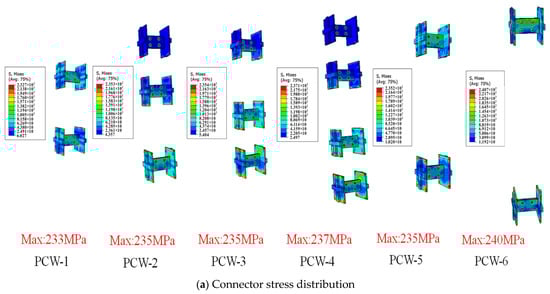
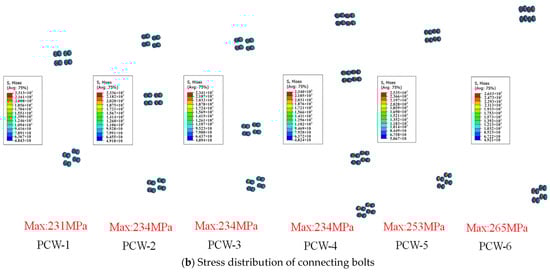
Figure 10.
Connector stress distribution during wall failure.
As the number of connections increased, the yield load and peak load of the shear wall were elevated, yet the ductility was diminished. Upon increasing the number of connections from 2 to 4, the yield load exhibited an increase of 7.13%, 7.06%, and 10.57%, while the peak load demonstrated an increase of 7.24%, 6.67%, and 10.16%. Conversely, the ductility was reduced by 6.02%, 11.56%, and 13.88%, respectively. In comparison to PCW-2 and PCW-3, there was minimal difference in the load-bearing capacity of the two, with PCW-2 exhibiting superior ductility. However, both PCW-2 and PCW-3 exhibited reduced ductility in comparison to PCW-1, indicating that increasing the number of connectors along the vertical joints of the wall to the two ends would have a detrimental effect on the wall’s ductility, with the effect of increasing the connectors downwards being more pronounced. A comparison of the PCW-2 and PCW-1, PCW-3, and PCW-4 could be obtained by arranging the connectors in the same way, from the top of the vertical joints of the wall. This increased the number of connectors, but the impact of the bearing capacity and ductility of the wall was not large. This indicated that the role played by the connectors near the top of the wall was not obvious.
The stress distribution of PCW-1, PCW-5, and PCW-6 indicated that an increase in the vertical spacing of the connectors would result in a reduction in the bearing capacity of the wall. However, this reduction was not significant, as evidenced by the decrease in bearing capacity when the vertical spacing was increased from 350 mm to 1150 mm. The yield load of the model was reduced from 535.68 kN to 505.95 kN, representing a decrease of 5.88%. Similarly, the peak load was reduced from 635.26 kN to 610.18 kN, representing a decrease of 3.95%. An increase in the spacing of the connectors resulted in an enhancement of the wall’s ductility. A rise in vertical spacing from 350 mm to 750 mm was observed to elevate the shear wall’s ductility coefficient by 4.18%. Conversely, an increase in spacing from 750 mm to 1150 mm was found to elevate the ductility to a lesser extent, at 2.59%. This represented a reduction in the extent of the increase.
The stiffness degradation of PCW with different connector spacings is shown in Figure 11. The initial stiffness of PCW-1 with a spacing of 350 mm was 270.15 kN/mm. However, an increase in the vertical spacing of the connectors resulted in a reduction in the initial stiffness of the model, with the initial stiffness of PCW-5 being 247.71 kN/mm. The initial stiffness of PCW-6 was 245.62 kN/mm when the vertical spacing was increased to 1150 mm, representing a 9.08% reduction in stiffness compared to PCW-1. The initial stiffnesses of PCW-5 and PCW-6 were not significantly different, and the stiffness degradation trend was consistent. The curves were largely superimposed. The stiffness degradation of PCW-1 and PCW-6 was slightly slower than that of PCW-1 during the preloading period, and the three stiffness degradation trends were identical after reaching the peak displacement.
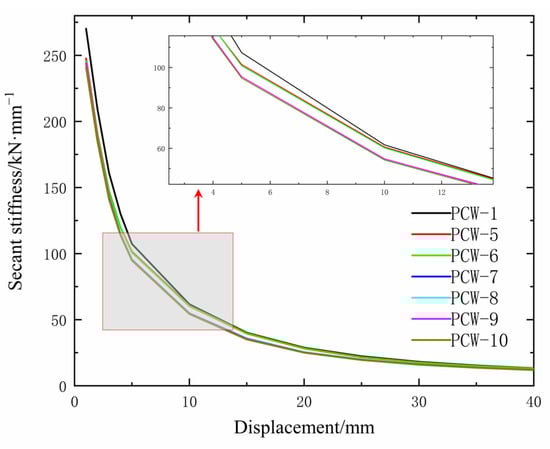
Figure 11.
Stiffness degradation of PCW with different connector spacings.
The stress distribution of steel plates with different perforation forms is shown in Figure 12. The opening of the steel plate changed the stress distribution of the steel plate, the stress distribution of the unopened steel plate was mainly along the diagonal of the steel plate, and the stress was concentrated at the corners. While the steel plate was opened, the stress was divided into upper and lower parts by the boundary of the center line of the steel plate, the stress of the upper steel plate was mainly distributed in the center line below, and the stress of the lower steel plate was mainly distributed in the center line above. The stress concentration of the lower steel plate was more obvious, mainly in the center of the semicircular hole, the center of the circular hole, the center of the square hole, and the junction of the circular hole and the square hole, with the maximum stress of 193.1 MPa. In the open hole steel plate, the stress distribution of the steel plate of the circle hole and the square hole was similar in shape, and the degree of concentration was lower than that of the other open hole steel plate, with the maximum stress of 172.8 MPa, and all the steel plates did not enter the yielding state. The load-bearing capacity of the PCW with the non-open-hole steel plate was higher than that of the PCW with the open hole steel plate, and the yield load and peak load of PCW-1 were 14.08% and 13.63% higher than that of PCW-10, respectively.
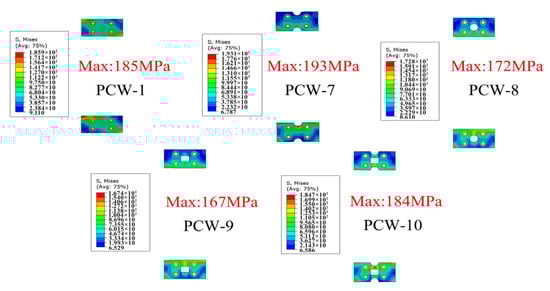
Figure 12.
Stress distribution of steel plates with different perforation forms.
The stiffness degradation of steel plates with different opening types is shown in Figure 11. The initial stiffnesses of PCW-1, PCW-7, PCW-8, PCW-9, and PCW-10 were 270.15 kN/mm, 244.24 kN/mm, 244.36 kN/mm, 243.92 kN/mm, and 240.89 kN/mm, respectively, indicating that the opening of the steel plate reduced the initial stiffness of the wall, and the initial stiffness of the wall decreased with the increase of the opening area. The initial stiffness of the wall decreased with the increase of the opening area, and the opening shape of the steel plate had little effect on the stiffness degradation speed of its curve. The development trends of the stiffness degradation curves of the shear wall model with semicircular hole, circular hole, rectangular hole, and semicircular and square hole steel plates were basically the same.
5. Conclusions
In this paper, the seismic performance and parameters of prefabricated shear walls with hybrid steel plate–bolt dry and wet connections have been investigated, and the conclusions are as follows:
- For the PCW with the vertical joint steel plate–bolt wet and dry hybrid connection, under small circumferential reciprocal load, the failure mode was the distribution of cracks on the left and right sides of the wall symmetrically, in the shape of “Y”. The steel plate connectors effectively transferred the horizontal load and the reinforcement stress. Compared with CW, the yield load of the novel PCW was increased by 6.55%, the peak load was increased by 7.56%, and the ultimate displacement and ductility coefficient were increased by 24.23% and 21.49%, respectively, so that the seismic performance of the novel PCW was better than that of CW and had certain technical feasibility.
- When the concrete strength of the novel PCW was increased from C40 to C55, the yield strength and peak load capacity of the wall increased, and the decrease in the ductility coefficient increased. When the axial pressure ratio was increased from 0.2 to 0.5, the tensile damage area of the wall was shifted from the middle to the two sides, the cracks were of “Y” type, and the yield and peak loads of the PCW were greatly increased. However, the ductility coefficient decreased by 22.85% when the axial pressure ratio was 0.4, and it is recommended that the axial pressure ratio be within the range of 0.2–0.3. When the reinforcement rate increased from 1.51% to 1.91%, the ultimate displacement and ductility decreased by 31.79% and 53.30%, respectively, and the ductility of the PCW was significantly weakened, but it still met the code requirements for the ultimate displacement angle.
- Increasing the number of connectors increased the load-bearing capacity of the wall, but not by much. If the number of connectors was too large, the connectors near the top of the wall did not play a significant role, and the connectors near the bottom of the wall became less effective due to the yield deformation of the plug weld holes. The anchoring effect of the connectors in the concrete was reduced.
- Increasing the spacing of the connectors will gradually increase the stresses in the plug weld holes and the bolts of the embedded parts, some of the steel in the region of the plug weld holes will enter the yield state, and the anchorage performance of the connectors will be reduced. The initial stiffness of the PCW decreased as the spacing increased, but the ductility increased slightly and the ability to resist plastic deformation also increased slightly.
- The weakening of the steel plate section reduced the load-bearing capacity and the initial stiffness of the wall and had little effect on the ductility. Unopened hole steel plate stress was concentrated in the corners, while the open hole steel plate stress was concentrated in the middle of the semicircular holes, round holes, and square holes. It is recommended to select the steel plate using the plate length:diameter of round holes:square hole length:square hole width = 5:1:1:0.8 proportion of the opening of the round hole or square hole steel plate.
Author Contributions
Conceptualization, Q.D. and Y.Z. (Yiyun Zhu); formal analysis, Q.D. and Y.Z. (Yiyun Zhu); software, G.C.; methodology, Q.D. and Z.M.; writing—review and editing, Q.D. and Z.M.; supervision, Y.Z. (Yue Zhao) and Z.M. All authors have read and agreed to the published version of the manuscript.
Funding
This research is supported by the National Key R&D Program of China (No. 2022YFB2602200), the National Natural Science Foundation of China (No. U2368203), and the Doctoral Dissertation Innovation Fund of Xi’an University of Technology (No. 252072217).
Data Availability Statement
The original contributions presented in this study are included in the article. Further inquiries can be directed to the corresponding authors.
Conflicts of Interest
The authors declare no conflicts of interest.
References
- Xu, A.; Zhu, Y.; Wang, Z.; Zhao, Y. Carbon emission calculation of prefabricated concrete composite slabs during the production and construction stages. J. Build. Eng. 2023, 80, 107936. [Google Scholar] [CrossRef]
- Zhou, J.; Li, P.; Guo, N. Seismic performance assessment of a precast concrete-encased CFST composite wall with twin steel tube connections. Eng. Struct. 2020, 207, 110240. [Google Scholar] [CrossRef]
- Sun, J.; Qiu, H.; Yang, Y.; Lu, B. Experimental and analytical studies on the deformability of a precast RC shear wall involving bolted connections. Sci. China Technol. Sci. 2015, 58, 1439–1448. [Google Scholar] [CrossRef]
- Guo, W.; Zhai, Z.; Cui, Y.; Yu, Z.; Wu, X. Seismic performance assessment of low-rise precast wall panel structure with bolt connections. Eng. Struct. 2019, 181, 562–578. [Google Scholar] [CrossRef]
- Shen, S.-D.; Pan, P.; Miao, Q.-S.; Li, W.-F.; Gong, R.-H. Test and analysis of reinforced concrete (RC) precast shear wall assembled using steel shear key (SSK). Earthq. Eng. Struct. Dyn. 2019, 48, 1595–1612. [Google Scholar] [CrossRef]
- Zhao, W.; Wang, Q.; Li, Y.; Yang, Y. Seismic performance of precast reinforced concrete shear wall structure connected with vertical indirect-lapping joints. Structures 2023, 58, 105544. [Google Scholar] [CrossRef]
- Han, Q.; Wang, D.; Zhang, Y.; Tao, W.; Zhu, Y. Experimental investigation and simplified stiffness degradation model of precast concrete shear wall with steel connectors. Eng. Struct. 2020, 220, 110943. [Google Scholar] [CrossRef]
- Zhou, Y.; Zhu, X.; Wu, H.; Djerrad, A.; Ke, X. Seismic demands of structural and non-structural components in self-centering precast concrete wall buildings. Soil Dyn. Earthq. Eng. 2022, 152, 107056. [Google Scholar] [CrossRef]
- Li, Y.; Xue, W.; Yun, Y.; Ding, H. Reversed cyclic loading tests on precast concrete sandwich shear walls under different axial compression ratios. J. Build. Eng. 2022, 54, 104619. [Google Scholar] [CrossRef]
- Xinwei, M.; Wei, H.; Zhenhui, F.; Jiarui, Z.; Pei, G. Mechanical property test and numerical analysis of a novel precast shear wall. Eng. Struct. 2024, 300, 117236. [Google Scholar] [CrossRef]
- Xue, W.; Huang, Q.; Gu, X.; Hu, X. Hysteretic behavior of precast concrete shear walls with steel sleeve-corrugated metallic duct hybrid connections. Structures 2022, 38, 820–831. [Google Scholar] [CrossRef]
- Fu, Q.; Cao, Z.-W.; Liao, X.-D.; Liu, Y.-N.; Zhang, S.-Q. Quasi-static test and simplified analysis method of a new type precast shear wall with unconnected vertical distributed reinforcements. J. Build. Eng. 2022, 47, 103794. [Google Scholar] [CrossRef]
- Vella, J.P.; Vollum, R.L.; Jackson, A. Flexural behaviour of headed bar connections between precast concrete panels. Constr. Build. Mater. 2017, 154, 236–250. [Google Scholar] [CrossRef]
- Naserpour, A.; Fathi, M.; Dhakal, R.P. Demountable shear wall with rocking boundary columns for precast concrete buildings in high seismic regions. Structures 2022, 41, 1454–1474. [Google Scholar] [CrossRef]
- Sun, J.; Qiu, H.; Lu, Y.; Jiang, H. Experimental study of lateral load behavior of H-shaped precast reinforced concrete shear walls with bolted steel connections. Struct. Des. Tall Spec. Build. 2019, 28, e1663. [Google Scholar] [CrossRef]
- Li, J.; Fan, Q.; Lu, Z.; Wang, Y. Experimental study on seismic performance of T-shaped partly precast reinforced concrete shear wall with grouting sleeves. Struct. Des. Tall Spec. Build. 2019, 28, e1632. [Google Scholar] [CrossRef]
- Vaghei, R.; Hejazi, F.; Taheri, H.; Jaafar, M.S.; Aziz, F.N.A.A. Development of a new connection for precast concrete walls subjected to cyclic loading. Earthq. Eng. Eng. Vib. 2017, 16, 97–117. [Google Scholar] [CrossRef]
- Guo, T.; Wang, L.; Xu, Z.; Hao, Y. Experimental and numerical investigation of jointed self-centering concrete walls with friction connectors. Eng. Struct. 2018, 161, 192–206. [Google Scholar] [CrossRef]
- Malla, P.; Xiong, F.; Cai, G.; Xu, Y.; Larbi, A.S.; Chen, W. Numerical study on the behaviour of vertical bolted joints for precast concrete wall-based low-rise buildings. J. Build. Eng. 2021, 33, 101529. [Google Scholar] [CrossRef]
- Yang, J.; Sun, C.; Xu, X.; Fang, Y.; Sun, B. Experimental study on seismic behavior of a new precast shear wall system with angle steel connectors. Structures 2023, 52, 30–41. [Google Scholar] [CrossRef]
- Xiong, E.; Zhang, H.; Fu, C.; Hu, Q.; Fan, Y.; Taciroglu, E. Research on design and mechanical behavior of a new horizontal connection device of prefabricated shear wall. Constr. Build. Mater. 2023, 370, 130713. [Google Scholar] [CrossRef]
- Cheng, J.; Luo, X.; Cheng, Q.; Xing, M. Seismic performance of precast concrete walls with grouted sleeve connections using large-diameter bars. Soil Dyn. Earthq. Eng. 2023, 169, 107905. [Google Scholar] [CrossRef]
- Xiao, S.; Wang, Z.; Li, X.; Harries, K.A.; Xu, Q.; Gao, R. Study of effects of sleeve grouting defects on the seismic performance of precast concrete shear walls. Eng. Struct. 2021, 236, 111833. [Google Scholar] [CrossRef]
- Zhi, Q.; Guo, Z.; Xiao, Q.; Yuan, F.; Song, J. Quasi-static test and strut-and-tie modeling of precast concrete shear walls with grouted lap-spliced connections. Constr. Build. Mater. 2017, 150, 190–203. [Google Scholar] [CrossRef]
- Sørensen, J.H.; Hoang, L.C.; Poulsen, P.N. Keyed shear connections with looped U-bars subjected to normal and shear forces Part II—Rigid-plastic modeling of the ultimate capacity. Struct. Concr. 2021, 22, 2407–2417. [Google Scholar] [CrossRef]
- Liang, Z.; Gong, C.; Zhang, S.; Liang, W.; Hou, Z. Tensile behaviors and configurations of double-headed bar overlap connections for precast concrete members. Eng. Struct. 2023, 293, 116701. [Google Scholar] [CrossRef]
- Liao, X.; Zhang, S.; Cao, Z.; Xiao, X. Seismic performance of a new type of precast shear walls with non-connected vertical distributed reinforcement. J. Build. Eng. 2021, 44, 103219. [Google Scholar] [CrossRef]
- Hemamalini, S.; Vidjeapriya, R.; Jaya, K.P. Performance of Precast Shear Wall Connections Under Monotonic and Cyclic Loading: A State-of-the-Art Review. Iran. J. Sci. Technol. Trans. Civ. Eng. 2021, 45, 1307–1328. [Google Scholar] [CrossRef]
- Menegon, S.J.; Wilson, J.L.; Lam, N.T.K.; Gad, E.F. Experimental testing of innovative panel-to-panel connections for precast concrete building cores. Eng. Struct. 2020, 207, 110239. [Google Scholar] [CrossRef]
- Cheng, B.; Cai, Y.; Looi, D.T.W. Experiment and numerical study of a new bolted steel plate horizontal joints for precast concrete shear wall structures. Structures 2021, 32, 760–777. [Google Scholar] [CrossRef]
- JGJ 82-2011; Standards for Construction of Building Engineering. Ministry of Housing and Urban-Rural Development of the People’s Republic of China: Beijing, China, 2011.
- JGJ 1-2014; Standards for Construction of Building Engineering. Ministry of Housing and Urban-Rural Development of the People’s Republic of China: Beijing, China, 2017.
- GB/T 51231-2016; Code for Construction of Building Engineering. Ministry of Housing and Urban-Rural Development of the People’s Republic of China: Beijing, China, 2017.
- JGJ 3-2010; Standards for Construction of Building Engineering. Ministry of Housing and Urban-Rural Development of the People’s Republic of China: Beijing, China, 2010.
- Kisa, M.H.; Yuksel, S.B.; Özmen, R. Experimentally validated numerical investigation on the behavior of composite shear walls subjected to cyclic loading. Eng. Sci. Technol. Int. J. 2024, 59, 101884. [Google Scholar] [CrossRef]
- Zhang, M.; Yi, Q.; Wang Zhu, L. Finite Element Analysis of Torsional Behavior of Short Shear Walls of T-shaped and L-shaped Cross Section with Local Joint. Build. Sci. 2015, 31, 48–53. [Google Scholar]
- Zhang, Y. Finite Element Analysis Model Design on the Mechanical Properties of Prefabricated Shear Wall Structure. Sci. Program. 2022, 2022, 4633128. [Google Scholar] [CrossRef]
- Vargas, L.; Sandoval, C.; Bertolesi, E.; Tarque, N. Numerical strategy and openings-focused sensitivity study of the seismic behavior of partially grouted masonry shear walls with openings. J. Build. Eng. 2025, 100, 111816. [Google Scholar] [CrossRef]
- Erbaş, Y.; Anıl, Ö.; Özdemir, A.; Kopraman, Y. Prediction of capacity of reinforced concrete shear wall with multiple openings by using nonlinear finite element analysis. Struct. Concr. J. Fib 2023, 24, 680–702. [Google Scholar] [CrossRef]
- GB 50010-2010; Code for Design of Concrete Structures. Ministry of Housing and Urban-Rural Development of the People’s Republic of China: Beijing, China, 2010.
- Tao, X.; Phillips, D.V. A simplified isotropic damage model for concrete under bi-axial stress states. Cem. Concr. Compos. 2005, 27, 716–726. [Google Scholar] [CrossRef]
- Lee, J.; Fenves Gregory, L. Plastic-Damage Model for Cyclic Loading of Concrete Structures. J. Eng. Mech. 1998, 124, 892–900. [Google Scholar] [CrossRef]
- Fang, Z.; Zhen, Y.; Li, X. Steel hysteretic model of reinforced concrete structures. Eng. J. Wuhan Univ. 2018, 51, 613–619. [Google Scholar] [CrossRef]
- Vecchio, F.J. Towards Cyclic Load Modeling of Reinforced Concrete. ACI Struct. J. 1999, 96, 193–202. [Google Scholar] [CrossRef]
- GB 50011-2010; Code for Seismic Design of Buildings. Ministry of Housing and Urban-Rural Development of the People’s Republic of China: Beijing, China, 2010.
- Park, R. Evaluation of ductility of structures and structural assemblages from laboratory testing. Bull. New Zealand Natl. Soc. Earthq. Eng. 1989, 22, 155–166. [Google Scholar]
Disclaimer/Publisher’s Note: The statements, opinions and data contained in all publications are solely those of the individual author(s) and contributor(s) and not of MDPI and/or the editor(s). MDPI and/or the editor(s) disclaim responsibility for any injury to people or property resulting from any ideas, methods, instructions or products referred to in the content. |
© 2025 by the authors. Licensee MDPI, Basel, Switzerland. This article is an open access article distributed under the terms and conditions of the Creative Commons Attribution (CC BY) license (https://creativecommons.org/licenses/by/4.0/).