Abstract
The aim of almost every production firm is to gain maximum profit along with customer satisfaction. The formation of imperfect products is an obvious process in a production system, which is not a good thing from a business point of view. This paper considers an inventory model for an imperfect production system. All the imperfect products are assumed to be reworkable. An investment occurs for in-process inspection to reduce the rate of formation of imperfect items. A comparison is performed with a production system without in-process inspection to demonstrate the effectiveness of the model. The study shows that the implementation of in-process inspection significantly reduces the total cost of the system as compared to a production system without in-process inspection. The results obtained show that the use of in-process inspection can reduce the total cost by up to 9.3%. Moreover, reducing the formation of defective items saves energy as well as resources. In addition, to reduce carbon emissions, a penalty is implemented on carbon emissions caused by manufacturing, reworking, disposal, and indirect emissions caused by the transportation of disposed items to the treatment facility. As everyone should now be concerned about the environment, green technology is implemented to reduce the amount of carbon emissions to some extent. A classical optimization technique is used to achieve decision variables, i.e., optimal production quantity (Q), fraction of profit invested in in-process inspection (), and green technology investment (G), such that the total cost of the system is minimized. A sensitivity analysis is performed to determine the effects of various parameters on the decision variables and total cost. Maple 18 and Mathematica 11 software are used for mathematical work and graphical representation.
Keywords:
sustainability; in-process inspection (IPI); imperfect production; green technology; carbon emissions MSC:
90B05
1. Introduction
Sustainability has become a hot topic these days. It is basically the avoidance of the depletion of natural resources. The maintenance of biodiversity and ecological balance are very important for the health of the planet. It can be defined as a long-term goal to meet the needs of economic growth with the least amount of impact on the environment. Sustainability has three aspects, which are economic, environmental, and social. In the last few decades, sustainable development has drawn the attention of countries and their governments, industrialists, and research scholars as well. During the G20 in 2023, sustainable development was one of the central topics. It can be defined as development that fulfills the needs of the present without affecting or compromising the ability of future generations to meet their needs. Thus, it can be said that it is a type of development that heads towards progress, not decline. Its main aim is to prevent the exploitation of natural resources. As natural resources are limited in nature, we have to save them for our future generations so that all can live life comfortably and all have opportunities to progress in life. Thus, sustainability is progress for all. It promotes the conservation of resources.
Production is the most important activity of any supply chain. Almost all production firms have primary operation strategies and goals to become a low-cost producer and achieve high satisfaction regarding customers’ demands. All manufacturing firms have a tendency to produce perfect-quality products, which is almost impossible in real-life situations. The formation of defective or poor-quality products is an obvious phenomenon in any production system. This can be due to either machinery error (machine breakdown or fault) or human error (labor problem, and improper surveillance of the production process) [1]. Produced defective items are reworked at a cost, called reworking cost, and sold at the same price but most often at a lesser price than a perfect one. Reworking is an important aspect in a production inventory model [2]. Some key aspects of reworking imperfect items include the following.
The first step in reworking imperfect items is to identify and segregate those products that do not meet the required quality standards. This can be achieved through visual inspection, automated quality control processes, or sampling methods. Understanding the specific defects or issues with the imperfect items is essential. This helps in determining the appropriate reworking process and resources needed to address the problems. Reworking imperfect items typically involves a set of processes aimed at fixing the identified defects. The reworking process may vary depending on the nature of the defects, but it could involve tasks such as reassembly, repair, adjustment, cleaning, or retesting. After reworking, the items should undergo a quality control process to ensure that the defects have been successfully addressed and that they now meet the required standards. Reworking imperfect items can be cost-effective if the cost of reworking is lower than the cost of producing new items. However, it is important to calculate the costs of labor, materials, and additional processing to determine its economic feasibility. To prevent future occurrences of the same defects, it is important to conduct a root cause analysis. Understanding why the defects occurred in the first place can lead to process improvements and preventive measures. Shifting of machines from an in-control state to an out-of-control state can be one of the reasons for imperfect production [3]. Reworking may require specialized skills, so it is essential to have trained personnel who can effectively perform the reworking tasks. Reworking imperfect items can introduce delays in production and may impact delivery schedules. Sometimes, it may be more cost-effective to scrap defective items rather than reworking them, especially if the defects are too severe or the reworking process is costly.
Reworking of imperfect defective products not only adds a cost but also additional use of resources in the reworking process, and, as said earlier, most of the time, reworked products have decreased value and hence are sold at lower prices in the market. A high rate of formation of defective items can be crucial to a business. As the formation of imperfect items is obvious, its rate can be decreased by using in-process inspection (IPI). As the name indicates, it is the process of inspecting the quality of a product during the manufacturing process itself. Thus, in-process inspection for manufacturing is the process to inspect at any point within the production cycle. This inspection takes place at any stage of manufacturing to check whether the product quality is being met before they are finalized to go to market or to continue to the next stage. This is very helpful to identify a misstep at an early stage, with less room for error. If an error is found at an early stage in production, it can be reset, which in turn will save resources and time in the long run.
There are several ways in which in-process inspection can contribute to increased profitability. In-process inspection can help to ensure that products or components meet the quality standards at the various stages of production. This reduces the likelihood of defects, reworking, or scrap, which can lead to cost savings by minimizing the need for expensive reworking or replacement. Catching defects early in the production process prevents the production of substandard or faulty products. This can lead to fewer customer returns, warranty claims, and associated costs, as well as a better reputation for quality, which can attract more customers. By identifying and addressing issues during production, in-process inspection can help to streamline the production processes, reduce downtime, and optimize resource utilization. This can result in higher output and lower production costs. It can prevent costly errors or deviations from product specifications, helping to minimize material wastage and the use of resources. This can translate into significant cost savings over time. Ensuring that products are manufactured in accordance with the industry regulations and standards is crucial for avoiding legal issues and fines. In-process inspection helps to maintain compliance, reducing the risk of costly legal actions or regulatory penalties. In the event of issues or deviations from the standard, in-process inspection allows for immediate corrective actions, reducing the time and costs associated with resolving problems that may become more expensive if left unaddressed. By maintaining consistent product quality and minimizing production disruptions, in-process inspection can lead to shorter lead times, which can enhance customer satisfaction and potentially lead to increased sales. Consistently delivering high-quality products can help to build a positive brand reputation and customer trust, which are essential for long-term profitability. When a business consistently produces high-quality products at competitive prices due to efficient in-process inspection, it is better positioned to compete in the market and potentially capture a larger market share. In-process inspection can also provide valuable data and feedback that can be used to continuously improve processes, product design, and overall efficiency, leading to ongoing cost savings and increased profitability.
Carbon emissions are a problem that the world has been facing in recent decades. Although from time to time many policies are implemented from different countries and their governments [4,5], emissions are increasing day by day. For many reasons, this cannot be ignored. Carbon emissions, primarily in the form of carbon dioxide (CO2), result from various human activities. These emissions have several significant impacts on public health and the global economy. Chemicals like nitrogen oxide and sulfur dioxide are exhausted by various human activities. These pollutants can lead to poor air quality, respiratory problems, and health issues, including asthma, bronchitis, and heart disease, affecting the health and well-being of communities near pollution sources. The changing climate driven by carbon emissions is linked to wildfires, floods, and droughts. These disasters can have devastating consequences on human lives, property, and agriculture. Climate change and its associated impacts, including more frequent natural disasters and loss of agricultural productivity, can have significant economic costs. These costs may be incurred through damage to infrastructure, increased healthcare expenditures, and disruptions to supply chains, among other factors. Climate change and the resulting temperature shifts disturb living things’ behavior. This can lead to habitat loss, endangerment, and extinction of numerous species. Changes in precipitation patterns and increasing temperatures can affect water availability, leading to issues like water scarcity and altered water quality, which can impact agriculture, industry, and human consumption. Climate change driven by carbon emissions can exacerbate the existing vulnerabilities in some regions, causing conflicts over resources and migrations of people from areas facing extreme environmental challenges. Vulnerable communities, particularly those with limited resources, may face disproportionate impacts from carbon emissions. Environmental justice concerns arise as these communities often bear the brunt of pollution and climate change impacts. Climate change and its associated hazards can disrupt economies by damaging infrastructure, reducing agricultural productivity, increasing insurance costs, and causing displacement of communities, which can lead to financial losses and instability [6].
Reducing carbon emissions is crucial to mitigating these impacts. International efforts are being undertaken in this direction. For example, the Paris Agreement aims to coordinate global action to address climate change by curbing carbon emissions. These actions limit global warming and its associated hazards, protecting both the environment human health. Waste reduction is also very important [7]. The above discussion shows that IPI has significant benefits in comparison to the traditional inspection process. Identifying flaws in the production process at an early stage can be useful in many ways. We have considered an imperfect production system that uses IPI. The paper aims to showcase how IPI can reduce the total cost significantly. It is assumed that the system is profitable and some fraction of the profit is used as an investment in IPI. Further, since carbon emissions represent a very large issue, the carbon emission cost is incorporated into the system.
1.1. Motivation and Objective
Dealing with imperfect items is a very challenging job for supply chain members, not just because it is associated with many additional costs but also because it uses additional resources, including energy and time. It is harmful for the market reputation of the concerned firm and, if unaddressed, will lead to demand declination of the product in the market as, if customers receive defective/imperfect products frequently, they will not buy the product the next time and will shift to another alternative/the same category product from a different company that is available in the market. Thus, an imperfect production system can lead to various disadvantages. Imperfection in the production system can result in delays and bottlenecks, lowering the overall efficiency and output. Imperfection may lead to a higher rate of defects or errors in the final product, impacting quality and customer satisfaction. Imperfect systems can struggle to handle increased production demands, limiting the company’s ability to scale up operations effectively. Inefficiencies within the production system can disrupt the supply chain, causing delays and affecting relationships with suppliers and customers. Persistent imperfections can harm a company’s reputation, affecting customer trust and future business opportunities. Companies with efficient production systems may outperform those with imperfections, giving competitors a competitive edge in the market. As already mentioned, the formation of defective/imperfect products is quite a normal and obvious phenomenon, but its rate can be decreased by using IPI so that imperfect product formation can be controlled regarding machine error or human error (such as not maintaining the composition of a product during production, poor surveillance, etc.).
Carbon emission control is a major challenge for decision makers. Different mechanisms have been provided by many researchers to limit the emissions of harmful carbon. Technologies can help with this. Green technology may prove to be helpful to decrease greenhouse gas emissions. But, determining how much to invest in this technology is a very difficult task, and this is beneficial for optimizing profit. However, several studies are described in the literature review that consider reworking of imperfect-quality items, green technology investment, etc. The total cost optimization of the manufacturer is the main goal of this research considering a reduced rate of defective item formation.
1.2. Contributions to the Field
- The formation of defective items is linked with many costs, like the reworking cost, loss of goodwill cost, transportation cost (returning from the retailer or concerned traders to the manufacturer for reworking), carbon emission cost due to this transportation, high inspection cost, storage cost of the defective products received until they are reworked, waste management cost incurred during the reworking process, and of course the additional use of resources, energy, and time. In-process inspection plays a crucial role in reducing the reworking cost by identifying and addressing issues early in the production process. Inspecting during the production process allows for the early identification of defects or issues, making it easier and more cost-effective to rectify them at this stage rather than after completion. When defects are detected early, they can be corrected promptly within the ongoing production cycle, minimizing the need for extensive reworking later on. Early detection helps to prevent minor issues from snowballing into major problems that might require significant time, resources, and energy. The implementation of in-process inspection leads to a reduction in the number of items that require reworking. Thus, in-process inspection decreases the rate of production of imperfect products and adds quality to the manufacturing system and products and decreases additional costs. This important phenomenon is studied in the model.
- Carbons emissions are very harmful for the environment. Imposing a carbon tax on industries can have several advantages, including encouraging industries to reduce their carbon emissions. This encourages companies to invest in cleaner technologies and processes, ultimately reducing their carbon footprint. By encouraging a shift towards cleaner energy sources and technologies, a carbon tax promotes environmental conservation and helps to protect the natural ecosystem, air, water, and biodiversity. Governments can generate significant revenue from carbon taxes, which can be reinvested into sustainable initiatives, renewable energy projects, public infrastructure, or can be used to subsidize clean and green technologies. Thus, penalties on carbon emissions may decrease their formation to some extent. Carbon emissions due to activities like production, reworking, and disposal are taken into account.
- Several supply chain activities contribute to carbon emissions impacting the environment. Transportation is a major factor, involving the movement of goods via trucks, ships, planes, and other vehicles powered by fossil fuels. Manufacturing processes also generate carbon emissions, particularly in energy-intensive industries. Additionally, the extraction, processing, and transportation of raw materials contribute to the carbon footprint. Warehousing and storage facilities that are often reliant on energy-intensive systems also play a role. Sustainable practices, such as optimizing transportation routes, adopting cleaner energy sources, and promoting eco-friendly manufacturing processes, are crucial for mitigating the carbon impact of these supply chain activities. Some investments have occurred to reduce carbon emissions. Apart from direct emissions, indirect emissions caused by third-party companies, such as transporting waste to their treatment facility, are included in the model.
1.3. Orientation of the Paper
The remaining research is arranged as follows. A review of the literature is included in Section 2 of this study, and notation, assumptions, model, solution methodology, and numerical are included in Section 3. Sensitivity analysis is covered in Section 4. Observation is provided in Section 5. Conclusions and future direction of research is provided in Section 6.
2. Related Literature Survey
This part of the paper includes an extensive survey of the literature to detect significant contributions in the proposed field. Some are described below.
2.1. Reworking of Defective/Imperfect Items
The reworking of imperfect products is a common practice in manufacturing and quality control to salvage defective or non-conforming products and bring them up to the required quality standards. Reworking imperfect items can help to reduce waste and save resources, ultimately improving product quality and reducing costs. Some key aspects of reworking imperfect items include the following.
The first step in reworking imperfect items is to identify and segregate products that do not meet the required quality standards. This can be conducted through visual inspection, automated quality control processes, or by sampling methods. Understanding the specific defects or issues with the imperfect items is essential. This helps in determining the appropriate reworking process and resources needed to address the problems. Reworking imperfect items typically involves a set of processes aimed at fixing the identified defects. The reworking process may vary depending on the nature of the defects, but it could involve tasks such as reassembly, repair, adjustment, cleaning, or retesting. After reworking, the items should undergo a quality control process to ensure that the defects have been successfully addressed and that they now meet the required standards. Reworking imperfect items can be cost-effective if the cost of reworking is lower than the cost of producing new items. However, it is important to calculate the costs of labor, materials, and additional processing to determine its economic feasibility. To prevent future occurrences of the same defects, it is important to conduct a root cause analysis. Understanding why the defects occurred in the first place can lead to process improvements and preventive measures. Reworking may require specialized skills, so it is essential to have trained personnel who can effectively perform the reworking tasks. Reworking imperfect items can introduce delays in production and may impact delivery schedules. Sometimes, it may be more cost-effective to scrap defective items rather than reworking them, especially if the defects are too severe or the reworking process is costly.
Reworking imperfect items is a valuable practice in many industries to salvage products that might otherwise be discarded. However, it is important to set a balance between the cost of reworking and the value of the salvaged items, as well as addressing the root causes of defects to prevent their recurrence in the future. Much work has been carried out considering reworking of imperfect items. An imperfect production inventory model was taken into account in Narang and De [8]. The writers assumed demand patterns influenced by advertising, time, and price. The model was created for decaying goods. Dey et al. [9] conducted research on the efficacy of carbon policy. Remanufacturing and multiple-period payment delays were taken into consideration. The model’s results demonstrated that investing can significantly lower carbon emissions and boost the overall supply chain profit. The study’s analytical methodology was employed to identify the answer. Additionally, it was discovered in the study that restricted carbon control is the best policy and that a trade credit policy increases the profit by up to 1.55 percent. Taleizadeh et al. [10] created the economic order quantity (EOQ) model. The researchers took into account reworking procedures, backorders, and pricing policies. Selling price, ideal lot size, and degree of ideal backorder were employed in the study as decision variables. A model for sustainable green production was created in Ahmed et al. [11]. The study focused on developing a synergic inventory model to obtain the most profit by making allowances for reworking, a multi-period delay-in-payments policy, and shortages. To manage fluctuating demand, the researchers studied variable demand. For altered objects, the writers took into account a separate holding cost. The results demonstrated how important green investments are to making the model viable and environmentally friendly. A model for managing damaged goods was created in Dey et al. [12]. The strategy intended to optimize the overall supply chain profit while minimizing waste by reworking damaged items. Discrete investments for lowering setup costs were considered in the analysis. Demand was considered to be dependent on selling price. Inspection was utilized to find defects. The model had a two-stage inspection process.
Dey et al. [13] invented a model with an automation policy to control the work regarding in-process inventory. Sarkar et al. [14] studied the model with a random defective rate. The effects of carbon along with inspection were studied. The authors considered fixed and variable transportation costs. Malik and Sarkar [15] introduced an inventory model related to multi product imperfect items. The researchers considered the reworking process for those defective items that are produced due to machine error (when a machine switches from being under control to being out of control). The authors considered the product’s warranty policies, taking into account free replacement of the product during the warranty period.
In Saxena et al. [16], the authors invented an inventory model for a production system, considering it as imperfect. Reductions in waiting time and waste were studied. The production process started from an in-control state and progressed to an out-of-control state. Guchhait et al. [17] considered a model for reduction in setup cost. Shortages had a complete backlog. By simultaneously reducing the setup costs, production run times, and process quality, the approach sought to minimize the total cost. The study took into account the random collapse of the production system from a controlled state to an uncontrolled one. Tayyab et al. [18] analyzed a cleaner multiple-stage production model. The model included a reduction in carbon emissions. There are three built-in possibilities for imperfect proportions. Situations were created using analytical optimization approaches to choose the right batch size and backorder amount.
Figure 1 outlines the amounts of papers published on reworking of imperfect products.
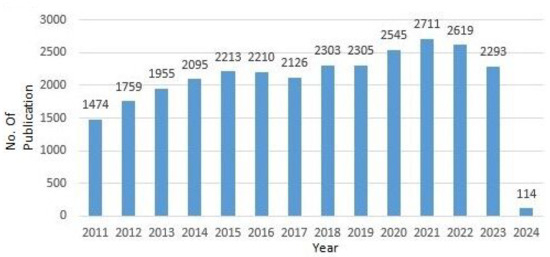
Figure 1.
Amounts of papers published on reworking of imperfect products.
2.2. Carbon Emissions
Carbon emissions refer to the release of harmful gases, especially carbon dioxide (CO2), and other toxic gases into Earth’s atmosphere, primarily due to human activities like transportation, production, etc. These emissions cause environmental issues that have wide-ranging and often detrimental effects on the environment, human societies, and ecosystems. There are several activities in the supply chain that cause carbon emissions. Carbon emissions are associated with supply chain activities, often referred to as supply chain emissions. They are generated throughout the life spans of products or their movement through the supply chain, from extraction of raw material to production, transportation, distribution, and disposal. These emissions can have a major impact on the carbon emissions of the company as a whole.
Carbon emissions are increasing day by day. It is prudent that they must be controlled. In the last few decades, the issue has drawn the attention of countries, governments, and researchers as well. In the last decade, researchers have been incorporating carbon emissions in their research. An inventory model for growing items was introduced in Rana et al. [19]. Partial backlogging was included in the model. Carbon emissions from feeding, farming, slaughtering, and handling have been considered, which are the main activities of carbon emissions for poultry farms. The shortage allowed by the model and partial backlogging were also introduced. Moon et al. [20] introduced a reliable production inventory model. The authors used green technology investment. Ruidas et al. [21] included a green subsidy in their model. Mahato et al. [22] concerned a model for perishable products. The study included fixed life time partial backordering along with carbon policies.
Daryanto and Setyanto [23] developed a production model with cap and trade regulation. The authors used direct and indirect emissions from production, material handling, waste disposal, and transportation. The study aimed to find the factors or costs on which optimal production quantity depends. In Gautam et al. [24], the authors created a model considering sustainability. Preservation technology was incorporated, and an environmental deliberation concept was added to the model. Sarkar and Guchhait [25] introduced asymmetry of information in a green supply chain. A cap and trade policy was included in the model. Khan et al. [26] developed a model considering quantity discount. Power demand was also taken into account.
Figure 2 presents the amounts of papers published on carbon emissions.
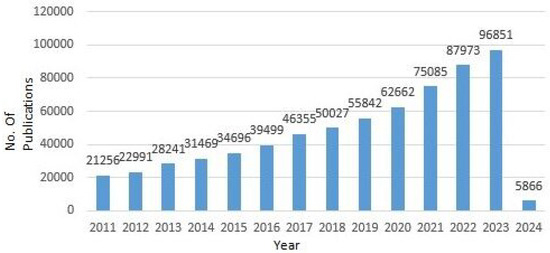
Figure 2.
Amounts of papers published on carbon emissions.
2.3. Production Inventory Models
The production inventory model, also known as the production order quantity model or the economic production quantity (EPQ) model, is a mathematical approach used in operations and inventory management to determine the optimal order quantity for a manufacturing process. This model is particularly useful for businesses that produce their own goods or components rather than just ordering finished products from suppliers. The goal of the production inventory model is to minimize the total inventory costs while meeting the demand for a product. Afshar Nadjafi [27] introduced the EPQ model, in which the setup cost is taken as a function of the production rate. He et al. [28] studied deteriorating items with multiple items and multiple aspects of market demand. In Sana [29], the authors developed a model for an imperfect production system. The model optimized the optimal product reliability and production rate. Su et al. [30] developed a model for process maintenance strategies. They included aspects of scrap return in the model. They considered multiple products. In Daryanto and Setyanto [23], the authors incorporated direct and indirect emissions. They used cap and trade regulations. Lu et al. [31] introduced a model for perishable items under the impact of carbon policies. The authors aimed to find the optimal material supply, production, and replenishment strategies and maximize the total profit. The outcome shows that fluctuation in carbon price and carbon taxes have different effects on the profit of the entire supply chain.
For breakable or deteriorating objects, Guchhait et al. [32] introduced a production quantity model. The study assumed that demand was influenced by both time and available stock. The carrying cost and rate of production were considered as time-dependent. It was considered that setup costs were somewhat influenced by output rate. Time and reliability indicators were assumed to be reliant on the production process. Using Euler–Lagrange functions, the model was addressed as an optimal control problem. In two-tier supply chain management, Sarkar et al. [33] presented a flexible production model for products like biofuels. To determine the related costs, three different continuous probabilistic deterioration functions were applied. To determine the least cost of the complete supply chain, an algebraic method was applied. The model was developed to determine the lowest cost with integer numbers of deliveries and optimal size of production lot.
Sarkar et al. [34] developed a manufacturing model. Optimal delivery policies were studied. A single-setup–multi-delivery (SSMD) policy was recommended for the centralized decision making. The development cost, cost of production, and material cost were considered to be dependent on the reliability parameter. Yadav et al. [35] studied reductions in pollution caused by by-products during the production process. Sarkar and Sarkar [36] studied a biofuel production system.
Figure 3 shows the amounts of papers published on production inventory models.
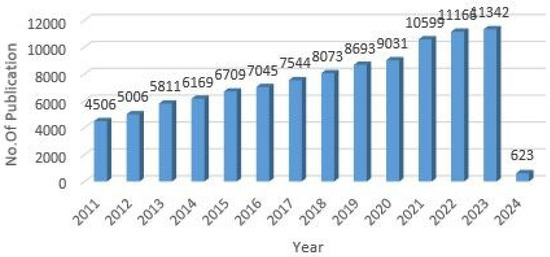
Figure 3.
Amounts of papers published on production inventory model.
2.4. Green Investment
Green investment refers to the allocation of financial resources for projects, businesses, or initiatives that have positive environmental benefits or promote sustainability. Such investment focuses on supporting activities that contribute to the transition to a low-carbon and environmentally friendly economy. Green investments can include funding renewable energy projects, sustainable infrastructure, energy-efficient technologies, and environmentally responsible businesses. Green investments play a crucial role in addressing climate change and promoting a more sustainable and resilient global economy. The primary goal of green investment is to introduce environmental concerns and contribute to a more enduring and eco-friendly future. There are various types of green investments. Renewable energy includes investing in solar, wind, hydropower, and other forms of renewable energy production. Energy efficiency includes supporting projects and technologies that reduce energy consumption and improve efficiency in buildings, transportation, and industries. Clean technology is investing in companies that develop and produce environmentally friendly technologies and products. Sustainable agriculture is supporting agriculture practices that focus on environmental sustainability, reduce resource consumption, and minimize negative environmental impacts. There is also investing in bonds issued by governments or organizations for environmentally beneficial projects, such as clean energy or conservation initiatives. The adoption of green technology offers numerous benefits for both the environment and society. Firstly, it contributes to environmental sustainability by reducing the carbon footprint and minimizing resource depletion. Green technologies often lead to increased energy efficiency, lowering operational costs and dependence on finite resources. Additionally, these technologies frequently promote innovation, driving economic growth and creating new job opportunities in the emerging green sectors. Improved air and water quality, enhanced public health, and the mitigation of climate change impacts are other significant advantages that are associated with the widespread implementation of green technology. Overall, the use of green technology not only addresses environmental challenges but also fosters a more sustainable and resilient future for communities and industries. Green investment plays a vital role in addressing environmental challenges, promoting sustainability, and transitioning to a more eco-friendly and resilient economy. It has become an increasingly popular approach as more investors recognize the importance of balancing financial returns with social and environmental responsibility. As we are going through an era of environmental crisis, sustainability is the need of the time. Green technology has become very important these days. Greener alternatives must be explored for the health of the environment and Earth. Green technology has been drawing attention in recent years. Researchers are incorporating this into their models. Paramati et al. [37] investigated the role of green technology and financial aspects depending on carbon emissions. Sana [38] included competition in price between eco-friendly and non eco-friendly products. Subsidy and tax implementation by governments were included in the model. In Datta [39], the authors studied how investments in green technology might affect a production inventory model. The model was carried forward with a selling price demand pattern. A discount policy was discussed regarding wholesale customers. The concept of defective items produced was also included. Shah et al. [40] discussed a production inventory model for perishable products. They considered demand as a function of average consumption by time-dependent diabetic individuals. Preservation technology was used to keep the perishable products in a good condition. Carbon emissions due to transportation, production, and storage were considered. To keep the carbon emissions under control, green investments were implemented in the model.
Figure 4 shows the amounts of papers published on green investment.
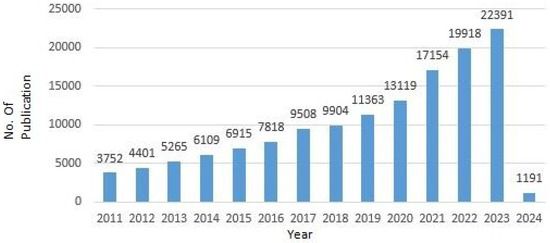
Figure 4.
Amounts of papers published on green investment.
2.5. Sustainability
Sustainability is important for several reasons. It ensures the well-being of future generations by preserving natural resources and ecosystems. It addresses issues of global concern, such as biodiversity loss, climate change, and pollution. In addition, sustainable practices can play an important role in cost savings. It can be helpful to increase efficiency and innovation in various industries. Ultimately, embracing sustainability promotes a healthier planet, social equity, and long-term economic viability. The future of sustainability holds promising developments. We are likely to see increased adoption of renewable energy sources, advancements in green technologies, circular economy practice, and a growing focus on sustainable urban planning. Innovations in sustainable agriculture and water reduction will also play a crucial role. Moreover, there will be a greater emphasis on corporate sustainability, with businesses integrating social, environmental, and governance factors into their strategies. Collaboration among governments, businesses, and communities will be vital in achieving the global sustainability goals and promising a more sustainable future for everyone.
Sustainability is the need of the hour due to several urgent challenges faced by the world. Changes in the climate, biodiversity loss, natural resource exhaustion, pollution, and social inequality are at critical levels. Sustainable practices are essential to migrate issues like the climate crisis, resource depletion, waste management, biodiversity loss, economic stability, and social equity. Sustainable inventory models focus on minimizing the environmental impact by optimizing stock levels, reducing waste, and promoting eco-friendly sourcing. These models often incorporate factors like carbon emissions, resource usage, and sustainability goals into traditional inventory management strategies. These models focus on a balance between economic efficiency and ecological responsibility.
A great deal of research has been carried out with sustainability as the central focus. A sustainable order quantity model was created in Bouchery et al. [41]. The study reformulated the EOQ model. The problem considered was taken as multi-objective. The study was conducted on the sustainable model’s multi-echelon extension. Analytical solutions were defined, and the efficiency of various carbon emission regulation schemes was investigated in order to plan a sustainable supply chain. Biuki et al. [42] studied a multi-objective programming model. The study addressed the issue of sustainability and incorporated the model’s routing, inventory control planning, and decisions. The outcome of the research showed that manufacturing sectors tend to decentralize when the goal of sustainability is approached. An inventory model was created in Shah and Shroff [43] to reduce retailer total expenses for fixed-life products. The model was implemented with time-dependent trapezoidal demand. The trade credit concept was used. The dairy, grocery, and processed fruit businesses can use this approach. In a closed-loop supply chain, Yoo and Cheong [44], Bhunia et al. [45] examined decisions regarding inventory and refurbishing tactics, considering how supply chain structures affect production processes. The model sought to increase the refurbishing rate while decreasing scrap expenses. Sarkar and Bhunia [46] considered manufacturing–remanufacturing and green investment along with sustainability. In Habib et al. [47], the authors studied a fat-based biodiesel supply chain. Tayyab and Sarkar [48] included sustainable supplier selection under textile supply chain management.
Figure 5 shows the amounts of papers published on sustainability.
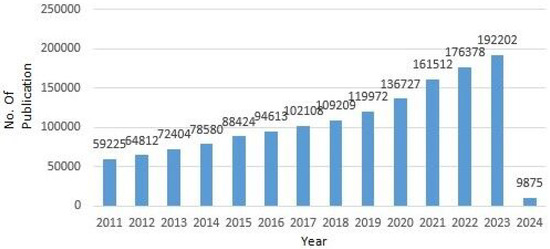
Figure 5.
Amounts of papers published on sustainability.
Table 1 shows the contributions of the researchers in this field.

Table 1.
Different author contributions.
Research Gaps
- Almost all the studies regarding the reworking of imperfect-quality items were developed with a fixed rate of defective product formation [8,9]. A reduction in the rate of formation of defective items with investment in IPI is very rare in the literature. A production inventory model that considers carbon emissions and investment in green technology with a reduced rate of imperfect item formation or investment in IPI to reduce the rate of formation of defective items has not been considered in any study so far.
- Carbon emissions are generated by many supply chain activities. But, there are many sources that generate carbon indirectly. This aspect has been insufficiently studied.
Figure 6 presents the flow of the study.
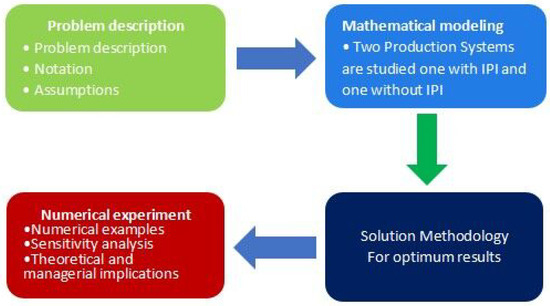
Figure 6.
Flow of the study.
3. Problem Definition, Notation, and Assumptions
This particular section discusses in brief the problem formulated, notation used to formulate the problem, and important assumptions made to validate the model.
3.1. Problem Definition
This study considers a production or manufacturing inventory model. The produced items are assumed to be of imperfect quality, which are reworked. Here, it is considered that manufacturers invest some fraction of profit in IPI to decrease the rate of formation of imperfect-quality items in the process of production. P is the rate of production and T is the cycle time. Production cycle is shown in Figure 7.
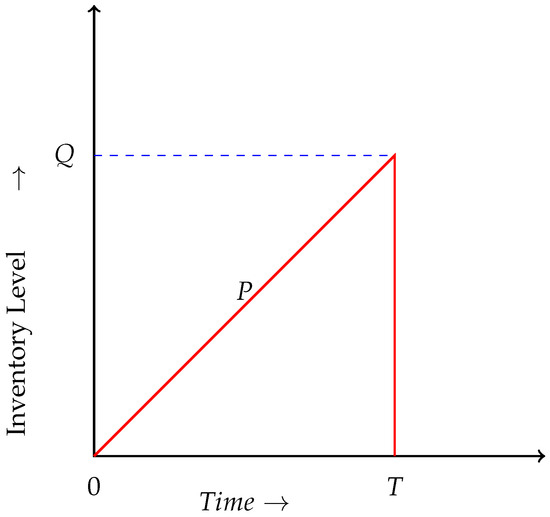
Figure 7.
Production inventory level per cycle.
3.2. Notations
Table 2 presents the notations used in the model.
Table 2.
Notation.
3.3. Assumptions
Study is performed under following assumptions:
- (a)
- Shortage is not considered.
- (b)
- To decrease rate of formation of defective items, IPI is used. The decrease in rate of defective item production is , where and .
- (c)
- Selling price of product is greater than production cost.
- (d)
- It is assumed that disposal cost is fixed and fixed amount of carbon is emitted in transporting disposed items to treatment facility.
- (e)
- All defective/imperfect units are assumed to be reworkable.
3.4. Mathematical Expression of the Model
- Manufacturer’s Cost
Manufacturer’s total cost is the sum of setup cost, production cost, holding cost, disposal cost, IPI cost, reworking cost, and carbon emissions cost and is calculated as follows.
- Setup Cost
It can be defined as the cost associated with preparing a manufacturing or production line for a new batch or production run. The cost incurred each time there is a transition from producing one type of product to another or after each cycle time. It includes all the expenses for production preparation and is given by
- Production Cost
Includes total expenses by a production firm in the process of manufacturing goods or delivering services. It includes all thee costs associated with producing a certain quantity of output within a specific time frame. Key components of production cost include raw material and components, labor costs, energy, and utilities.
It can be considered as one of the most important cost for any manufacturing system and is given by
- Holding Cost
Carrying cost is another name for it. It is an essential cost component in inventory modeling. It represents the cost linked with keeping and maintaining inventory over a time interval. The purpose of considering holding cost is to strike a balance between carrying enough inventory to complete demand and reducing the overall expenses of keeping extra inventory on hand. It typically includes expenses such as warehousing costs, insurance, depreciation, and security.
Inventory holding cost is given by
- Disposal Cost
It is the price concerning disposal of or managing waste or materials at the end of their useful life or production cycle. Solid waste produced during production and reworking process and its disposal is associated with a cost that is given below.
- In-Process Inspection (IPI) Cost
It refers to the expenses associated with assessing and evaluating products or components during various stages of the manufacturing or production process to ensure quality, including labor, equipment, documentation, and any other resources needed for inspection, testing, and monitoring during production process. Reducing defects through effective IPI can lead to overall cost savings by minimizing reworking and improving product quality.
The cost is calculated as
- Reworking Cost
It is the expenses incurred to rectify or correct products that do not meet desired quality during the manufacturing or production process. The cost may consist of material cost, equipment cost, labor cost, and quality control cost. Thus, reworking of imperfect-quality items is associated with reworking cost and is given by
- Carbon Emissions Cost
It is also known as a carbon price or carbon tax. It is basically financial charge imposed on the release of carbon dioxide and other harmful gases in the environment. The primary goal of such cost is to motivate businesses, industries, and individuals to decrease their carbon emissions such that climate change is mitigated and sustainable practices are adopted.
- Carbon emissions costs due to supply chain activities like production, reworking, disposal, and indirect emissions from transportation of disposal to treatment facility are considered and given by
Total cost is given by
3.5. Case 2: Production System Without IPI
In this case, this study considers a production inventory model without IPI. Total expense is taken as sum of setup cost, disposal cost, reworking cost, holding cost, green technology cost, and carbon emission cost and is given by
3.6. Solution Methodology
Classical optimization technique (COT) refers to traditional mathematical and analytical method. With this approach, the optimal solution to a problem can be found, usually one that involves maximizing or minimizing an objective function while satisfying certain constraints. Some classical optimization techniques include quadratic programming, branch and cut, integer and mixed programming. Here, the classical optimization technique is used to find three unknown variables, Q, G, and . Differentiating partially regarding Q, G, and and equating to zero, one can obtain
Optimum Values for Case 2
Similarly, for Case 2 to find optimum values of decision variables Q and G, differentiating partially with respect to Q and G and equating to zero, one can obtain
Input values of parameters are given in Table 3. Graphs are used to show convexity of cost functions regarding decision variables.
Table 3.
Input values of parameters.
Optimum values are given by Table 4.
Table 4.
Optimum values for Case 1.
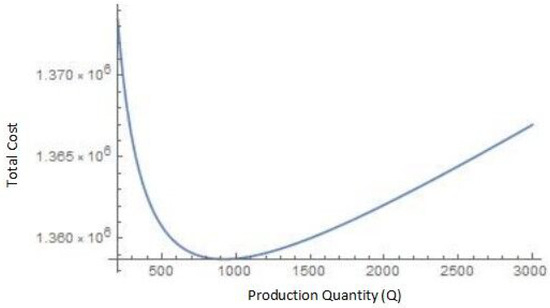
Figure 8.
Convexity of total cost with respect to Q.
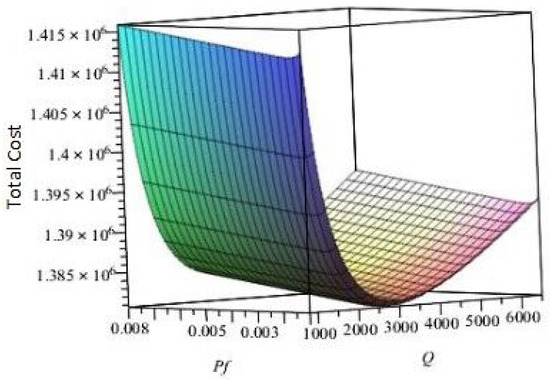
Figure 9.
Convexity of total cost versus Q versus .
3.7. Numerical Analysis for Case 2
Table 5.
Optimum values for Case 2.
4. Sensitivity Analysis
This section performs a sensitivity analysis by varying various cost parameters to explore their effect on model outcomes. Behavior of cost parameters such as reworking cost (), setup cost (S), holding cost (), production cost (), and cost of carbon emissions (), along with rate of formation of defective items (r), is studied on decision variables and total cost. Sensitivity analysis for these parameters is performed for , ,, and and included in Table 6. Figure 10 is graphical representation of outcomes of Table 6.
Table 6.
Sensitivity analysis for Case 1 (production system with IPI).
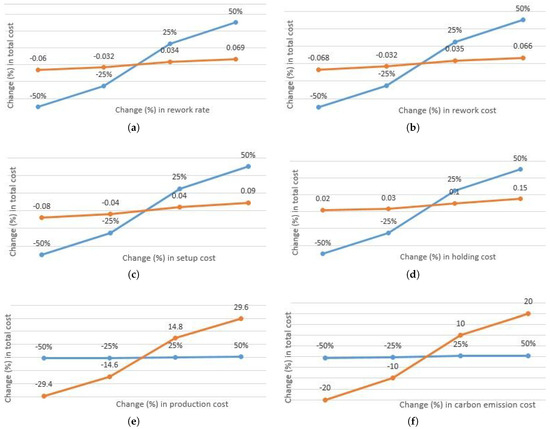
Figure 10.
Percentage changes in total cost versus different parameter percentages for Case 1 where orange line represents total cost change while blue line represents change in parameter. Where (a–f) represent change in total cost with respect to parametes rework rate, rework cost, setup cost, holding cost, production cost and carbon emissions cost respectively.
Sensitivity Analysis for Case 2
Table 7 includes information for r and as these costs are more sensitive in comparison to all other costs. Figure 11 includes a graphical representation of Table 7.
Table 7.
Sensitivity analysis for Case 2 (production system without IPI).
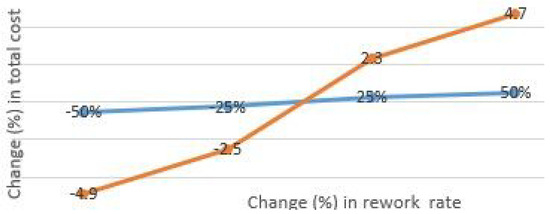
Figure 11.
Percentage changes in total cost versus parameter values of r and for Case 2 where orange line represents total cost change and blue line represents parameter change.
It is evident from Table 6 and Table 7 that variations in r and do not affect total cost in Case 1 as much as in Case 2. In Case 2, even a small increase in r increases total cost by a great deal. Similarly, a small increase in raises the total cost significantly. However, in Case 1, it is clear that both parameters are not as sensitive as in Case 2.
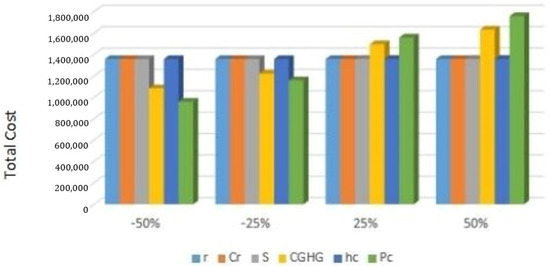
Figure 12.
The behavior of total cost for different cost parameters for production system with IPI.
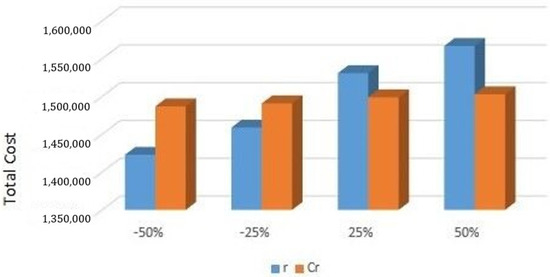
Figure 13.
The behavior of total cost for cost parameters r and for production system without IPI.
5. Observations
- Production cost is the most critical cost for production systems. It is the most sensitive cost. An increase in increases the expense of the system with a margin. It is advisable that decision makers should formulate certain strategies to reduce the sensitivity of production costs, like outsourcing or offshoring to regions with lower labor or operational costs. Also, a culture of continuous improvement within the organization should be adopted to address cost saving opportunity regularly. It is necessary to mitigate risk by having contingency plans for cost fluctuations in raw material, currencies, or other external factors that impact production costs. Investment in energy-efficient processes and technologies may decrease production costs. From Table 6, it is clear that and G decrease with a decrease in . However, Q remains as it is.
- One of the most sensitive costs is the holding cost. As expected, an increase in holding cost increases the total expenses of the system. It is advisable to keep the requisite amount only. To reduce holding cost’s dominance, strategies like Just-In-Time (JIT) may be helpful by reducing excess stock and carrying costs. Optimizing the warehouse layout and implementing efficient picking, storing methods, and utilizing space effectively may decrease holding costs. Collaboration closely with suppliers to ensure timely deliveries and avoid overstock situations may prove to be helpful to decrease holding costs. With the increase in , Q decreases. This can be justified by the fact that more units produced will contribute to a higher holding cost. However, and G increase as increases.
- From Table 7, it is clear that the model is extremely sensitive towards the rate of defective/imperfect item production, i.e., r and reworking cost . The total cost increases with a large margin with increases in r and . However, Q and G are independent regarding variations in both parameters.
- Setup cost can be considered as one of the most sensitive costs for any production industry. With the increase in setup cost, both production quantity Q and total cost increase. Green technology investment decreases but by a very small amount. Setup cost has no effect on .
- As is obvious, with increases in r and , also increases. This is due to the fact that, as r increases, more has to be invested in IPI.
- is a highly sensitive cost parameter. An increase in increases the complete expense of the system with a great margin. It is advisable that decision makers should implement sustainable and greener alternatives.
- With the increase in , all three decision variables, i.e., Q, G, and , increase.
- Total cost is highly sensitive for and r for production systems without IPI in comparison to production systems with IPI. It is observed that even small increases in and r increase the total cost of the system without IPI by a great deal. Decision makers are advised to implement some strategies to reduce r, which in turn will reduce the reworking cost. It is important for decision makers that the root cause should be analyzed. Implementing a robust quality control process to catch errors early in the production or service delivery process may reduce the need for reworking. Training and skill development of employees may reduce the chances of errors as they perform their tasks efficiently. Feedback systems should be created to gather insights from consumers and internal processes. This information may help in identifying areas for improvement and reducing reworking. A culture of embracing continuous improvement to encourage employees to suggest and implement changes can prevent reworking in the future.
- An increase in increases the total cost. It is advisable to use greener ways to perform all activities. It is high time that renewable energy should be focused and alternate ways should be explored to get the job done.
- The most important observation is that IPI can be very important in making a business more profitable by helping to identify and address issues early in the production or manufacturing process. This is because IPI reduces the production of defective goods, reducing reworking costs, minimizing waste, and ensuring operational efficiency, all of which contribute to higher product quality and increased profitability.
Managerial Insights
There are very few production industries that are flawless. The formation of imperfect items with major/minor flaws is very obvious. Sometimes, these imperfect items are not reworkable and hence disposed of, which is a very critical scenario from a business point of view as it affects the profit margin of the concerned firm. On the other hand, some industries’ imperfect items are reworkable. The present model can be helpful for production industries with high rates of formation of imperfect items. From the above discussion, it is clear that even a small increase in the rate of defective item production and reworking cost can increase the total cost by a large amount. Hence, to gain more profit, it is very necessary that the production system is flawless or has a decreased rate of formation of defective items. IPI can play a major role for industries that have high or very high rates of defective product formation. Hence, the model can aid industries with defective production. In-process inspection can be valuable in various industries. In-process inspection refers to the examination and evaluation of a product or process at various stages of production. One of the primary advantages of in-process inspection is the early detection of defects or deviations from the quality standards. This allows for timely correction of issues before they escalate, reducing the likelihood of producing defective products. Identifying and correcting defects early in the production process can lead to significant cost savings. This information can be used to identify opportunities for process optimization and improvement. In-process inspection contributes to the overall product quality by ensuring that each step of the production process meets the quality standards. This can result in a higher level of consistency and reliability in the final product. IPI provides real-time visibility into the production process. This allows for quick responses to any deviations from the established quality parameters, minimizing the chances of producing defective or non-compliant products. In many industries, there are strict quality standards and regulations that must be adhered to.
There are examples of some industries that use in-process inspection or in which in-process inspection can be useful. Manufacturing industries like automobiles, aerospace electronics, consumer goods, and industrial equipment manufacturing can use IPI. Pharmaceutical companies benefit from in-process inspection to ensure quality and compliance during drug manufacturing. It can be useful to ensure food safety and quality by monitoring the processes during food production. It helps to maintain consistent quality and adherence to specifications during the textile and garment manufacturing process. IPI is useful for monitoring and maintaining quality standards in chemical manufacturing. It is essential for ensuring safety and quality during the production of medical devices. IPI can play a major role for such industries to make them flawless. In the electronics industry, in-process inspection ensures the quality and functionality of electronic components and devices during the manufacturing process. As it is very critical for maintaining precision and quality in metalworking and fabrication processes, in-process inspection can play an important role. It can be very helpful for quality control in the production of plastic products. In-process inspection can be applied to monitor construction materials and ensure compliance with the safety standards.
6. Conclusions
IPI involves examining and evaluating a product or process at various stages of production to ensure that the quality standards have been met before final completion. It is a quality control method that is used in manufacturing to assess and ensure the quality of a product during various stages of production. Instead of waiting until the final stage to identify defects, this approach involves examining the product at key points throughout the manufacturing process. Thus, manufacturers can detect and address issues early on, minimizing the chances of defects accumulating and ensuring that the final product meets the quality standards. The primary aim of every business is to lead in the market and obtain increasing profit. All production systems aim to enhance profit. Due to any reason (machine error or human error), imperfect items are produced in the manufacturing process. In this direction, a production inventory model is introduced with the consideration of both perfect and imperfect products. Perfect items are ready to be shipped in the marketplace or to concerned dealers, while imperfect items are first reworked to achieve the original item quality and then sold. The production of more imperfect products implies lesser profit. From the results, it is clear that even a small rise in the rate at which defective items are produced adds a significant amount in terms of the reworking cost, and, hence, the overall expenses increase significantly. Thus, it is clear that a production system (with inspection after manufacturing) has quite a high total cost compared to a production system with in-process inspection. Thus, one can say that IPI reduces the total cost by a significant amount. Thus, it is a wise decision to implement IPI in any production system that is prone to defective product formation. But, it is simultaneously important that, to fully achieve the benefits of in-process inspection, businesses invest in appropriate inspection tools, training for their personnel, and robust quality control processes. Moreover, it is essential to find a middle ground between inspection costs and the potential cost savings and quality improvements that can be achieved through in-process inspection. The conclusions of the study can be summarized as follows:
- As a primary objective of every business or firm is to optimize the total cost, IPI can play a significant role to cut down the total cost of a production system. Implementing IPI can reduce the total cost by up to 9.3%.
- As the rate of formation of defective items increases, the total cost increases by a large margin r; i.e., the rate of formation of defective items is a very sensitive parameter. So, it is advised for decision makers to implement a proper strategy in this direction.
- As an increase in increases the total cost, it is high time to switch to greener alternatives. It will not only reduce the total cost but also add environmental value.
The next part provides some limitations of this paper and potential future research directions of the proposed model.
One direct approach is to extend the model for two-, three-, or multi-echelon systems. When a new product in the same category is introduced to the marketplace that is either cheaper or more attractive than an older one or advances occur in technology, the demand for the older one decreases and, of course, the demand for the newly launched product will also go up. So, demand varies with time, and, hence, this can be incorporated into the model. The production system can be considered in a multi-stage manner. In each different stage, the defective items and waste proportions can be different. Considering that this model is expandable to a multi-stage production system, waste management, quantity, and discount can be incorporated into the model. The model can be studied with different demand patterns.
Author Contributions
Methodology, Software, S.Y., S.P. and M.S.; Formal analysis, Funding acquisition, M.S. and Y.-H.A.; Resources, Investigation, S.P. and M.S.; Writing—original draft, Data curation, S.Y.; Writing—review & editing, S.Y. and M.S.; Visualization, J.-H.M. All authors have read and agreed to the published version of the manuscript.
Funding
This research received no external funding.
Data Availability Statement
The original contributions presented in this study are included in the article.
Conflicts of Interest
The authors declare no conflicts of interest.
References
- Wang, J.; Luo, L.; Mu, G.; Ma, Y.; Ni, C. Joint optimization of quality control and maintenance policy for a production system with quality-dependent failures. Expert Syst. Appl. 2025, 272, 126800. [Google Scholar]
- Jain, M.; Indoria, H.; Chaudhary, A.; Singh, P. Effects of memory on inventory control and pricing policy for imperfect production with rework process. RAIRO-Oper. Res. 2025, 59, 77–99. [Google Scholar]
- Mondal, S.K.; Khara, B. Imperfect production inventory system considering effects of production reliability. In Fuzzy Optimization, Decision-Making and Operations Research: Theory and Applications; Springer International Publishing: Cham, Switzerland, 2023; pp. 587–617. [Google Scholar]
- Rani, N.; Maheshwari, S.; Sharma, M.K. A sustainable inventory model: Integrating eco-packaging, advertising, and pricing strategies under carbon tax policies. Int. J. Syst. Assur. Eng. Manag. 2025. early access. [Google Scholar]
- Jauhari, W.A.; Sakti, C.T.C.; Hisjam, M.; Hishamuddin, H. A sustainable circular economic supply chain model with green production, delays in payment, and carbon tax regulation. J. Clean. Prod. 2025, 435, 145008. [Google Scholar]
- Rana, K.; Singh, S.R. The impact of machine breakdowns and shortages on integrated inventory model under carbon emission scenarios. OPSEARCH 2025. early access. [Google Scholar] [CrossRef]
- Sarkar, B.; Debnath, A.; Chiu, A.S.; Ahmed, W. Circular economy-driven two-stage supply chain management for nullifying waste. J. Clean. Prod. 2022, 339, 130513. [Google Scholar]
- Narang, P.; De, P.K. An imperfect production-inventory model for reworked items with advertisement, time and price dependent demand for non-instantaneous deteriorating item using genetic algorithm. Int. J. Math. Oper. Res. 2023, 24, 53–77. [Google Scholar] [CrossRef]
- Dey, B.K.; Datta, A.; Sarkar, B. Effectiveness of carbon policies and multi-period delay in payments in a global supply chain under remanufacturing consideration. J. Clean. Prod. 2023, 402, 136539. [Google Scholar]
- Taleizadeh, A.A.; Kalantari, S.S.; Cardenas-Barrón, L.E. Pricing and lot sizing for an EPQ inventory model with rework and multiple shipments. Top 2016, 24, 143–155. [Google Scholar]
- Ahmed, W.; Moazzam, M.; Sarkar, B.; Rehman, S.U. Synergic effect of reworking for imperfect-quality items with the integration of multi-period delay-in-payment and partial backordering in global supply chains. Engineering 2021, 7, 260–271. [Google Scholar]
- Dey, B.K.; Bhuniya, S.; Sarkar, B. Involvement of controllable lead time and variable demand for a smart manufacturing system under a supply chain management. Expert Syst. Appl. 2021, 184, 115464. [Google Scholar] [CrossRef]
- Dey, B.K.; Pareek, S.; Tayyab, M.; Sarkar, B. Autonomation policy to control work-in-process inventory in a smart production system. Int. J. Prod. Res. 2021, 59, 1258–1280. [Google Scholar] [CrossRef]
- Sarkar, B.; Dey, B.K.; Pareek, S.; Sarkar, M. A single-stage cleaner production system with random defective rate and remanufacturing. Comput. Ind. Eng. 2020, 150, 106861. [Google Scholar] [CrossRef]
- Malik, A.I.; Sarkar, B. Disruption management in a constrained multi-product imperfect production system. J. Manuf. Syst. 2020, 56, 227–240. [Google Scholar] [CrossRef]
- Saxena, N.; Sarkar, B.; Singh, S.R. Selection of remanufacturing/production cycles with an alternative market: A perspective on waste management. J. Clean. Prod. 2020, 245, 118935. [Google Scholar] [CrossRef]
- Guchhait, R.; Dey, B.K.; Bhuniya, S.; Ganguly, B.; Mandal, B.; Bachar, R.K.; Sarkar, B.; Wee, H.; Chaudhuri, K. Investment for process quality improvement and setup cost reduction in an imperfect production process with warranty policy and shortages. RAIRO-Oper. Res. 2020, 54, 251–266. [Google Scholar] [CrossRef]
- Tayyab, M.; Habib, M.S.; Jajja, M.S.S.; Sarkar, B. Economic assessment of a serial production system with random imperfection and shortages: A step towards sustainability. Comput. Ind. Eng. 2022, 171, 108398. [Google Scholar] [CrossRef]
- Rana, K.; Singh, S.R.; Saxena, N.; Sana, S.S. Growing items inventory model for carbon emission under the permissible delay in payment with partially backlogging. Green Financ. 2021, 3, 153–174. [Google Scholar] [CrossRef]
- Moon, I.; Yun, W.Y.; Sarkar, B. Effects of variable setup cost, reliability, and production costs under controlled carbon emissions in a reliable production system. Eur. J. Ind. Eng. 2022, 16, 371–397. [Google Scholar] [CrossRef]
- Ruidas, S.; Seikh, M.R.; Nayak, P.K.; Tseng, M.L. An interval-valued green production inventory model under controllable carbon emissions and green subsidy via particle swarm optimization. Soft Comput. 2023, 27, 9709–9733. [Google Scholar]
- Mahato, F.; Choudhury, M.; Mahata, G.C. Inventory models for deteriorating items with fixed lifetime, partial backordering and carbon emissions policies. J. Manag. Anal. 2023, 10, 129–190. [Google Scholar]
- Daryanto, Y.; Setyanto, D. Production Inventory Optimization Considering Direct and Indirect Carbon Emissions under a Cap-and-Trade Regulation. Logistics 2023, 7, 16. [Google Scholar] [CrossRef]
- Gautam, P.; Maheshwari, S.; Kausar, A.; Jaggi, C.K. Sustainable retail model with preservation technology investment to moderate deterioration with environmental deliberations. J. Clean. Prod. 2023, 390, 136128. [Google Scholar]
- Sarkar, B.; Guchhait, R. Ramification of information asymmetry on a green supply chain management with the cap-trade, service, and vendor-managed inventory strategies. Electron. Commer. Res. Appl. 2023, 60, 101274. [Google Scholar]
- Khan, M.A.A.; Cárdenas-Barrón, L.E.; Treviño-Garza, G.; Céspedes-Mota, A.; de Jesús, Loera-Hernández, I.; Smith, N.R. Inventory model for livestock farm under quantity discount, power demand, prepayment and carbon rules. J. Clean. Prod. 2024, 441, 140642. [Google Scholar]
- Afshar-Nadjafi, B. An EPQ model with unit production cost and set-up cost as functions of production rate. Model. Simul. Eng. 2013, 2013, 727685. [Google Scholar]
- He, Y.; Wang, S.Y.; Lai, K.K. An optimal production-inventory model for deteriorating items with multiple-market demand. Eur. J. Oper. Res. 2010, 203, 593–600. [Google Scholar]
- Sana, S.S. An economic production lot size model in an imperfect production system. Eur. J. Oper. Res. 2010, 201, 158–170. [Google Scholar]
- Su, R.H.; Weng, M.W.; Yang, C.T.; Hsu, C.H. Optimal Circular Economy and Process Maintenance Strategies for an Imperfect Production Inventory Model with Scrap Returns. Mathematics 2023, 11, 3041. [Google Scholar] [CrossRef]
- Lu, C.J.; Gu, M.; Lee, T.S.; Yang, C.T. Impact of carbon emission policy combinations on the optimal production-inventory decisions for deteriorating items. Expert Syst. Appl. 2022, 201, 117234. [Google Scholar]
- Guchhait, P.; Maiti, M.K.; Maiti, M. Production-inventory models for a damageable item with variable demands and inventory costs in an imperfect production process. Int. J. Prod. Econ. 2013, 144, 180–188. [Google Scholar]
- Sarkar, B.; Mridha, B.; Pareek, S. A sustainable smart multi-type biofuel manufacturing with the optimum energy utilization under flexible production. J. Clean. Prod. 2022, 332, 129869. [Google Scholar]
- Sarkar, B.; Tayyab, M.; Kim, N.; Habib, M.S. Optimal production delivery policies for supplier and manufacturer in a constrained closed-loop supply chain for returnable transport packaging through metaheuristic approach. Comput. Ind. Eng. 2019, 135, 987–1003. [Google Scholar]
- Yadav, D.; Singh, R.; Kumar, A.; Sarkar, B. Reduction of Pollution through Sustainable and Flexible Production by Controlling By-Products. J. Environ. Inform. 2022, 40, 106. [Google Scholar]
- Sarkar, M.; Sarkar, B. How does an industry reduce waste and consumed energy within a multi-stage smart sustainable biofuel production system? J. Clean. Prod. 2020, 262, 121200. [Google Scholar]
- Paramati, S.R.; Mo, D.; Huang, R. The role of financial deepening and green technology on carbon emissions: Evidence from major OECD economies. Financ. Res. Lett. 2021, 41, 101794. [Google Scholar]
- Sana, S.S. Price competition between green and non green products under corporate social responsible firm. J. Retail. Consum. Serv. 2020, 55, 102118. [Google Scholar]
- Datta, T.K. Effect of green technology investment on a production-inventory system with carbon tax. Adv. Oper. Res. 2017, 2017, 834839. [Google Scholar]
- Shah, N.H.; Patel, D.G.; Shah, D.B.; Prajapati, N.M. A sustainable production inventory model with green technology investment for perishable products. Decis. Anal. J. 2023, 8, 100309. [Google Scholar]
- Bouchery, Y.; Ghaffari, A.; Jemai, Z.; Dallery, Y. Including sustainability criteria into inventory models. Eur. J. Oper. Res. 2012, 222, 229–240. [Google Scholar]
- Biuki, M.; Kazemi, A.; Alinezhad, A. An integrated location-routing-inventory model for sustainable design of a perishable products supply chain network. J. Clean. Prod. 2020, 260, 120842. [Google Scholar]
- Shah, B.J.; Shroff, A. Inventory model for sustainable operations of fixed-life products: Role of trapezoidal demand and two-level trade credit financing. J. Clean. Prod. 2022, 380, 135093. [Google Scholar]
- Yoo, S.H.; Cheong, T. Inventory model for sustainable operations of a closed-loop supply chain: Role of a third-party refurbisher. J. Clean. Prod. 2021, 315, 127810. [Google Scholar]
- Bhuniya, S.; Pareek, S.; Sarkar, B. A supply chain model with service level constraints and strategies under uncertainty. Alex. Eng. J. 2021, 60, 6035–6052. [Google Scholar]
- Sarkar, B.; Bhuniya, S. A sustainable flexible manufacturing–remanufacturing model with improved service and green investment under variable demand. Expert Syst. Appl. 2022, 202, 117154. [Google Scholar]
- Habib, M.S.; Tayyab, M.; Zahoor, S.; Sarkar, B. Management of animal fat-based biodiesel supply chain under the paradigm of sustainability. Energy Convers. Manag. 2020, 225, 113345. [Google Scholar]
- Tayyab, M.; Sarkar, B. An interactive fuzzy programming approach for a sustainable supplier selection under textile supply chain management. Comput. Ind. Eng. 2021, 155, 107164. [Google Scholar]
- Jauhari, W.A.; Adam, N.A.F.P.; Rosyidi, C.N.; Pujawan, I.N.; Shah, N.H. A closed-loop supply chain model with rework, waste disposal, and carbon emissions. Oper. Res. Perspect. 2020, 7, 100155. [Google Scholar]
- Jauhari, W.A. Sustainable inventory management for a closed-loop supply chain with energy usage, imperfect production, and green investment. Clean. Logist. Supply Chain 2022, 4, 100055. [Google Scholar]
- Gautam, P.; Maheshwari, S.; Jaggi, C.K. Sustainable production inventory model with greening degree and dual determinants of defective items. J. Clean. Prod. 2022, 367, 132879. [Google Scholar]
- Priyan, S.; Mala, P.; Palanivel, M. A cleaner EPQ inventory model involving synchronous and asynchronous rework process with green technology investment. Clean. Logist. Supply Chain 2022, 4, 100056. [Google Scholar]
- Barman, H.; Roy, S.K.; Sakalauskas, L.; Weber, G.W. Inventory model involving reworking of faulty products with three carbon policies under neutrosophic environment. Adv. Eng. Inform. 2023, 57, 102081. [Google Scholar]
- Mishra, M.; Hota, S.K.; Ghosh, S.K.; Sarkar, B. Controlling waste and carbon emission for a sustainable closed-loop supply chain management under a cap-and-trade strategy. Mathematics 2020, 8, 466. [Google Scholar] [CrossRef]
- Mridha, B.; Pareek, S.; Goswami, A.; Sarkar, B. Joint effects of production quality improvement of biofuel and carbon emissions towards a smart sustainable supply chain management. J. Clean. Prod. 2023, 386, 135629. [Google Scholar]
- Das, S.; Mandal, G.; Manna, A.K.; Shaikh, A.A.; Bhunia, A.K. Effects of emission reduction and rework policy in a production system of green products: An interval valued optimal control theoretic approach. Comput. Ind. Eng. 2023, 179, 109212. [Google Scholar]
- Jauhari, W.A.; Pujawan, I.N.; Suef, M. A cooperative manufacturer-retailer inventory model with carbon tax regulation, imperfect production, and rework. In AIP Conference Proceedings; AIP Publishing: Melville, NY, USA, 2023; Volume 2674. [Google Scholar]
- Khanna, A.; Gautam, P.; Hasan, A.; Jaggi, C.K. Inventory and pricing decisions for an imperfect production system with quality inspection, rework and carbon-emissions. Yugosl. J. Oper. Res. 2020, 30, 339–360. [Google Scholar]
Disclaimer/Publisher’s Note: The statements, opinions and data contained in all publications are solely those of the individual author(s) and contributor(s) and not of MDPI and/or the editor(s). MDPI and/or the editor(s) disclaim responsibility for any injury to people or property resulting from any ideas, methods, instructions or products referred to in the content. |
© 2025 by the authors. Licensee MDPI, Basel, Switzerland. This article is an open access article distributed under the terms and conditions of the Creative Commons Attribution (CC BY) license (https://creativecommons.org/licenses/by/4.0/).