1. Introduction
Since 1980, natural disasters globally have resulted in the deaths of over 2.5 million people and caused inflation-adjusted losses approaching USD 6 trillion [
1]. Among hydrometeorological disasters, flash floods stand out as particularly dangerous and difficult to mitigate. These events are highly localized, often developing within three hours of intense rainfall [
2]. Their rapid onset and limited early warning systems make them one of the deadliest climatic natural disasters, contributing to approximately 5000 fatalities annually worldwide [
3].
However, disaster management remains a significant challenge for developing countries due to budgetary constraints and limited emergency response capabilities. For instance, Kiribati estimates that disaster-related costs consume 35% of its GDP, while Colombia reported losses totaling USD 6 billion between 2010 and 2011 [
4]. These financial burdens hinder rapid disaster response efforts, reinforcing the need for cost-effective solutions to optimize emergency resource allocation.
This study developed and deployed machine learning models to support emergency response agencies in assessing the aftermath of hydrometeorological disasters. The proposed model leverages high-resolution satellite imagery to automatically distinguish between damaged and undamaged buildings, enhancing situational awareness and response planning. Specifically, this research focuses on Hurricane Maria, a severe disaster that impacted Puerto Rico in 2017.
To structure the study, the research adopted IBM’s Analytics Solutions Unified Method (ASUM), which is a framework designed to ensure a systematic approach to data-driven solutions. By following ASUM, this research establishes a clear, standardized pipeline for building machine learning-based disaster assessment tools.
This study hypothesizes that YOLOv8 models trained on high-resolution satellite imagery can effectively and efficiently identify damaged buildings following hydrometeorological disasters, providing a low-cost, scalable, and accessible tool for disaster response efforts. Furthermore, we provide compelling empirical evidence that while Adam and its variations are widely adopted for deep learning training, SGD with momentum offers distinct advantages, particularly in training efficiency, model stability, and prediction reliability. In our evaluation, SGD with momentum consistently maintained model performance across higher confidence thresholds, reinforcing its robustness for disaster damage assessments.
Although 2D satellite imagery has inherent limitations, particularly in detecting lateral or structural integrity damage, we argue that this approach still provides invaluable insights for large-scale disaster assessment. By rapidly mapping potentially damaged areas, this method enhances situational awareness and facilitates resource allocation for targeted ground inspections, complementing other technologies such as drone-based assessments in future workflows.
The remainder of this paper is structured as follows:
Section 2 provides the background, including mathematical foundations for the research, while
Section 3 reviews related works. The general problem statement is outlined in
Section 4. The proposed approach is detailed in
Section 5. The results obtained are presented in
Section 6, and the implementation is discussed in
Section 7. Finally,
Section 8 summarizes the paper’s main conclusions.
This extended version builds upon the paper originally presented at the International Conference on Applied Informatics (ICAI), 2024 [
5], by expanding the theoretical foundations of machine learning models, particularly in optimization techniques and hyperparameter fine-tuning using genetic algorithms.
To strengthen this study,
Section 2 has been expanded with the addition of
Section 2.1,
Section 2.2,
Section 2.3,
Section 2.4 and
Section 2.5, providing a detailed analysis of the mathematical foundations of these optimization methods.
Section 3 now includes a broader range of studies, connecting theoretical advancements with practical applications. Additionally,
Section 6 introduces new experimental findings, detailed in
Section 5, offering valuable insights into the trade-offs and benefits of these mathematical techniques. Finally, the conclusions have been restructured to reflect these findings, providing future research and practical implementation recommendations.
2. Background
In 2017, Puerto Rico experienced a devastating hurricane season, with Hurricane Maria, a Category 4 storm, being primarily responsible for the extensive damage on the island. This natural phenomenon struck on 20 September 2017, triggering catastrophic flooding, river overflows, and massive landslides that significantly affected the region [
6]. The storm exacerbated pre-existing vulnerabilities, leaving homes severely damaged in most municipalities. Consequently, thousands of lives were lost due to the hurricane and its aftermath, including widespread power outages, water contamination, and limited healthcare services.
In particular, unauthorized or informal constructions demonstrated poor resilience, with buildings in these areas experiencing extensive damage from the extreme winds, often resulting in total losses. These events caused extensive physical damage and severely disrupted the functionality of critical infrastructure systems, leading to widespread power outages as well as failures in power transmission and distribution networks [
7]. Moreover, infrastructure deficiencies resulted in losses of backup generators, causing interruptions in activities at some schools and healthcare facilities.
Hurricane Maria exemplifies the devastating impact hydrometeorological disasters can have on communities, affecting multiple aspects of their infrastructure and livelihoods. In such critical scenarios, relying on robust and reliable models to provide valuable insights for disaster response and recovery is essential. To build trust in machine learning models, it is crucial to understand the implications of key design choices within their mathematical foundations, such as the selection of the loss and optimization functions. These elements are fundamental drivers of model confidence and are further explored in the following sections.
2.1. Binary Cross-Entropy (BCE) Loss Function
Binary Cross-Entropy (BCE) is a commonly used loss function in machine learning for evaluating the accuracy of a model’s predictions. This loss function is particularly useful as it quantifies the difference between two probability distributions, as shown below:
In this formula, l represents the loss function, y denotes the true class label of the i-th instance, which can take a binary value of 0 or 1, and p represents the predicted probability that the instance belongs to class 1.
2.2. Stochastic Gradient Descent (SGD)
Stochastic Gradient Descent (SGD) is one of the classical optimization algorithms, first introduced in the 1950s. The algorithm has gained prominence for its ability to perform faster iterations compared to its non-stochastic counterparts at the cost of potentially slower convergence [
8]. SGD updates the model parameter vector
w iteratively by selecting a random data point
at each iteration and applying the following update rule:
In this context, the vector w represents the model parameters, is the learning rate, and denotes the gradient of the loss function l with respect to the parameter vector w.
2.3. Stochastic Gradient Descent with Momentum
SGD with momentum is an extension of the gradient descent algorithm that incorporates inertia when calculating the gradient of the loss function. Inspired by the concept of momentum in physics, this method can help the optimizer escape local minima and accelerate convergence toward a better solution. It achieves this by computing an exponentially weighted average of the gradients and using this accumulated information to update the model weights, thereby accounting for past gradients in the optimization process [
9].
The momentum optimization algorithm can be mathematically expressed as follows:
Here,
represents the momentum constant, which typically takes values between 0 and 1. A value of 0 indicates no momentum, while 0.9 is commonly recommended for practical applications. The term
v denotes the velocity, which guides the direction of the gradient updates by incorporating the momentum effect [
9] (essentially the velocity term that reflects the accumulated momentum of past gradients).
2.4. Root Mean Squared Propagation (RMSProp)
Root Mean Squared Propagation (RMSProp) is an optimization algorithm introduced by Geoff Hinton in the course Neural Networks for Machine Learning [
10]. It can be viewed as a simplified version of the Adam algorithm, omitting the momentum component. It is notable for its strong empirical performance, often surpassing similar algorithms such as Stochastic Gradient Descent (SGD). RMSProp has gained significant recognition among practitioners, particularly in applications involving generative adversarial networks (GANs) [
11,
12,
13]. The algorithm is formally defined as follows:
In this context,
v represents the moving average of squared gradients, while
denotes the gradient of the cost function concerning the weights. The parameter
is the learning rate, and
is the moving average parameter. An initial value of
is often recommended, as this configuration approximates a zero-sum for the gradient over nine mini-batches (with a value of 0.1 each) on
in the tenth batch. Similarly, a default learning rate of
is 0.001, which is commonly used as an initial experimentation point [
14].
2.5. Adaptive Moment Estimation (Adam)
Adaptive Moment Estimation (Adam) is a widely used optimization algorithm designed to enhance stochastic optimization by utilizing first-order gradients while requiring minimal memory. The Adam algorithm was developed to combine the strengths of two popular methods: AdaGrad, a variation of Stochastic Gradient Descent (SGD), and RMSProp. A closely related algorithm to Adam is RMSProp with momentum, which primarily differs from Adam by including bias-correction terms [
15].
Building upon adjusted versions of the formulas used in preceding optimizers, the Adam algorithm defines the first- and second-moment estimates as follows:
However, both estimates are biased toward 0, particularly in the early iterations, when
are close to 1 [
16]. To address this, Adam introduces bias-corrected estimates:
These bias-corrected values are then used in the updated function as follows:
Here,
is the learning rate,
is a constant added for numerical stability, and
refer to the exponential decay rates for the moment estimates [
15].
3. Related Works
In recent years, machine learning models have become versatile tools across multiple fields, including disaster management. To assess the current state and recent advancements in this area, the following case studies were examined:
3.1. Comparative Analysis of Deep Learning Image Detection Algorithms
The research, published in 2021, focuses on comparing prominent object detection models, specifically the Single Shot Detection (SSD), Faster Region-based Convolutional Neural Networks (FR-CNNs), and You Only Look Once (YOLO) version 3 architectures. The evaluation used the COCO dataset comprising 330,000 images and 200,000 labels across 80 different classes [
17]. Each architecture demonstrated distinct advantages and limitations when compared with the others.
Firstly, FR-CNN is notable for its use of the Selective Search algorithm; however, as a greedy algorithm, it does not always yield optimal results. Additionally, this algorithm must be executed multiple times in the R-CNN framework, significantly increasing the overall complexity. Secondly, SSD exhibited a pronounced dependency on data augmentation and large volumes of training data to achieve satisfactory performance, highlighting a key limitation. Lastly, YOLOv3 struggled to accurately detect objects in images containing multiple features, especially when these features were not the image’s focal point. The paper concluded that while FR-CNN delivered the best performance in terms of precision and recall, YOLOv3 was the fastest among the evaluated models [
18].
Building on these findings, this paper aims to delve deeper into the YOLO architecture by examining the drawbacks and benefits of its latest version, the eighth release.
3.2. Deep Learning Building Damage Assessment
Another study focused on using detection, segmentation, and classification models to identify damage caused by natural disasters, comparing some of the most effective models in this field. The research primarily relied on the xView2 dataset, which is a public collection containing 850,763 labeled buildings across approximately 45,361 square kilometers, covering six types of natural disasters [
19]. The dataset follows labeling standards established by HAZUS studies, the FEMA Damage Assessment Operations Manual, the Kelman scale, and EMS-98. These frameworks provide a standardized approach for categorizing damage into four levels: no damage, minor damage, major damage, and destroyed [
20].
The researchers explored Siamese binary models. Instead of using a single model to classify between the four categories, they employed parallel binary classification models to distinguish each class separately and then combined them into a single result. Additionally, this work investigated a serial model architecture, where the output of a segmentation model served as the input for a classification model. This approach resulted in improved performance and more accurate results [
20].
The paper concludes that distinguishing between minor and major damage classes presents a significant challenge. Although employing a Siamese model architecture substantially enhances overall performance, reducing the number of classes, where feasible, proves to be a more effective strategy for achieving greater accuracy [
20]. Our proposal addressed this issue by consolidating the four categories into two, damaged and undamaged, thereby reducing the complexity of accurately classifying each class. This simplification aligns with the goals of the current research, as a higher level of granularity is not required and may yield improved results.
3.3. Detection of Earthquake Damage in Buildings Based on Synthetic Aperture Radar Imaging and Machine Learning
In February 2023, the European Geosciences Union conducted research that aimed to develop machine learning models for the classification of earthquake damage to buildings using synthetic aperture radar images. The study analyzed images from four distinct earthquakes: the 2015 earthquake in Gorkha, Nepal; the 2017 earthquake in Puebla, Mexico; the 2020 earthquake in Puerto Rico; and the 2020 earthquake in Zagreb, Croatia. Each earthquake categorized damage into three to five levels, including earthquake intensity by zone and specific attributes of the affected buildings [
21].
This work opted not to employ deep learning models. This decision was driven by the relatively small size of the dataset utilized and the high computational cost associated with deep learning implementations. Instead, the research focused on conventional machine learning techniques, which proved effective for classifying and assessing the damage to structures impacted by the earthquakes studied [
21].
This paper encountered a significant data imbalance issue, with approximately 90% of the dataset representing undamaged buildings and only 10% representing other damage categories. Generally, the most effective model accurately identified undamaged buildings in about 80% of cases but correctly identified damaged buildings in less than 40% of cases [
21]. Consequently, the paper quickly discarded deep learning models due to the dataset’s size limitations. However, YOLO models, known for their better adaptability to smaller datasets, recommend having more than 1500 images and 10,000 instances per class [
22]. The combined datasets vastly exceeded this threshold for some classes, and by applying class reduction techniques, as explored in
Section 3.2, this could be achieved for all classes. Finally, despite the insights provided by the paper, classical machine learning models were excluded from the current research.
3.4. Using Artificial Neural Network Models to Assess Hurricane Damage Through Transfer Learning
The fourth study examined, published in 2022, focused on generating classification and detection models to assess hurricane damage using transfer learning. The dataset consisted of post-hurricane imagery, including 1000 images used for binary classification to distinguish between flood and non-flood conditions. Additionally, the dataset for the detection model contained 800 images distributed among four damage categories: damaged roof, damaged wall, flood damage, and structural damage [
23].
The research employed a transfer learning strategy using three pre-trained advanced neural networks: ResNet, MobileNet, and EfficientNet. The approach involved freezing certain layers of the models to preserve the pre-trained weights and removing the top layer responsible for making predictions. Finally, new trainable layers were added to the architecture’s top to generate the adjusted predictions [
23].
The results of the model training were promising. For the classification tasks, the model achieved 76% overall accuracy with ResNet and 87% overall accuracy with MobileNet [
23]. However, the paper encountered a significant challenge concerning the model’s usability. The model made predictions based on images from a human perspective, requiring substantial infrastructure or IoT-connected devices for practical implementation. In contrast, this study focuses on making predictions using satellite imagery, enabling the model to integrate with publicly available images for real-time detection of hydrometeorological disaster impacts.
3.5. Loss Functions and Metrics in Deep Learning
This research, published on 15 October 2024, provides a comparative study of loss functions and metrics commonly employed in machine learning. The study systematically examines prominent classification loss functions, including Binary Cross-Entropy Loss, Weighted Binary Cross-Entropy Loss, Categorical Cross-Entropy Loss, Sparse Categorical Cross-Entropy Loss, Cross-Entropy Loss with Label Smoothing, Focal Loss, and Hinge Loss.
Among these, the Binary Cross-Entropy (BCE) Loss function stands out. This function is widely utilized due to its ability to compare probabilistic distributions efficiently. It is computationally efficient, differentiable, and produces probabilistic outputs, which offer intuitive interpretability of the model’s predictions [
24].
As discussed on
Section 3.2, while certain scenarios may require a large number of classes, reducing the number of classes often leads to improved model performance. This decision has broader implications, allowing for using binary rather than multi-class loss functions, such as Binary Cross-Entropy (BCE). While the effectiveness of BCE depends on having a balanced dataset, alternatives such as Weighted Binary Cross-Entropy Loss or Balanced Cross-Entropy Loss can yield comparable results in scenarios with imbalanced datasets. In general, adopting BCE simplifies the classification task and could accelerate the model training and prediction times. Given that the dataset used in this research is relatively balanced, BCE was chosen as the loss function for the present study.
On the other hand, this study compares the precision–recall (PR) curve and the Receiver Operating Characteristics (ROC) curve. Both metrics assess the model’s ability to distinguish between classes and accurately classify instances. The PR curve, in particular, offers distinct advantages. First, the steepness of the PR curve illustrates the trade-off between precision and recall at a given threshold, enabling the selection of a point that strikes an optimal balance between these two metrics while satisfying specific situational requirements. Additionally, the PR curve facilitates the comparison of two models across all thresholds. If the PR curve of one model is consistently higher than that of another at all points, it can be concluded that one outperforms the other. For these reasons, the PR curve was used as a primary metric to evaluate and compare models in this study.
3.6. Stochastic Gradient Descent Variants and Applications
The sixth study, published in February 2022, explores traditional optimization functions that aim to find the optimal model configuration by minimizing the calculated loss. In particular, the research evaluates the strengths and limitations of Stochastic Gradient Descent (SGD) and compares it to its variants.
Due to its stochastic nature (
Section 2.2), SGD converges faster on large-scale datasets by updating parameters using only a subset of training data, avoiding the need to process the entire dataset at each step [
25]. However, this randomness also poses challenges, such as the risk of becoming trapped in local minima, preventing convergence to the global minimum and optimal vector
w [
8].
Additionally, frequent updates with high variance can hinder convergence and destabilize training at the start of the optimization process, particularly if the initial learning rate is not well defined [
8]. To address these issues, this study used data experimentation for learning rate initialization and learning rate warmup to stabilize training and mitigate stochasticity-related risks.
3.7. On the Convergence of Adam and Beyond
Published in 2019, this research explores optimization algorithms like RMSProp, Adam, AdaDelta, and NAdam, which scale gradient updates using the square root of the exponential moving average of past squared gradients. These algorithms have recently gained prominence over traditional methods like Stochastic Gradient Descent (SGD). However, researchers empirically observed situations where Adam fails to converge to the optimal solution while SGD succeeds [
16]. Furthermore, as cited in [
16], switching to SGD in certain scenarios can result in better generalization performance compared to using Adam.
The study evaluates the trade-offs associated with these modern algorithms, particularly focusing on their reliance on momentum-based updates. While momentum provides the advantage of short-term memory with minimal resource consumption, the paper explores how algorithms like Adam and RMSProp may face convergence issues, especially in simple convex optimization problems. Specifically, it highlights that these algorithms can fail to converge or reach not optimal solutions due to their dependence on the square root updates of exponential gradient averages [
26]. The study concludes that algorithms like SGD, which do not rely on such updates, do not face these constraints and achieve better performance in such scenarios.
Finally, the research suggests potential improvements, such as incorporating long-term memory into these algorithms to mitigate convergence risks [
26]. However, such enhancements may increase computational resource demands. The study demonstrates that relying solely on modern algorithms like Adam may not always yield the best results. Traditional methods like SGD often outperform Adam under certain conditions. Based on these findings, the current research focuses on conducting a detailed comparison of optimization functions to determine the most effective optimization strategy for this study’s objectives.
3.8. RMSProp Converges with Proper Hyperparameters
The eighth study examines the divergence of RMSProp, highlighting that, although there are cases where the algorithm diverges, RMSProp can converge under specific conditions. In particular, the study demonstrates that if
is sufficiently small, RMSProp will converge to a bounded region [
27]. For example, in the scenario analyzed, the study shows that RMSProp diverges if
but converges when
. More generally, the study defines a practical threshold
, such that if
, RMSProp will converge to a reasonably good solution. Furthermore, the authors hypothesize that this conclusion could apply to the Adam optimizer under similar conditions [
27].
Building on this research, the challenge of fine-tuning hyperparameters emerges as part of the classical optimization paradigm: achieving the closest possible approximation to the optimal solution within the practical constraints of experiments and resources. The current study addressed this challenge by leveraging genetic algorithms to fine-tune hyperparameters, allowing for a balanced and unbiased optimization process.
4. Problem Definition
As discussed in
Section 1 and
Section 2, hydrometeorological disasters represent a significant risk to society, accounting for around 90% of all natural disasters between 1999 and 2018 [
3]. Given this context, Hurricane Maria was selected due to the extensive destruction it caused and the vulnerabilities identified in the affected regions. This scenario underscores the importance of integrating specialized models for damage assessment, allowing for more efficient impact evaluation and supporting data-driven decision-making in emergency response and post-disaster reconstruction.
Moreover, given the inherent challenges in accurately assessing the degree of building damage, the risks associated with misclassification, and the limitations discussed in
Section 3, our approach initially focuses on distinguishing between damaged and undamaged buildings following a hydrometeorological disaster.
Contributions
This study introduces several novel contributions to the field of machine learning-based post-disaster damage assessment, extending beyond conventional approaches:
A low-cost, high-speed deep learning model for post-disaster damage assessment: We present a scalable and computationally efficient model for detecting damaged buildings using high-resolution satellite imagery. This solution is specifically designed for resource-constrained environments, making it particularly valuable for disaster response efforts in developing countries.
Comprehensive evaluation of optimization functions for YOLOv8: Unlike prior studies that primarily adopt Adam-based optimizers, our work systematically evaluates multiple optimization algorithms (Adam, AdamW, SGD with momentum, RMSProp, etc.), assessing their impact on stability, convergence behavior, and predictive performance. Our findings serve as a practical reference for selecting the most effective optimizer in disaster response scenarios.
Demonstration of SGD with momentum outperforming Adam-based optimizers: Our empirical results provide compelling evidence that, despite the widespread adoption of Adam-based optimizers, simpler alternatives such as SGD with momentum can achieve superior performance, particularly in training speed, stability, and robustness at higher confidence thresholds.
Performance evaluation of YOLO architectures: We conduct a rigorous comparison of YOLO architectures, demonstrating that lighter models can outperform heavier architectures while requiring significantly less training time. This insight is particularly valuable for real-world disaster response, where rapid model deployment and computational efficiency are critical factors.
Development and public release of a labeled disaster damage dataset: To support further research in machine learning-based disaster assessment, we introduce a manually labeled dataset containing 1400 undamaged buildings and 1200 damaged buildings, derived from high-resolution pre- and post-Hurricane Maria satellite imagery. This dataset is now publicly available, with access details provided in the Data Availability Statement, serving as a valuable benchmark for future studies in satellite-based damage classification.
Robust hyperparameter tuning using genetic algorithms: We leverage genetic algorithms as a resource-efficient approach to hyperparameter tuning, effectively reducing computational overhead while preserving model accuracy. By integrating this adaptive optimization strategy, we enhance the reliability of hyperparameter selection, ensuring a fair and unbiased comparison between optimization functions. This makes our approach particularly well suited for computationally constrained and real-time applications.
5. Methods
5.1. Research Methodology
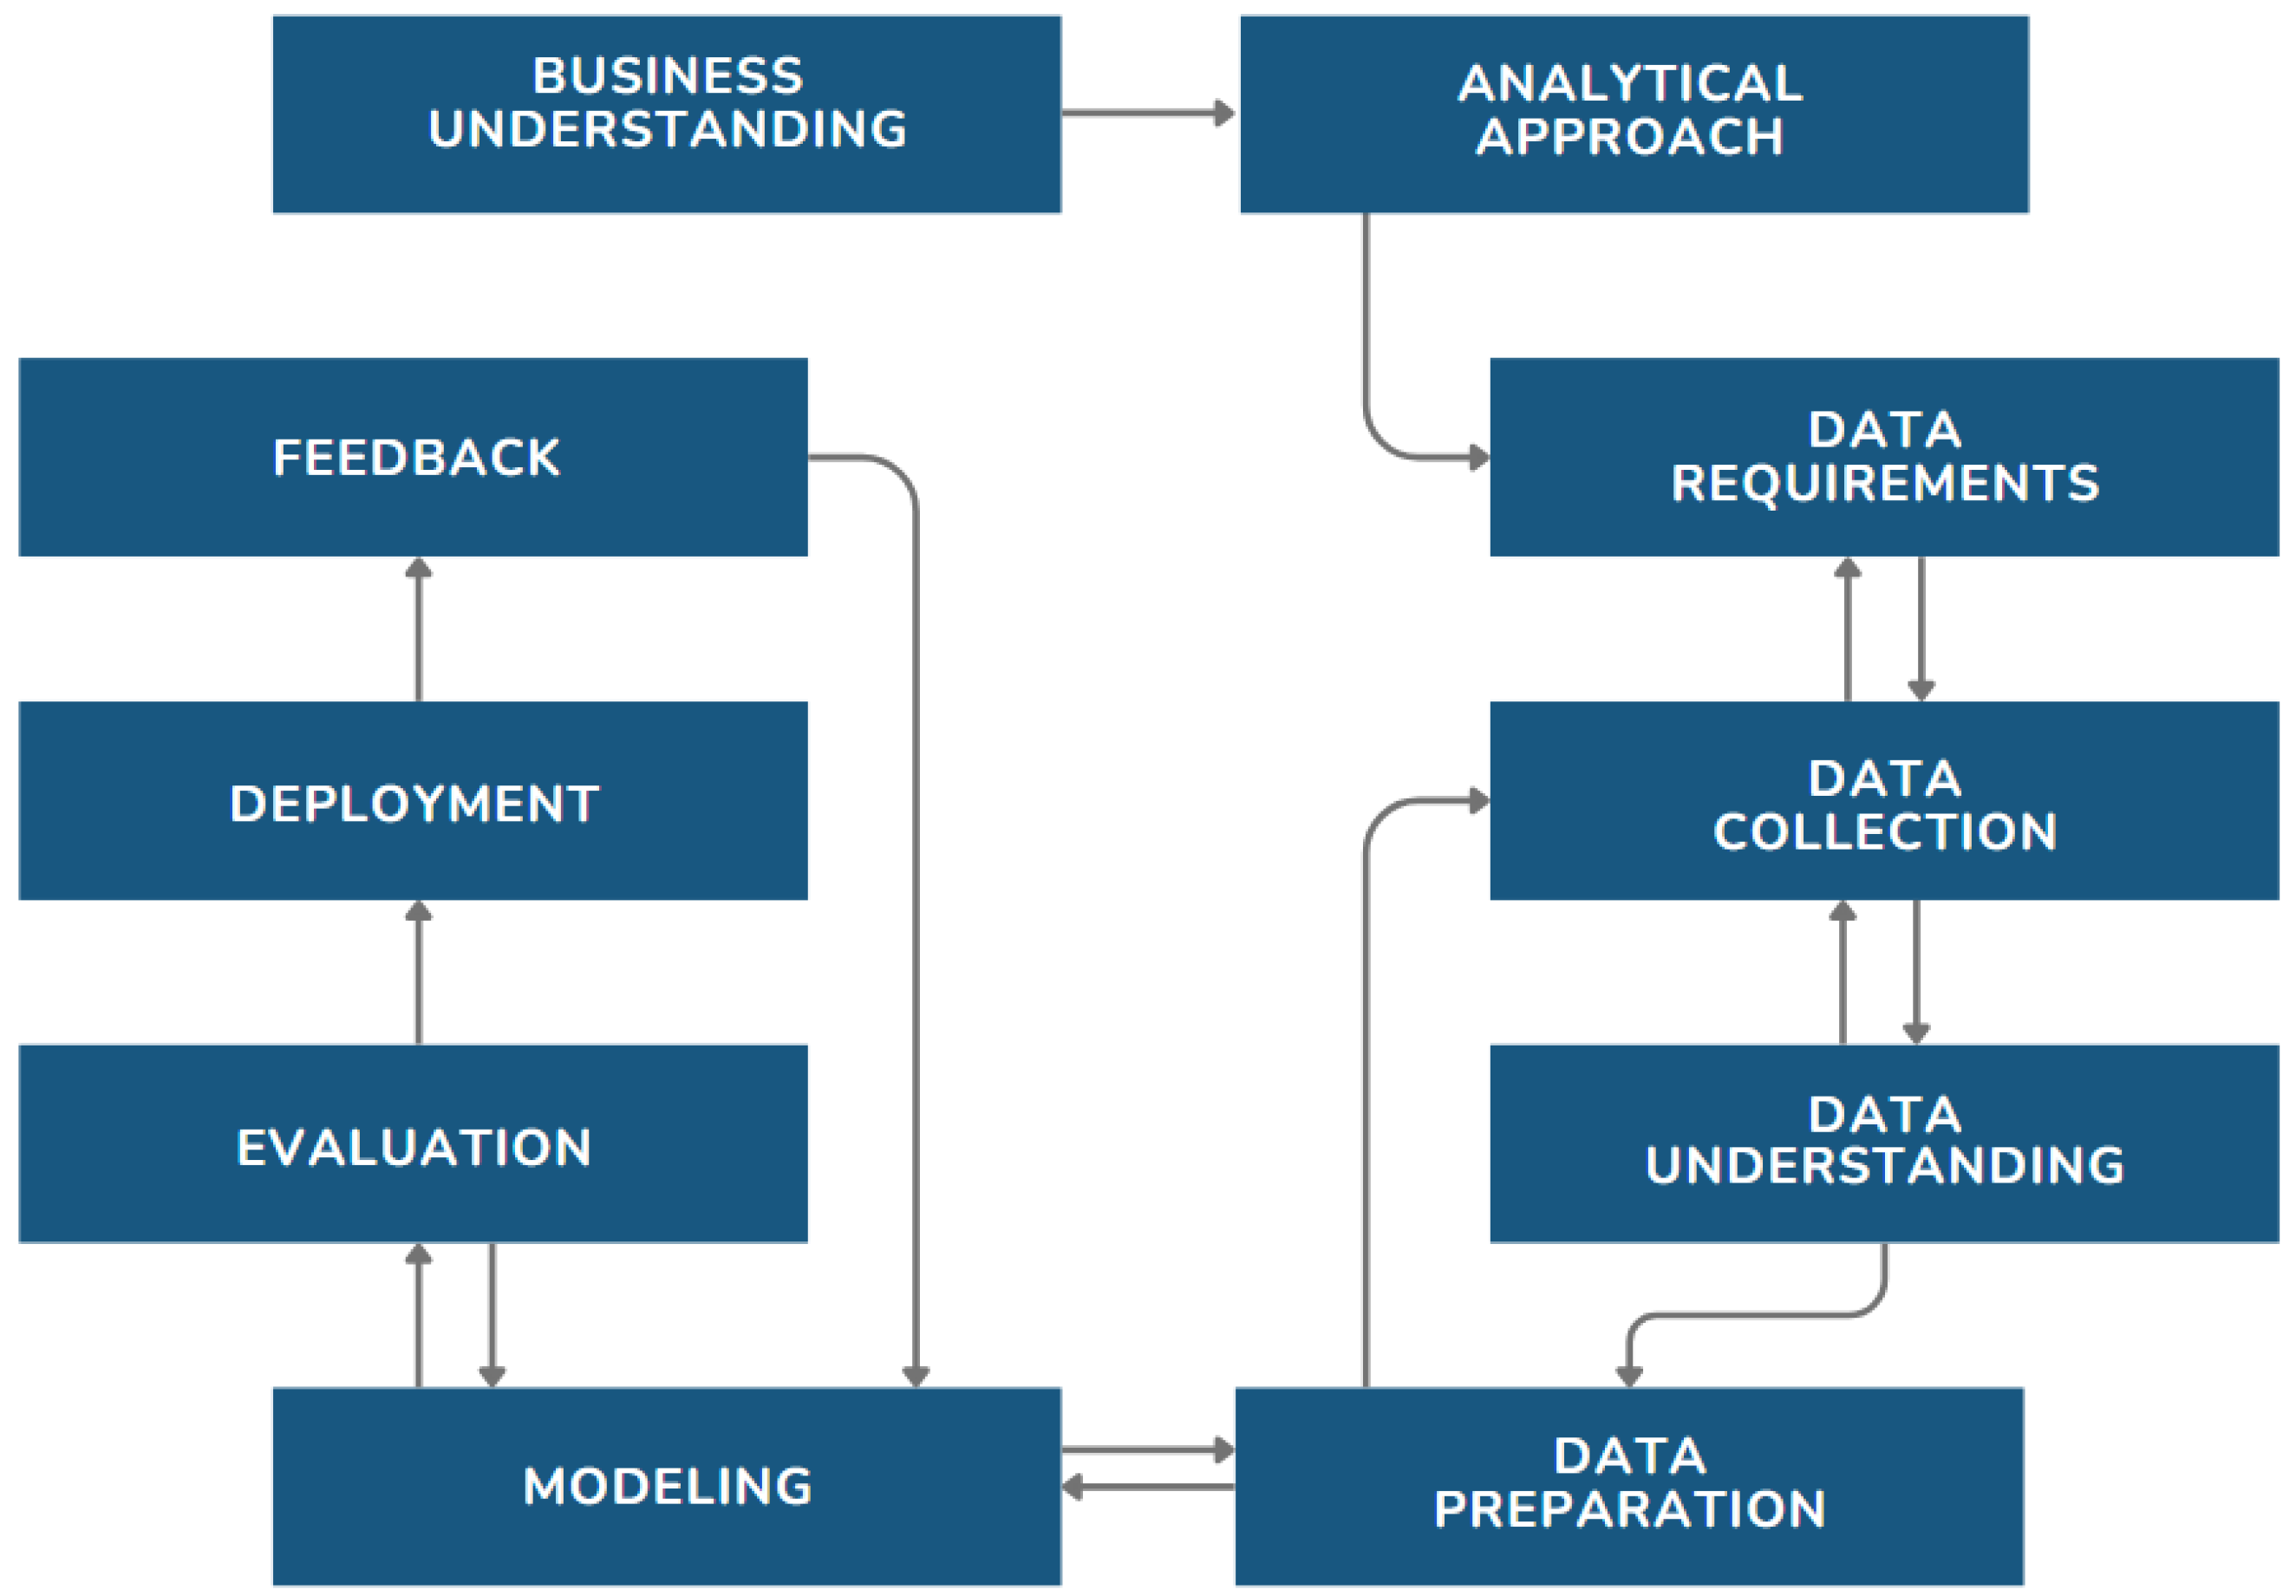
The current research adopted the Analytics Solutions Unified Method (ASUM-DM) as its methodology, following the 10-stage framework illustrated in
Figure 1.
5.2. Analytical Approach
The analytical methodology focused on developing a deep learning model for building detection, prioritizing detection over segmentation due to its greater interpretability and practicality. Unlike segmentation models, which require high-resolution images and significantly increase computational complexity, detection offers a more efficient and scalable solution without compromising effectiveness. These factors guided the selection of detection models as the most suitable approach for addressing the identified problem.
5.3. Data Requirements
The dataset consisted of four key components: high-resolution satellite imagery, which captured the extent of building damage; geospatial data, which enabled the precise coordinate identification of each affected structure; damage classification labels, which differentiated buildings based on their damage; and historical reference data, which facilitated the impact assessment by comparing pre- and post-disaster images.
5.4. Data Collection
The images used in this study were collected from the high-resolution Maxar GeoEye-1 satellite, which offers a multispectral resolution of 1.84 m, enabling the identification of objects as small as a car from space [
29]. This method was selected over three-dimensional alternatives, such as drone-based imaging, due to several key advantages:
Scalability and Large-Area Coverage: Maxar GeoEye-1 satellite can cover 500,000 square kilometers daily [
29], facilitating immediate, large-scale post-disaster assessments. Unlike drones, which have limited operational range and require on-site deployment, satellites can rapidly assess extensive disaster zones. This capability is particularly beneficial in rural and inaccessible regions, where ground-based assessments may be delayed, and timely intervention is critical for disaster response efforts.
Immediate Accessibility: Satellite data are available almost instantly after a disaster, whereas drone-based assessments require logistical coordination, regulatory approvals, and on-site operation, which may introduce delays in emergency response.
Historical Comparisons: Satellite imagery enables pre- and post-disaster analysis, allowing for structural change detection over time. This capability is essential for assessing long-term disaster impacts and infrastructure resilience.
Operational Feasibility: Unlike drones, which may be restricted by airspace regulations or logistical constraints, satellites provide a consistent and uninterrupted source of imagery in most disaster scenarios. However, satellite imaging is subject to atmospheric limitations, such as cloud cover, which can obstruct visibility and impact data quality. Given this constraint, drones could serve as a complementary data source in future models, enhancing and aligning with the methodology developed in this research by providing localized, high-resolution imagery in cloud-obstructed regions.
This dataset, publicly released as part of the EY 2024 Data Challenge [
30], served as an optimal resource for this study, offering a comprehensive and scalable basis for deep learning-driven damage assessment.
5.5. Data Understanding
The dataset covers 266 square kilometers of San Jose, Puerto Rico, with images captured on 29 August 2017 (pre-hurricane) and 12 October 2017 (post-hurricane). The images had a resolution of 0.305 m per pixel, with dimensions of 38,259 pixels in width and 74,602 pixels in height.
5.6. Data Preparation
Two approaches were investigated for the transformation of the collected data:
ArcGIS Pro: The application developed by Esri was initially used for the labeling and visualization of satellite images. While the software provided image augmentation and additional enhanced features, the process led to unintended dataset expansion, significantly increasing training times. ArcGIS Pro was ultimately discarded for this study because of its licensing fees and high computational costs.
Splitting Geotiff Images: The second approach involved splitting the GeoTIFF satellite images into 512 × 512 pixel segments. This resolution facilitated building identification while reducing memory requirements, which were factors that influenced the resolution selection despite the 640 × 640 resolution recommended for these models [
31].
As a result, a dataset of 10,729 images was created for both pre- and post-hurricane scenarios. To train the models, a subset of approximately 1400 undamaged buildings and 1200 damaged buildings was labeled manually. This dataset was further enriched with images of rivers, forests, and industrial areas to improve the model’s generalization capabilities across diverse environments.
To ensure robust model evaluation, the dataset images were shuffled and randomly split into an 80% training set and a 20% validation set, guaranteeing that the model’s performance could be objectively assessed under unbiased and reliable conditions. The careful curation and manual annotation of this dataset serve as the foundation for model training, calibration, and optimization, ensuring that our approach is both rigorous and aligned with best practices in the area.
5.7. Implementation
You Only Look Once (YOLO) is a well established object detection and image segmentation model, consisting of 24 convolutional layers followed by 2 fully connected layers, which output a 7 × 7 × 30 prediction tensor. This model was chosen due to its strong generalization capabilities, making it particularly suited for real-time applications that require fast and reliable object detection. Furthermore, as of 2016, the FAST YOLO variant was recognized as the fastest general-purpose object detector in the literature [
32].
Although models like Faster R-CNN outperform YOLO in detection accuracy, YOLO retains a considerable advantage in processing speed, operating 3 to 42 times faster than these alternatives [
32].
To identify the optimal configuration for YOLO, a three-step process was implemented. The first step corresponded to the initial research version, while steps two and three were introduced as part of the current extended version. First, the architectures were compared. Once the optimal architecture was selected, the optimization function was chosen. Finally, the remaining model hyperparameters were defined.
In the first step, architecture comparison tests were conducted on a CPU with an AMD Ryzen 7 PRO 6850U in 32 GB of RAM system. In the extended version of this research, a different architecture was utilized to select the optimization function and explore optimal hyperparameters. Since these tests required more computational resources, they were executed on a GPU (NVIDIA A40-8C with 8 GB of available memory) in a system equipped with 32 GB of RAM.
5.7.1. Architecture Selection
To define the optimal model architecture, we conducted a systematic exploration of hyperparameters, evaluating various configurations to determine the most effective settings for disaster damage assessment. Specifically, the batch size was tested at 16, 32, and 64, while pre-trained weights were incorporated, with frozen layers adjusted between 0, 5, 10, 15, and 20 to analyze the impact of gradual transfer learning. Additionally, training images were cached in RAM to enhance processing efficiency. Each model was trained for 24 h, implementing an early stopping criterion that terminated training if no performance improvement was observed within the last 100 epochs.
As emphasized in [
33], hyperparameter selection is highly sensitive to the specific scenario, with different configurations yielding optimal performance under varying conditions. Therefore, this study explored a wide batch of hyperparameter settings, ensuring a comprehensive evaluation of potential configurations. This approach reinforced the importance of systematic hyperparameter tuning, enabling the identification of the most effective model settings within the given application context.
To assess model performance, the following evaluation metrics were applied at a 50% Intersection over Union (IoU) threshold:
mAP-50 (mean Average Precision at 50% IoU threshold): Computes the area under the precision–recall curve, providing a single value that summarizes the model’s precision and recall performance across multiple classes.
Precision: Calculates the accuracy of detected objects, indicating the proportion of correct detections among all detections made.
Recall: Measures the model’s ability to correctly identify all instances of objects in the images [
34].
5.7.2. Optimization Function Selection
After selecting the architecture, the optimization functions SGD with momentum, RMSProp, and Adam, along with variations of the Adam algorithm, including AdaMax, NAdam, and AdamW, were compared to determine the most suitable function for the current scenario. Specifically, these functions were evaluated by training models with a batch size of 27, no frozen layers, and a maximum of 1000 epochs to observe the loss behavior over time fully. The analysis focused on training stability while implementing an early stopping criterion with patience of 100 epochs to prevent overfitting.
To select the best model, as suggested in
Section 3.5, metrics such as the precision–recall (PR) curve were utilized. The PR curve provides essential insights into model performance at various IoU thresholds, enabling a more accurate determination of the most effective optimization function. Additionally, each model’s F1 curve and the class, box, and DFL loss functions were analyzed to evaluate their stability and convergence behavior.
Finally, the following hyperparameters were defined for each function based on the recommendations from related research discussed in
Section 3:
Stochastic Gradient Descent (SGD) with Momentum
Root Mean Squared Propagation (RMSProp)
Learning Rate : 0.001.
Decay Rate : 0.9.
Epsilon: 1 × .
Adaptive Moment Estimation (Adam)
AdaMax
Nesterov-accelerated Adaptive Moment Estimation (NAdam)
AdamW
The selection of hyperparameters for each optimization algorithm was guided by established best practices and domain-specific considerations. The values for learning rate, momentum constants, and weight decay were chosen based on widely accepted recommendations in the deep learning literature, ensuring a balance between convergence speed, stability, and generalization performance [
15,
27,
33,
35,
36,
37].
5.7.3. Hyperparameter Tuning
The final step involved determining the optimal hyperparameters. Genetic algorithms [
38,
39] were employed to avoid an extensive and resource-intensive hyperparameter search, leveraging their stochastic nature, which eliminates the need to carefully select initial values, as they are randomly chosen and subsequently optimized. This characteristic has made genetic algorithms a widely used optimization strategy across various fields, including Earth Orientation Parameter prediction and sentiment analysis, where it has demonstrated its ability to efficiently navigate complex search spaces and improve model accuracy [
40,
41]. Inspired by evolution, genetic mutation, and natural selection principles, these algorithms progressively improve models while introducing stochasticity to reduce bias and enhance exploration within the hyperparameter space.
The experiments were conducted using the YOLO mutation implementation over 300 generations. Each generation began by selecting a parent (or base model) using a weighted selection strategy based on the performance of the top five existing models. Weights were assigned proportionally to each model’s performance metric, ensuring that better-performing models were more likely to be selected while maintaining diversity. This approach balanced the exploitation of high-performing solutions and the exploration of new possibilities within the search space.
During the mutation process, each hyperparameter had an 80% probability of mutating. Mutations were applied as random perturbations sampled from a Gaussian distribution with a standard deviation of 0.2. This probabilistic mechanism allowed for meaningful variation in hyperparameter values while avoiding drastic deviations that could hinder convergence. Additionally, each hyperparameter was constrained by upper and lower bounds, ensuring that mutations remained within a predefined range.
Finally, the hyperparameters explored during the tests are described in
Table 1, along with their respective bounds. This search space was chosen following the guidelines detailed in
Section 3, best practices in deep learning hyperparameter selection [
33,
35,
37], and the YOLO documentation [
42]. Certain hyperparameters were neither explored nor utilized during model creation, as they primarily correspond to augmentation methods that were not relevant to the objectives of this research. These excluded hyperparameters include Degrees, Shear, Perspective, Flipud, Bgr, Mixup, and Copy-Paste.
6. Results
6.1. Architecture Selection
The tests conducted to identify the optimal architecture yielded the following results. These findings present the best performance metrics for each model evaluated during this phase.
The models assessed in
Table 2 exhibited comparable performance metrics, but their training time varied significantly. Simpler architectures with shorter training times achieved similar results compared with more complex models. In particular, the YOLOv8n model demonstrated the highest mAP-50 score, reflecting strong precision and recall performance, even surpassing the YOLOv8m model. Since smaller models contain fewer parameters, they are less prone to overfitting, which is a common concern when working with medium-sized datasets. To mitigate this risk, even with small models, this extended version incorporates regularization techniques, as detailed in the following sections.
Conversely, the YOLOv8s model excelled in recall, indicating its ability to accurately detect damaged structures. In disaster response scenarios, minimizing false negatives is critical, as missed detections can delay aid efforts and increase risks. Given this importance, recall serves as a key metric, reinforcing the selection of YOLOv8n and YOLOv8s for further optimization and refinement to enhance damage detection accuracy and efficiency.
In contrast, the YOLOv8l and YOLOv8x models exceeded the 24-hour training threshold, but neither of them delivered notable performance improvements within this extended timeframe. As a result, these models were excluded from further experimentation.
6.2. Optimization Function Selection
6.2.1. Optimization Functions Loss Comparison for YOLOv8 Nano Model
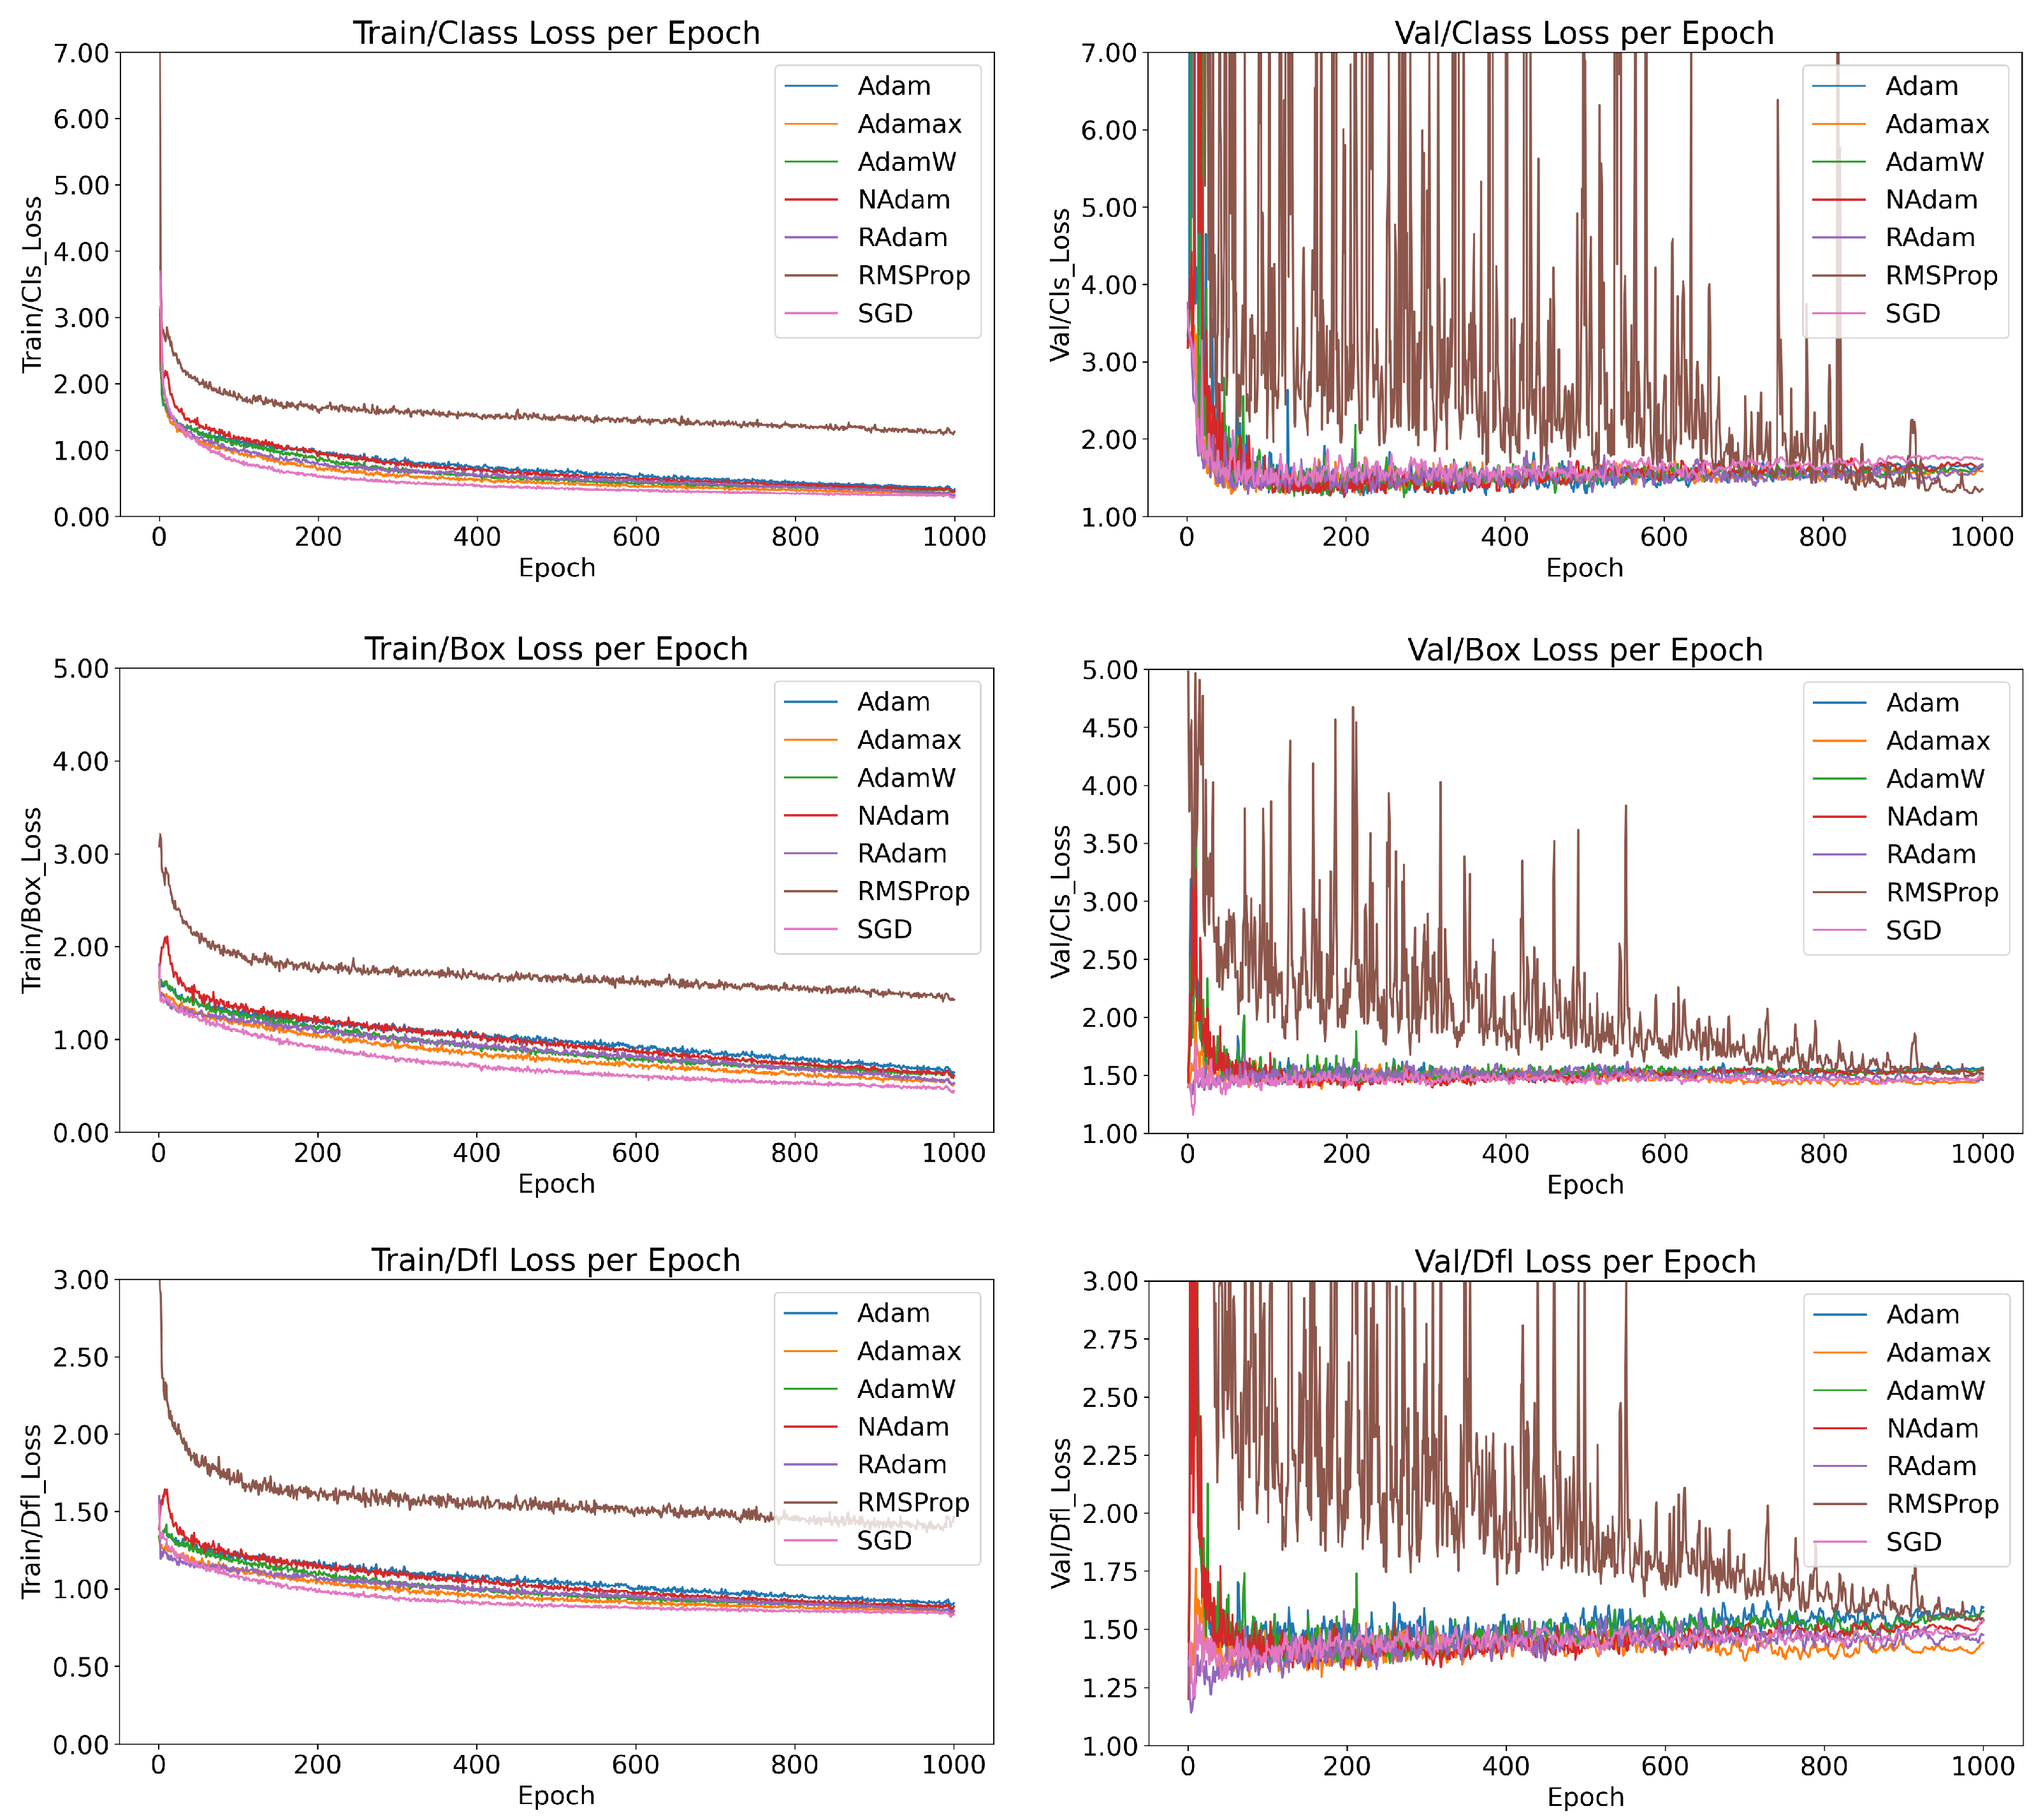
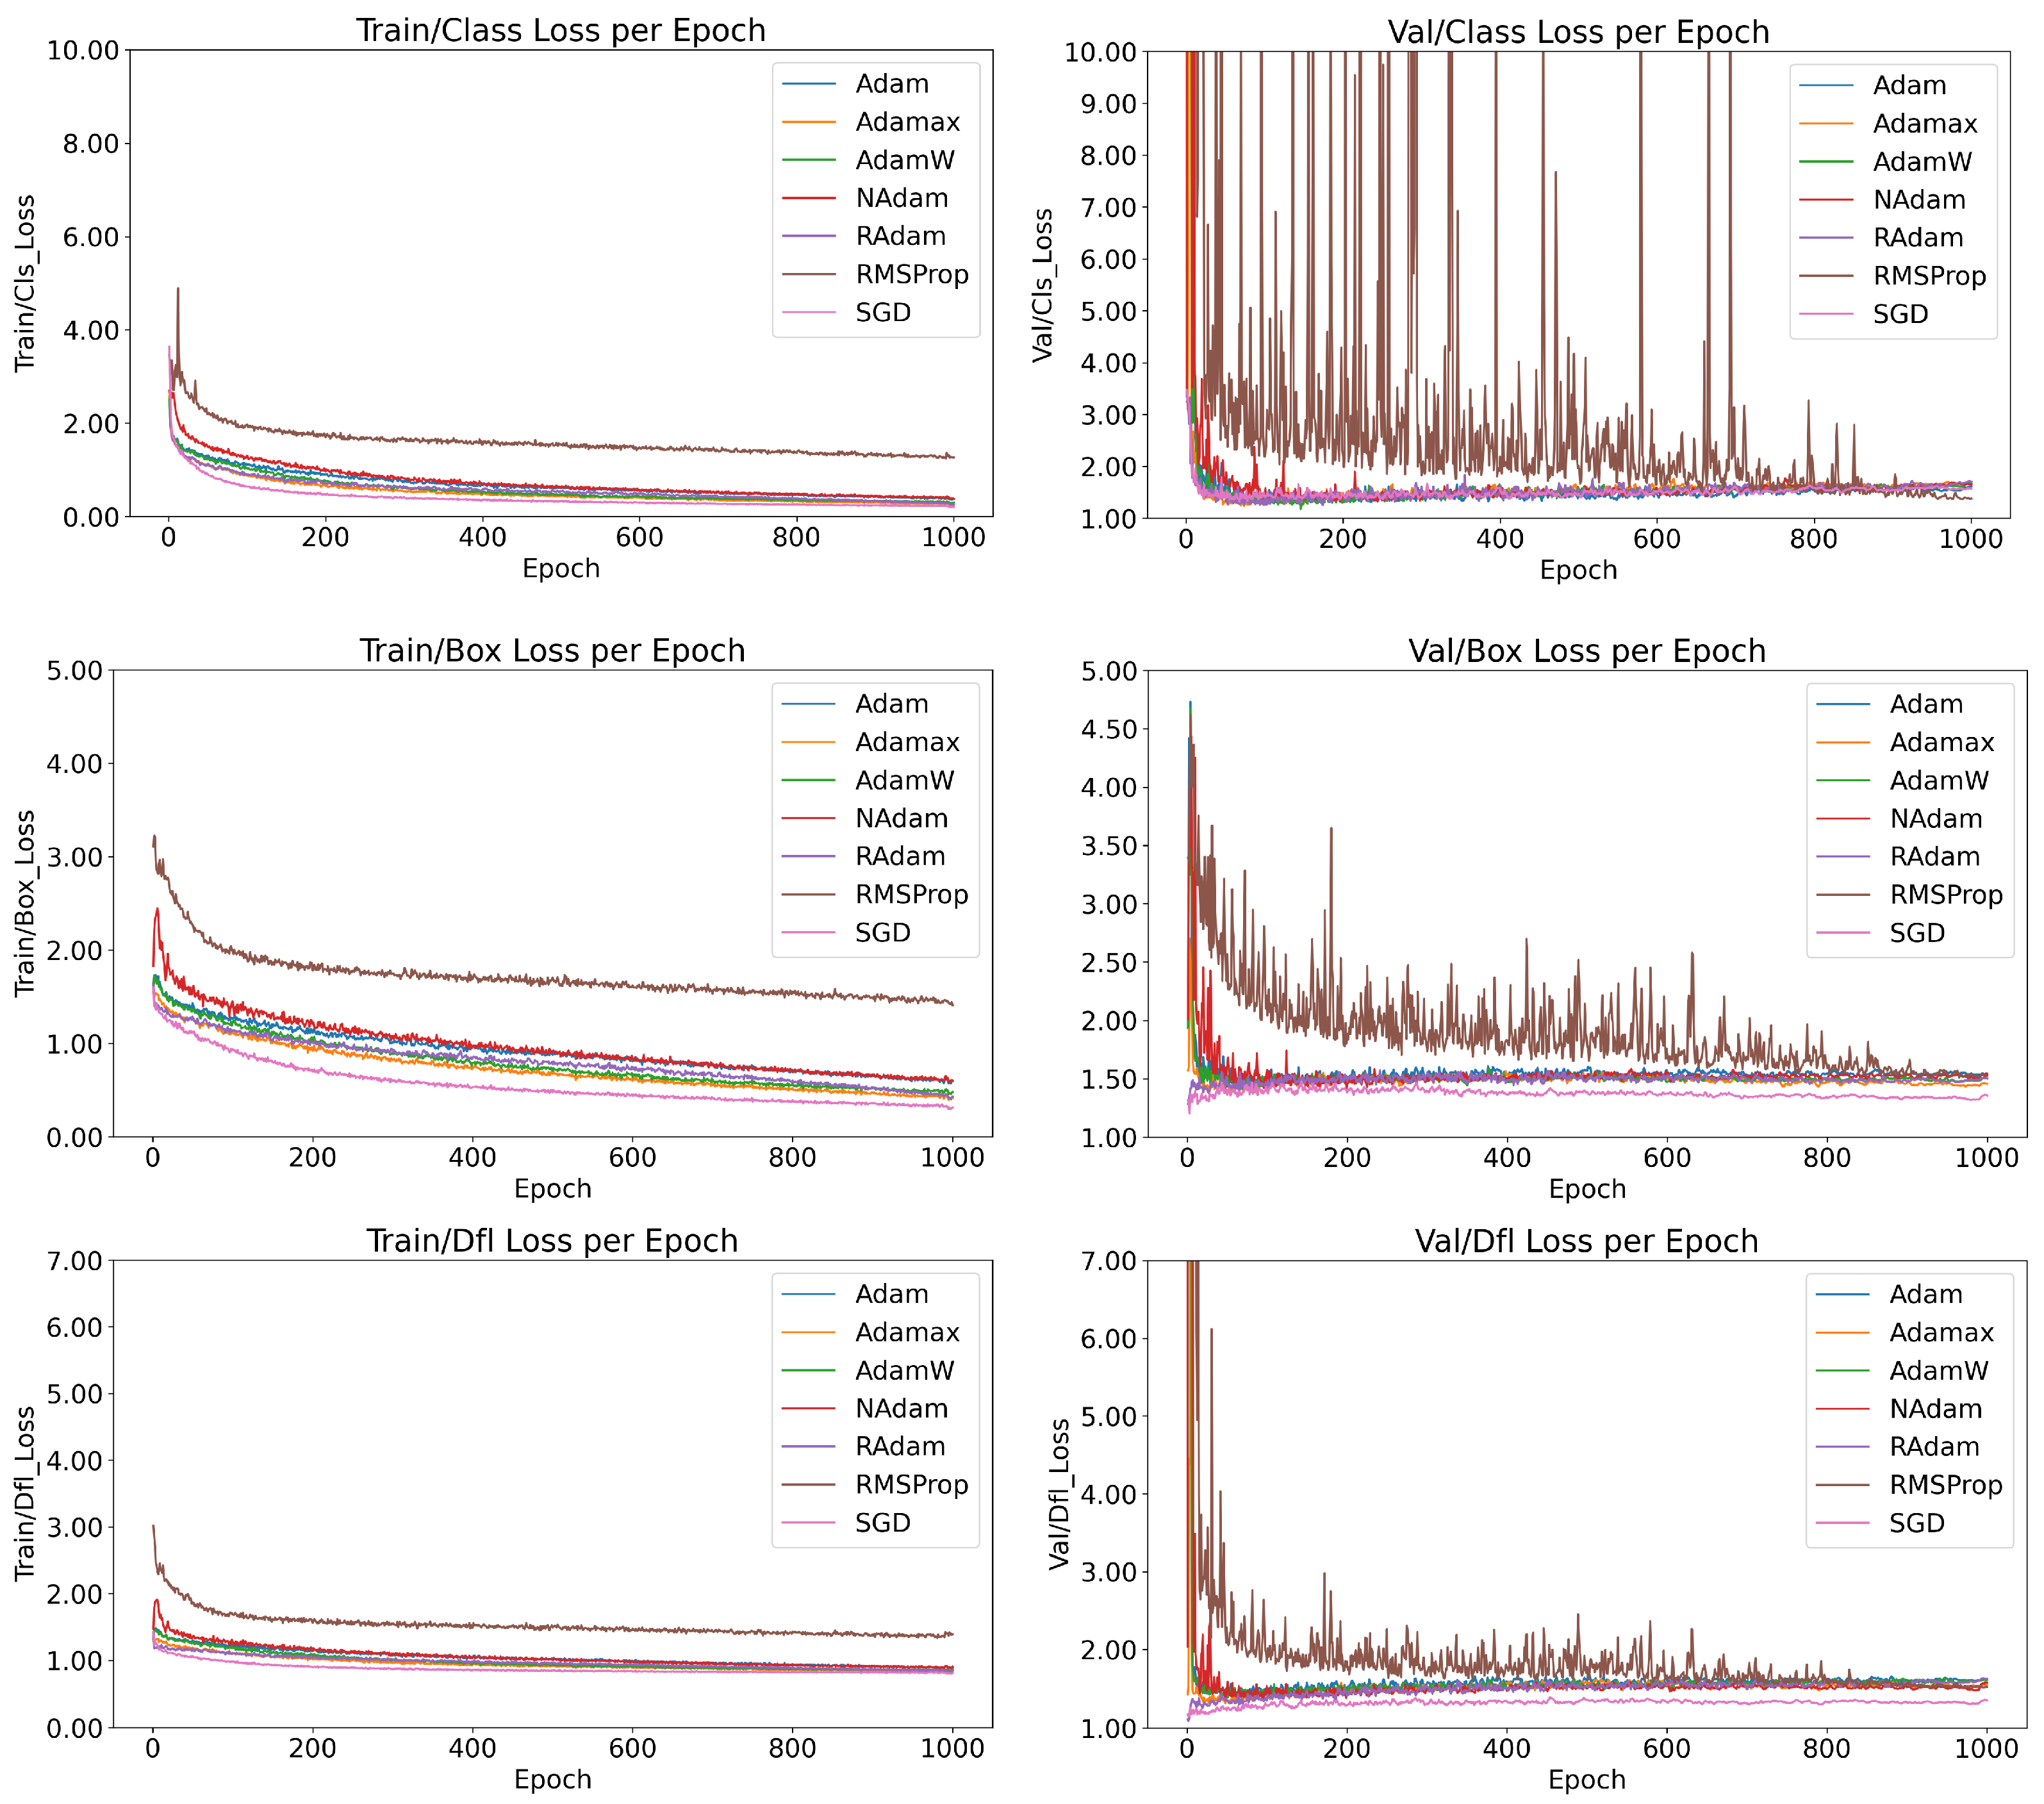
As illustrated in
Figure 2, the behaviors of the models trained with six optimization functions are compared in terms of training and validation performance, specifically evaluating class loss (measuring the accuracy of class predictions), box loss (measuring bounding box size accuracy), and DFL loss (measuring the accuracy of prediction localization).
Among the optimizers, RMSProp stands out for its instability. While it exhibited stable behavior during training, its validation metrics revealed significant inconsistencies, reflecting poor generalization. As discussed in
Section 2.4, RMSProp lacks a momentum factor, preventing it from effectively leveraging recent updates. This limitation contributes to its instability and poor convergence. To address these issues, experimenting with lower learning rates and following the
suggestions detailed in
Section 3 may help mitigate sensitivity to noise and improve performance. Despite its instability, RMSProp achieved the lowest class loss during training. However, this result indicates severe overfitting rather than robust generalization.
In contrast, SGD with momentum demonstrated one of the best overall performances, rivaling the more complex AdamW algorithm. SGD’s stability and consistent convergence during training highlight its robustness, even as the simplest optimizer studied. Additionally, five out of the six models demonstrated stable training behavior, characterized by consistent loss reduction and minimal oscillations, signaling promising reliability when selecting an optimizer for similar tasks.
6.2.2. Optimization Functions Performance Comparison for YOLOv8 Nano Model
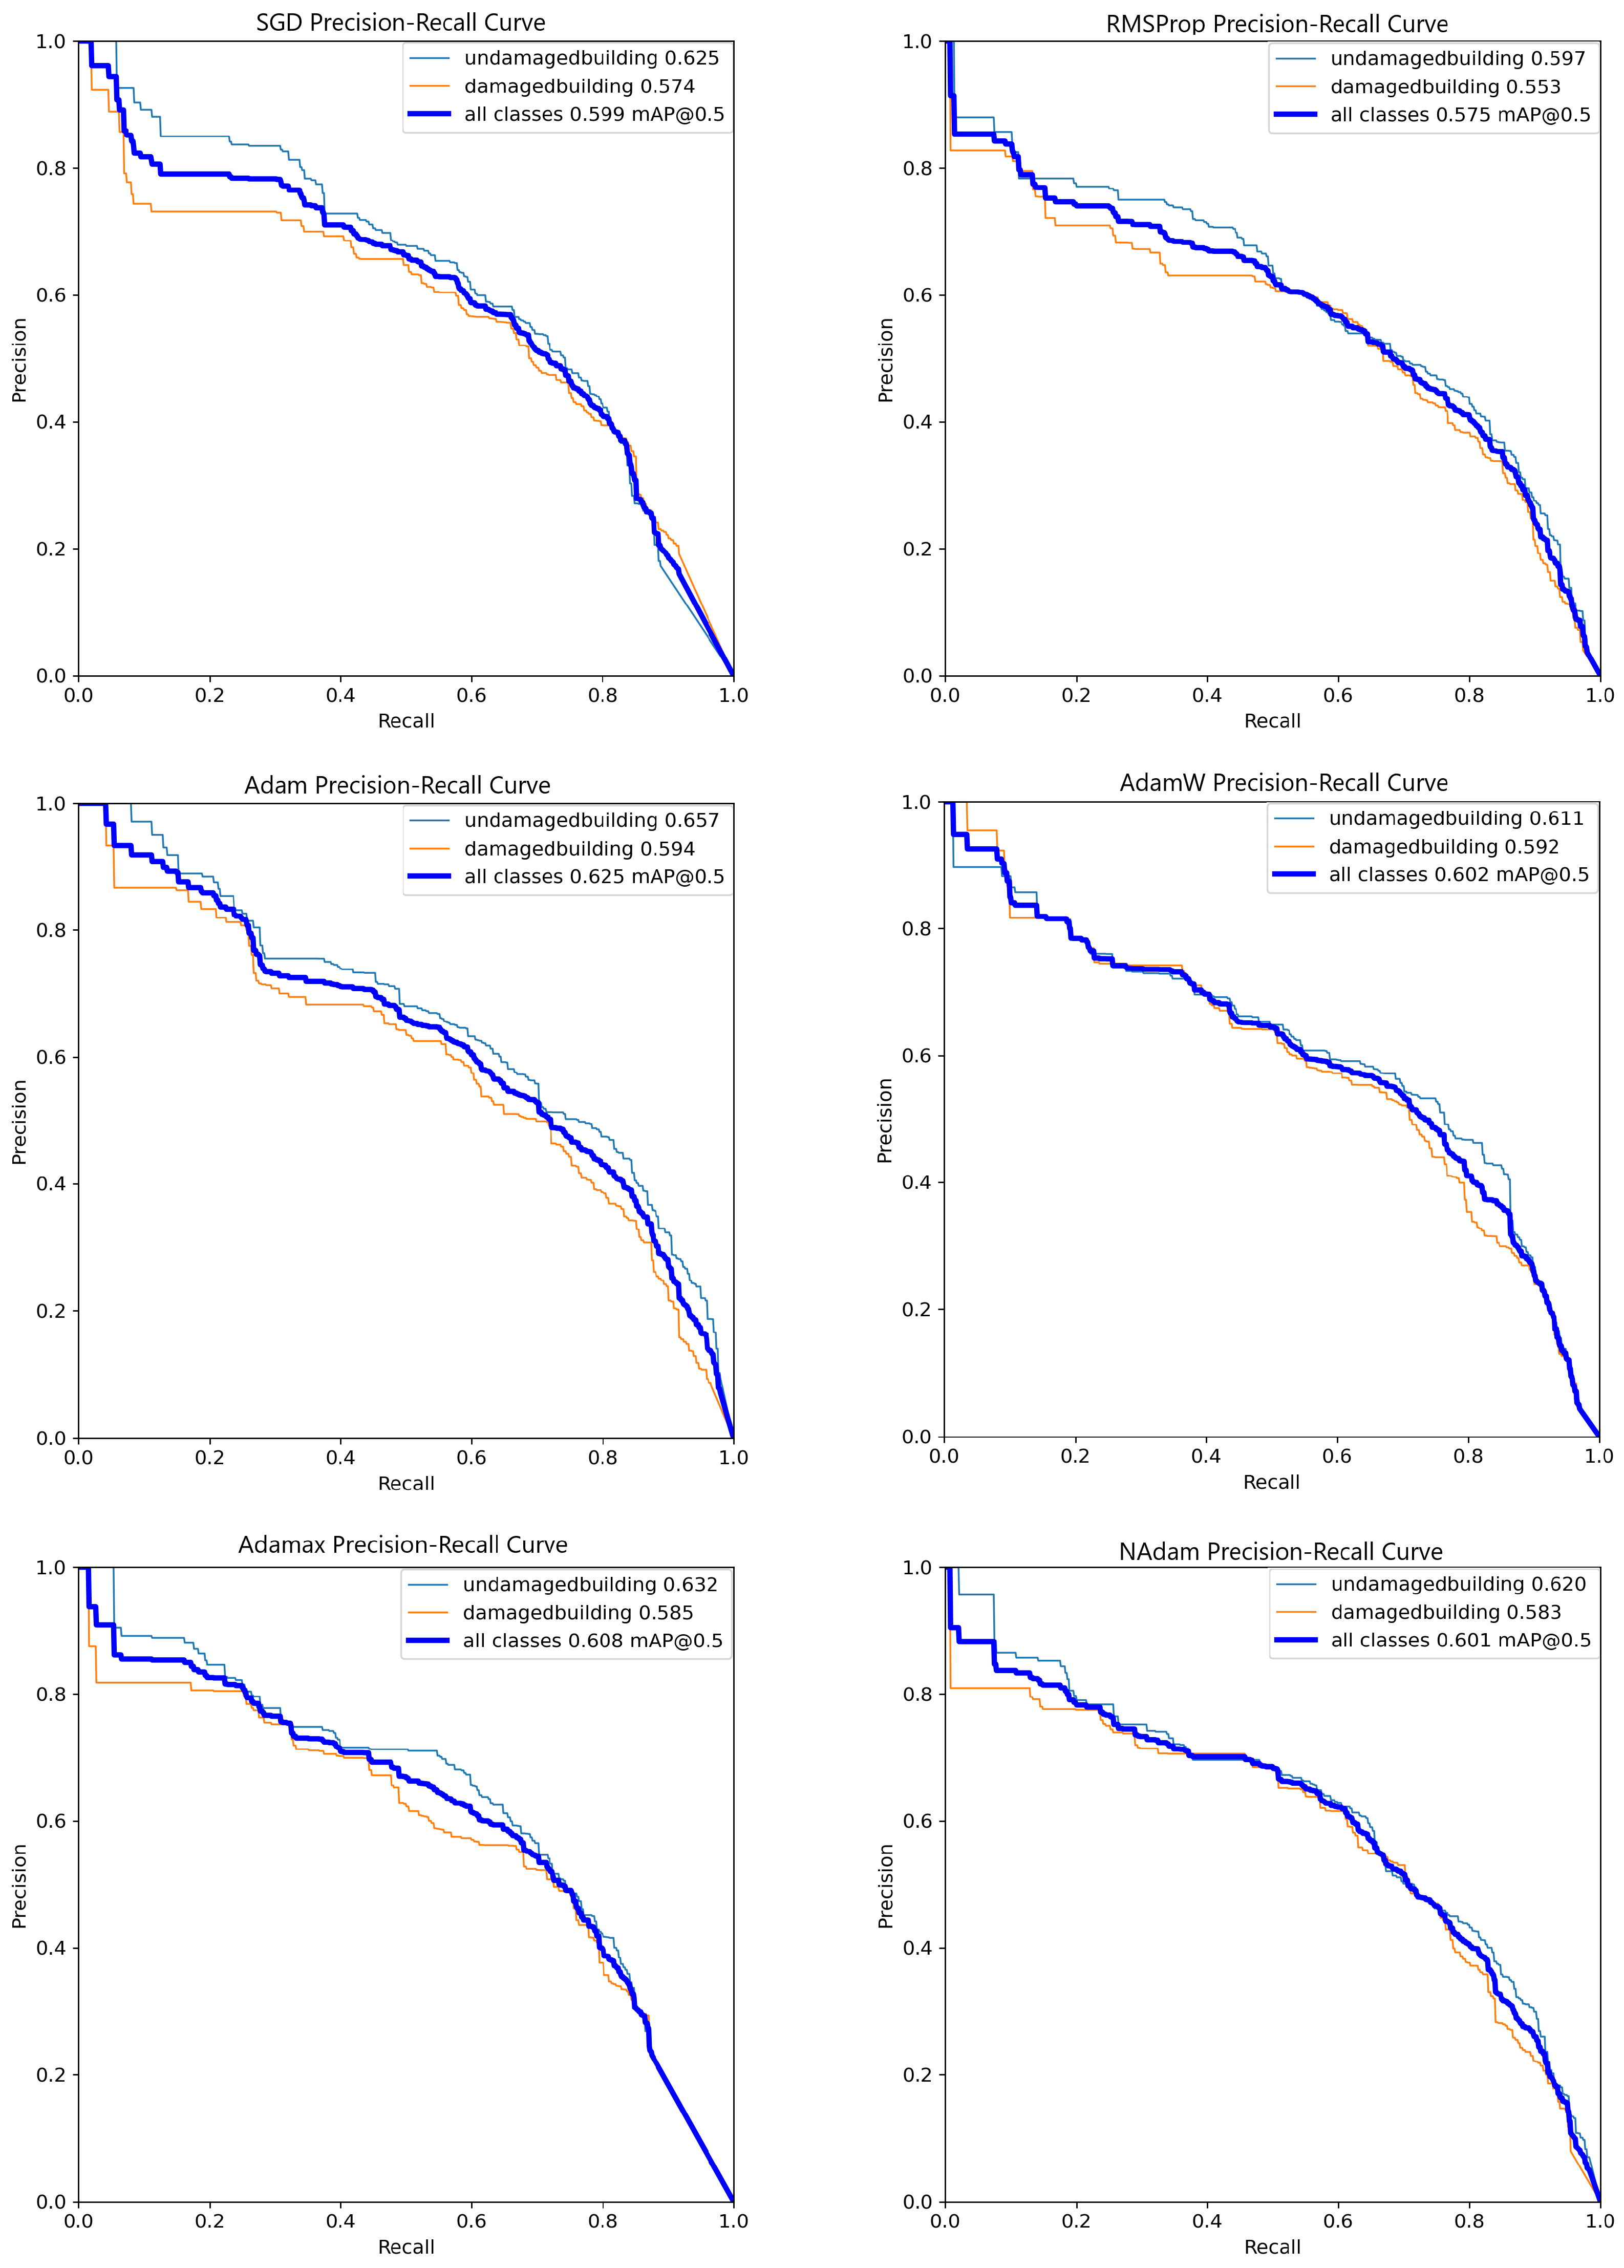
As shown in
Figure 3, there is no significant difference in overall performance among the models, with the best results achieved by the model trained using the Adam optimizer. This model demonstrates an approximately 8% higher mAP@50 (mean Average Precision at an IoU threshold of 0.5) compared to RMSProp and a less than 5% improvement over the other optimizers.
Additionally, the PR curve reveals that while Adam generally achieves the best performance, this trend is inconsistent across all thresholds. For instance, at a recall of approximately 0.3, the Adam curve has an estimated precision of about 0.7, which is surpassed by the SGD curve, which shows a precision value close to 0.8. These observations highlight that certain optimizers may outperform Adam under specific conditions despite its superior overall performance.
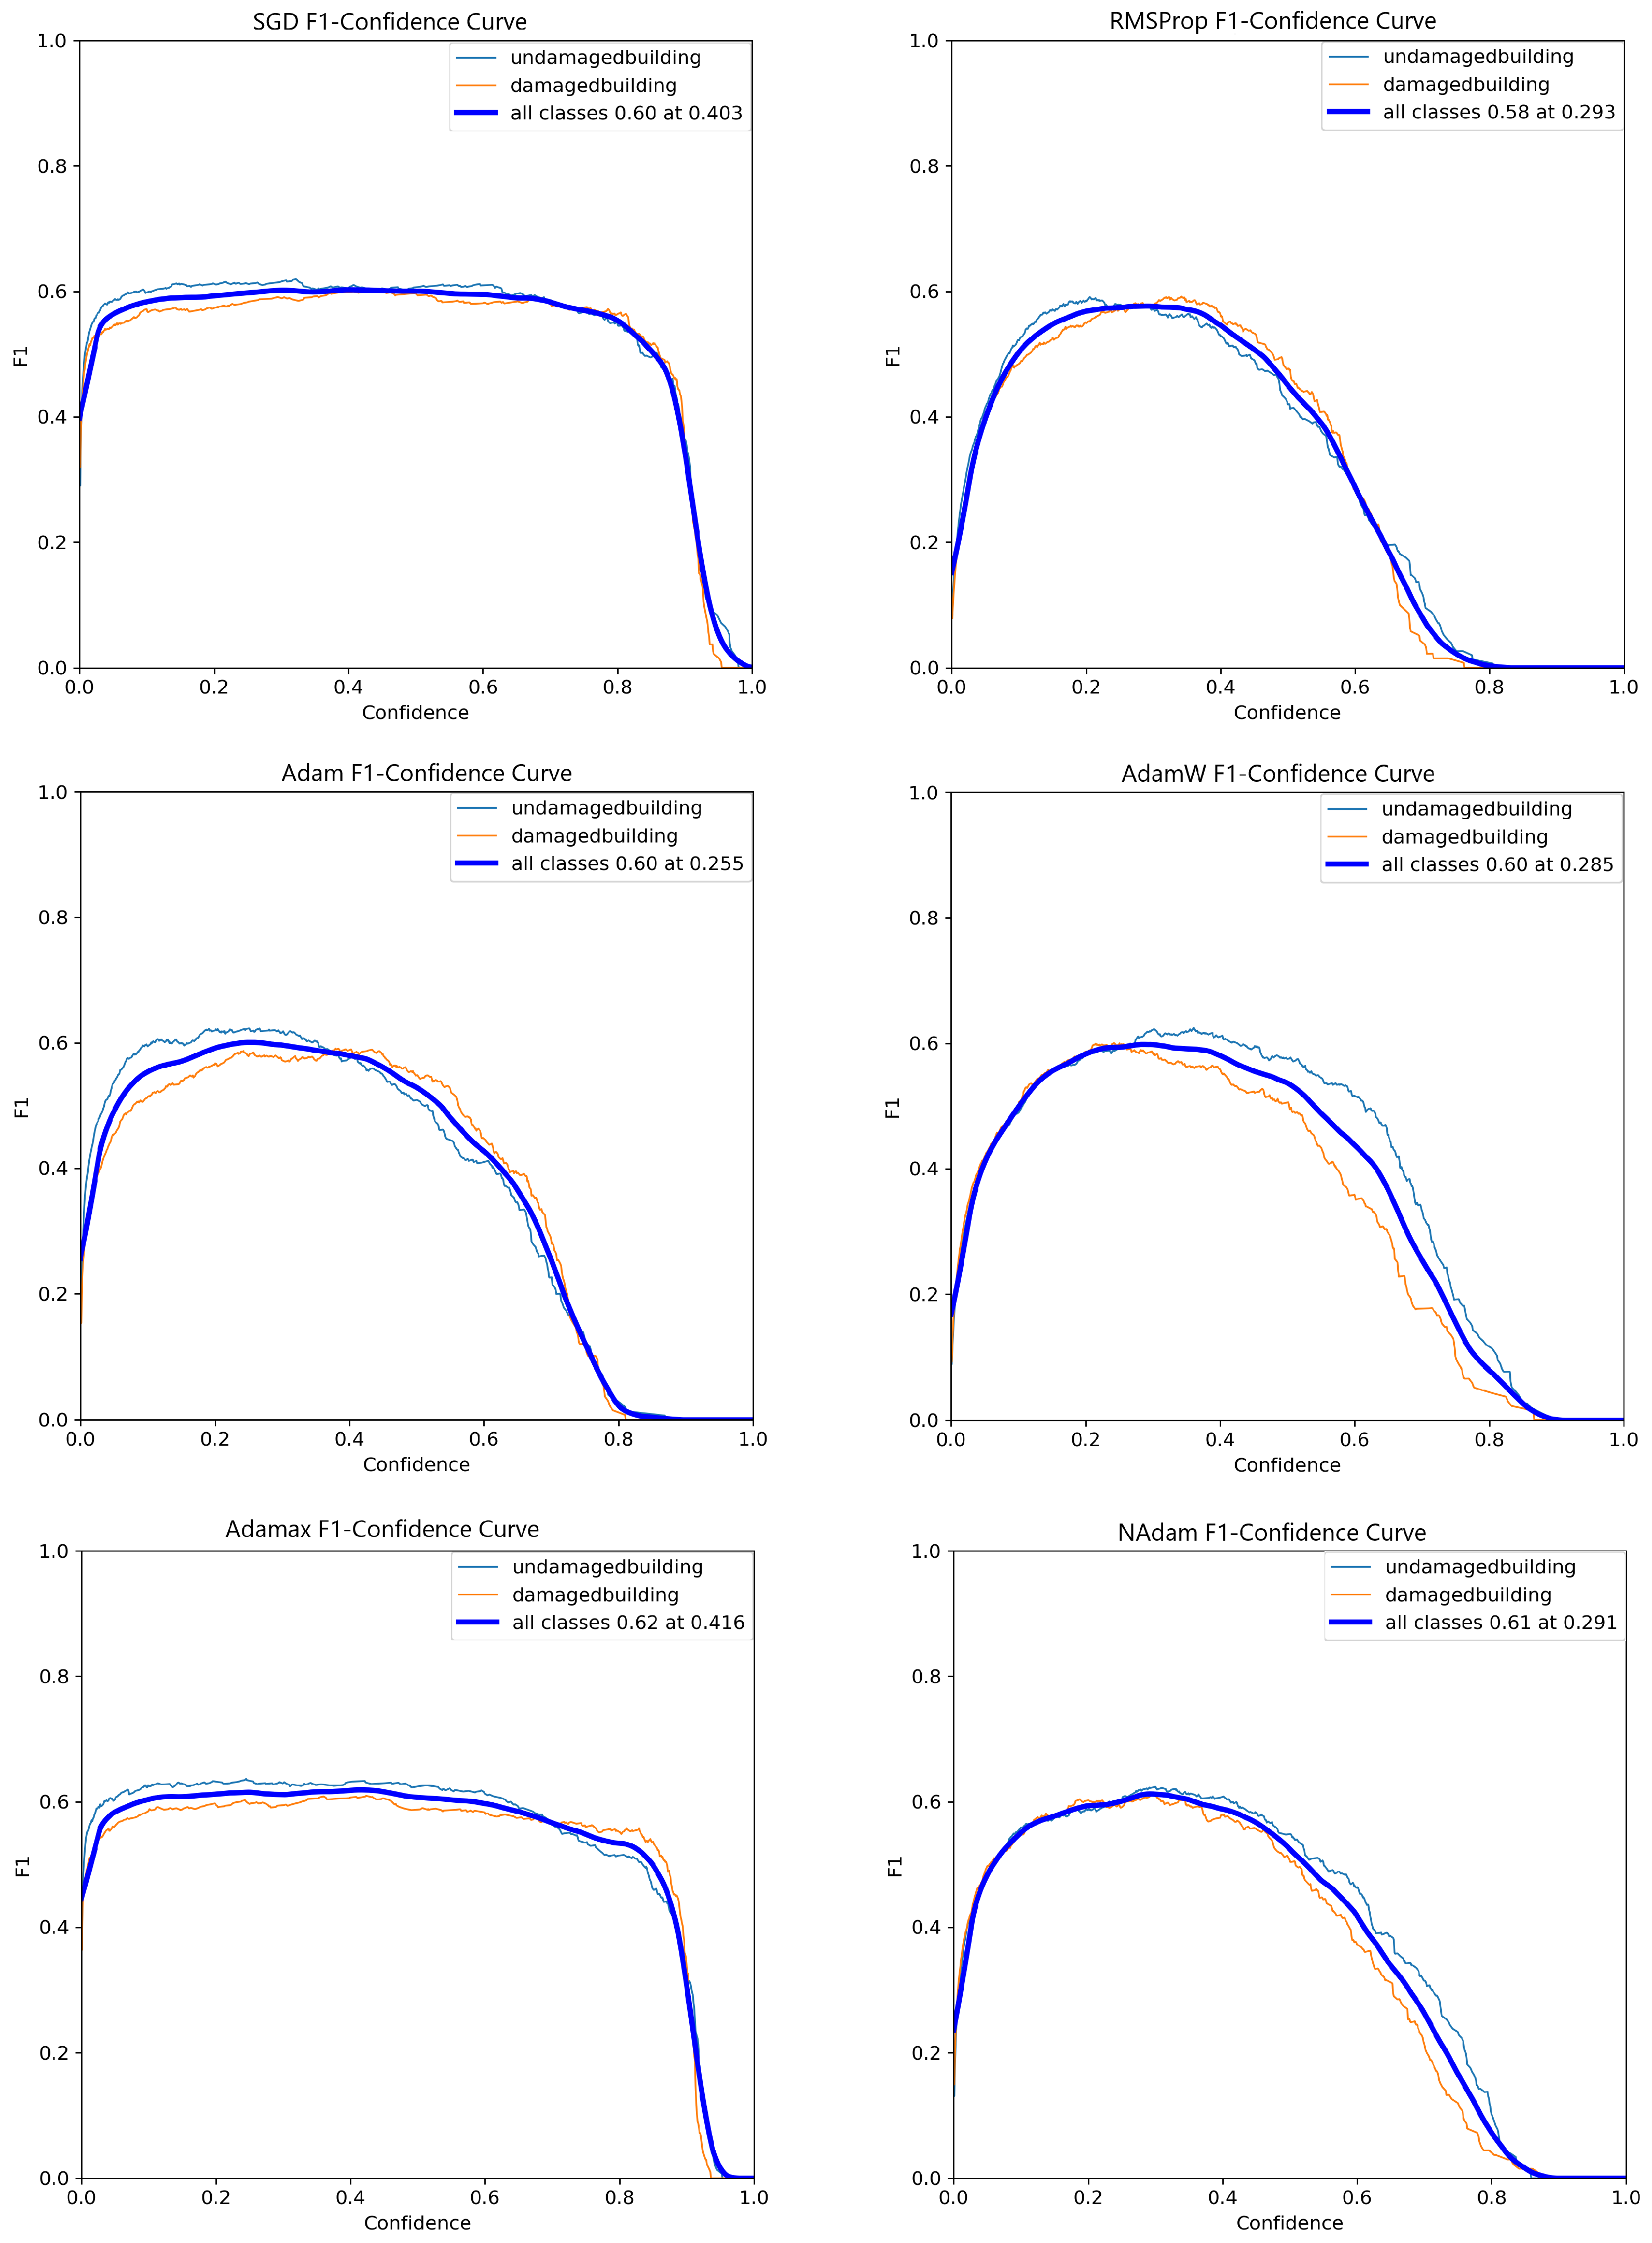
On the other hand, as shown in
Figure 4, the SGD and AdaMax optimizers stand out for their stable performance across various thresholds. Notably, while the Adam optimizer appeared promising at lower thresholds, its metrics declined sharply at higher thresholds, such as 0.8. This observation underscores the importance of selecting stable optimization algorithms, particularly for tasks requiring consistent performance across a wide range of thresholds. SGD and AdaMax demonstrate superior stability in this context, with minimal performance loss even at thresholds exceeding 80%. Their robustness makes them highly suitable for this research, where training models that maintain high confidence and reliability are critical.
6.2.3. Optimization Functions Loss Comparison for YOLOv8 Small Model
Regarding loss function performance, for the tests conducted on the YOLOv8 Small model, opting for a more complex architecture resulted in a larger performance gap between optimization functions. As shown in
Figure 5, the SGD optimizer demonstrated a significant advantage over the other optimization functions.
Conversely, under the same conditions but with varied architecture, the RMSProp optimizer exhibited much more stable training with the Small model than with the Nano model. This suggests that RMSProp is highly sensitive to the underlying architecture, requiring more complex models to perform effectively. In contrast, optimizers like AdamW and SGD demonstrated greater stability across varying architectures, highlighting their robustness in diverse scenarios.
Finally, the overall loss values were reduced when using the Small architecture compared to the simpler Nano model. This observation underscores the benefits of employing more complex architectures for better training performance.
6.2.4. Optimization Functions Performance Comparison for YOLOv8 Small Model
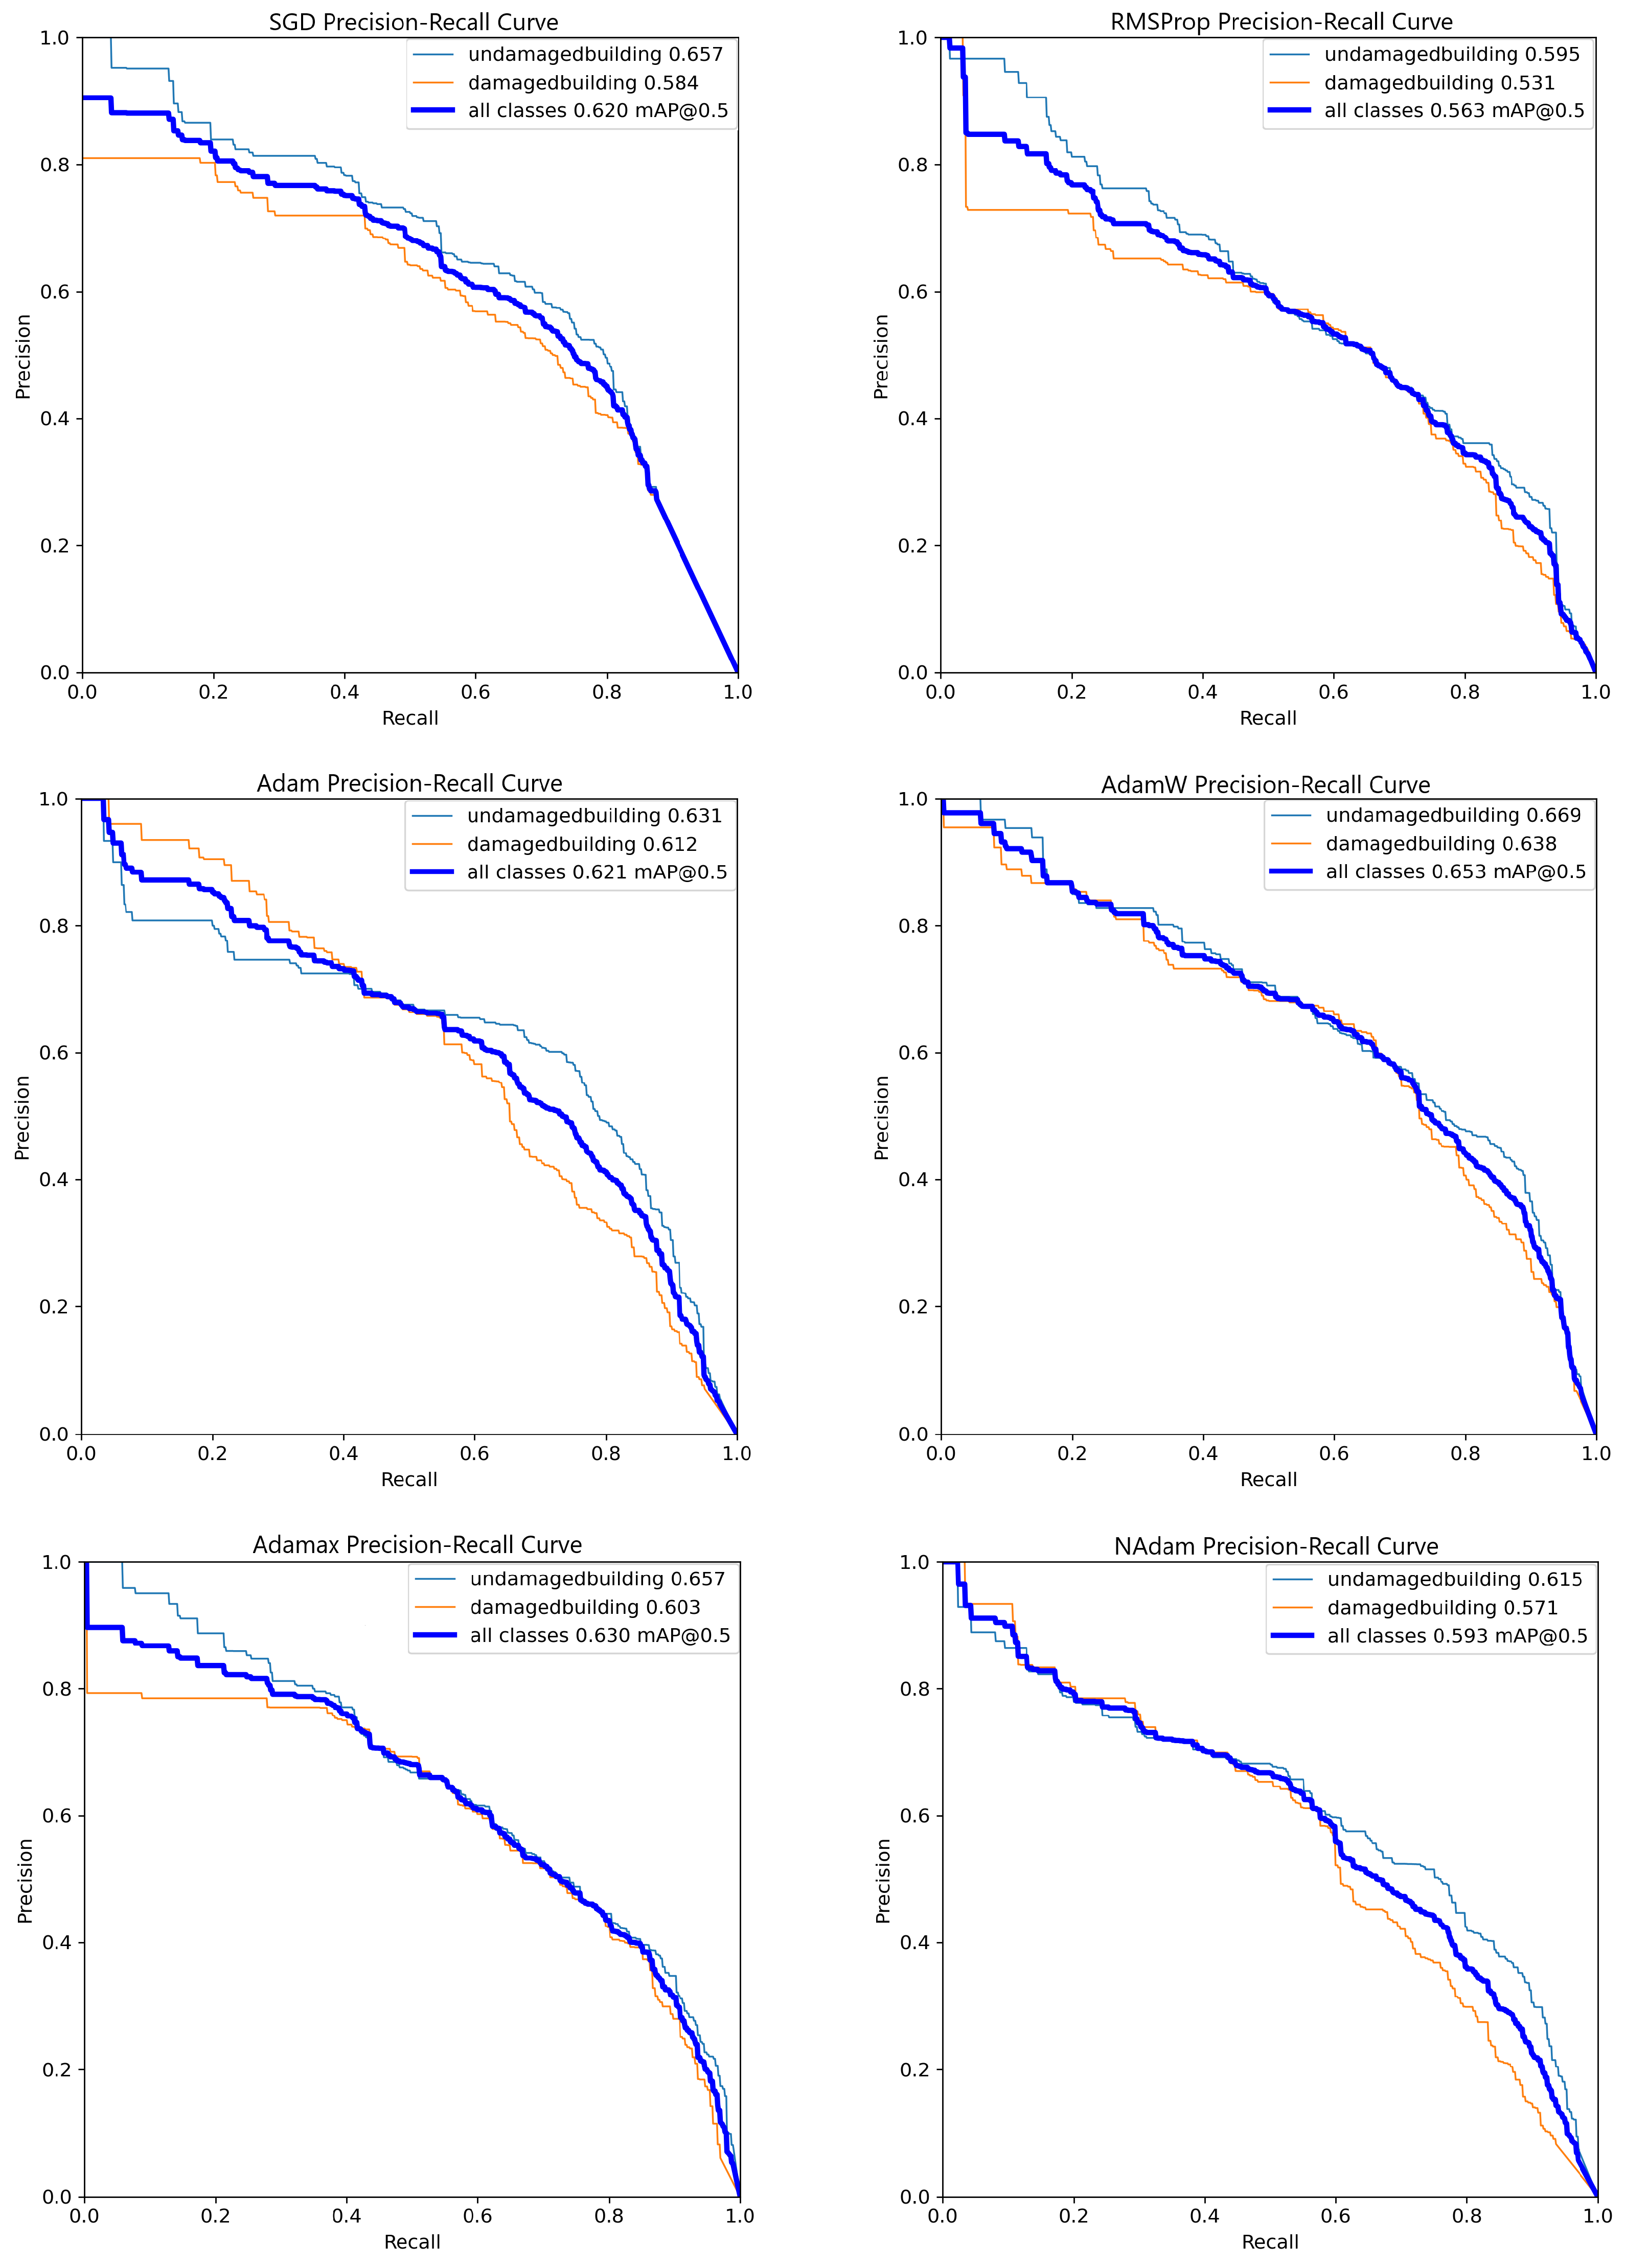
In terms of the PR curve, as illustrated in
Figure 6, AdamW demonstrated the best performance, achieving an mAP@50 of 0.653 and surpassing the other optimizers by margins ranging from 3% to 14%. Additionally, while SGD, AdaMax, and AdamW exhibited superior performance with the Small architecture, RMSProp, Adam, and NAdam performed better with the Nano architecture. Overall, AdamW consistently demonstrated the best performance under the PR curve evaluation criteria across all tests conducted so far.
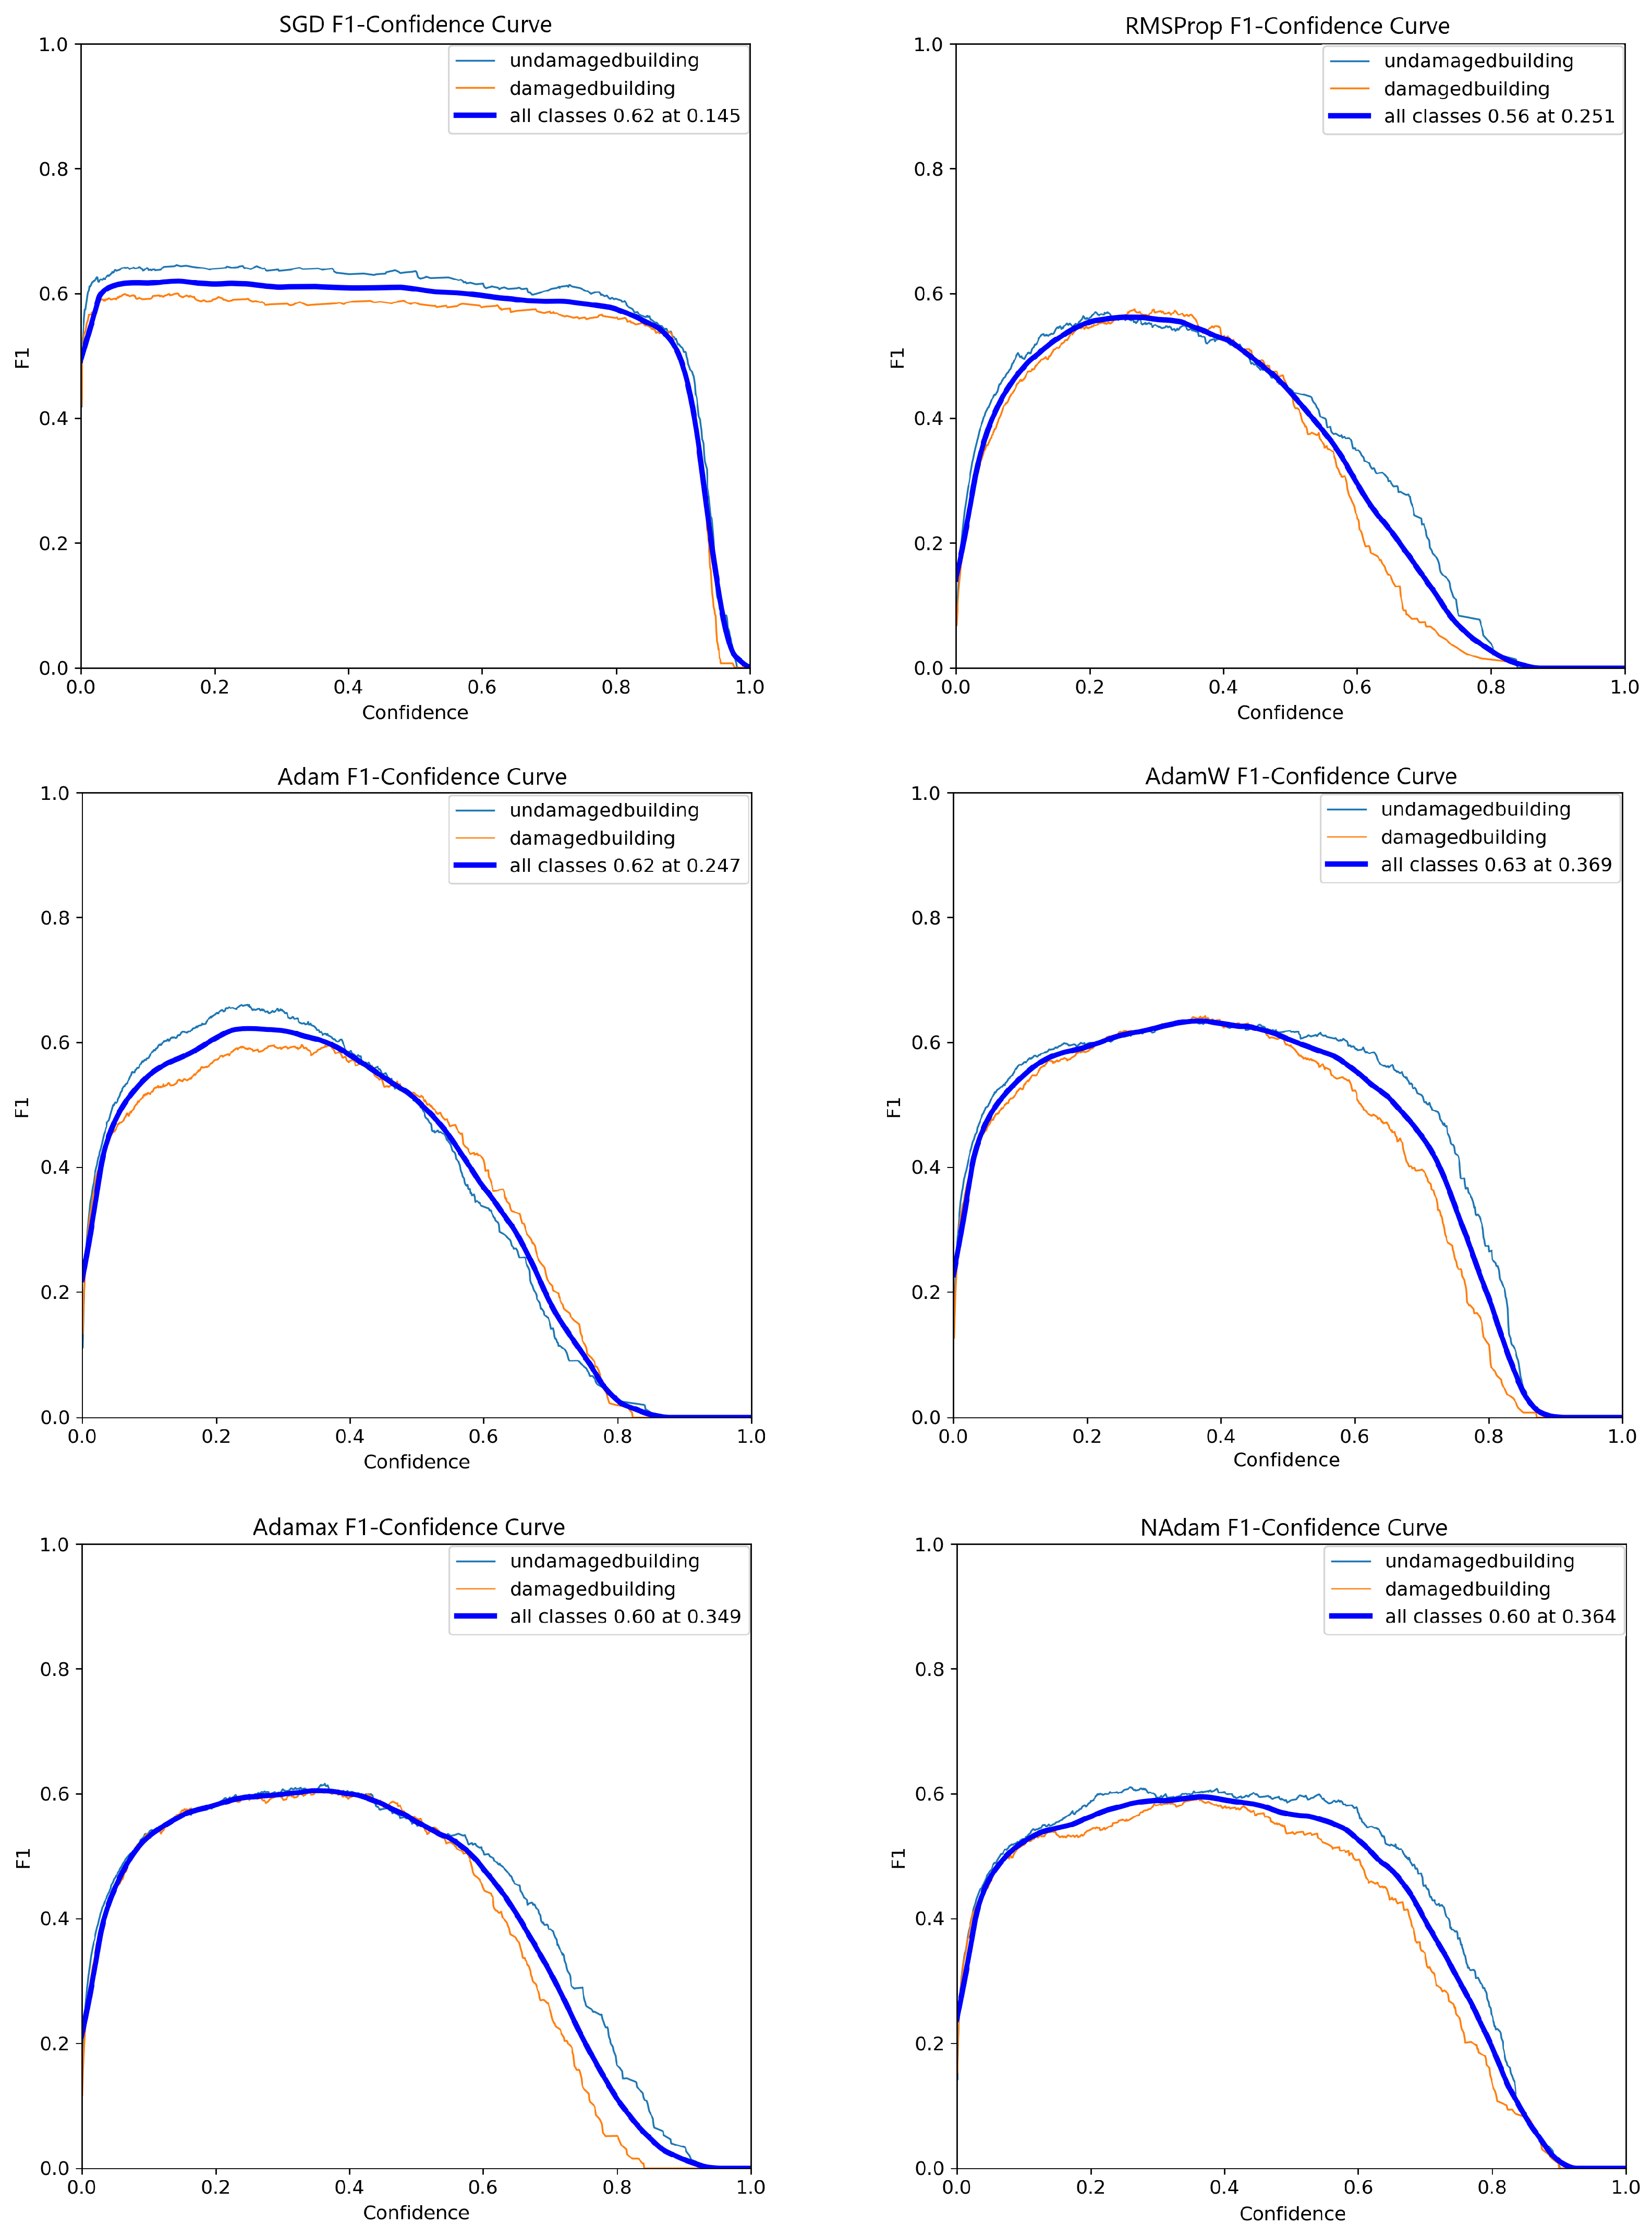
Conversely, as shown in
Figure 7, most optimizers displayed non-linear behavior in their F1 score curves, with a significant decline beyond a confidence threshold of 0.6. Notably, the SGD optimizer maintained a relatively stable performance, with minimal degradation, up to a confidence threshold of nearly 90%. This consistent performance places SGD well above its competitors in terms of stability and reliability at higher thresholds.
The YOLOv8 Small model demonstrated the best overall results; it was selected for further testing. The SGD and AdamW optimizers were also chosen for hyperparameter fine-tuning due to their superior performance and stability in the previous evaluations.
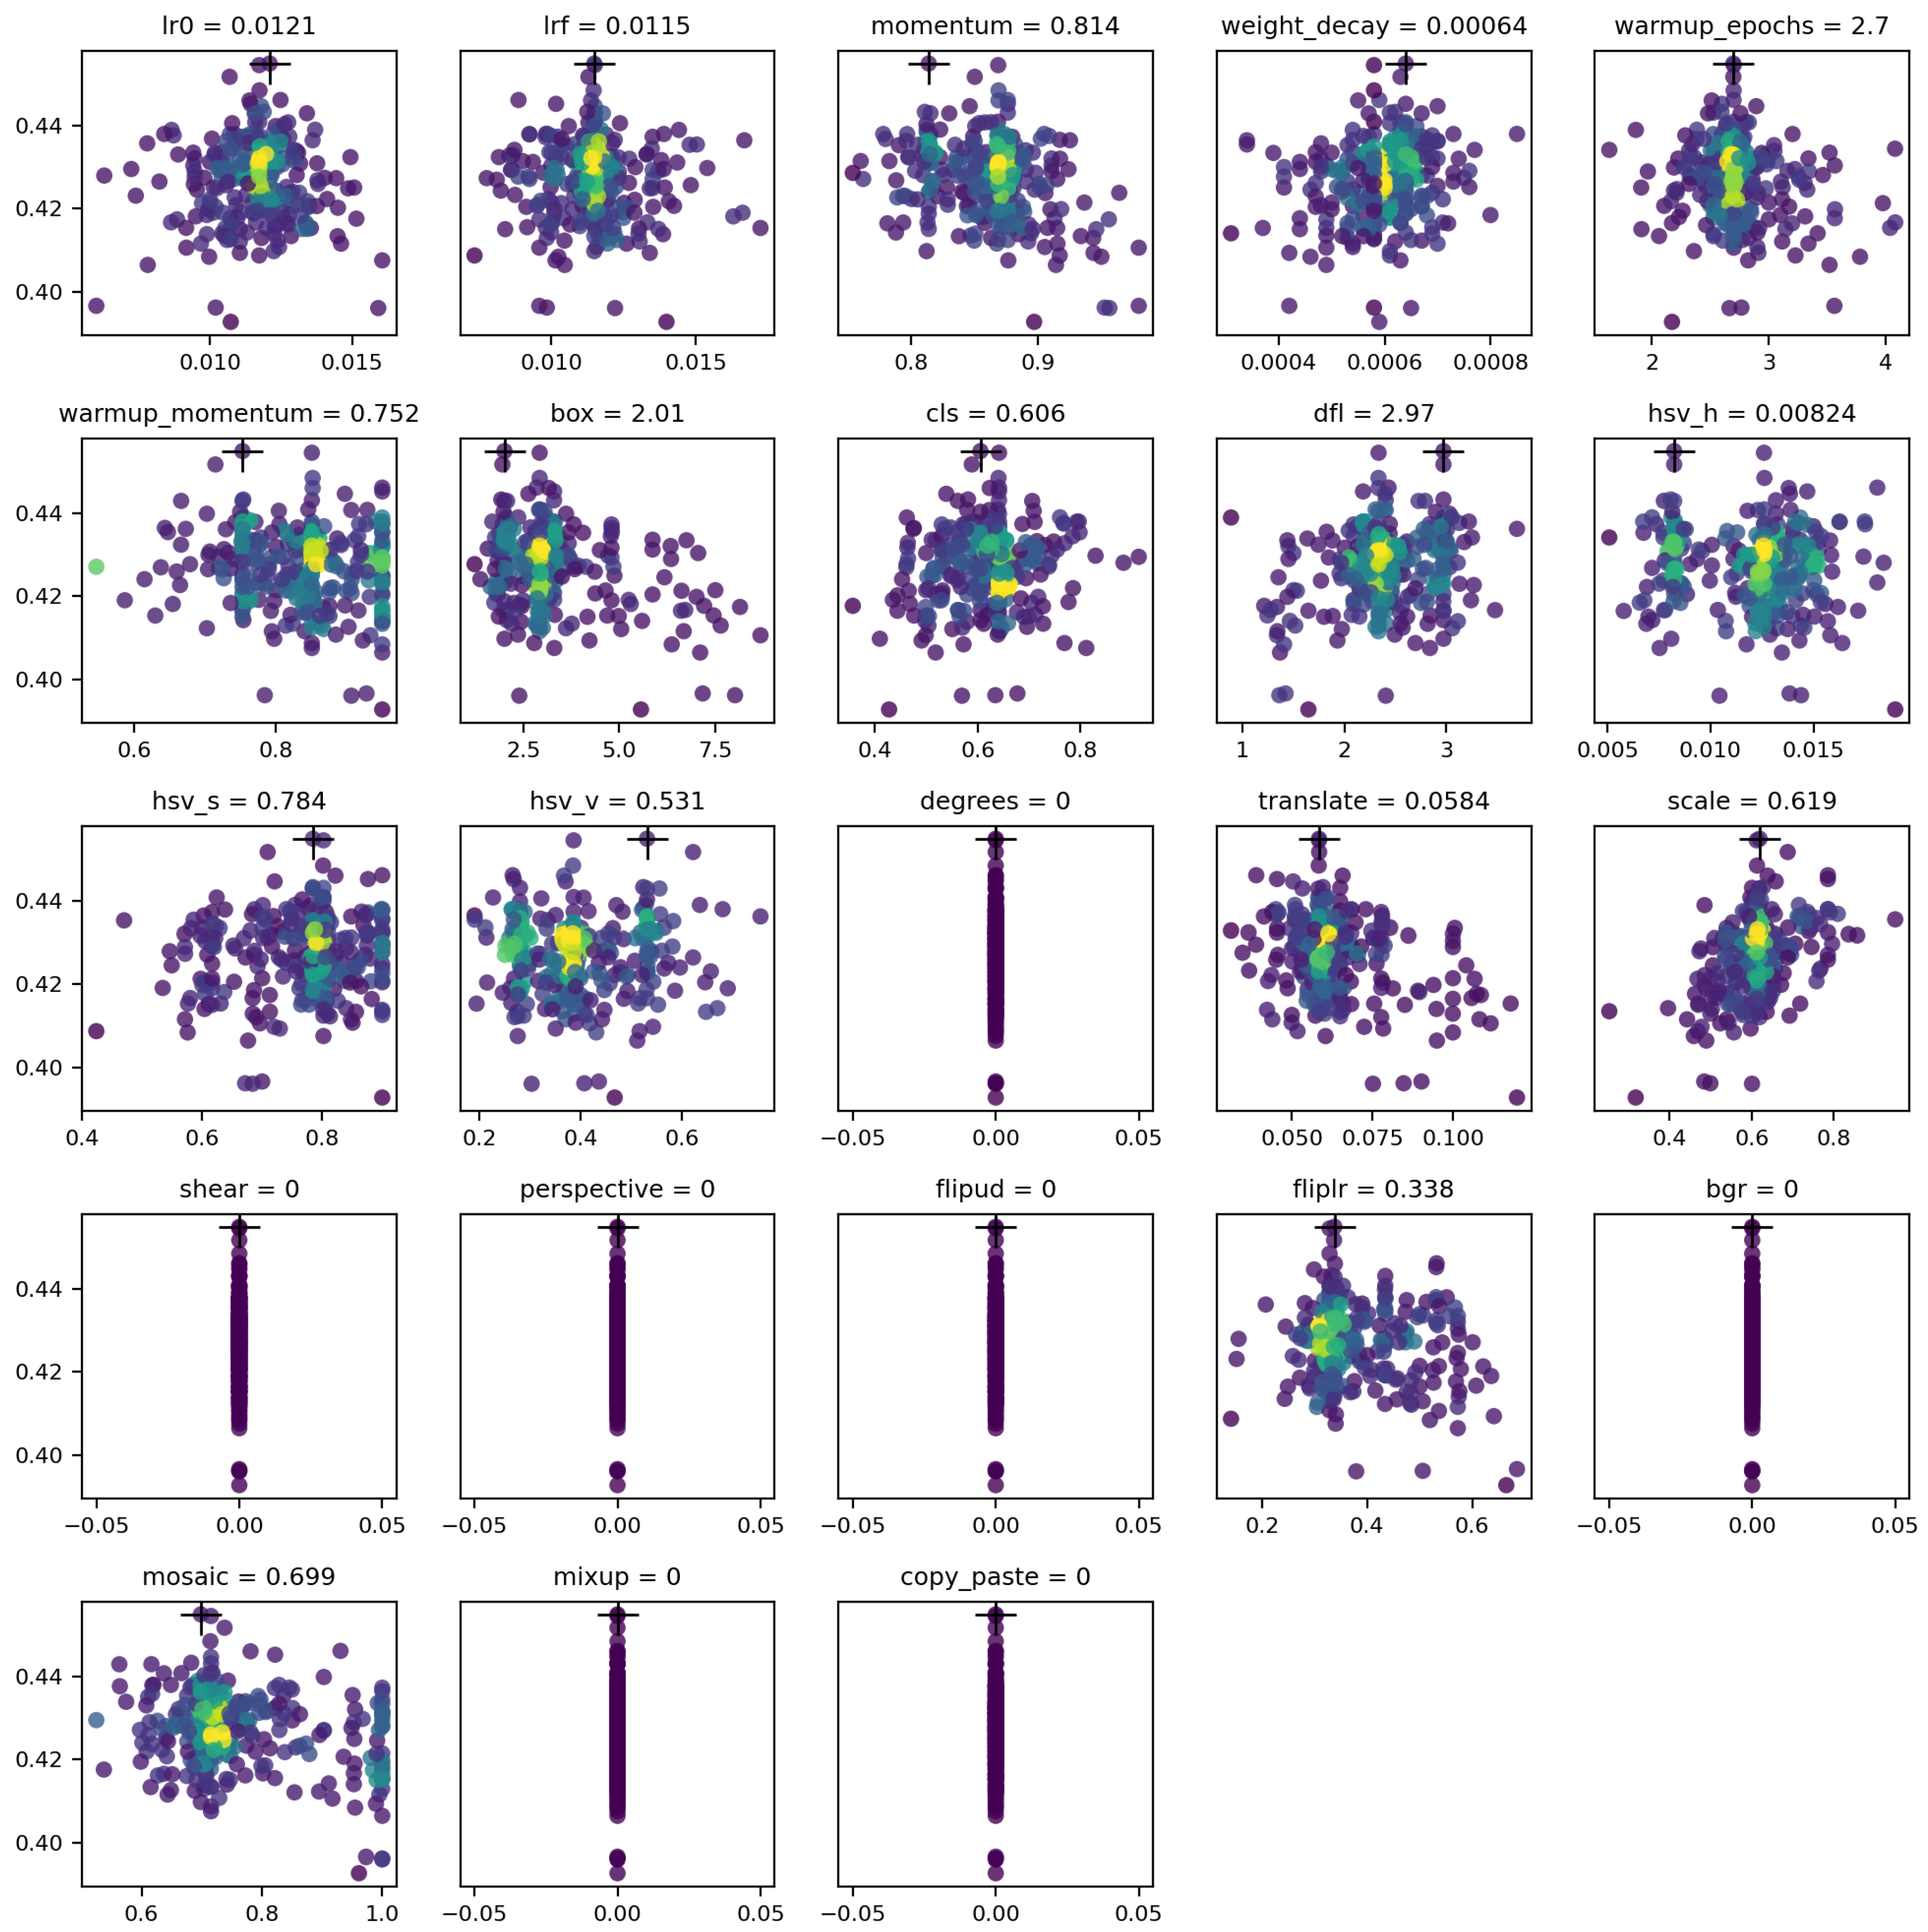
6.3. Hyperparameter Tuning
The 300-generation tests for each optimizer revealed competitive results, with the final hyperparameters shown in
Figure 8. The SGD optimizer, being a slightly simpler algorithm, was approximately 4% faster than the AdamW optimizer. However, the best hyperparameters were achieved by outlier configurations located away from the main clusters and marked with a cross in the images. Hyperparameters not explored are represented as a straight vertical line at 0.
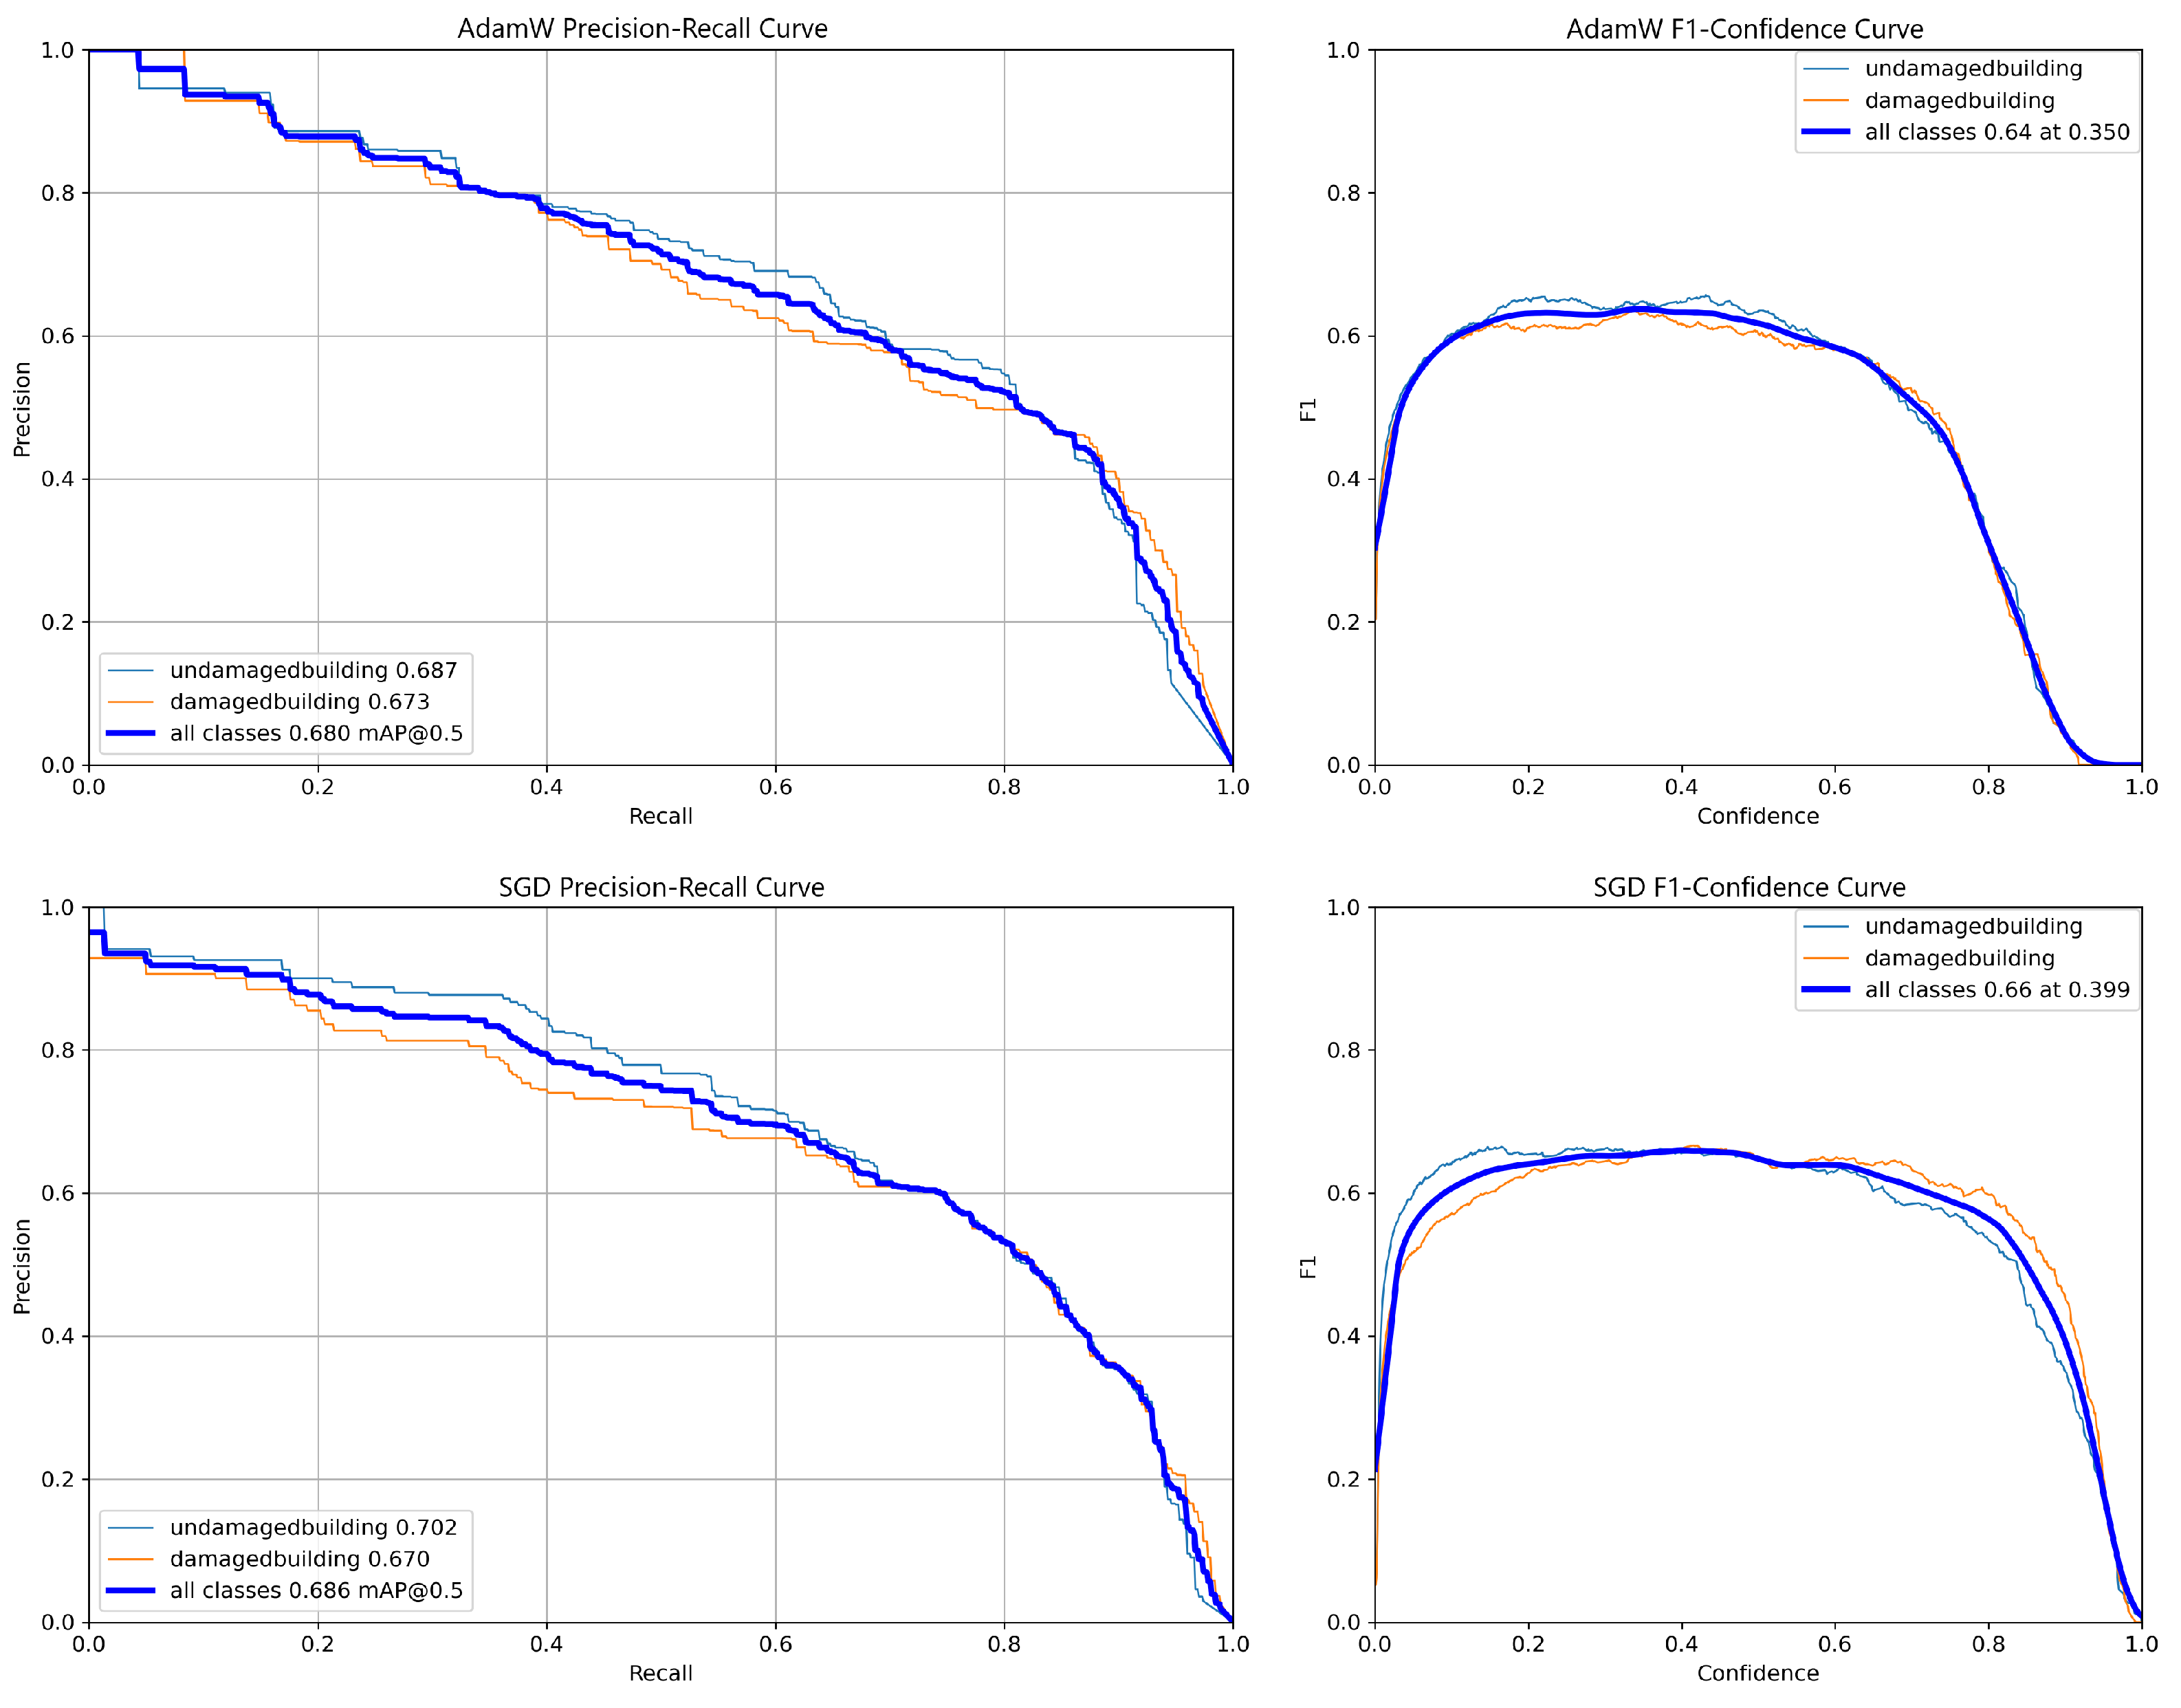
In terms of performance, as shown in
Figure 9, both models achieved competitive results. The SGD model slightly outperformed the AdamW model, with an mAP@50 of 0.686 compared to 0.680. Additionally, regarding stability, both models performed similarly, although SGD surpassed AdamW with an F1 score of 0.66 at a confidence threshold of 0.399, compared to an F1 score of 0.64 at a confidence threshold of 0.350. This indicates that the SGD model maintained better performance and reliability at higher confidence thresholds.
Finally, the graphs illustrate that SGD demonstrated more stable training over the 100 epochs, maintaining its performance at higher confidence thresholds than AdamW. Based on these findings, SGD outperformed AdamW in all evaluated aspects, including the PR curve, F1 score, and training stability, and is thus selected as the optimal optimizer for the current research.
6.4. Final Model
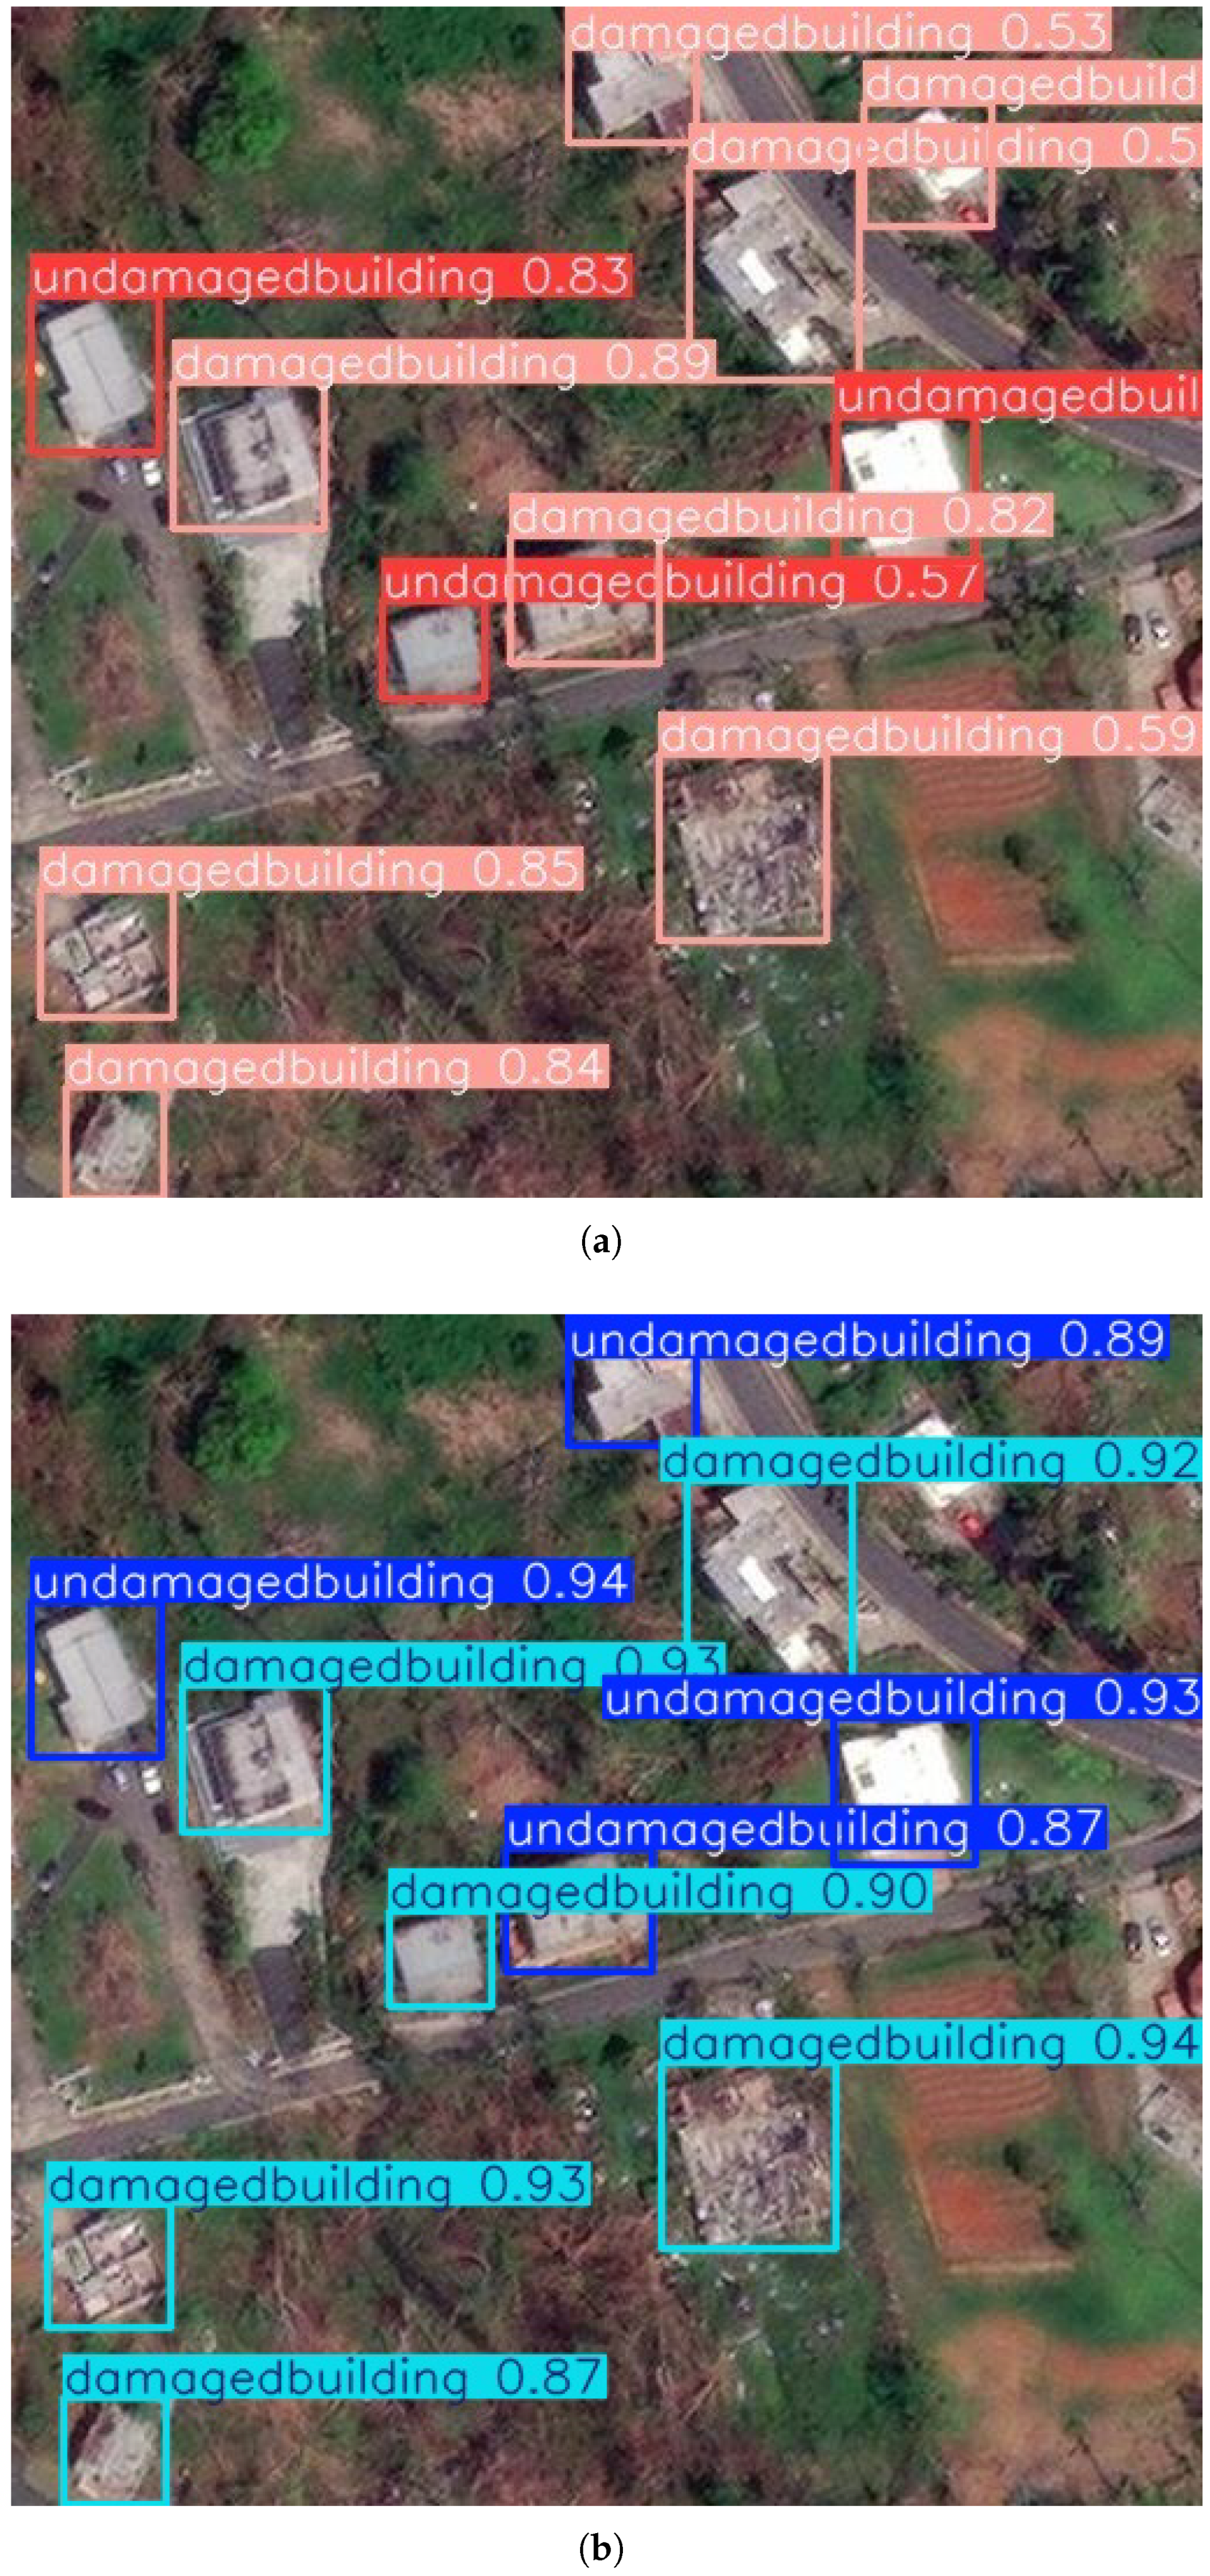
The final model differs significantly between the initial and extended versions. The following sections outline each version’s results, metrics, and strengths, and
Figure 10 provides a comparative example of their predictions. In this figure, the images display the models’ predictions, accompanied by a numerical confidence score ranging from 0 to 1. These values represent the model’s confidence in each prediction, with scores closer to 1 indicating higher confidence and scores closer to 0 indicating lower confidence.
To ensure a fair comparison between the models, the initial version was evaluated using a confidence threshold of 0.5, filtering out predictions with less than 50% certainty. Its performance was analyzed at mAP@50. In contrast, the extended version was evaluated using a stricter confidence threshold of 0.85, illustrating its performance at mAP@85. The results of each version are presented as follows:
6.4.1. First Version
In the initial version of this research, the final step involved hyperparameter optimization and dataset enrichment. The dataset enrichment process included manually adding labeled images to address scenarios where detection errors occurred. Under these conditions, the final model metrics are defined as follows:
mAP-50: 0.773.
- -
mAP-50 Damaged buildings: 0.753.
- -
mAP-50 Undamaged buildings: 0.786.
Precision: 0.70.
Recall: 0.78.
These results were obtained without freezing any layers, using a batch size of 16, and leveraging YOLO’s automatic random image augmentation. The model was optimized with the AdamW optimizer, employing an initial learning rate of 0.00026672 and a momentum of 0.9.
6.4.2. Extended Version
In contrast to the first version of this research, the final model in the extended version incorporated stronger regularization factors that were absent in the initial version. These adjustments resulted in more stable training but reduced performance. The metrics for this version are as follows:
mAP-50: 0.686.
- -
mAP-50 Damaged buildings: 0.702.
- -
mAP-50 Undamaged buildings: 0.670.
Precision: 0.645.
Recall: 0.687.
Figure 8 presents the optimal hyperparameters determined during the tuning process for this scenario.
6.4.3. Model Comparison
As illustrated in
Figure 10a, the first version of the model effectively identified severely damaged buildings. However, the results indicate that the model struggled to differentiate structures with minor damage, particularly in the upper-right corner of the image. In these cases, the model produced predictions with relatively low confidence scores of around 0.5.
Two key scenarios highlight areas of uncertainty: an undamaged building incorrectly classified as damaged, and a correctly identified but slightly damaged building, both assigned low confidence scores. These observations suggest that the model had challenges distinguishing subtle differences, likely due to similarities in visual features between slightly damaged and undamaged structures.
On the other hand, the predictions from the second model, as shown in
Figure 10b, demonstrated a significant improvement in confidence. Notably, the predictions were made using a higher confidence threshold of 0.85, illustrating the model’s performance at mAP@85. The image shows that the model correctly identified most buildings, with predictions made at confidence levels close to 90%. However, in the upper-right corner, the image highlights one exception where the model could not identify a building with high confidence, instead assigning a lower confidence level.
Although one building was not identified with high confidence, using this threshold ensures that the model only presents predictions for which it is highly certain. It is important to strike a balance between the confidence threshold and the mAP, but a higher threshold was necessary for this specific scenario.
The images demonstrate that although the first model achieves better precision and recall metrics (resulting in a greater identification of buildings), the second version performs comparably and delivers highly promising results. Notably, the second model provides a significant advantage in confidence, which is critical for ensuring that the model avoids including incorrect predictions with low confidence scores. Such erroneous predictions could act as noise and substantially impact the model’s deployment in real-life scenarios.
Finally, these findings also indicate that there is still work to be performed. Progressive retraining with a larger dataset is necessary further to enhance the model’s overall performance and generalization capabilities.
Figure 10.
Comparison of model predictions between the initial and extended versions of the research: (a) Predictions from the initial version of the model, evaluated at a confidence threshold of 0.5, illustrating performance at mAP@50. (b) Predictions from the extended version of the model, evaluated at a confidence threshold of 0.85, illustrate performance at mAP@85.
7. Deployment
In order to determine and approach the required instances and resources for our solution, San Andrés Island was chosen as a case study. As one of Colombia’s main tourist cities, San Andrés covers about 26 square kilometers and is regularly affected by tropical storms, which persistently impact its residents. In this sense, the island’s high vulnerability to natural disasters and its regional importance make it a suitable choice for estimating necessary resources.
Primarly, the total number of images needed to assess the city must be calculated:
Next, the infrastructure for deployment needs to be established. For this reason, Microsoft Azure was chosen as the cloud provider, utilizing Azure Machine Learning Services.
From the available choices, compute-optimized instances with a high CPU-to-memory ratio were selected for testing. With the aim of achieving an optimal balance between performance and cost, as shown in
Table 3, the F8s V2 instance emerged as the most appropriate option. Based on tests, this instance can process 810 images in about 5 min. As a result, the total projected cost for deploying a dedicated instance, designed to handle live requests continuously (24/7), is approximately USD 1297.20 per year, assuming a commitment to a minimum 3-year plan.
8. Conclusions
Our proposal demonstrated rapid image processing, being able to evaluate an area the size of San Andrés in roughly five minutes. This capability allows for near real-time damage evaluation after a natural disaster, greatly improving decision-making and speeding up emergency response actions. In addition, deploying the model on a cloud platform could enhance coordination among government entities, providing quicker access to precise data and optimizing the planning and implementation of disaster response strategies.
In line with this goal, our comparative analysis of YOLO architectures demonstrated that lighter models can achieve competitive performance with only marginal reductions in mAP, recall, and precision. This result reinforces the viability of lightweight architectures for disaster assessment, where computational efficiency and rapid deployment are critical. However, for high-accuracy applications, more complex architectures may be preferable due to their improved feature extraction capabilities.
Additionally, although this proposal concentrated on deploying a single binary model,
Section 3.2 explored how serialized or parallel hybrid models could substantially improve performance. These hybrid models also offer a practical approach to tackling multi-class challenges by dividing them down into binary subproblems and taking advantage of its benefits. In particular, combining the YOLOv8n and YOLOv8s models could lead to superior outcomes, presenting a promising avenue for future works.
Regarding transfer learning, the developed model showed improved performance when fewer layers were frozen. Freezing 20 or more layers resulted in an mAP-50 barely surpassing 0.4, indicating a detrimental effect on model accuracy. This outcome might be linked to the chosen architectures, as more complex YOLO models, like YOLOv8x, could be more responsive to transfer learning modifications. Nevertheless, the efficacy and practicality of implementing transfer learning strategies within YOLO architectures remain an area requiring further exploration. On the other hand, augmenting the dataset with additional public images and not allowing freezing layers could provide a more effective method for enhancing model performance.
Our evaluation of optimization functions revealed that SGD with momentum consistently outperformed Adam-based optimizers, particularly in training stability, convergence speed, and resource efficiency. SGD was 4% faster than AdamW, leading to significant time and cost savings while maintaining high confidence scores nearing 90%. This result challenges the prevailing preference for Adam-based optimizers and suggests that SGD with momentum is a viable alternative for training robust disaster detection models.
Additionally, this work used the potential of genetic algorithms as a powerful tool for hyperparameter optimization by reducing potential bias and effectively finding the best model configurations. In this sense, genetic algorithms allowed us to explore new possibilities without a lengthy and resource-heavy search. In addition, these algorithms can be adapted to identify the most effective data augmentation strategies, increasing the model performance and offering clarity on which augmentations might be less important, thus simplifying the training process.
Taking into account all the obtained results (the initial and extended versions), the current version showed valuable results (roughly 35% higher confidence than the previous version) by leveraging advanced mathematical techniques. However, a little decreasing performance in other metrics was observed and can be caused to various factors such as the introduction of more robust regularization methods, a broader hyperparameter search, and the use of different optimization functions. These modifications were crucial in creating a more stable and reliable model that can be further refined and effectively applied to real-world situations.
In summary, the findings of this research highlight the importance of employing deep learning models for disaster damage detection. These models are not only cost-effective but also have the potential to be adapted for other disaster scenarios. Such an investment could enhance emergency response efficiency and, most importantly, save lives.


