Article

Improved Mixture Cure Model Using Machine Learning Approaches

Department of Biostatistics, School of Public Health, Peking University, Beijing 100191, China
*
Author to whom correspondence should be addressed.
Mathematics 2025, 13(4), 557; https://doi.org/10.3390/math13040557
Submission received: 16 December 2024 / Revised: 4 February 2025 / Accepted: 6 February 2025 / Published: 8 February 2025
(This article belongs to the Special Issue Advances in Statistics, Biostatistics and Medical Statistics)

Abstract

:
The mixture cure model has been widely used in medicine, public health, and bioinformatics. The traditional mixture cure model has limitations in model flexibility and handling complex structured data and big data. In recent years, some improved new methods have been developed. Through a literature review and numerical studies, this article discusses the advantages and disadvantages of the progressions of mixture cure models incorporating machine learning techniques such as SVMs for model improvements. Machine learning algorithms have advantages in model flexibility and computation. When combined with mixture cure models, they can effectively improve the performance of mixture cure models, distinguish between susceptible and non-susceptible individuals, and accurately predict the influencing factors and their magnitude of incidence and latency.

1. Introduction

With advancements in science and technology, alongside improvements in medical standards, phenomena of cure/long-term survivors have emerged in fields such as oncology, where cured individuals do not experience events of interest over extended follow-up periods. Traditional survival analysis methods generally treat such unobserved outcome events (such as disease recurrence or death) as right-censored data. However, the precise meaning of right-censored data is that, given sufficient follow-up time, all subjects will ultimately experience the event of interest [1]. If traditional right-censored survival analysis models are used to analyze survival data with cure/long-term survivors, it can result in biased estimates and a loss of information within the data.
To address the presence of cure in the data, researchers have proposed both mixture cure models [2] and non-mixture cure models [3] based on traditional survival analysis, with the former being the most widely used. The mixture cure model assumes that the study population consists of two parts: one susceptible group that will ultimately experience the event and another cured or non-susceptible group that will never experience it. Mixture cure models have been applied in various fields, including medicine, public health, and bioinformatics, including cancer clinical prognosis evaluation, Alzheimer’s disease risk factor analysis, and vaccine efficacy evaluation. Due to advancements in medical technology, an increasing number of diseases can now be cured or effectively controlled.
The traditional mixture cure model (LR–Cox) framework, which is based on joint logistic regression (LR) and Cox regression, has several limitations regarding model misspecification, generalizability, flexibility, and algorithm stability. To further improve the mixture cure model, researchers have attempted to integrate machine learning algorithms, such as support vector machines (SVMs), neural networks, Bayesian classifiers, and decision trees, into the mixture cure framework to address complex nonlinear association structure and imbalanced data. This article will systematically introduce research on improvements to the mixture cure model using machine learning methods, covering aspects such as the underlying principles, algorithms, and applications in real-world cases.
This article is organized as follows: Section 2 introduces the mixture cure model, along with the modeling concepts and Section 3 presents new development of the mixture cure model improved by machine learning algorithms. Section 4 discusses commonly used software packages for the mixture cure model in R 4.1.0. Section 5 reviews applications of the mixture cure model in the literature and illustrates the application of an improved mixture cure model in a cervical carcinoma study.

2. Framework of the Mixture Cure Model

The mixture cure model was proposed by Boag, Berkson, and Gage [2,4]. When covariate factors are not considered, the survival function of the mixture cure model can be expressed as follows:
S ( t ) = 1 π + π S u ( t )
where π = P (U = 1) represents the probability of being uncured, referred to as the incidence part of the model; S u ( t ) = P (T > t |U = 1) is the conditional survival function of susceptible individuals, also known as the latency part; here, U = I (T < ∞) is a latent binary variable that determines whether a subject is cured.
According to the initial mixture cure model without covariate effects proposed by Boag, Berkson, and Gage [2,4], Farewell [5] incorporated covariates into the incidence part by modeling the uncured rate using logistic regression and modeled the latency part based on an exponential distribution. Furthermore, Farewell proposed incorporating covariates into the latency part, where the survival function of susceptible individuals is determined by a Weibull distribution, with parameter estimation conducted via the Newton–Raphson technique [6]. Ghitany et al. [3] introduced a logistic/exponential mixture cure model, incorporating covariates in the latency part. Assuming a set of observed covariates X and another set Z, where Z may be the same as X, partially the same, or entirely different, the covariate-dependent mixture cure model can be expressed as the survival function S ( t x , z ) = P ( T > t X = x , Z = z ) .
S ( t x , z ) = 1 π ( x ) + π ( x ) S u ( t z )
From the formula above, it is evident that the cure rate depends solely on covariate X (independent of Z), while the conditional survival function of susceptible individuals depends exclusively on covariate Z (independent of X). This is a key advantage of the mixture cure model, as it enables separate consideration of the effects of covariates on the uncured portion and those on the survival function of susceptible individuals. Additionally, it enables the assessment of different impacts of the same or different covariates on these two components. Furthermore, by modeling assumptions on π x and S u ( t z ) , a series of studies have emerged on parametric, semi-parametric, and non-parametric mixture cure models.
Kuk and Chen [7] extended the parametric mixture cure model from Farewell [6], where covariates influence the failure distribution of susceptible individuals through a Cox model. Peng and Dear [8] proposed a marginal likelihood approximation method for the latency part based on the EM algorithm. Lu [9] studied the logistic/Cox mixture cure model using a non-parametric maximum likelihood estimation approach, focusing on the non-parametric estimation of the baseline cumulative hazard function from step functions. Li and Taylor [10] considered a semi-parametric accelerated failure time model for the latency part and conducted research on this model based on M-estimation methods. Zhang and Peng [11] extended the EM algorithm to the logistic/accelerated failure time mixture cure model. Eni Musta et al. [12] focused on the cure rate and proposed a two-step method to improve the maximum likelihood estimator when the sample size is small.
The traditional mixture cure model has certain limitations. For instance, parametric mixture cure models have applicability constraints; if the survival time follows the expected distributions, such as log-normal [2], Weibull [5], exponential [3], log-logistic, or gamma distributions [13,14], the conclusions drawn are more accurate. However, if the actual distribution deviates from these assumptions, significant biases can occur. In practical applications, determining the correct distribution type is often challenging, which may lead to biases. Semi-parametric mixture cure models [15], also known as proportional hazards mixture cure models, do not require consideration of the survival time distribution type, and the effect estimates are expressed as hazard ratios (HRs), making the results easier to interpret. However, these models rely on the Cox proportional hazards model [1] when fitting non-cured populations, which requires that survival times meet the proportional hazards assumption, meaning the hazard ratios remain constant over time. Cumulative risk curves can be used to assess this; if the curves cross, it indicates a violation of the proportional hazard assumption. Testing the proportional hazards assumption can be difficult with small sample sizes. If survival times do not meet this assumption, using a proportional hazards cure model may yield unreliable results. Non-parametric mixture cure models are computationally complex and require larger sample sizes.

3. Improved Mixture Cure Models Based on Machine Learning

A search using the keyword “mixture cure model” in PubMed returned 142 relevant articles in June 2024. After screening, 11 articles focused on enhancing mixture cure models using machine learning methods [16,17,18,19,20,21,22,23,24,25,26], while 42 discussed statistical computation or algorithm or software development related to these models. Additionally, there were 49 articles on the applications of mixture cure models in the medical field, while the remainder focused on non-medical applications. A summary of the research on enhancing mixture cure models through machine learning methods is presented below.

3.1. Improvement of Mixture Cure Models Based on Neural Networks

Given that the core of the mixture cure model is the failure time model, several studies have indicated that replacing the linear formula of the log hazard ratio (e.g., Cox proportional hazards) or the parametric failure time density (e.g., AFT) with neural networks can improve performance, particularly in large datasets [27,28,29]. Building on this, research by Matthew Engelhard et al. [16] demonstrated that the disentangled neural mixture cure model (DNMC) effectively separates failure time information from failure probability information, drawing on parallels with causal inference and representation learning. This reduces the impact of selection bias from observed failures and censored times on the estimation of failure density and censoring density. In a real dataset, the authors repeated 24 different censoring schemes, and the results consistently showed that the neural mixture cure model (NMC) outperformed LR–Cox. Additionally, the performance of the DNMC model was comparable to or better than that of NMC, while also distinguishing between factors predicting failure occurrence and timing and mitigating biases present in real-world observational datasets.
Medical images or biomarkers derived from them are key predictive factors in survival models; however, integrating images into portal communication module (PCM) using traditional non-parametric methods (such as splines) presents certain challenges. Xie et al. [17] used neural networks to model the effects of non-parametric or unstructured predictors in the PCM context. They used a neural-network-based m-step expectation–maximization algorithm for parameter estimation. This method fits θ using neural networks, redefining θ ( x ) = e η ( x ) and remapping η ( x ) . The model can be expressed as follows:
η ( x i ) = a c t ( a c t ( B 2 T a c t ( B 1 T x i + b 1 ) T + b 2 ) T β 3 ) ,
where “act” refers to the activation function, which introduces nonlinearity to enhance model’s flexibility. In a simulation study, it was found that when the dimensionality of covariates is low and the true θ(x) has an additive functional form, the spline PCM method also performs well, exhibiting predictive and estimation capabilities comparable to those of the neural network PCM method. However, the neural network PCM method offers greater flexibility and is better suited for complex or unstructured predictors.

3.2. Improvement of Mixture Cure Models Based on Bayesian Classifiers

Oswaldo Gressani et al. [18] combined Laplace approximation with penalized B-splines to propose a fast and flexible Bayesian inference strategy for mixture cure models without sampling. The cure rate was modeled using logistic regression, and a P-spline was employed to approximate the baseline hazard in the Cox proportional hazards model, fitting the conditional survival function for susceptible subjects. The Laplace approximation of the posterior conditional latent vector relied on analytical formulas for the gradient and Hessian of the log-likelihood, significantly accelerating the speed of the posterior distribution approximation. Spline regularization produces smooth estimates of survival curves, and the functions of the latent variables, along with their associated credible intervals, can be estimated in just a few seconds. Additionally, a fully stochastic algorithm based on the Metropolis–Langevin–Gibbs sampler was proposed as an alternative to the Laplace-P-spline mixture correction (LPSMC) method. Simulation studies assessed the statistical performance and computational efficiency of the LPSMC method. The results indicated that LPSMC offers advantages over MCMC for approximate Bayesian inference in standard mixture cure models.
Sandra M et al. [19] found that the Bayesian hierarchical cure rate survival model for spatially clustered event data outperforms existing models. This model incorporates a mixture cure rate model with covariates and a flexible (semi-)parametric baseline survival distribution for uncured individuals. The spatial correlation structure is introduced as frailty, which follows a multivariate conditional autoregressive distribution based on a pre-specified mapping. Standard posterior estimates are obtained, and smoothing is applied using regional-level plots of spatial frailty and cure rates. Simulation studies indicate that the relative bias and mean squared error of model parameters with spatially correlated frailty are lower than those using simple frailty models. In the analysis of survival times for Hodgkin lymphoma patients, a high degree of spatial correlation was found (α > 0.90), and models incorporating spatial frailty outperformed those without it in terms of log LPML and Bayesian factors.
Wang et al. [20] proposed a Bayesian semi-parametric approach to estimate the cure probability, survival distribution parameters, and density distributions for uncured patients in the AFTMC model, with the baseline error distribution modeled by MDP. The Bayesian AFTMC model allows for precise posterior distributions of parameters to be obtained through MCMC algorithms, eliminating the need for large-sample asymptotic distributions. Simulation results demonstrated good performance under various conditions, and the method can be easily implemented in R 4.1.0 for practical applications, with short computation times.
Chun Pan et al. [21] used a semi-parametric Bayesian approach for proportional hazards mixture cure models suitable for interval-censored data with cure fractions. They used a linear combination of I-splines to approximate the cumulative baseline hazard function and applied a two-step Poisson data augmentation for posterior computation. Their simulation study demonstrated that their method exhibits smaller bias, better standard error estimates, and improved coverage compared to the generalized odds mixture cure model for interval-censored data proposed by Zhou et al. (2018) [22].

3.3. Improvement of Mixture Cure Models Based on Support Vector Machines

Peizhi Li et al. [23] modeled the covariates of the incidence part of a semi-parametric mixture cure model using SVMs, providing a flexible framework to assess the impact of these covariates on incidence. This approach accommodates potentially high-dimensional covariates in the incidence part. In a simulation study, in the incidence part of the SVM-MC model, π z i represents the probability that a subject with covariates z i belongs to the uncured group, with π z i [ 0,1 ] , π ( k ) ( z i ) ^ denoting the estimated probability from the model. The values of π ( k ) ( z i ) ^ π ( z i ) were often closer to 0 compared to those from the Logistic-MC model, indicating that the SVM-MC model outperformed the Logistic-MC model in correctly classifying subjects into cured and uncured groups. In the latency part, when the baseline incidence structure could not be approximated by the Logistic-MC model, the mean squared error and misclassification rate of the proposed mixture cure model were lower than those of the existing Logistic-MC model, with the SVM-MC model’s latency survival estimates closely approximating the true latency survival function.
Suvra Pal et al. [24] proposed a novel mixture cure model based on interval-censored data that utilizes SVMs to model the covariates of uncured individuals or the cure rate (i.e., the incidence part of the model). This approach better simulates nonlinear and more complex data classification boundaries. The latency part is modeled using a proportional hazards structure with an unspecified baseline hazard function. Their simulation study results indicate that this model provides superior estimation of complex classification boundaries compared to mixture cure models based on logistic regression and spline regression in the context of interval-censored data.

3.4. Improvement of Mixture Cure Models Based on Decision Tree Classifiers

Wisdom Aselisewine et al. [25] proposed a mixture cure model that uses decision tree classifiers to model the incidence part while retaining the proportional hazards structure in the latency part. The proposed model is easy to interpret, mimics human decision-making processes, and offers flexibility in assessing both linear and nonlinear effects of covariates. Simulation studies indicate that this model outperforms both logistic regression and spline-based mixture cure models in terms of model fitting and predictive accuracy [25].

4. Algorithms and R Packages for Implementing Mixture Cure Models

4.1. Overview

The implementation of mixture cure model algorithms provides various software package options in R 4.1.0. Table 1 summarizes publicly available R packages for mixture cure models along with their descriptions. As pioneers, Peng et al. (1998) [26] developed the R package ‘gfcure’ for the accelerated failure time mixture cure model (AFTMC model). For the proportional hazards mixture cure model (PHMC model), Peng (2003) [30] developed the S-Plus package ‘semicure’ for the semiparametric PHMC model. The ‘smcure’ package [31] further extends the functionality of ‘semicure’ within the R framework, enabling its use for both PHMC and AFTMC models. The ‘GORCure’ package, developed by Zhou et al. (2017) [22], is an R package applicable to both PHMC and the proportional odds mixture cure model.
López et al. (2017) [32] developed the R package ‘npcure’ for non-parametric mixture cure models using kernel estimation methods; however, the package has faced criticism for its computation speed. Jackson et al. (2019) [33] built the ‘flexsurvcure’ package based on the ‘flexsurv’ package, enabling flexible regression estimation for mixture cure models. Niu and Peng (2018) [34] developed the ‘geecure’ package specifically for clustered data. The ‘cuRe’ package [35] includes many useful features for fitting different types of mixture cure models, applicable to both survival function and relative survival functions for time-to-event data. The ‘nltm’ package implements a method for fitting mixture cure models within the framework of nonlinear transformation models. The ‘penPHcure’ package utilizes a penalization scheme to facilitate variable selection in mixture cure models, enabling it to handle time-dependent covariates [36].
Table 1. Publicly available R packages for mixture cure models and descriptions.
Package AuthorUsageAdvantagesDisadvantages
cuReLasse Hjort Jakobsene et al. [35]
https://cran.r-project.org/web/packages/cuRe/index.html (accessed on 1 February 2025)
Functions are employed for estimating generalized parametric mixture and non-mixture cure models, lifetime loss, the mean residual life, and crude event probabilities.(1) Includes functions that calculate a variety of useful post-estimation metrics.
(2) Fits both parametric mixture cure models for overall survival functions and relative survival mixture cure models.
(1) Excludes model diagnostics functionality.
(2) Excludes functionality for calculating cure proportions on the cumulative incidence scale.
mixcureYingwei Peng [30]
https://cran.r-project.org/web/packages/mixcure/index.html (accessed on 1 February 2025)
Used for mixture cure models.(1) Applicable to various mixture cure models.
(2) Utilizes existing R packages to fit both parametric and semiparametric cure models.
Unable to fit relative survival mixture cure models.
npcureIgnacio López-de-Ullibarri et al. [32]Non-parametric estimation within mixture cure models, including the performance of non-parametric estimation and conducting significance tests for cure probabilities.(1) Allows covariates to exert different effects on cured and uncured patients.
(2) Selectable bandwidth for non-parametric association estimation.
(1) A non-parametric method that does not estimate parameters.
(2) Estimates of cure rates are biased.
(3) Due to the nature of non-parametric methods, it cannot provide global survival estimates for uncured individuals.
smcureChao Cai et al. [31]Estimation of semiparametric PH and AFT mixture cure models.The probability component is estimated using a generalized linear model, accommodating various link functions such as logit, probit, and cloglog. The delay component can follow either a PH model or an AFT model.(1) Fitting performance is poor when covariates follow a binomial distribution with low cure rates and low censoring rates.
(2) Computational time is slow, and it is unstable during repeated calculations.
intcureYingwei Peng [37]Used for mixture cure models with random effects, as described by Peng and Taylor (2011) [37], pertaining to a mixture treatment model with random effects.Good initial values for bt, gm, and basepara obtained from mixture cure models without random effects can accelerate the program or help find optimal estimates.——
GORCureJie Zhou et al. [25]Fitting odds rate mixture cure models with interval-censored data.(1) Well-suited for handling survival data with low cure rates and low censoring rates.
(2) Results are less affected by cure rates and censoring rates, but more influenced by the distribution of covariates.
(1) Not suitable for right-censored data.
(2) Bias is relatively large in cases with high cure rates and high censoring rates.
Motahareh-Parsa
/kmcure
Mahmood-Taghavi et al. [38]Fitting a semiparametric accelerated failure time (AFT) mixture cure model using the KME-KDE (Kaplan–Meier estimation and kernel density estimation) method.————
Oswaldogressani
/mixcurelps
——Laplace approximation and p-splines for rapid approximate Bayesian inference in mixture cure models.The proportion of uncured subjects (also known as incidence) is modeled using a logit link function, while the survival function for uncured patients (latent period) is approximated using a flexible Cox proportional hazards model, with the baseline risk approximated by penalized cubic B-splines.——
nltmGilda Garibotti et al. [39] Nonlinear transformation models for analyzing survival data.The categories of nltm include the following currently supported models: Cox proportional hazards, proportional hazards cure, proportional odds, proportional hazards–proportional hazards cure, proportional hazards–proportional odds cure, gamma frailty, and proportional hazards–proportional odds.——
geecureYi Niu et al. [34]Used for estimating the marginal proportional hazards mixture cure (PHMC) model using generalized estimating equation (GEE) methods.(1) Results are stable and accurate.
(2) In the delay component and the semiparametric PHMC model, the parametric PHMC model with a Weibull baseline distribution is used to accommodate multivariable survival data with treatment scores.
Due to the need to estimate within-cluster correlation, the computational burden is substantial, resulting in lengthy processing times.
penPHcureA. Beretta et al. [36]Variable selection for time-dependent covariate proportional hazards (PHs) mixture cure models.Time-dependent covariates can be incorporated into proportional hazards mixture cure models.——
CureAuxSPJ. Ding et al. [40]Estimation of mixture cure models with auxiliary survival probabilities.External subgroup survival probabilities can be adaptively integrated into the analysis of internal survival data, using subgroup survival probabilities as auxiliary information in survival analysis.——

4.2. Simulation Study

A simulation study is carried out to assess the performance of the existing machine learning improved mixture cure models. The uncured status U in the incidence submodel is generated from the Bernoulli distribution with probability π(z) in the following scenario:
π ( z ) = e x p { 1 + 10   z 1 2 5 z 2 2 } / [ 1 + e x p { 1 + 10   z 1 2 5 z 2 2 } ] .
The failure time T of an uncured patient in the latency submodel is generated from a Cox proportional hazards model with hazard function equal to 0.5   e x p   ( 0.5 x 1 + x 2 ) . The censoring time is generated independently from a uniform distribution in [0, 30], so that the median censoring rate is around 71.6%. For each setting, 100 replication samples with sample size n = 600 are generated, and the ML improved mixture cure models using a decision tree, an SVM, and a neural network, respectively, in the incidence submodel, are implemented for comparisons in performance.
Model comparisons involve assessing metrics such as the empirical bias (Bias) and mean squared error (MSE) of quantities of interest such as π(z), susceptible survival probability Su(·; x), and overall survival probability S(·; x, z). To be specific,
Bias ( π ( z ) ) = 1 100 r = 1 100 1 n i = 1 n π ^ ( r ) z i π ( z i ) ,   MSE ( π ( z ) ) = 1 100 r = 1 100 1 n i = 1 n π ^ z i π ( z i ) 2 ,
Bias ( S u ( · ;   x ) ) = 1 100 r = 1 100 1 n i = 1 n S ^ u ( r ) y i ; x i S u y i ; x i ,
MSE ( S u ( · ;   x ) ) = 1 100 r = 1 100 1 n i = 1 n S ^ u ( r ) y i ; x i S u y i ; x i 2 ,
Simulation results are summarized in Table 2. Under the simulation setup, the SVM-based mixture cure model almost outperforms all other competing models with respect to estimation of both susceptible and overall survival probabilities. However, the bias and MSE of the NN-based mixture cure model are very close to that of the SVM-based mixture cure model.

5. The Application of Mixture Cure Models

5.1. Review of Existing Applications in Medicine

Farzaneh Amanpour et al. [41] employed mixture cure models to analyze the factors influencing both short-term and long-term survival in patients with colorectal cancer. The study involved data from 1121 patients, with the outcome being their survival time from diagnosis to death for colorectal cancer. A parameterized mixture cure model with a Weibull distribution and a logit link function was employed. The results indicated that the predictive variables for colorectal cancer survival had different effects in the short and long term. The mixture cure models separately researched the factors influencing short-term and long-term survival rates, providing better insights compared to standard survival models that only investigate overall survival in patients.
Cai et al. [42] introduced mixture cure models into drug persistence analysis, allowing the separation of variables affecting short-term or long-term persistence rates from those influencing time to discontinuation. Unlike traditional survival methods that assume no long-term persistence, this model provides a more accurate description of subgroups of patients with both long-term and short-term persistence.
Rezaie et al. [43] found that the Weibull distribution is commonly used in survival analysis, providing greater flexibility than the exponential distribution, and established assumptions for both proportional hazards and accelerated failure time. Based on a Weibull parameterized mixture cure model, non-Hodgkin leukemia and acute leukemia were identified as factors influencing mortality time (short-term survival). Additionally, the examination of factors influencing patient cure indicated that variables such as age, post-transplant relapse, and hemoglobin levels effectively contributed to achieving a cure. Older age and post-transplant relapse decreased the chance of cure, while higher hemoglobin levels increased it. Disease diagnosis is an important prognostic variable for predicting survival time and mortality during the bone marrow transplantation process. Additionally, factors such as age, post-transplant relapse rate, and hemoglobin levels also improve cure rates. Early diagnosis of diseases and prompt treatment during the bone marrow transplantation process can enhance cure rates.
Peizhi Li et al. [23] applied the SVM-MC model to data from studies on bone marrow transplantation in leukemia patients. In the proposed SVM-MC model, π ^ ( z ) tends to rise slowly with increasing patient and donor ages, ranging from 34% to 52%. However, π ^ ( z ) is not a monotonic function of age: it often reaches a local minimum when patient ages are between 20 and 30 and donor ages are between 20 and 40. Since the age range corresponds to middle age, it seems intuitively reasonable that they may have higher cure rates than individuals in nearby age groups. Under the Logistic-MC model, due to its rigid assumptions, π ^ ( z )   is a monotonic function of patient and donor ages, with older patient ages corresponding to higher π ^ ( z ) . The SVM-MC model demonstrates better calibration and dispersion characteristics in the incidence component.
Suvra Pal et al. [24] employed an SVM-based mixture cure model on data extracted from NASA’s decompression sickness database. When stratifying all models by gender and age, the authors plotted the probability of being uncured against age and TR360 estimates. The SVM-based model exhibited a non-monotonic change in uncured probability concerning age and TR360, a pattern not reflected in the logistic regression and spline regression models. By plotting the average ROC curve to calculate the AUC, the results showed that the SVM-based model achieved the highest AUC, demonstrating its superior predictive accuracy in this dataset. When the true classification boundary is nonlinear, the SVM-based mixture cure model overall outperforms both the standard logistic regression and spline-based mixture cure models.
Oswaldo Gressani et al. [18] applied the LPSMC method to two Phase III clinical trials from ECOG, resulting in 284 observations after excluding missing data, to assess whether interferon (IFN) significantly impacts relapse-free survival. The results consistently indicated that the treatment had a significant positive effect on the probability of cure, whereas IFN treatment did not have a significant impact on the latency period. However, fitting the model using the smcure package took 125 s, while LPSMC required only 0.5 s. When using LPSMC to study the impact of age on survival in COVID-19 patients, the results revealed a significant positive effect of age on the incidence, suggesting that older patients had a higher likelihood of being uncured and a lower likelihood of being cured. In the latency period, age was positive but not significant, indicating that age does not have a meaningful impact on the survival of uncured patients.
Wisdom Aselisewine et al. [25] applied an improved mixture cure model based on decision tree classifiers to study data from leukemia bone marrow transplant patients. The results indicated that in the Logistic-MC model, incidence was a monotonic function of patient and donor ages, with higher patient ages corresponding to higher incidence rates. However, the improved mixture cure models using decision trees, neural networks, and random forests effectively captured the complex effects of age.

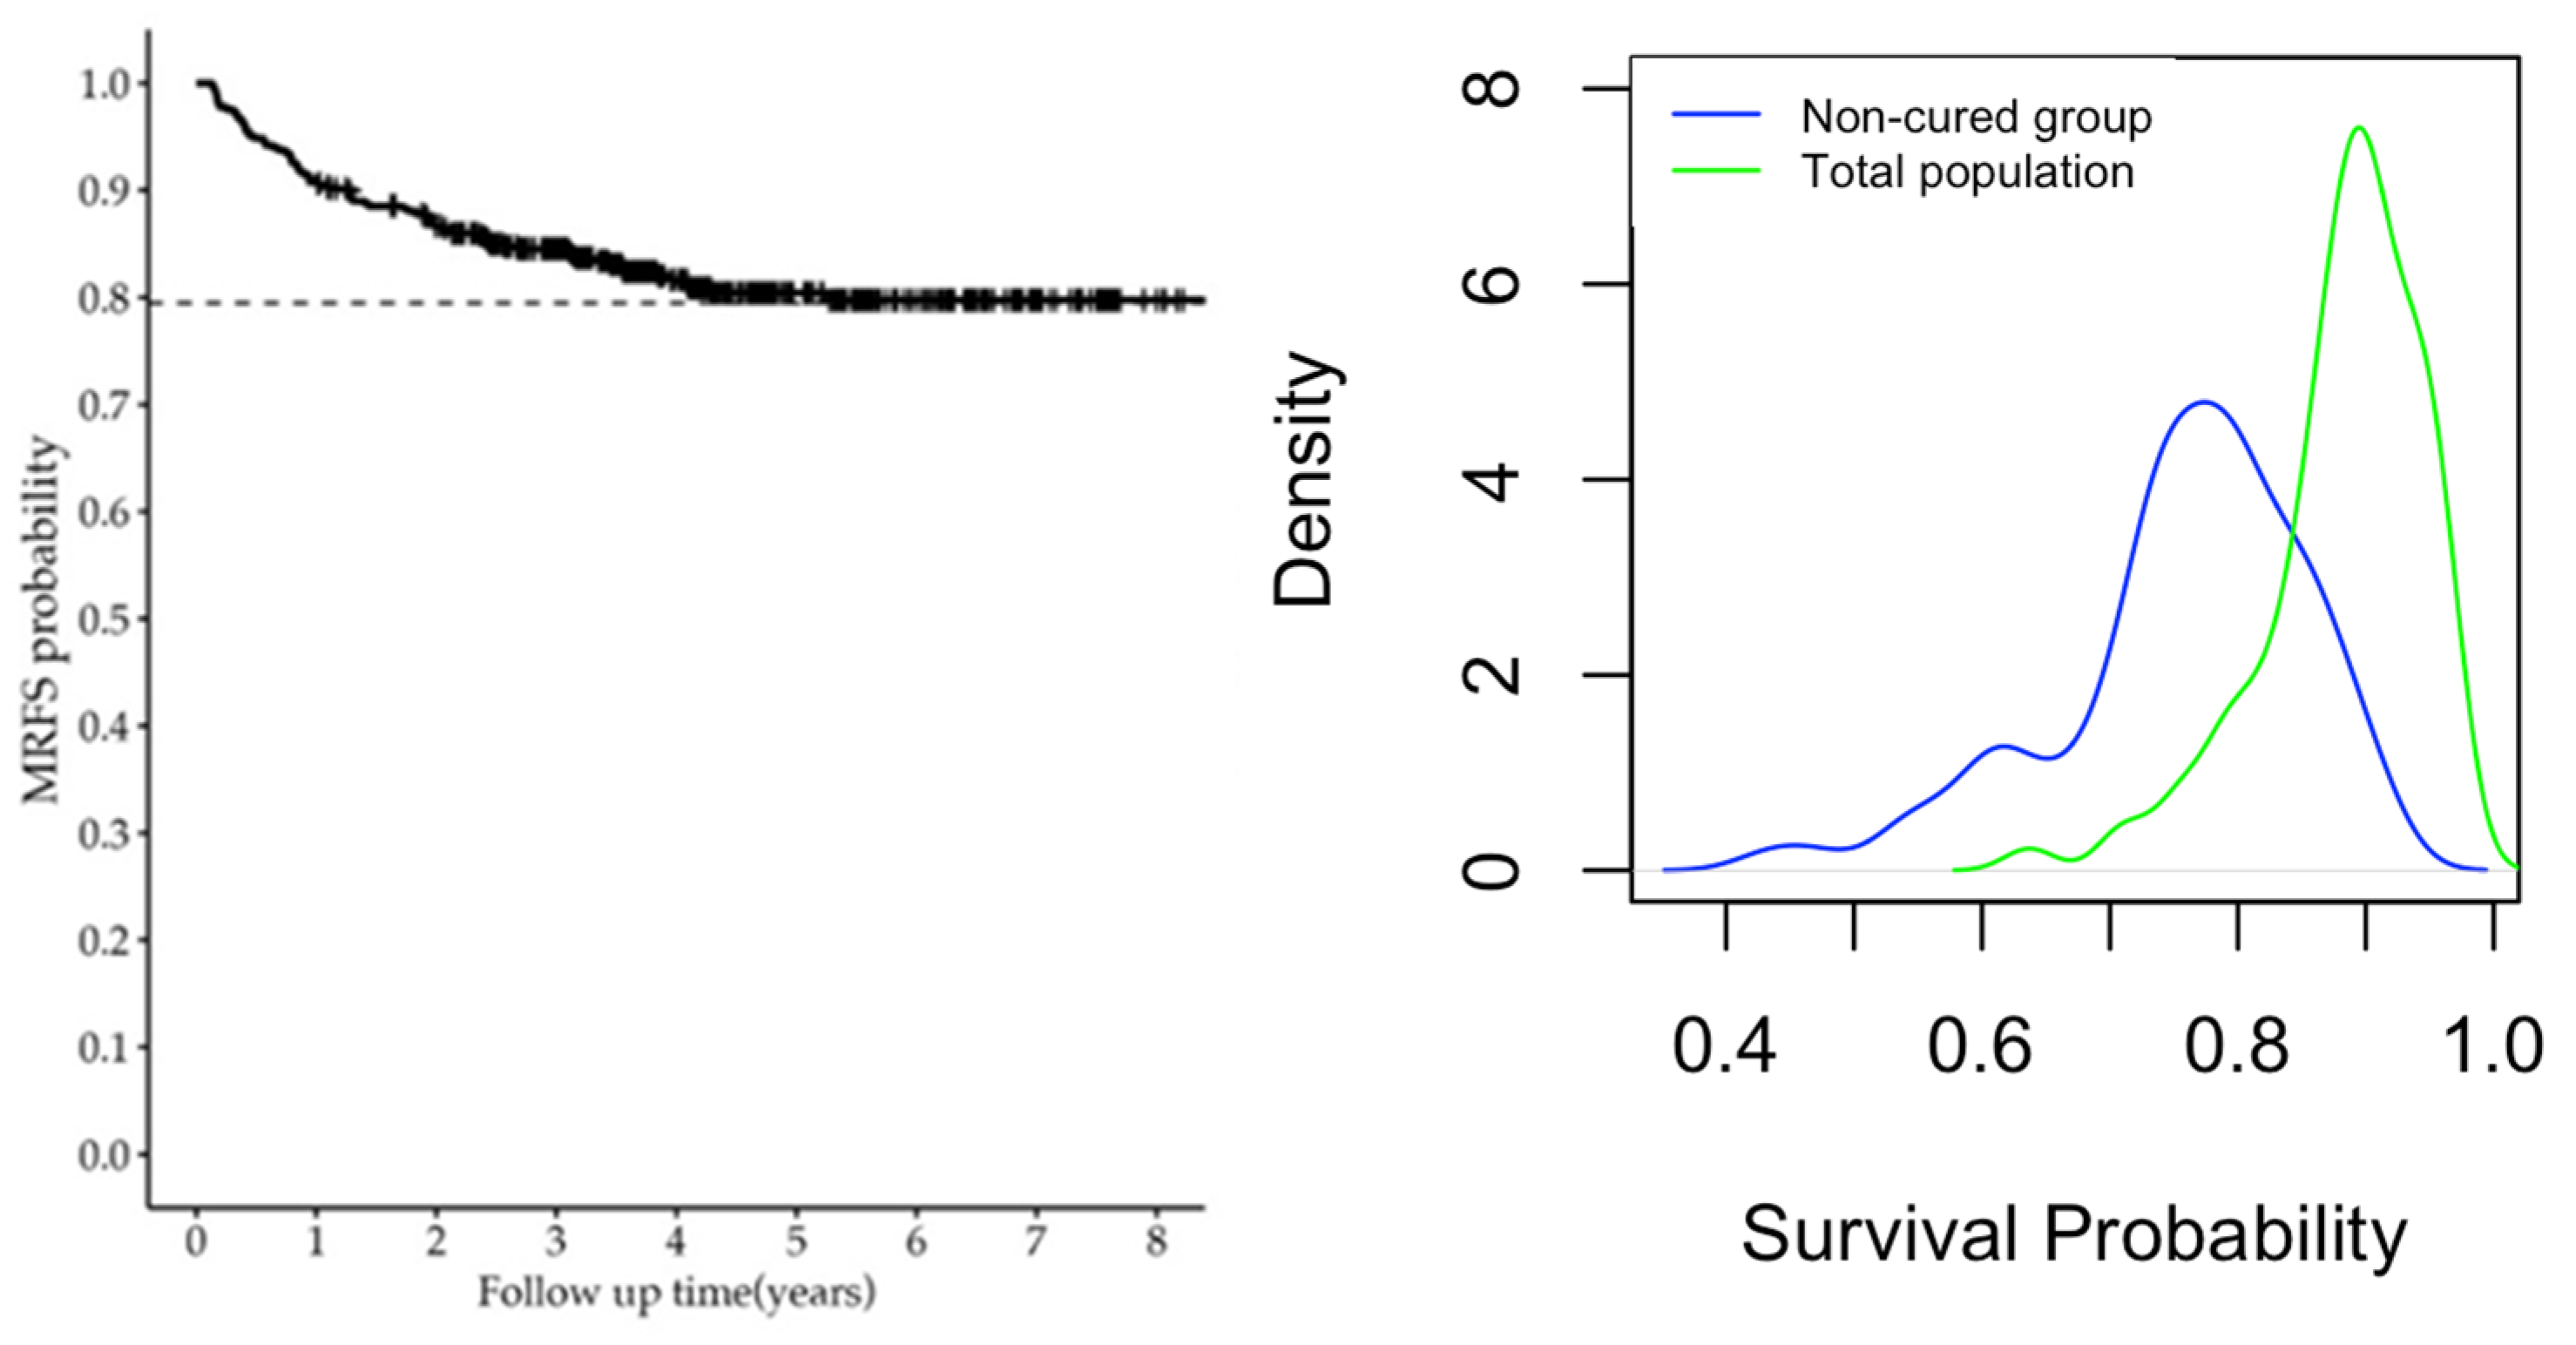
5.2. Illustration of Decision Tree Improved Mixture Cure Model Using Cervical Carcinoma Data

Considering that there is no standard way, criteria, or measurement to compare different types of mixture cure models in practical application, for simplicity, we only illustrate the application of the improved mixture cure model with a decision tree in a retrospective cervical carcinoma study which enrolled 747 women with pathologically confirmed International Federation of Gynecology Oncology 2009 stage IA-IVB CC, who were treated with intracavitary brachytherapy at the Department of Radiation Oncology, Peking University Cancer Hospital & Institute, between April 2011 and April 2017 [44]. After data cleaning, we included 462 patients, and the characteristics were summarized in Table 3. The main research aim is to investigate the survival probability of non-cured patients.
Among all patients, 76% did not experience metastasis or recurrence, while 24% of patients did experience metastasis or recurrence. The metastasis recurrence rates (MRFS) at the first year, third year, and fifth year were 90.8%, 84.5%, and 80.4%, respectively. In terms of disease staging, early, locally advanced, and advanced-stage patients accounted for 21%, 58.2%, and 20.8% of the total, respectively, at baseline. Metastasis recurrence is more common in advanced patients, accounting for 64%, while the metastasis recurrence rates in early and locally advanced patients are 13% and 23%, respectively.
We constructed a decision tree improved mixture cure model to explore the impact of each variable on patient prognosis. The classification criteria of the model are based on the segmentation nodes of different variables. Overall, age is the most critical splitting variable and has a significant impact on the classification results. The clinical indicators of disease differentiation and disease staging play a key classification role in the tree submodel, demonstrating their predictive value for disease progression.
Through the analysis of decision tree models, it can be found that age, disease stage, duration of illness, and treatment-related factors (such as treatment frequency and whether to receive combination chemotherapy) are important factors affecting disease progression. The differences between models reflect the impact of multivariate interactions on classification results, further validating the importance of multidimensional evaluation in predicting disease prognosis.
By using the probability of not being cured, we can calculate the survival probability of the susceptible group and the overall survival probability (Table 4). By drawing a probability density map, it can be seen that there are significant differences in the distribution of survival probabilities between the two groups. The survival probability of the overall population is mainly concentrated in the high numerical range, with a peak around 0.9, indicating that most individuals have a high survival probability. The survival probability distribution of the uncured group is more dispersed, with a peak around 0.75, indicating that the survival probability of this group fluctuates greatly, and the overall survival probability is relatively low (see Figure 1).

6. Conclusions

In actual data, it is often observed that some subjects never experience the event of interest; these subjects are considered cured or long-term survivors. In practice, one can initially assess the presence of cure by plotting the Kaplan–Meier (KM) curve [45,46]. If the KM curve exhibits a long-tail phenomenon, it suggests the possibility of cure, indicating that a cure model may be suitable for further analysis.
Machine learning research focuses on how computational methods utilize experience to improve performance. It has also enhanced cure models, enabling better predictions for complex and unstructured data, which allows for more flexible modeling of covariates and more accurate estimation of their effects. For instance, enhancing cure models with machine learning methods such as SVMs, neural networks, and decision trees can improve predictive accuracy, particularly when the true classification boundary is nonlinear. This paper provides a brief overview of common software packages for cure models, outlining their applicable conditions, advantages, and disadvantages. Through a finite-sample numerical study, we see that decision-tree-based mixture cure models have significant advantages over logistic regression due to their robustness and flexibility. The tree model output is intuitive and easy to understand but has low accuracy. It is also better at handling collinearity between covariates than models such as SVMs, and compared with methods such as random forests and neural networks, decision trees have significantly lower computational costs.
This paper systematically introduces the development of mixture cure models, and their enhancements based on machine learning, without detailing the specific algorithms for each machine learning approach. It primarily showcases their practical applications in the medical field. Currently, the application of mixture cure models in clinical research is somewhat limited, but there is significant potential for future use, particularly with machine-learning-enhanced methods. These models offer significant advantages in identifying potential influencing factors, quantifying risks, and implementing algorithms in complex structured data.

Author Contributions

Conceptualization, B.L. and H.W.; methodology, B.L.; software, H.W. and T.F.; validation, B.L, H.W. and T.F.; formal analysis, B.L.; investigation, H.W.; resources, B.L.; data curation, B.L.; writing—original draft preparation, H.W. and T.F.; writing—review and editing, B.L.; visualization, B.L and T.F.; supervision, B.L.; project administration, B.L; funding acquisition, B.L. All authors have read and agreed to the published version of the manuscript.

Funding

This research was funded by the Capital’s Funds for Health Improvement and Research (Grant numbers: 2024-1G-4251).

Data Availability Statement

The data will be made available by the authors on request.

Conflicts of Interest

The authors declare no conflicts of interest.

References

  1. Cox, D.R. Regression models and life-tables. J. R. Stat. Soc. Ser. B Methodol. 1972, 34, 187–220. [Google Scholar] [CrossRef]
  2. Boag, J.W. Maximum likelihood estimates of the proportion of patients cured by cancer therapy. J. R. Stat. Soc. Ser. B Methodol. 1949, 11, 15–53. [Google Scholar] [CrossRef]
  3. Maller, R.A.; Ghitany, M.E.; Zhou, S. Exponential mixture models with long-term survivors and co-variates. J. Multivar. Anal. 1994, 49, 218–241. [Google Scholar]
  4. Gage, R.P.; Berkson, J. Survival curve for cancer patients following treatment. J. Am. Stat. Assoc. 1952, 47, 501–515. [Google Scholar]
  5. Farewell, V.T. A model for a binary variable with time-censored observations. Biometrika 1977, 64, 43–46. [Google Scholar] [CrossRef]
  6. Farewell, V.T. The use of mixture models for the analysis of survival data with long-term survivors. Biometrics 1982, 38, 1041–1046. [Google Scholar] [CrossRef]
  7. Chen, C.; Kuk, A.Y.C. A mixture model combining logistic regression with proportional hazards regression. Biometrika 1992, 79, 531–541. [Google Scholar]
  8. Dear, K.B.; Peng, Y. A nonparametric mixture model for cure rate estimation. Biometrics 2000, 56, 237–243. [Google Scholar]
  9. Lu, W. Maximum likelihood estimation in the proportional hazards cure model. Ann. Inst. Stat. Math. 2008, 60, 545–574. [Google Scholar] [CrossRef]
  10. Taylor, J.M.; Li, C.S. A semi-parametric accelerated failure time cure model. Stat. Probab. Lett. 2002, 21, 3235–3247. [Google Scholar]
  11. Peng, Y.; Zhang, J. A new estimation method for the semiparametric accelerated failure time mixture cure model. Stat. Med. 2007, 26, 3157–3171. [Google Scholar]
  12. Musta, E.; Valentin, P.; Ingrid, V.K. A two-step estimation procedure for semi-parametric mixture cure models. arXiv 2024, arXiv:2207.08237. [Google Scholar]
  13. Ortega, E.M.; Cancho, V.G.; Paula, G.A. Generalized log-gamma regression models with cure fraction. Lifetime Data Anal. 2009, 15, 79–106. [Google Scholar] [CrossRef]
  14. Gordon, N.H. Application of the theory of finite mixtures for the estimation of ’cure’ rates of treat-ed cancer patients. Stat. Med. 1990, 9, 397–407. [Google Scholar] [CrossRef]
  15. Zhang, J.; Peng, Y. Accelerated hazards mixture cure model. Lifetime Data Anal. 2009, 15, 455–467. [Google Scholar] [CrossRef] [PubMed]
  16. Engelhard, M.; Henao, R. Disentangling Whether from When in a Neural Mixture Cure Model for Failure Time Data. Proc. Mach. Learn. Res. 2022, 151, 9571–9581. [Google Scholar] [PubMed]
  17. Xie, Y.; Yu, Z. Promotion time cure rate model with a neural network estimated nonparametric component. Stat. Med. 2021, 40, 3516–3532. [Google Scholar] [CrossRef]
  18. Gressani, O.; Faes, C.; Hens, N. Laplacian-P-splines for Bayesian inference in the mixture cure model. Stat. Med. 2022, 41, 2602–2626. [Google Scholar] [CrossRef] [PubMed]
  19. Hurtado Rúa, S.M.; Dey, D.K. A Bayesian piecewise survival cure rate model for spatially clustered data. Spat. Spatio-Temporal Epidemiol. 2019, 29, 149–159. [Google Scholar] [CrossRef] [PubMed]
  20. Wang, Y.; Wang, W.; Tang, Y. A Bayesian semiparametric accelerate failure time mixture cure model. Int. J. Biostat. 2022, 18, 473–485. [Google Scholar] [CrossRef] [PubMed]
  21. Pan, C.; Cai, B.; Sui, X. A Bayesian proportional hazards mixture cure model for interval-censored data. Lifetime Data Anal. 2024, 30, 327–344. [Google Scholar] [CrossRef]
  22. Zhou, J.; Zhang, J.; Lu, W. Computationally Efficient Estimation for the Generalized Odds Rate Mixture Cure Model with Interval-Censored Data. J. Comput. Graph. Stat. 2018, 27, 48–58. [Google Scholar] [CrossRef] [PubMed]
  23. Li, P.; Peng, Y.; Jiang, P.; Dong, Q. A support vector machine based semiparametric mixture cure model. Comput. Stat. 2020, 35, 931–945. [Google Scholar] [CrossRef]
  24. Pal, S.; Peng, Y.; Aselisewine, W.; Barui, S. A support vector machine-based cure rate model for interval censored data. Stat. Methods Med. Res. 2023, 32, 2405–2422. [Google Scholar] [CrossRef] [PubMed]
  25. Aselisewine, W.; Pal, S. On the integration of decision trees with mixture cure model. Stat. Med. 2023, 42, 4111–4127. [Google Scholar] [CrossRef]
  26. Peng, Y.; Dear, K.B.G.; Denham, J.W. A generalized F mixture model for cure rate estimation. Stat. Med. 1998, 17, 813–830. [Google Scholar] [CrossRef]
  27. Yuan, S.; Zheng, P.; Wu, X. SAFE: A Neural Survival Analysis Model for Fraud Early Detection. Proc. AAAI Conf. Artif. Intell. 2019, 33, 1278–1285. [Google Scholar]
  28. Katzman, J.L.; Shaham, U.; Cloninger, A.; Bates, J.; Jiang, T.; Kluger, Y. DeepSurv: Personalized treatment recommender system using a Cox proportional hazards deep neural network. BMC Med. Res. Methodol. 2018, 18, 24. [Google Scholar] [CrossRef]
  29. Kvamme, H.; Borgan, Ø.; Ida, S. Time-to-Event Prediction with Neural Networks and Cox Regression. J. Mach. Learn. Res. 2019, 20, 1–30. [Google Scholar]
  30. Peng, Y.W. Fitting semiparametric cure models. Comput. Stat. Data Anal. 2003, 41, 481–490. [Google Scholar] [CrossRef]
  31. Cai, C.; Zou, Y.; Peng, Y.; Zhang, J. smcure: An R-package for estimating semiparametric mixture cure models. Comput. Methods Programs Biomed. 2012, 108, 1255–1260. [Google Scholar] [CrossRef]
  32. Cao, R.; López-Cheda, A.; Jácome, M.A. Nonparametric incidence estimation and bootstrap band-width selection in mixture cure models. Comput. Stat. Data Anal. 2017, 105, 144–165. [Google Scholar]
  33. Mukhopadhyay, P.; Ouwens, M.J.N.M.; Zhang, Y.D. Estimating lifetime benefits associated with immunooncology therapies: Challenges and approaches for overall survival extrapolations. Pharm. Econ. 2019, 37, 1129–1138. [Google Scholar]
  34. Niu, Y.; Wang, X.; Peng, Y. geecure: An R-package for marginal proportional hazards mixture cure models. Comput. Methods Programs Biomed. 2018, 161, 115–124. [Google Scholar] [CrossRef] [PubMed]
  35. Jensen, R.K.; Clements, M.; Gjærde, L.K.; Jakobsen, L.H. Fitting parametric cure models in R using the packages cuRe and rstpm2. Comput. Methods Programs Biomed. 2022, 226, 107125. [Google Scholar] [CrossRef]
  36. Beretta, A.; Heuchenne, C. penPHcure: Variable Selection in Proportional Hazards Cure Model with Time-Varying Covariates. R J. 2021, 13, 53–66. [Google Scholar] [CrossRef]
  37. Peng, Y.; Taylor, J.M. Mixture cure model with random effects for the analysis of a multi-center tonsil cancer study. Stat. Med. 2011, 30, 211–223. [Google Scholar] [CrossRef]
  38. Parsa, M.; Taghavi-Shahri, S.M.; Van Keilegom, I. kmcure: Fits AFT Semiparametric Mixture Cure Model Using the KME-KDE Method. 2022. Available online: https://github.com/Motahareh-Parsa/kmcure/ (accessed on 1 February 2025).
  39. Garibotti, G.; Tsodikov, A.; Clements, M. nltm: Non-Linear Transformation Models. 2023. Available online: https://cran.r-project.org/web/packages/nltm/index.html (accessed on 1 February 2025).
  40. Ding, J.; Li, J.; Zhang, M.; Wang, X. CureAuxSP: An R package for estimating mixture cure models with auxiliary survival probabilities. Comput. Methods Programs Biomed. 2024, 251, 108212. [Google Scholar] [CrossRef] [PubMed]
  41. Amanpour, F.; Akbari, S.; Looha, M.A.; Abdehagh, M.; Pourhoseingholi, M.A. Mixture cure model for estimating short-term and long-term colorectal cancer survival. Gastroenterol. Hepatol. Bed Bench 2019, 12 (Suppl. S1), s37–s43. [Google Scholar]
  42. Cai, C.; Love, B.L.; Yunusa, I.; Reeder, C.E. Applying mixture cure survival modeling to medication persistence analysis. Pharmacoepidemiol. Drug Saf. 2022, 31, 788–795. [Google Scholar] [CrossRef] [PubMed]
  43. Rezaie, M.; Ghamsari, F.S.H.; Rasekhi, A.; Hajifathali, A. Factors affecting survival in bone marrow transplantation using mixture cure model. Health Sci. Monit. 2024, 3, 19–28. [Google Scholar] [CrossRef]
  44. Ou, X.; You, J.; Liang, B.; Li, X.; Zhou, J.; Wen, F.; Wang, J.; Dong, Z.; Zhang, Y. Prognostic Factors Analysis of Metastatic Recurrence in Cervical Carcinoma Patients Treated with Definitive Radiotherapy: A Retrospective Study Using Mixture Cure Model. Cancers 2023, 15, 2913. [Google Scholar] [CrossRef] [PubMed]
  45. Maller, R.; Resnick, S.; Shemehsavar, S.; Zhao, M. Mixture cure model methodology in survival analysis: Some recent results for the one-sample case. Stat. Surv. 2024, 18, 82–138. [Google Scholar] [CrossRef]
  46. Kaplan, E.L.; Paul, M. Nonparametric Estimation from Incomplete Observations. In Break-Throughs in Statistics; Springer: New York, NY, USA, 1992; pp. 319–337. [Google Scholar]
Figure 1. The left panel is the Kaplan–Meier estimator curve, and the right panel is the distribution of the estimated survival probability for the non-cured group and total population.
Mathematics 13 00557 g001
Table 2. Model comparison through the bias and MSE of the uncured, susceptible, and overall survival probabilities.
Incidenceπ(z)Su(∙; x)S(∙; x, z)
SubmodelBiasMSEBiasMSEBiasMSE
Logistic0.2740.1380.3450.2250.1520.048
DT0.2340.1140.3450.2250.1350.037
SVM0.2250.1090.3430.2250.1290.036
NN0.2290.1360.3440.2240.1270.042
Table 3. Descriptive characteristics of the included patients.
VariableOverallNon-Metastatic RecurrenceMetastatic
Recurrence
p-Value
All patients462353 (76%)109 (24%)
Differentiation 0.643
  High288218 (76%)70 (24%)
  Low174135 (78%)39 (22%)
Stage [n (%)] <0.001
  Early9784 (87%)13 (13%)
  Local adva.269208 (77%)61 (23%)
  Advanced9661 (36%)109 (64%)
Num. of treat. 0.03
  286 (75%)2 (25%)
  3138 (62%)5 (38%)
  4240191 (80%)49 (20%)
  5181138 (76%)58 (24%)
  62010 (50%)10 (50%)
CoChemo 0.724
  0223172 (77%)52 (23%)
  1239181 (76%)58 (24%)
Age (in years) *53 (47, 59)53 (47, 59)52 (45, 57)0.3
* Fiftieth percentile (25th percentile, 75th percentile). For category variables, the differences between subgroups were compared using the Chi-square test and Fisher’s exact test; for continuous variables, the Wilcoxon rank sum test was used.
Table 4. Non-cured groups and overall survival probabilities in the test set data.
Survival ProbabilityMin.MedianMax.
Non-cured0.43380.77240.9120
Overall0.63710.88240.9679
Disclaimer/Publisher’s Note: The statements, opinions and data contained in all publications are solely those of the individual author(s) and contributor(s) and not of MDPI and/or the editor(s). MDPI and/or the editor(s) disclaim responsibility for any injury to people or property resulting from any ideas, methods, instructions or products referred to in the content.

