Article

A Robust TEWMA–MA Control Chart Based on Sign Statistics for Effective Monitoring of Manufacturing Processes

by
Piyatida Saesuntia
,
Yupaporn Areepong
and
Saowanit Sukparungsee
*
Department of Applied Statistics, Faculty of Applied Science, King Mongkut’s University of Technology North Bangkok, Bangkok 10800, Thailand
*
Author to whom correspondence should be addressed.
Mathematics 2025, 13(23), 3789; https://doi.org/10.3390/math13233789
Submission received: 5 November 2025 / Revised: 18 November 2025 / Accepted: 24 November 2025 / Published: 26 November 2025

Abstract

A nonparametric control chart is a type of control chart that does not rely on assumptions regarding the underlying distribution of the data. This characteristic provides greater flexibility and robustness, particularly when handling non-normal data, skewed distributions, or datasets containing outliers. The primary objective of this study is to propose a nonparametric TEWMA–MA control chart based on the sign statistic, designed to operate under both symmetric and asymmetric distributions for effective process monitoring. This chart aims to enhance the ability to quickly detect shifts in the production process. The run-length characteristics obtained through Monte Carlo simulation (MC) were employed as performance measures. In addition, overall efficiency was assessed using AEQL, RMI, and PCI. The proposed control chart was compared against MA, TEWMA, MA–TEWMA, TEWMA–MA, and MA–TEWMA sign charts. The findings indicate that the proposed chart is effective for process control and demonstrates superior detection capability compared to competing charts, particularly in identifying small to moderate shifts. Furthermore, to validate its practical utility, the proposed control chart was applied to real-world data.

1. Introduction

Control charts are widely recognized as essential statistical tools for monitoring and evaluating the stability of production processes or operational systems over time. Their primary objective is to determine whether a process remains under statistical control, thereby ensuring consistent quality and reliability. A control chart typically presents time-ordered data plotted against predetermined control limits, allowing for the identification of unusual deviations or changes in the process. An application of control charts offers several important advantages. Firstly, they enable the early detection of abnormalities or emerging trends in a process. Secondly, they provide a systematic means of distinguishing between common cause variation, which reflects inherent process variability, and special cause variation, which arises from external or assignable factors. Finally, control charts form the cornerstone of Statistical Process Control (SPC), serving as a foundation for quality improvement and effective process management. Control chart theory was formulated by Shewhart during the 1920s [1], forming the basis of what is commonly referred to as the Shewhart control chart. It remains among the most widely utilized tools in industrial quality monitoring due to its simplicity and practicality. Nevertheless, the chart demonstrates inherent limitations. In particular, it exhibits reduced sensitivity to detecting minor process shifts, and its performance deteriorates when the data distribution deviates from normality. These shortcomings underscore the necessity of alternative or modified control charting methods capable of improving detection accuracy under varying process conditions. In response, subsequent studies have introduced several specialized charts aimed at addressing these issues. For instance, Page [2] proposed the CUSUM chart in 1951, which was later followed by Roberts [3] with the EWMA chart. Shamma and Shamma [4] further developed the DEWMA chart, while Sheu and Liu [5] introduced the GWMA chart in 2003. Khoo [6] subsequently proposed the MA chart, and this work was extended by Khoo and Wong [7] through the development of the DMA chart in 2008. Recent advancements include the MEWMA scheme proposed by Khan et al. [8], the EEWMA diagram developed by Naveed et al. [9], and the TEWMA scheme formulated by Alevizakos et al. in 2021 [10]. The above-mentioned charts are parametric charts. They can respond well to small changes but are slow to respond immediately to large deviations. However, their performance relies heavily on the assumption of the normality and independence of procedure data, which is often violated in practical applications.
To address these issues, nonparametric control charts have been introduced, offering distribution-free alternatives that rely on robust statistics such as sign-rank, sign, Mann–Whitney, Tukey Among them, sign-based approaches are particularly attractive due to their simplicity, distributional robustness, and resistance to extreme observations. Parallel to this development, research has also advanced toward mixed or hybrid control charts, which integrate features of different designs to balance sensitivity to both small and large processes. For example, a combination of the EWMA chart with signed-rank statistics was presented by Graham et al. [11], with a Markov chain framework utilized to consider the run-length performance of this chart. This study showed that this chart performs on par with, and sometimes better than, parametric EWMA and other nonparametric alternatives, supporting its practical value in process monitoring. Alevizakos et al. [12] designed the TEWMA chart using sign statistics for location monitoring when the underlying distribution is continuous but unspecified. They assessed its run-length profiles with the Monte Carlo approach and benchmarked it against nonparametric sign charts (CUSUM, EWMA, GWMA, DEWMA) and the parametric TEWMA chart. The TEWMA sign chart consistently showed better detection, with marked advantages for small shifts. Taboran et al. [13] developed a nonparametric Tukey MA–DEWMA scheme aimed at monitoring process mean shifts across both symmetric and asymmetric distributions. Efficiency was assessed via run-length profiles estimated by Monte Carlo simulation. The proposed chart outperformed existing alternatives for small to moderate shifts. Next, Taboran [14] proposed a chart that combines MEWMA based on a sign scheme to improve the detection of mean shifts. This nonparametric design, termed the MEWMA sign, served as an effective alternative to parametric control charts. A nonparametric mixed EWMA progressive mean chart built on the sign statistic was presented by Ali et al. [15], formulated for both simple random and ranked set sampling. The design addresses the noted limitation by enhancing detection performance without parametric assumptions. Mahmood et al. [16] developed a TEWMA–Tukey model that integrated single and repetitive sampling for both normal and non-normal process data. Across zero and steady-state evaluations (ARL, SDRL, MRL), the charts detected two-sided mean shifts more quickly, remained robust to skewness, and reduced ARL bias; under repetitive sampling, they surpassed Tukey and Shewhart, with the repetitive TEWMA–Tukey model being the top performer. A case study on aerospace production indices shows earlier and more frequent Phase II signals, highlighting its practical value. Abbas et al. [17] presented a progressive mean chart in a nonparametric framework, utilizing the Wilcoxon signed-rank statistic to detect deviations from the process goal. The design improves sensitivity to small and moderate shifts without relying on distributional assumptions. Talordphop et al. [18] evaluated the EEWMA signed-rank scheme for detecting process changes. The conclusions were drawn from MC method experiments implemented to evaluate ARL working and show that the proposed chart offers superior sensitivity, particularly for small mean shifts, compared with existing alternatives. In 2024, Raza et al. [19,20] introduced nonparametric EWMA–MA sign and EWMA–MA signed-rank charts that fuse a moving average statistic with the EWMA framework; Monte Carlo studies show the superior detection of location shifts under both symmetric and asymmetric distributions. Abid et al. [21] introduced a nonparametric DHWMA model that employs the Wilcoxon signed-rank statistic to enhance detection sensitivity, with run-length performance evaluated via simulation against established nonparametric charts. The overall efficiency measured, including the extra quadratic loss, favored the proposed design. Later, Talordphop [22] proposed the EEWMA sign chart, utilizing the nonparametric sign statistic to improve the effectiveness of process mean monitoring when the data distribution is unknown or inflexible. Simulation results show that it consistently achieved the lowest ARL for detecting small shifts across diverse distributional settings. These findings underscore the efficacy of nonparametric charts for detecting subtle distributional shifts. However, most studies remain within the parametric framework.
In recent work, we proposed a nonparametric TEWMA–MA control chart based on sign statistics. The chart was designed to improve detection power while maintaining robustness under non-normal conditions. Its performance was systematically evaluated against established alternatives, including MA, TEWMA, MA–TEWMA, TEWMA–MA, and MA–TEWMA sign charts. Monte Carlo (MC) simulation methods were employed to compute performance characteristics, with ARL and MRL as efficient measures. We further evaluate the TEWMA–MA sign chart on an industrial dataset comprising flow-width assessments from the hard-bake procedure to demonstrate its acceptable effectiveness.

2. The Conceptual Framework for the Control Chart

This portion introduces the conceptual foundation of the recommended TEWMA–MA sign chart and outlines the set of benchmark charts employed for comparison. The comparative framework includes the traditional MA chart, the TEWMA chart, and two hybrid structures, namely the MA–TEWMA and TEWMA–MA charts. In addition, an enhanced variant of the MA–TEWMA chart incorporating the sign statistic, referred to as the MA–TEWMA sign chart, is also considered.

2.1. MA Control Chart

Moving average (MA) smoothing applies uniform averaging over a recent window, stabilizing sign counts and improving robustness. As first formalized by Khoo [6], the MA chart monitors quality by averaging subgroup statistics over a window of w consecutive points, thereby damping short-term variability and supporting the more reliable assessment of process stability. Compared with the Shewhart chart, MA more effectively attenuates transient fluctuations. The MA statistic at time j is the mean over w successive observations and is given by
M A j =   X j + X j 1 + X j 2 + j   ,     j   <   w X j + X j 1 + + X j w + 1 w   ,     j     w
For the MA statistic, the expectation and variance are
E M A j = μ 0   and   V a r M A j = σ 2 j   ,     j <   w σ 2 w     ,     j     w
The upper boundary (UCL) and lower boundary (LCL) associated with the MA chart are
U C L / L C L = μ 0 ± C 1 σ j   ,     j   <   w μ 0 ± C 1 σ w   ,     j     w
where C 1 serves as the coefficient determining the width of boundaries for the MA scheme. The process parameters are μ 0 (mean) and σ (standard deviation).

2.2. TEWMA Control Chart

As progressed by Alevizakos et al. [10], the TEWMA chart contributes layered exponential weighting, giving sensitivity to both recent and intermediate historical information through its triple EWMA structure, which enhances the chart’s responsiveness to subtle process changes with greater sensitivity than the traditional EWMA. Formally, the TEWMA statistic is given by the following procedure of equations:
E j = λ X j + 1 λ E j 1 D j = λ E j + 1 λ D j 1 T j = λ D j + 1 λ T j 1
where E 0 = D 0 = T 0 = μ 0 are the initial values. The statistics E j ,   D j and T j are plotting of the EWMA, DEWMA, and TEWMA diagrams, respectively. The TEWMA statistic has expectation and variance as follows:
E T j = μ 0   and   V a r T j = 6 λ 1 λ 6 2 λ 5 + 12 λ 2 1 λ 4 2 λ 4 + 7 λ 3 1 λ 2 2 λ 3 + λ 4 2 λ 2 σ 2
The TEWMA chart’s bounds take the form
U C L / L C L = μ 0 ± C 2 σ 6 λ 1 λ 6 2 λ 5 + 12 λ 2 1 λ 4 2 λ 4 + 7 λ 3 1 λ 2 2 λ 3 + λ 4 2 λ 2
where C 2 is the control-limit width for the TEWMA chart. The process parameters are μ 0 (mean) and σ (standard deviation).

2.3. Mixed MA–TEWMA Control Chart

The MA–TEWMA chart combines the strengths of the MA and TEWMA approaches. This integration yields a statistic that is both smoothed, through the averaging of successive subgroup observations, and highly responsive to subtle process shifts, owing to the multi-layer exponential weighting scheme. Within this framework, the value T j , derived from Equation (3), is employed as the input X j for the MA calculation. The resulting monitoring statistic, denoted as MA−TEWMA, is obtained as follows:
M T j =   T j + T j 1 + T j 2 + i             ,     j   <   w T j + T j 1 + + T j w + 1 w       ,     j     w
where T j symbolizes the TEWMA statistic at time j. Accordingly, the MA–TEWMA chart admits the following control limits:
U C L / L C L = μ T ± C 3 σ T j 6 λ 1 λ 6 2 λ 5 + 12 λ 2 1 λ 4 2 λ 4 + 7 λ 3 1 λ 2 2 λ 3 + λ 4 2 λ 2         ,     j <   w μ T ± C 3 σ T w 6 λ 1 λ 6 2 λ 5 + 12 λ 2 1 λ 4 2 λ 4 + 7 λ 3 1 λ 2 2 λ 3 + λ 4 2 λ 2       ,     j     w
where C 3 is the control-limit width for the MA–TEWMA chart. The TEWMA component has mean μ T and standard deviation σ T .

2.4. Mixed TEWMA–MA Control Chart

Their integration (TEWMA–MA) produces a convolution of three exponential kernels with one uniform kernel. This generates a hybrid weight profile that (i) suppresses very old information more strongly than single or double EWMA charts, (ii) preserves intermediate memory, and (iii) enhances robustness to skewed and heavy-tailed distributions. In this framework, the value of M A j , obtained from Equation (1), is employed as the input X j for the subsequent TEWMA computation. The resulting test statistic, denoted as TEWMA−MA, can then be expressed as follows:
E M j = λ M A j + 1 λ E M j 1 D M j = λ E M j + 1 λ D M j 1 T M j = λ D M j + 1 λ T M j 1
where E M 0 = D M 0 = T M 0 = μ 0 are the initial values. The statistics E M j ,   D M j and T M j are the plotting of the EWMA-MA, DEWMA-MA, and TEWMA–MA control charts, respectively. The TEWMA–MA statistic admits the following mean and variance
U C L / L C L = μ M A ± C 4 σ M A w 6 λ 1 λ 6 2 λ 5 + 12 λ 2 1 λ 4 2 λ 4 + 7 λ 3 1 λ 2 2 λ 3 + λ 4 2 λ 2
where C 4 denotes a constant determining the width of UCL and LCL for the TEWMA–MA chart. The MA chart is characterized by mean μ M A and standard deviation σ M A .

2.5. Sign Statistics

Let X indicate the quality property to the point drawn from a continuous distribution with median θ 0 , taken as the target value. Describe deviation Y = X θ 0 and let p = P Y > 0 be the associated procedure proportion. Under the in-control (IC) operation, p = p 0 = 0.5 ; otherwise, p = p 1 p 0 , indicating a shift due to an assignable cause. At each time j = 1, 2, …, a random subgroup of size n > 1 is observed, yielding measurements X i j for i = 1, 2, …, n. Define the display
I i j = 1 ,           i f     X i j θ 0 > 0 0 ,           o t h e r w i s e                    
and let S N j = j = 1 n I i j denote the number of positive deviations in the jth subgroup. For an IC process, S N j ∼ Binomial(n, 0.5).

2.6. Mixed MA–TEWMA Sign Control Chart

This nonparametric MA–TEWMA sign chart targets subtle shifts in the process mean by combining the sign statistic, triple EWMA memory filter, and subsequent moving average smoothing. The TEWMA–MA sign monitoring statistic is specified in Equation (9), as described below:
M M T j =   T S N j + T S N j 1 + T S N j 2 + i             ,     j   <   w T S N j + T S N j 1 + + T S N j w + 1 w       ,     j     w
where T S N j remains the TEWMA sign statistic at the time j. In the asymptotic regime, the boundaries of the MA–TEWMA sign chart are
U C L / L C L = n 2 ± C 5 j 6 λ 1 λ 6 2 λ 5 + 12 λ 2 1 λ 4 2 λ 4 + 7 λ 3 1 λ 2 2 λ 3 + λ 4 2 λ 2 n 4         ,     j <   w n 2 ± C 5 w 6 λ 1 λ 6 2 λ 5 + 12 λ 2 1 λ 4 2 λ 4 + 7 λ 3 1 λ 2 2 λ 3 + λ 4 2 λ 2 n 4       ,     j     w
where C 5 specifies the span of the MA–TEWMA sign chart’s control limits. n is a subsample.

2.7. TEWMA–MA Sign Control Chart

Building on this foundation, the proposed TEWMA–MA sign chart integrates the time-exponentially weighted moving average (TEWMA–MA) structure with sign-based statistics to capture distribution-free process shifts. Specifically, the moving average statistic at the sampling epoch j, constructed from the sequence of sign indicators, is defined as
M A S N j =   S N j + S N j 1 + S N j 2 + j   ,     j   <   w S N j + S N j 1 + + S N j w + 1 w   ,     j     w
The TEWMA–MA sign statistic is formulated through the following structure of equations:
M E M j = λ M A S N j + 1 λ M E M j 1 M D M j = λ M E M j + 1 λ M D M j 1 M T M j = λ M D M j + 1 λ M T M j 1
where λ indicates the smoothing factor with λ 0 ,   1 . The statistics M E M j ,   M D M j , and M T M j correspond to the plotting statistics used in the EWMA–MA sign, DEWMA–MA sign, and TEWMA–MA sign charts, respectively. M E M 0 = M D M 0 = M T M 0 =   E M A S N j = n / 2 are the initial values. Asymptotically, the boundaries of the TEWMA–MA sign diagram take the form
U C L / L C L = n 2 ± C w 6 λ 1 λ 6 2 λ 5 + 12 λ 2 1 λ 4 2 λ 4 + 7 λ 3 1 λ 2 2 λ 3 + λ 4 2 λ 2 n 4
where C is the located coefficient determining the width of boundaries for the TEWMA–MA sign chart. The subsample that occurs is denoted by n. Finally, the formulas for the resulting mean and variance are presented in Appendix A and Appendix B, respectively.

3. Methods for Evaluating Control Chart Performance

A control chart is considered effective when it detects mean shifts promptly. Its detection capability is routinely evaluated by the ARL and MRL using MC method. ARL represents the expected number of observations collected before the chart issues a signal. Under in-control (IC) conditions, the A R L 0 is expected to be large, reflecting a low probability of false alarms. In contrast, under out-of-control (OOC) conditions, the A R L 1 is to be minimized, indicating that the chart is effective in promptly identifying deviations from the target mean. The MRL, by comparison, denotes the median integer of samples involved before a signal is raised, offering a complementary perspective that is less influenced by extreme values in run-length distribution. The ARL and MRL estimates are obtained according to the following formulation:
A R L = t = 1 M R L t M   and   M R L = M e d i a n R L
where R L t is the sample index at which the chart first signals out-of-control in replication t, and M is the total count of replications. The MC method uses M = 100,000 replications. The simulation setting specified a total sample size of N = 10,000, with each subgroup containing n = 5 observations.
In addition to the traditional run-length metrics, this study also considers three overall performance measures—AEQL, PCI, and RMI—which provide a more holistic assessment of control chart performance across various process conditions. The RMI summarizes detection efficiency by quantifying the deviation of a chart’s performance from the ideal benchmark across multiple shift magnitudes. It is expressed as
R M I = 1 K i = 1 K A R L δ i c h a r t M i n A R L δ i A l l   c h a r t s M i n A R L δ i A l l   c h a r t s
where K is the number of shift magnitudes considered and A R L δ denotes the chart’s ARL under a specified shift δ . Smaller RMI values imply closer alignment with the best-performing scheme.
AEQL evaluates the overall cost associated with the delayed detection of process shifts. It is calculated as a weighted average of squared deviations from the target mean, scaled by run-length distribution. Formally,
A E Q L = 1 δ δ min δ max δ 2 × A R L δ
where δ denotes the size of process change, A R L δ denotes ARL related to a given shift δ , and δ indicates the total number of shift change studied between δ min and δ max . Lower AEQL values indicate more efficient detection with minimal monitoring loss.
The PCI provides a standardized benchmark for comparing control charts by scaling their performance relative to the best-performing chart. It is defined as
P C I = A E Q L A E Q L b e n c h m a r k
where A E Q L b e n c h m a r k refers to the value associated with the most operational control chart, defined as the minimum AEQL obtained among all competing schemes. A PCI value close to 1 reflects superior overall performance.
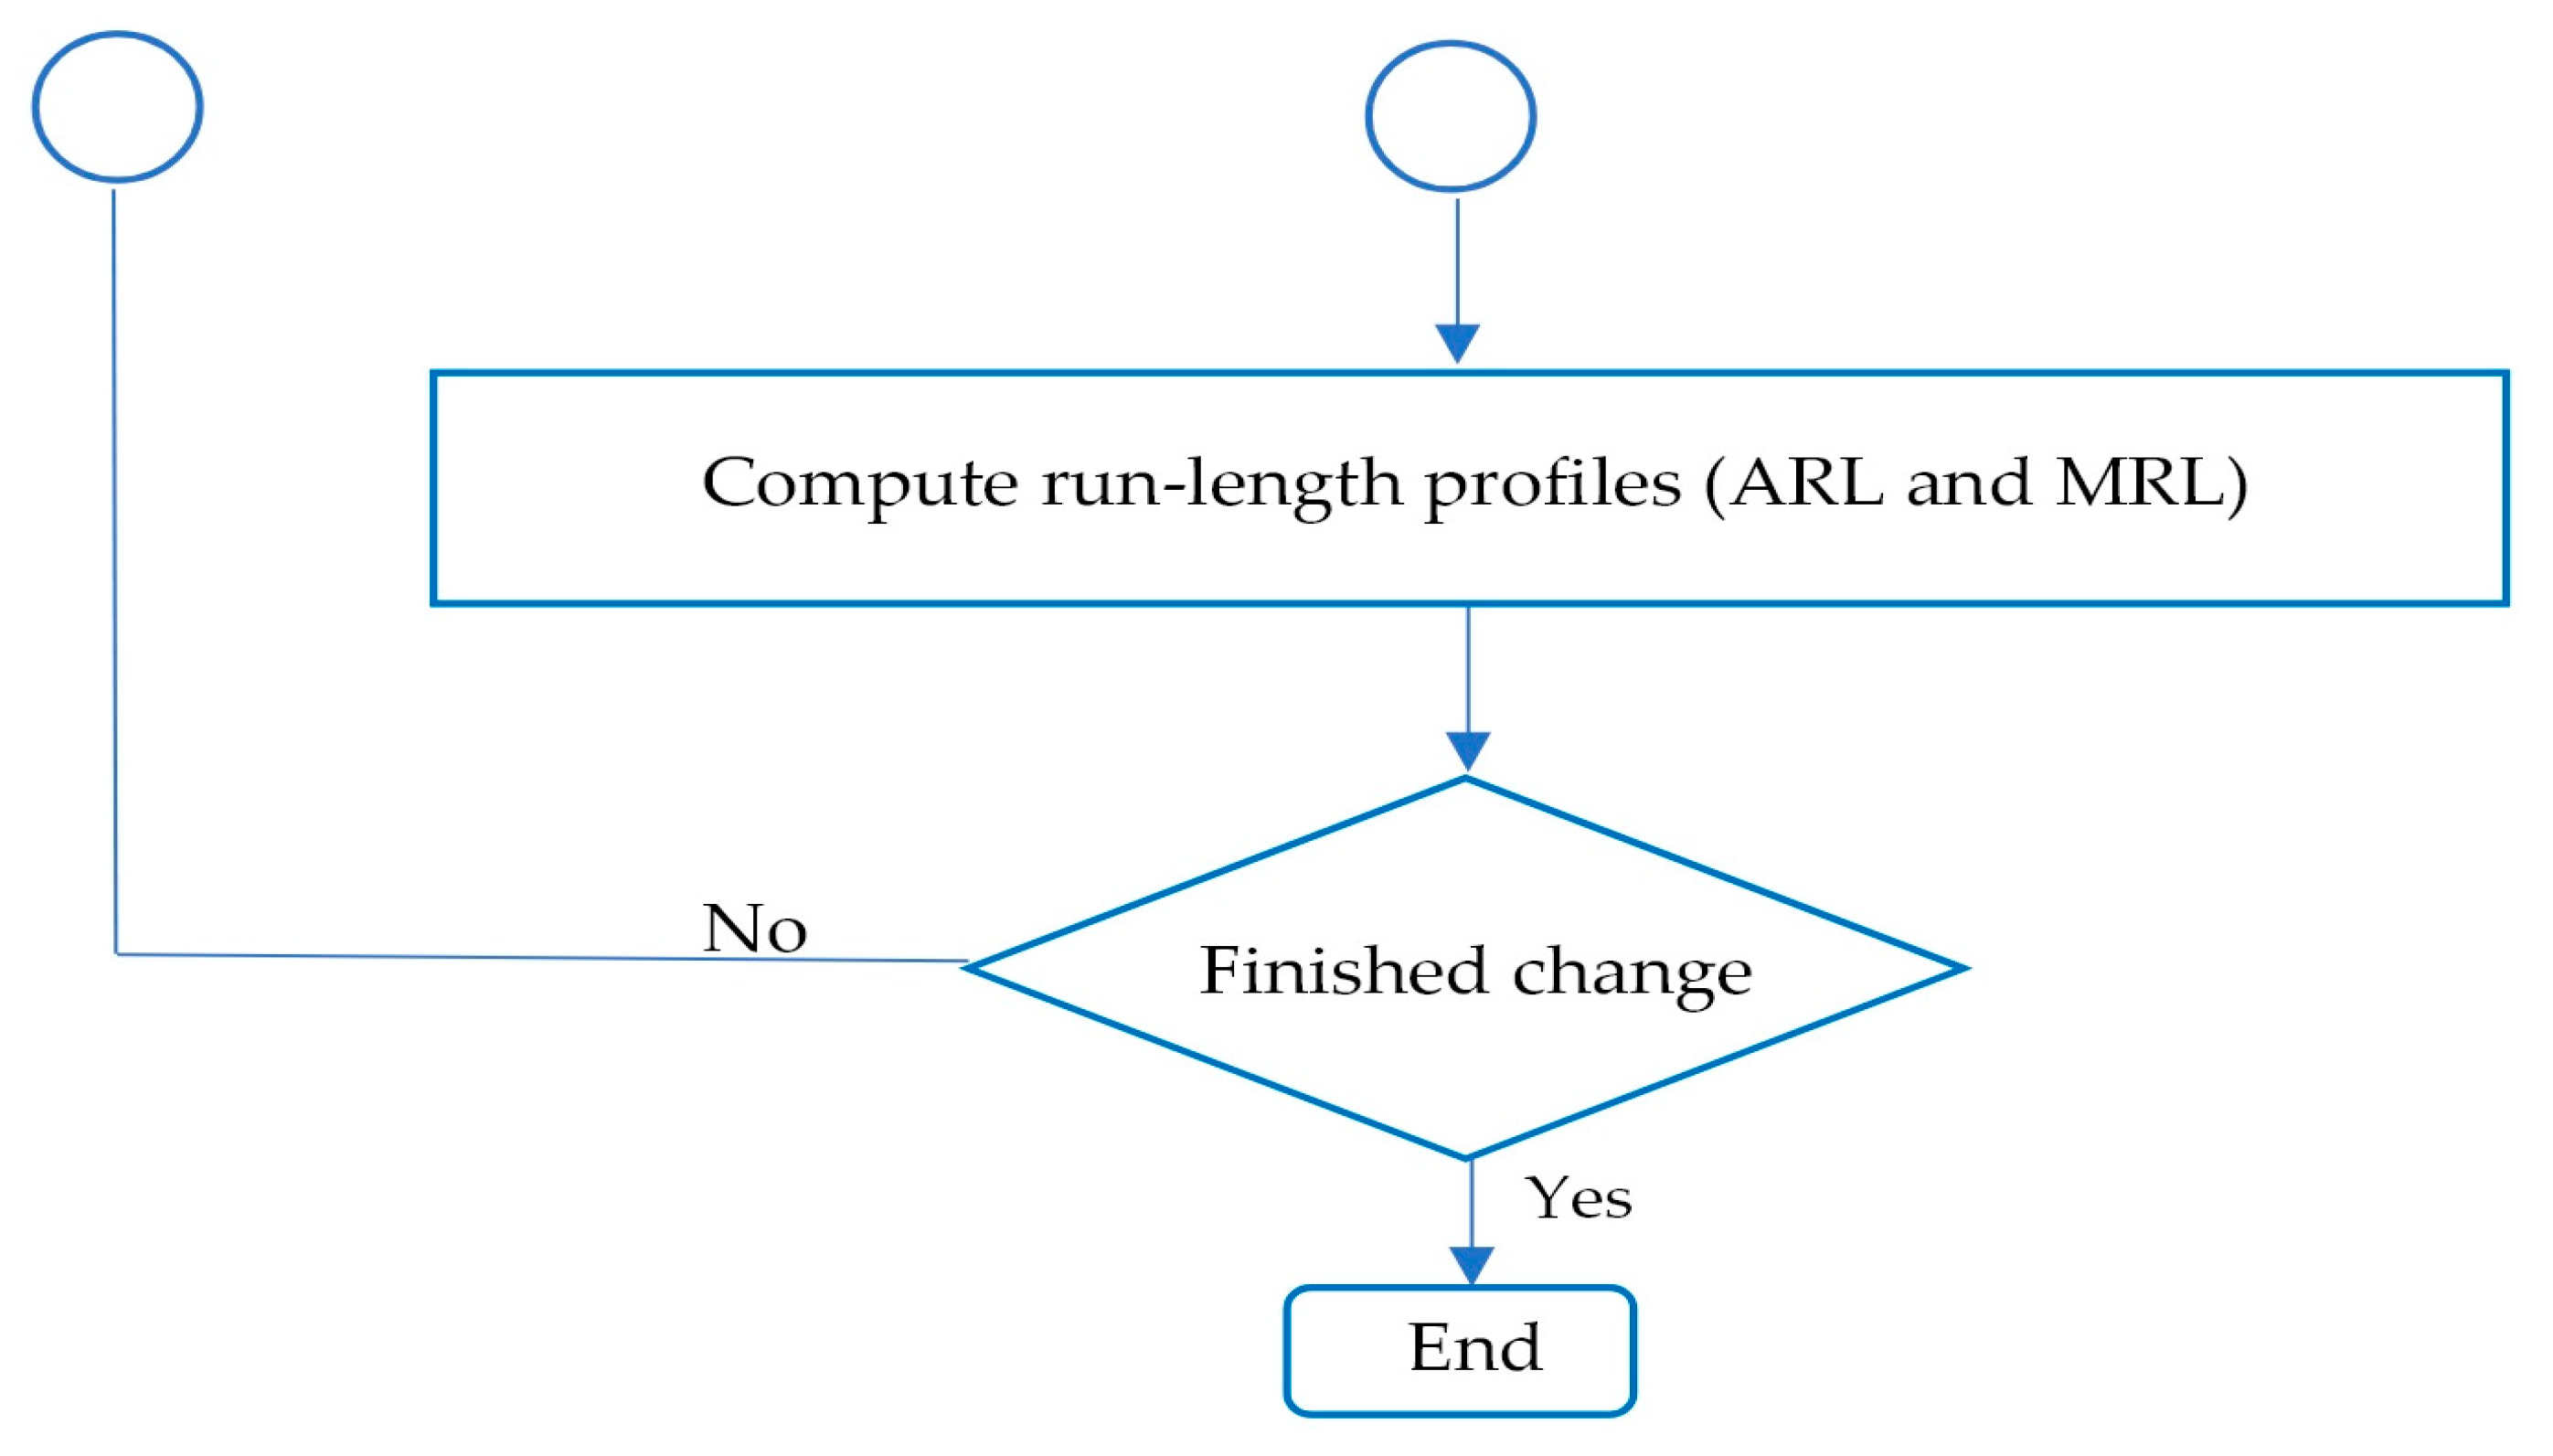
In this work, the run-length characteristics of the chart are evaluated through the MC approach implemented in the R statistical environment. Figure 1 explains the run-length profile computation process.

4. Simulation Results

This work aims to evaluate how effectively the proposed TEWMA–MA sign chart detects changes in the process mean, relative to several established alternatives, namely the MA, TEWMA, MA–TEWMA, TEWMA–MA, and MA–TEWMA sign charts. The assessment relies on the ARL and MRL, which are estimated through MC simulation under both symmetric and asymmetric distributional settings. For the symmetric case, the study considers a standard normal distribution N(0, 1) and a Laplace distribution with parameters (0, 1). For the asymmetric case, the exponential distribution with a mean of one and a gamma distribution with parameters (4, 1) are examined. From a quality monitoring perspective, a large in-control ARL value ( A R L 0 ) is suitable, as it corresponds to a lower rate of false alarms. Conversely, when the process experiences a change, a small out-of-control ARL value ( A R L 1 ) is preferred, since it reflects the ability of the chart to signal changes more rapidly. In an in-control state, the monitoring statistic is expected to stay inside prescribed control limits (LCL/UCL), whereas the out-of-control condition is declared when the statistic exceeds the UCL or drops below the LCL. Herein, the target in-control ARL ( A R L 0 ) is 370, and it evaluates performance under small ( δ = 0.025, 0.050, 0.075), moderate ( δ = 0.10, 0.25), and large ( δ = 0.50, 0.75) shifts. For comparative clarity, the smallest observed A R L 1 values are emphasized in bold, with their corresponding MRL values reported in parentheses.

4.1. Proposed TEWMA–MA Sign Control Chart

Table 1 and Table 2 present the ARL and MRL estimates of the TEWMA–MA sign chart under normal and exponential distributions, respectively, for different arrangements of the parameters n and λ , while maintaining A R L 0 = 370 and w = 5. Subgroup sizes n = 5 and n = 10, together with smoothing parameter λ 0.10 ,   0.25 ,   0.50 , are widely adopted as they balance sensitivity and operational practicality (see [12,14,15,20]). When the shift size δ grows, both ARL and MRL decrease. For smaller subgroups (n = 5), the detection speed is somewhat slower, particularly for small shifts ( δ 0.075). When the subgroup size increases to n = 10, the chart demonstrates improved sensitivity, with substantially lower ARL and MRL values for the same shift magnitudes. The parameter λ also influences detection performance, where higher values generally lead to slower responses for small shifts but maintain robustness for moderate and large shifts.

4.2. Performance Comparisons

Table 3 reports the ARL and MRL performance of several control chart structures under symmetric distributions, namely standard normal (0, 1) and Laplace (0, 1), with fixed parameters A R L 0 = 370, λ = 0.25, and w = 5. When the shift size δ grows, ARL and MRL estimates consistently decrease, reflecting improved detection ability under out-of-control conditions. Among the competing methods, the TEWMA–MA sign chart shows the most favorable results. Under normal distribution, it consistently yields the smallest A R L 1 and MRL estimates across nearly all shift levels, particularly for small to moderate shifts ( δ = 0.025–0.25). A similar pattern emerges under the Laplace distribution, where the TEWMA–MA sign chart again achieves superior sensitivity, detecting process shifts more quickly than the other schemes.
Similarly, Table 4 provides ARL and MRL estimates for various charts when underlying distributions are non-symmetric, specifically the exponential (1) and gamma (4, 1), with fixed parameters A R L 0 = 370, λ = 0.25, and w = 5. As the process shift magnitude δ increases, ARL and MRL values decrease sharply, reflecting the faster detection of departures from the target mean. Under the exponential distribution, the TEWMA–MA sign chart consistently achieves the lowest ARL and MRL values, particularly for small to moderate shifts ( δ = 0.025–0.25), indicating greater sensitivity compared with MA, TEWMA, and other hybrid charts. This advantage is even more evident for larger shifts, where the TEWMA–MA sign chart outperforms the alternatives by providing substantially shorter run lengths. A similar trend is observed under the gamma distribution. While all charts demonstrate decreasing ARL and MRL values as the shift size grows, the TEWMA–MA sign chart shows the most efficient detection. Its superiority is most pronounced for small and moderate shifts, where its ARL values are notably smaller than those of the competing methods, and this advantage persists for larger shifts as well.
In summary, regardless of whether the distribution is symmetric or non-symmetric, the analysis results clearly demonstrate that the TEWMA–MA sign chart is the most suitable for practical quality control applications, as it can maintain accuracy under normal conditions and quickly detect changes under abnormal conditions.

4.3. Overall Performance Comparison

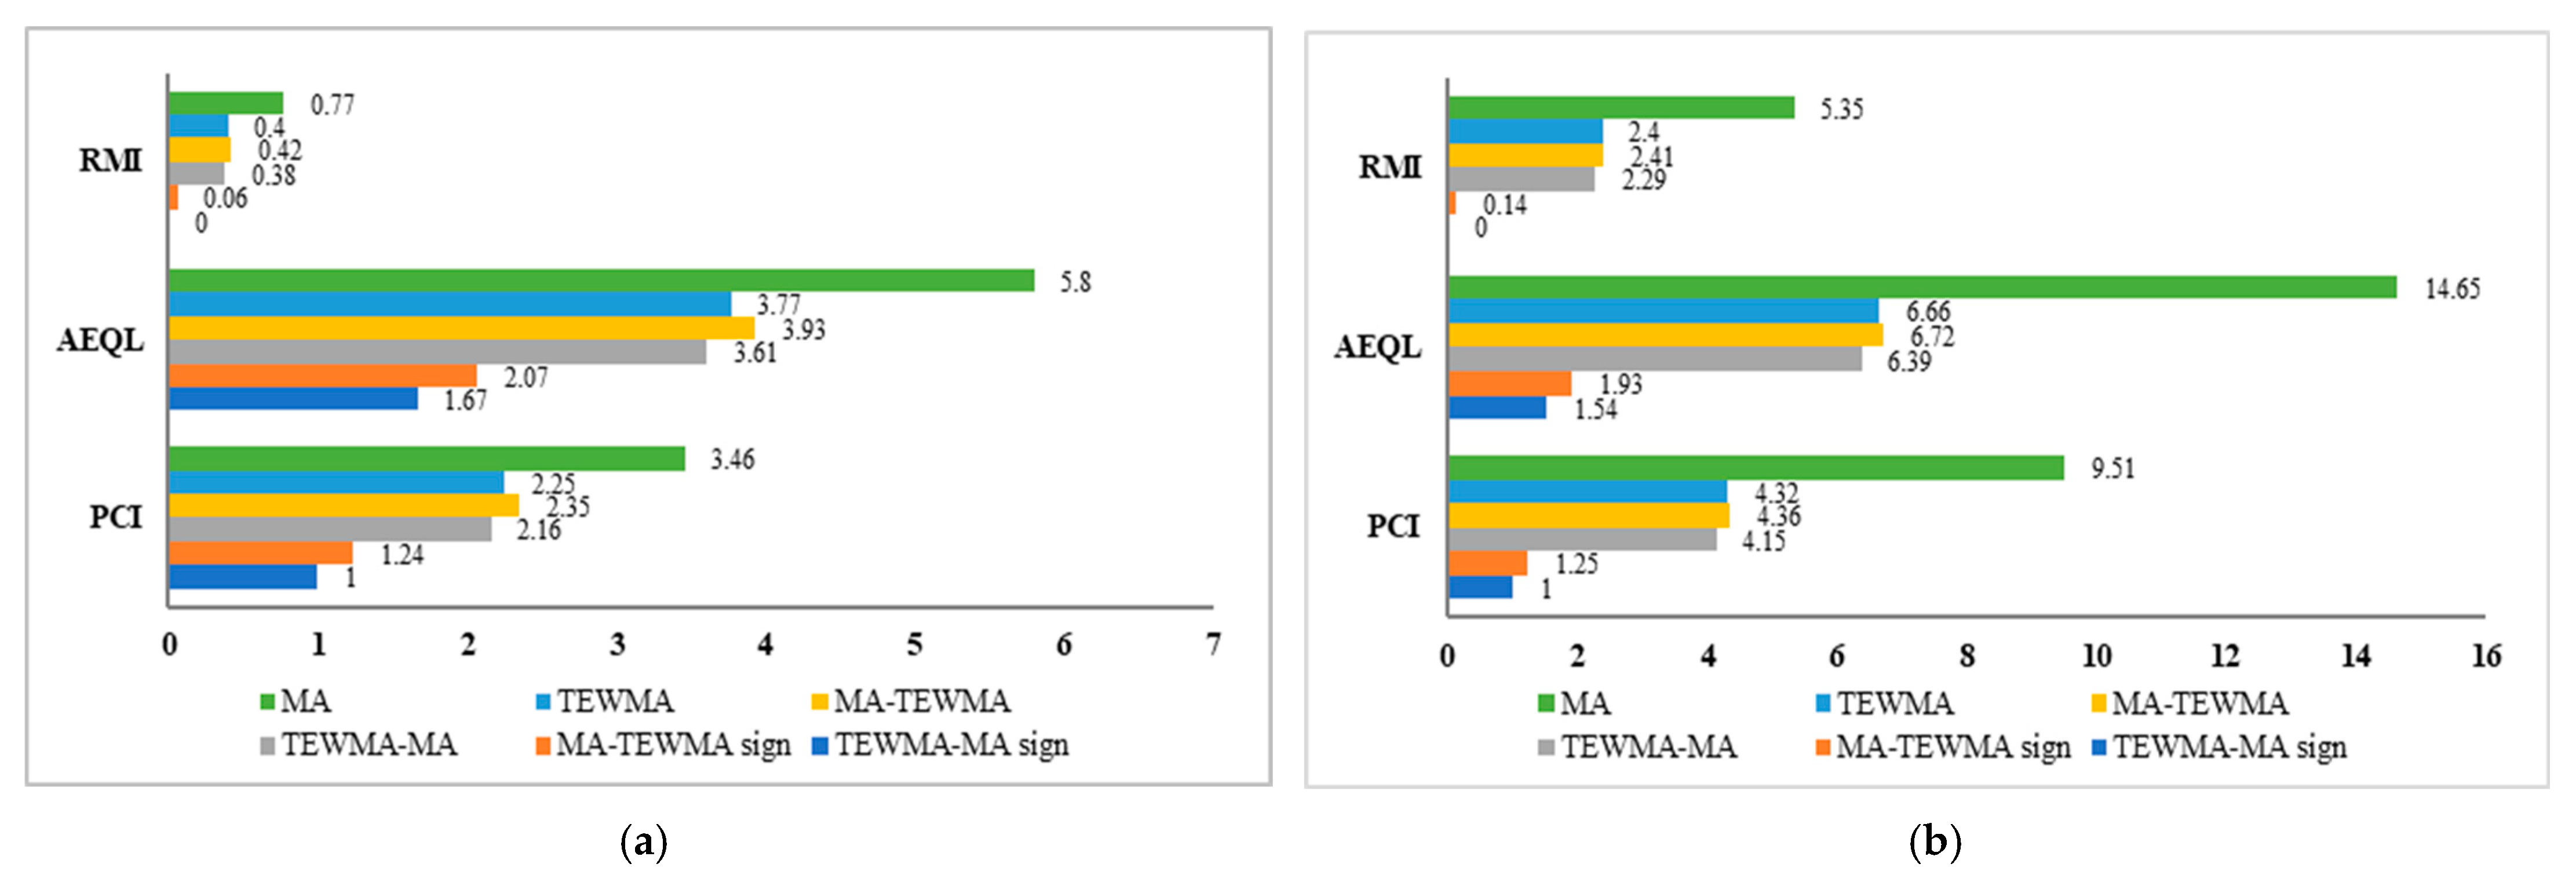
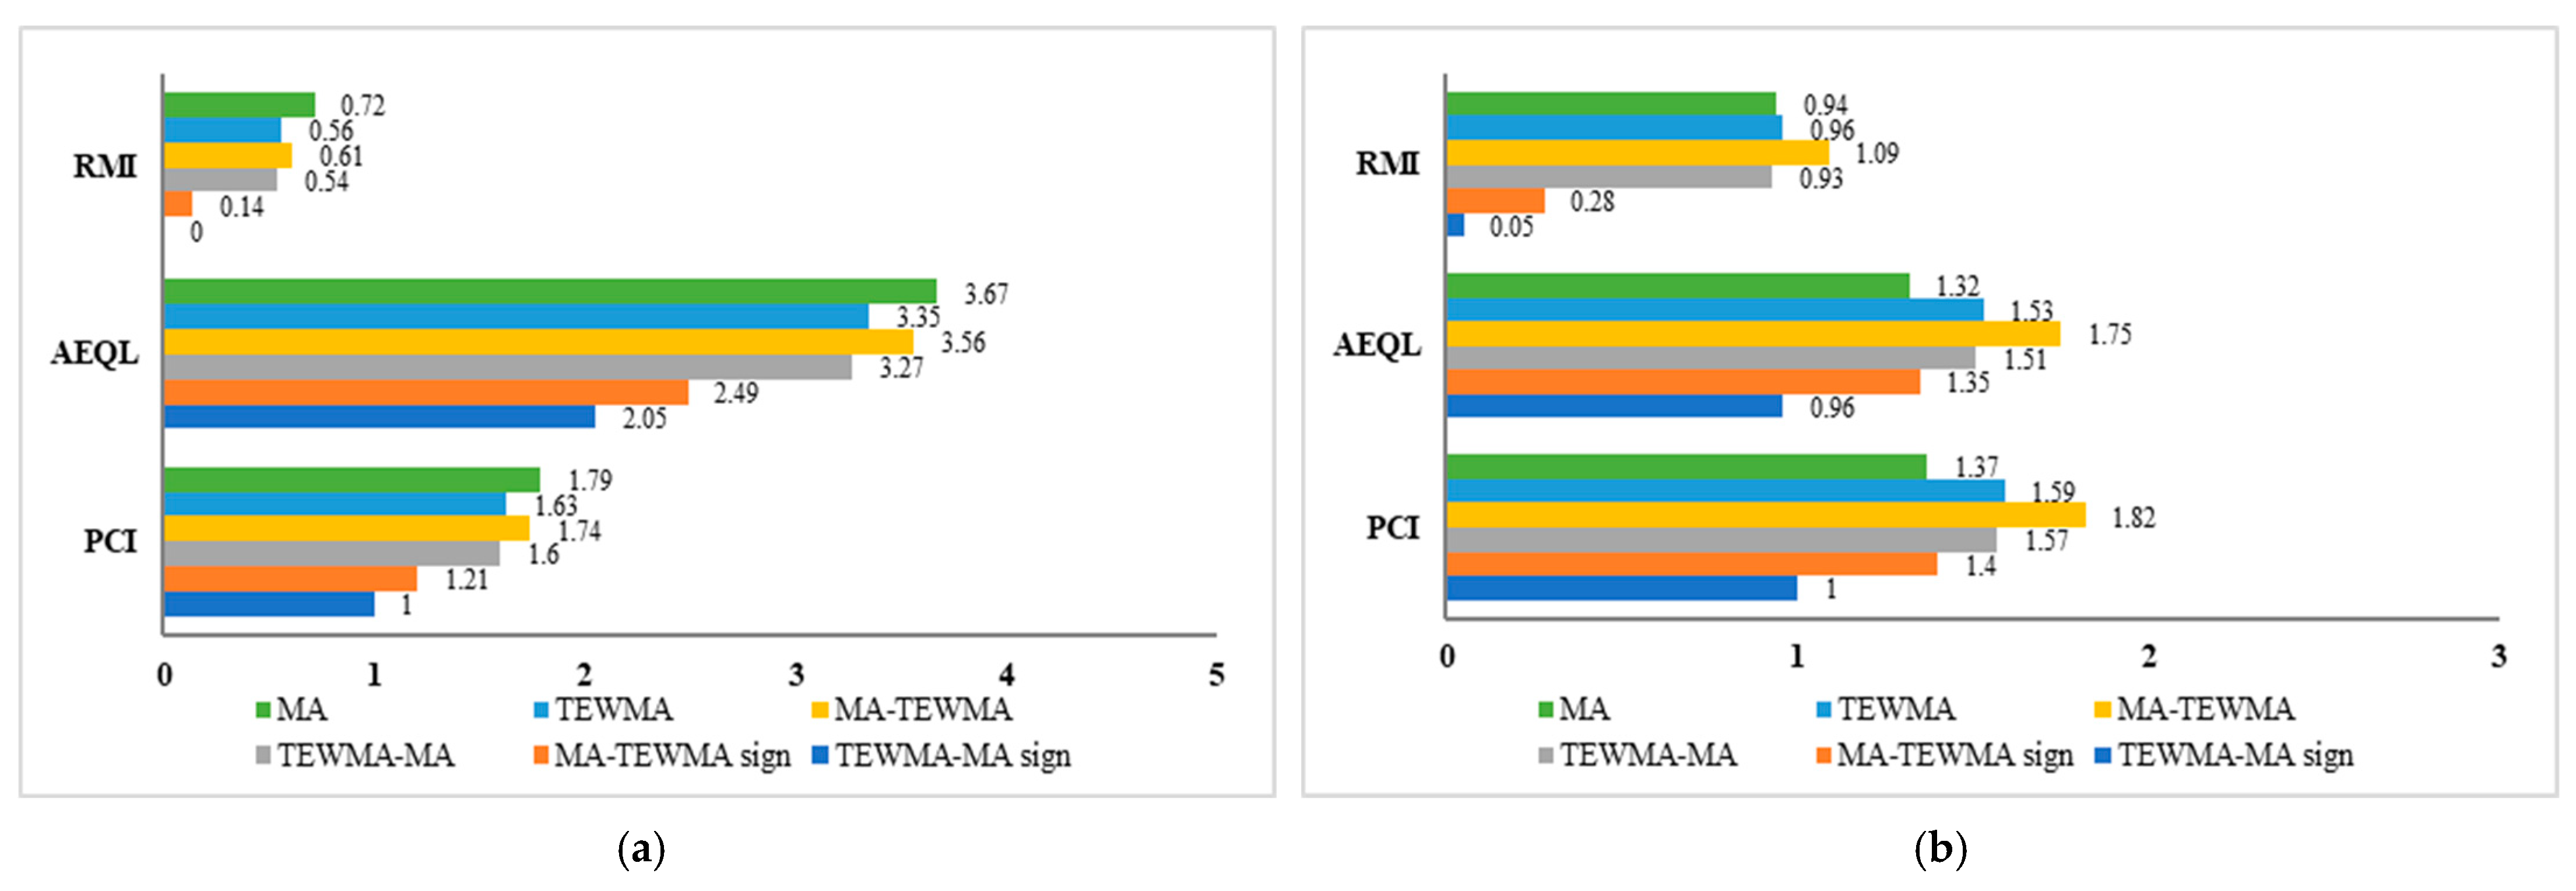
Table 5 presents the values of the RMI, AEQL, and PCI for different control charts under four distributions: normal (0, 1), Laplace (0, 1), exponential (1), and gamma (4, 1). These measures provide complementary perspectives on chart efficiency; lower RMI and AEQL values indicate better detection capability with less monitoring cost, while a PCI value closer to 1 reflects superior overall performance. The RMI, AEQL, and PCI graphs for the control charts evaluated under the symmetric and asymmetric distributions are shown in Figure 2 and Figure 3, respectively. This comparison highlights the relative performance of the MA, TEWMA, MA–TEWMA, TEWMA–MA, MA–TEWMA sign, and TEWMA–MA sign charts, demonstrating the differences in detection efficiency and overall performance across the various metrics.
For the normal distribution, the TEWMA–MA sign scheme has the lowest RMI and AEQL values, and the PCI values are close to 1, demonstrating its clear superiority compared to the other charts. A similar dominance is observed under the Laplace distribution, where the TEWMA–MA sign again produces the smallest RMI and AEQL, and the PCI values are close to 1, substantially outperforming the alternatives.
Under the exponential distribution, the TEWMA–MA sign chart maintains its advantage, yielding the smallest RMI and AEQ, and PCI values were equal to 1. The trend persists in the gamma distribution, where the TEWMA–MA sign consistently secures the lowest RMI (0.05), AEQL (0.96), and the optimal PCI (1.00).
Overall, across all examined distributions, the TEWMA–MA sign chart provides the most favorable trade-off between detection efficiency and monitoring stability, as evidenced by its consistently minimal RMI and AEQL values, coupled with the highest PCI. This result reinforces its robustness as a distribution-free monitoring tool.

5. Empirical Application

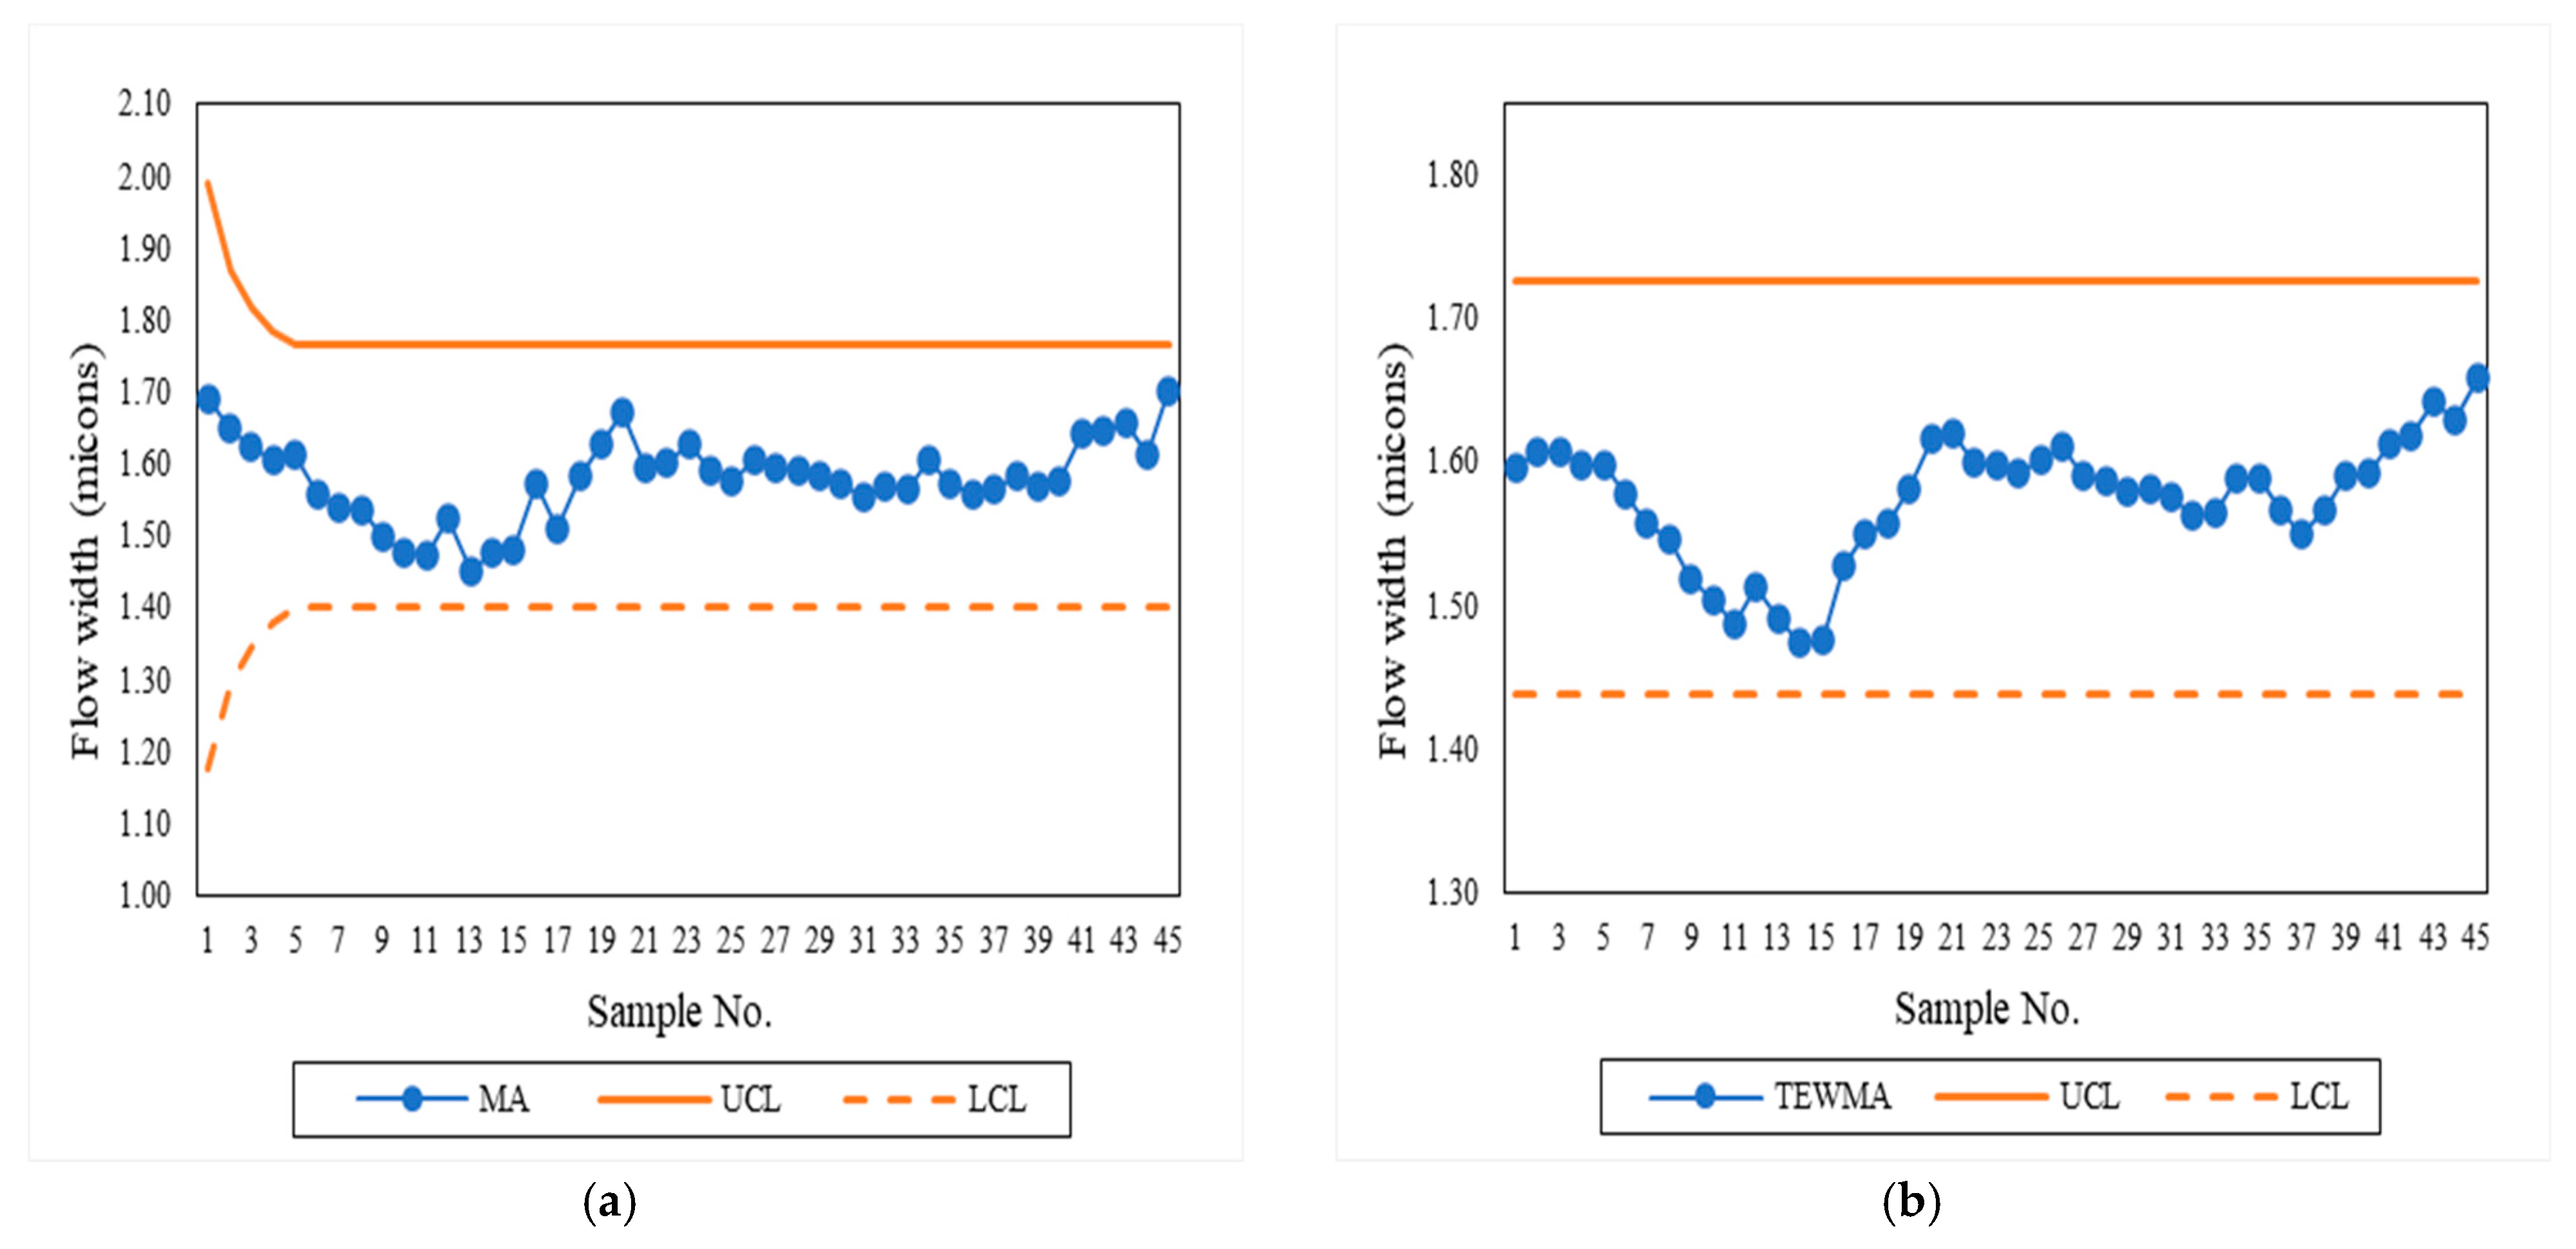
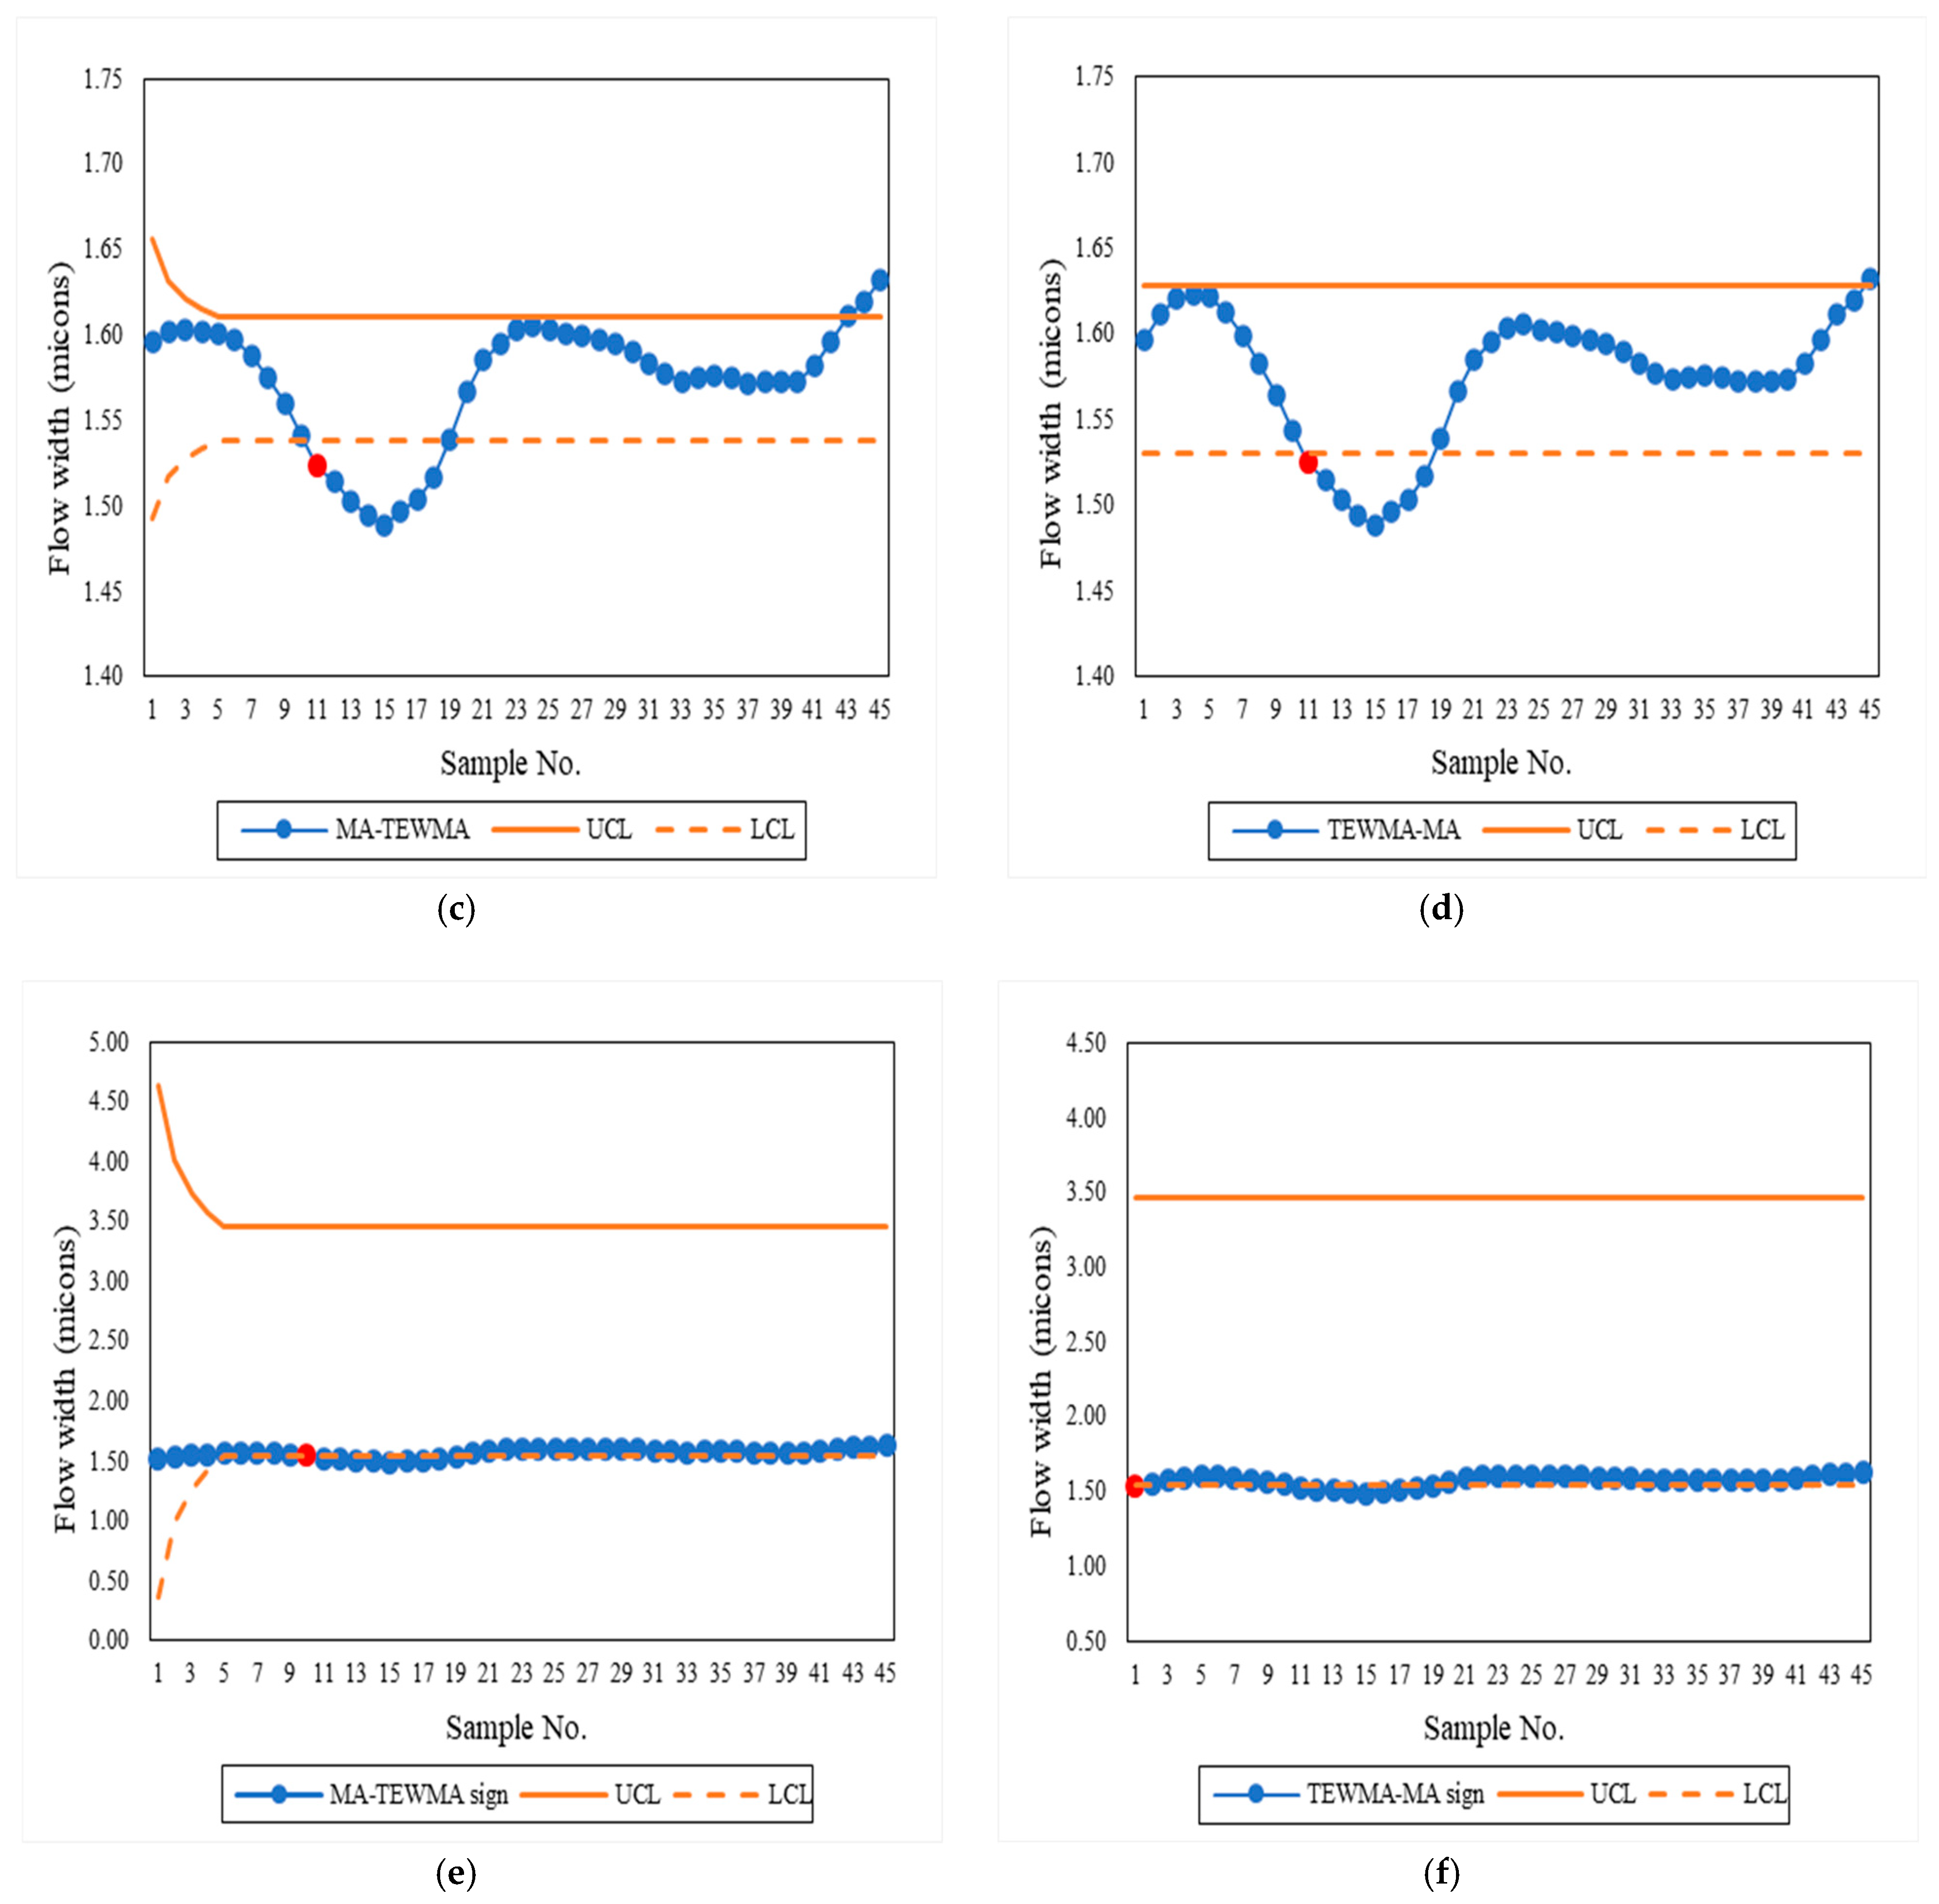
The efficacy of various control charts is evaluated in this section using data from an actual manufacturing setting. An operation is deemed to be uncontrollable if the computed chart statistic surpasses UCL or falls below LCL. The industrial dataset under investigation includes measurements of flow width (in microns) collected during the hard-bake process [23], the results of which are presented in Figure 4. The dataset has a mean of 1.53184 and a standard deviation of 0.07647. The distribution closely follows a normal pattern, with a normality test producing a p-value of 0.1104.
The analysis shows that the TEWMA–MA sign chart generates the earliest out-of-control signal, with the process change detected at the first sample. This is followed by the MA–TEWMA sign chart, which signals an out-of-control condition at the 10th sample. Both TEWMA–MA and MA–TEWMA signal concurrently at the 11th sample. Neither TEWMA nor MA signals an alteration in the procedure. These outcomes indicate that the TEWMA–MA sign chart provides a more powerful and faster detection of process changes relative to the MA, TEWMA, MA–TEWMA, TEWMA–MA, and MA–TEWMA sign charts.

6. Conclusions and Discussion

This study has examined the suggested TEWMA–MA sign control chart performance relative to a range of established alternatives, including the MA, TEWMA, MA–TEWMA, TEWMA–MA, and MA–TEWMA sign charts. The evaluation employed Monte Carlo simulation to estimate ARL and MRL under both symmetric and asymmetric distributions, complemented by overall efficiency measures such as the RMI, the AEQL, and the PCI. The findings consistently demonstrate that the TEWMA–MA sign chart offers substantial advantages across diverse conditions. Under symmetric distributions (normal and Laplace), the proposed chart not only maintained accurate in-control performance but also achieved markedly lower ARL and MRL values for small to moderate shifts, outperforming all competing schemes. A similar pattern emerged under asymmetric distributions (exponential and gamma), where the TEWMA–MA sign chart exhibited superior responsiveness, particularly in detecting subtle process deviations, while preserving robustness for larger shifts. Complementary performance measures reinforced these conclusions. Across all four distributions, the TEWMA–MA sign chart produced the lowest RMI and AEQL values, together with PCI values consistently close to unity, underscoring its efficiency and balance between sensitivity and stability. Taken together, these results establish the TEWMA–MA sign chart as a highly effective, distribution-free monitoring tool. Its ability to sustain correct calibration under in-control conditions, while providing the rapid detection of mean shifts across both symmetric and asymmetric settings, highlights its practical value for modern quality control applications, where both sensitivity and robustness are critical. In addition, the TEWMA–MA chart attains improved performance compared to simpler EWMA charts in situations where (i) the shifts are small-to-moderate and persist across several batches and (ii) the underlying distribution is asymmetric or heavy-tailed. Mathematically, the TEWMA–MA weight function is the convolution of three exponential kernels with a uniform kernel of width w. Compared to a single EWMA (a single exponential kernel), this convolution produces an effective weight profile that reduces the influence of very old observations while retaining memory of intermediate past samples and aggregating recent batch-level sign information through the MA window. The practical consequence is the faster accumulation of evidence for sustained directional changes in sign counts across batches, with increased robustness to skewness and outliers because the chart operates on batch sign counts rather than raw values.
Simultaneously, the authors conducted a comparative analysis between the recommended TEWMA–MA sign chart and the EEWMA sign chart [22] under a normal (0, 1) distribution, with control limits set to A R L 0 = 370 and a subgroup size of n = 5. Comparison results showed that the TEWMA–MA sign scheme consistently outperformed the EEWMA sign chart across all levels of process shifts. While the present investigation confirms the capability of the TEWMA–MA sign chart to identify minor and moderate shifts effectively across both symmetric and asymmetric settings, several avenues remain open for future exploration. One promising direction is the extension of the proposed framework to accommodate multivariate processes, where interdependence among quality characteristics introduces additional complexity. Another area for further work is the evaluation of chart performance under autocorrelated and non-stationary data structures, which are frequently encountered in modern industrial and service environments.

Author Contributions

Conceptualization, S.S.; and Y.A. methodology, S.S., Y.A. and P.S.; writing—original draft, P.S.; formal analysis, P.S.; resources, Y.A. and P.S.; validation, P.S.; visualization, Y.A. and P.S.; investigation, P.S.; project administration, Y.A. and S.S.; supervision, S.S.; writing—review and editing, S.S. All authors have read and agreed to the published version of the manuscript.

Funding

This research was funded by National Science, Research, and Innovation Fund (NSRF) and King Mongkut’s University of Technology North Bangkok (Project no. KMUTNB-FF-69-B-08).

Data Availability Statement

The data presented in this study is available in the article. The original data presented in the study are openly available at reference [23].

Conflicts of Interest

The authors declare no conflicts of interest.

Abbreviations

EWMAExponentially weighted moving average
DEWMADouble EWMA
TEWMATriple EWMA
MAMoving average
DMADouble MA
MEWMAModified EWMA
EEWMAExtended EWMA
CUSUMCumulative sum
GWMAGenerally weighted moving average
HWMAHomogeneously weighted moving average
DHWMADouble HWMA
ARLAverage run length
SDRLStandard deviation of run length
MRLMedian run length
PCIPerformance comparison index
AEQLAverage extra quadratic loss
RMIRelative mean index
MCMonte Carlo simulation

Appendix A

Prove the expected value of the TEWMA–MA sign chart. Following Alevizakos et al. [12], and after minor algebraic rearrangement, the TEWMA–MA sign statistic M T M j admits the equivalent representation:
W t = λ 3 2 j   =   1 t 1 λ t j t j + 1 t j + 2 M A S N j + 1 λ t 2 λ t λ t + λ + 2 + 2 n 2
If r = 1 λ 0 ,   1 and M A S N j ~ B i n n ,     1 / 2 are independent, E M A S N j = n / 2 for all j. From the linear expectation with (A1), we obtain
E W t = λ 3 2 j   =   1 t r t j t j + 1 t j + 2 n 2 + r t 2 λ t λ t + λ + 2 + 2 n 2
By substituting k = t − j, the following sum is obtained:
k + 1 k + 2
A closed-form expression for the finite polynomially weighted geometric sum is obtained through decomposition into standard geometric sums:
S t = 2 λ 3 1 r t 2 λ t λ t + λ + 2 + 2
With (A3) substituted into (A2), we have
E W t = n 2 λ 3 2 S t + r t 2 λ t λ t + λ + 2 + 2 = n 2

Appendix B

For the variance of the TEWMA–MA sign statistic, invoking (A1) and letting r = 1 λ 0 ,   1 yields
W t = λ 3 2 j   =   1 t r t j t j + 1 t j + 2 M A S N j + r t 2 λ t λ t + λ + 2 + 2 n 2
Under in-control conditions, the independence of N j ~ B i n n ,     1 / 2 gives V a r M A S N j = n / 4 w , while the constant second term of (A4) leaves the variance unchanged; therefore,
V a r W t = λ 3 2 2 j   =   1 t r 2 t j t j + 1 2 t j + 2 2 n 4 w
Let k = t − j and set q = r 2 . In a steady state, we obtain
V a r W = λ 3 2 2 n 4 w k = 0 r 2 k k + 1 2 k + 2 2 = λ 6 n 16 w S ,         S = k = 0 q k k + 1 2 k + 2 2
Expand the expression as a polynomial.
k + 1 2 k + 2 2 = k 4 + 6 k 3 + 13 k 2 + 12 k + 4
By applying the standard series identity, we get
S = q 1 + 11 q + 11 q 2 + q 3 1 q 5 + 6 q 1 + 4 q + q 2 1 q 4 + 13 q 1 + q 1 q 3 + 12 q 1 q 2 + 4 1 q
With q = 1 λ 2 and 1 q = 1 1 λ 2 = λ 2 λ , algebraic rearrangement yields
S = 4 λ 6 6 λ 1 λ 6 2 λ 5 + 12 λ 2 1 λ 4 2 λ 4 + 7 λ 3 1 λ 2 2 λ 3 + λ 4 2 λ 2
Thus,
V a r W = λ 6 n 16 w 4 λ 6 6 λ 1 λ 6 2 λ 5 + 12 λ 2 1 λ 4 2 λ 4 + 7 λ 3 1 λ 2 2 λ 3 + λ 4 2 λ 2                                           =     6 λ 1 λ 6 2 λ 5 + 12 λ 2 1 λ 4 2 λ 4 + 7 λ 3 1 λ 2 2 λ 3 + λ 4 2 λ 2 n 4 w

References

  1. Shewhart, W.A. Economic Control of the Quality of the Manufactured Product; Macmillan and Company: London, UK, 1931. [Google Scholar]
  2. Page, E.S. Cumulative sum charts. Technometrics 1951, 3, 1–9. [Google Scholar] [CrossRef]
  3. Roberts, S.W. Control chart tests based on geometric moving average. Technometrics 1959, 42, 239–250. [Google Scholar] [CrossRef]
  4. Shamma, S.E.; Shamma, A.K. Development and evaluation of control charts using double exponentially weighted moving averages. J. Qual. Reliab. Manag. 1992, 9, 18–25. [Google Scholar] [CrossRef]
  5. Sheu, S.H.; Liu, T.C. The generally weighted moving average control chart for detecting small shifts in the process mean. Qual. Eng. 2003, 16, 203–231. [Google Scholar] [CrossRef]
  6. Khoo, M.B.C. A moving average control chart for monitoring the fraction non-conforming. Qual. Reliab. Eng. Int. 2004, 20, 617–635. [Google Scholar] [CrossRef]
  7. Khoo, M.B.C.; Wong, V.H. A double moving average control chart. Commun. Stat. Simul. Comput. 2008, 37, 1696–1708. [Google Scholar] [CrossRef]
  8. Khan, N.; Aslam, M.; Jun, C. Design of a control chart using a modified EWMA statistic. Qual. Reliab. Eng. Int. 2017, 41, 100–114. [Google Scholar] [CrossRef]
  9. Naveed, M.; Azam, M.; Khan, N.; Aslam, M. Design of a control chart using extended EWMA statistic. Technologies 2018, 6, 108–122. [Google Scholar]
  10. Alevizakos, V.; Chatterjee, K.; Koukouvinos, C. The triple exponentially weighted moving average control chart. Qual. Technol. Quant. Manag. 2021, 18, 326–354. [Google Scholar] [CrossRef]
  11. Graham, M.; Chakraborti, S.; Human, S. A nonparametric exponentially weighted moving average signed-rank chart for monitoring location. Comput. Stat. Data Anal. 2011, 55, 2490–2503. [Google Scholar] [CrossRef]
  12. Alevizakos, V.; Chatterjee, K.; Koukouvinos, C. A nonparametric triple exponentially weighted moving average sign control chart. Qual. Reliab. Eng. Int. 2021, 37, 1504–1523. [Google Scholar] [CrossRef]
  13. Taboran, R.; Sukparungsee, S.; Areepong, Y. Design of a new Tukey MA-DEWMA control chart to monitor process and its applications. IEEE Access 2021, 9, 102746–102757. [Google Scholar] [CrossRef]
  14. Taboran, R.; Sukparungsee, S. An Enhanced performance to monitor process mean with modified exponentially weighted moving average-sign control chart. Appl. Sci. Eng. Prog. 2022, 15, 5532. [Google Scholar] [CrossRef]
  15. Ali, S.; Abbas, Z.; Nazir, H.Z.; Riaz, M.; Zhang, X.; Li, Y. On developing sensitive nonparametric mixed control charts with application to manufacturing industry. Qual. Reliab. Eng. Int. 2021, 37, 2699–2723. [Google Scholar] [CrossRef]
  16. Mahmood, Y.; Khoo, M.B.C.; Teh, S.Y.; Saha, S. On designing TEWMA-Tukey control charts for normal and non-normal processes using single and repetitive sampling schemes. Comput. Ind. Eng. 2022, 170, 108343. [Google Scholar] [CrossRef]
  17. Abbas, Z.; Nazir, H.Z.; Akhtar, N.; Abid, M.; Riaz, M. Non-parametric progressive signed-rank control chart for monitoring the process location. J. Stat. Comput. Simul. 2022, 92, 2596–2622. [Google Scholar] [CrossRef]
  18. Talordphop, K.; Areepong, Y.; Sukparungsee, S. Design and analysis of extended exponentially weighted moving average signed-rank control charts for monitoring the process mean. Mathematics 2023, 11, 4482. [Google Scholar] [CrossRef]
  19. Raza, M.A.; Tariq, F.; Zaagan, A.A.; Engmann, E.M.; Mahnashi, A.M.; Meetei, M.Z. A nonparametric mixed exponentiallyweighted moving average-moving average control chart with an application to gas turbines. PLoS ONE 2024, 19, e0307559. [Google Scholar] [CrossRef]
  20. Raza, M.A.; Amin, A.; Aslam, M.; Nawaz, T.; Irfan, M.; Tariq, F. Nonparametric mixed exponentially weighted moving average-moving average control chart. Sci. Rep. 2024, 14, 6759. [Google Scholar] [CrossRef]
  21. Abid, M.; Sun, M.; Shabbir, A.; Bakr, M.E.; Abbas, T. An enhanced nonparametric quality control chart with application related to industrial process. Sci. Rep. 2024, 14, 13561. [Google Scholar] [CrossRef]
  22. Talordphop, K.; Areepong, Y.; Sukparungsee, S. Design of nonparametric extended exponentially weighted moving average-sign control chart. Appl. Sci. Eng. Prog. 2025, 18, 7272. [Google Scholar] [CrossRef]
  23. Montgomery, D.C. Introduction to Statistical Quality Control Case Study; John Wiley and Sons: New York, NY, USA, 2008. [Google Scholar]
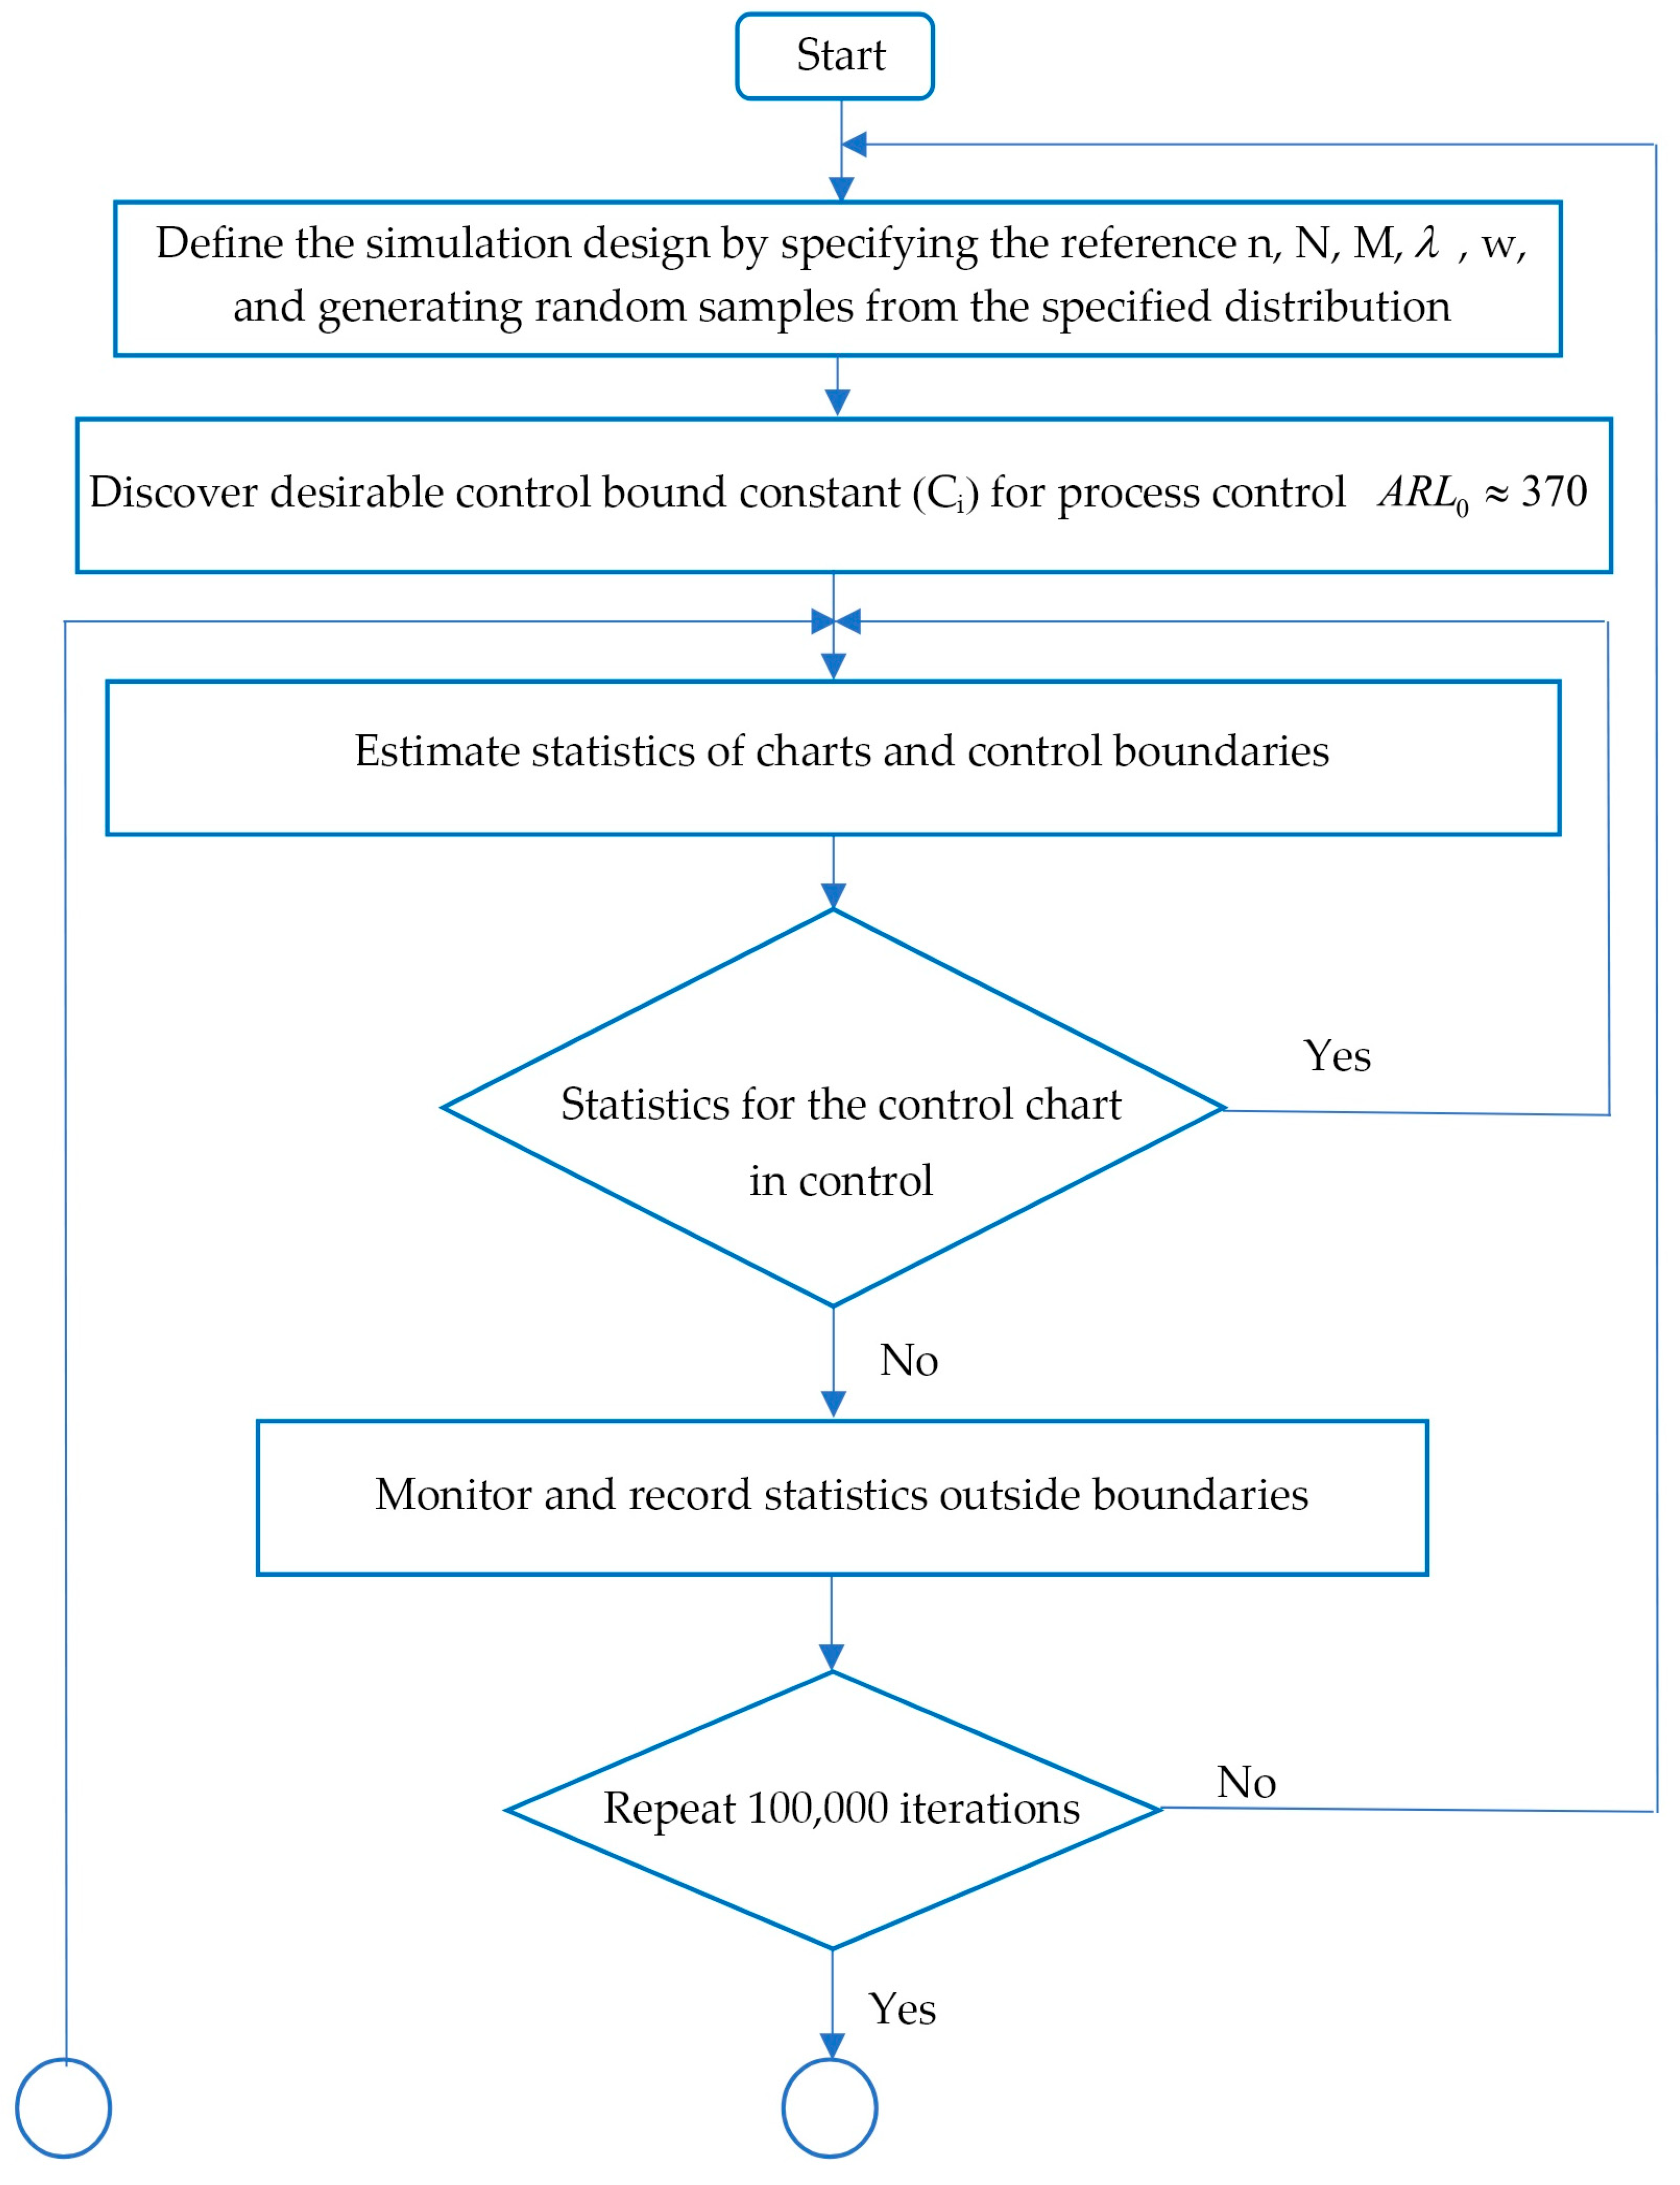
Figure 1. Design procedure of run-length profiles.
Mathematics 13 03789 g001aMathematics 13 03789 g001b
Figure 2. RMI, AEQL, and PCI graphics evaluated under symmetric distributions: (a) normal distribution and (b) Laplace distribution.
Mathematics 13 03789 g002
Figure 3. RMI, AEQL, and PCI graphics evaluated under non-symmetric distributions: (a) exponential distribution and (b) gamma distribution.
Mathematics 13 03789 g003
Figure 4. Observed values of actual data plotted on charts: (a) MA chart, (b) TEWMA chart, (c) MA–TEWMA, (d) TEWMA–MA, (e) MA–TEWMA sign, and (f) TEWMA–MA sign.
Mathematics 13 03789 g004aMathematics 13 03789 g004b
Table 1. ARL and MRL estimates of TEWMA–MA sign chart under normal distribution given varying parameter λ and n when given A R L 0 = 370 and w = 5.
n λ C δ
00.0250.0500.0750.100.250.500.75
50.104.44370.82
(261)
321.80
(227)
232.46
(166)
160.18
(116)
113.22
(83)
32.74
(28)
17.24
(16)
13.39
(13)
0.255.225370.41
(257)
339.69
(236)
269.90
(188)
201.16
(140)
146.51
(102)
32.51
(24)
10.19
(9)
6.48
(6)
0.505.193370.34
(252)
351.44
(239)
301.85
(205)
242.64
(165)
188.49
(128)
43.42
(29)
8.85
(6)
3.67
(3)
100.104.4375370.86
(260)
285.73
(202)
170.43
(124)
104.68
(78)
70.29
(54)
22.56
(21)
13.53
(13)
10.75
(11)
0.255.23370.75
(256)
311.17
(215)
211.02
(147)
135.66
(95)
89.15
(63)
17.17
(14)
6.65
(6)
4.61
(4)
0.505.2185370.72
(253)
331.92
(226)
250.22
(170)
175.54
(120)
121.10
(82)
19.63
(13)
3.92
(3)
1.78
(1)
Table 2. ARL and MRL estimates of TEWMA–MA sign chart under exponential distribution given varying parameter λ and n when given A R L 0 = 370 and w = 5.
n λ C δ
00.0250.0500.0750.100.250.500.75
50.1012.7185370.87 (269)241.68 (179)169.57
(129)
127.00
(99)
100.09
(80)
45.26
(41)
29.70
(29)
25.04
(25)
0.259.95370.27 (260)257.78 (183)184.82 (132)137.64
(99)
105.30
(76)
34.98
(27)
15.18
(13)
10.84
(10)
0.507.927370.68 (255)274.56 (191)207.44 (145)159.85 (111)125.31
(87)
39.43
(28)
12.22
(9)
6.42
(5)
100.1016.5975370.78 (270)207.77 (157)134.37 (105)96.40
(78)
75.00
(63)
37.62
(36)
27.06
(27)
23.23
(2)
0.2512.32370.59 (261)223.03 (158)143.68 (103)98.55
(72)
71.31
(53)
22.11
(18)
11.31
(11)
8.87
(9)
0.509.4675370.88 (256)243.38
(168)
166.07 (115)116.63
(81)
84.42
(59)
20.80
(15)
6.33
(5)
3.73
(3)
Table 3. ARL and MRL estimates comparison of various charts for symmetric distribution when provided A R L 0 = 370, λ = 0.25, n = 5, and w = 5.
Control ChartCi δ
00.0250.0500.0750.100.250.500.75
normal (0, 1) distribution
MAC1 = 2.885370.87 (257)366.99 (254)354.01 (245)334.22 (232)310.96 (215)162.82 (113)51.28
(36)
20.39 (14)
TEWMAC2 = 2.44370.86 (259)360.61 (251)333.63 (233)295.67 (208)255.25 (179)93.51
(67)
28.43
(22)
14.49 (12)
MA–TEWMAC3 = 5.215370.58 (259)359.73 (251)333.53 (234)294.75 (208)254.27 (179)93.43
(68)
29.53
(23)
15.98 (14)
TEWMA–MAC4 = 5.24370.65 (256)358.96 (248)332.33 (230)293.03 (203)252.17 (176)90.47
(64)
26.83
(20)
13.71 (12)
MA–TEWMA SignC5 = 5.1985370.54 (260)340.14 (240)272.13 (193)204.41 (145)150.19 (107)36.28
(28)
13.33
(12)
9.45
(9)
TEWMA–MA SignC = 5.225370.41 (257)339.69
(236)
269.90
(188)
201.16
(140)
146.51
(102)
32.51
(24)
10.19
(9)
6.48
(6)
Laplace (0, 1) distribution
MAC1 = 3.114369.98
(257)
369.45
(257)
366.94
(255)
360.60
(250)
352.53
(245)
278.06
(191)
147.07
(102)
74.07
(51)
TEWMAC2 = 2.495370.40
(261)
366.21
(257)
355.08
(249)
337.02
(236)
314.68
(220)
168.26
(119)
58.39
(43)
27.25
(21)
MA–TEWMAC3 = 5.3345370.79
(261)
366.71
(258)
354.69
(249)
335.50
(236)
313.23
(220)
166.47
(118)
58.41
(43)
28.30
(22)
TEWMA–MAC4 = 5.3655370.35
(256)
366.53
(254)
354.34
(245)
334.97
(232)
311.20
(215)
163.49
(114)
55.49
(40)
25.80
(20)
MA–TEWMA SignC5 = 5.199370.67
(259)
326.22
(230)
240.64
(171)
168.72
(120)
119.09
(86)
29.91
(23)
12.94
(12)
9.72
(9)
TEWMA–MA SignC = 5.2253370.26
(255)
324.81
(225)
237.66
(166)
167.89
(115)
115.18
(81)
26.23
(20)
9.81
(9)
6.75
(6)
Note: The MRL value is in parentheses. Bold text indicates the lowest ARL and MRL values.
Table 4. ARL and MRL estimates comparison of various charts for non-symmetric distribution when given A R L 0 = 370, λ = 0.25, n = 5, and w = 5.
Control ChartC δ
00.0250.0500.0750.100.250.500.75
exponential (1) distribution
MAC1 = 3.3435370.52
(255)
304.11
(209)
253.37
(174)
211.93
(146)
179.71
(123)
78.33
(54)
30.77
(21)
16.55
(12)
TEWMAC2 = 2.4493370.74
(258)
294.94
(206)
237.74
(166)
193.94
(136)
160.53
(113)
65.25
(47)
26.87
(20)
16.25
(13)
MA–TEWMAC3 = 5.23370.51
(258)
296.07
(207)
239.49
(166)
195.42
(137)
162.12
(115)
66.91
(48)
28.52
(22)
17.94
(14)
TEWMA–MAC4 = 5.2625370.35
(255)
294.16
(203)
236.44
(163)
191.97
(133)
158.38
(110)
63.69
(45)
26.07
(20)
15.96
(13)
MA–TEWMA SignC5 = 9.9385370.53
(262)
259.32
(185)
187.11
(135)
140.42
(102)
108.46
(80)
38.37
(31)
18.48
(17)
14.00
(13)
TEWMA–MA SignC = 9.95370.27
(260)
257.78
(183)
184.82
(132)
137.64
(99)
105.30
(76)
34.98
(27)
15.18
(13)
10.84
(10)
gamma (4, 1) distribution
MAC1 = 3.022370.92
(257)
264.63
(183)
192.79
(133)
143.76
(99)
109.43
(76)
31.30
(22)
9.09
(7)
4.33
(3)
TEWMAC2 = 2.436370.49
(261)
273.19
(191)
190.63
(134)
135.34
(96)
98.41
(70)
27.10
(21)
10.70
(9)
7.07
(6)
MA–TEWMAC3 = 5.2075370.43
(261)
275.07
(194)
192.12
(136)
136.94
(97)
99.73
(72)
28.65
(22)
12.39
(11)
8.82
(8)
TEWMA–MAC4 = 5.2328370.26
(258)
272.59
(189)
188.65
(131)
133.20
(93)
96.03
(68)
26.00
(20)
10.48
(9)
7.07
(6)
MA–TEWMA SignC5 = 7.29370.99
(261)
179.83
(129)
100.58
(73)
63.32
(47)
43.73
(34)
15.05
(14)
9.90
(10)
8.68
(9)
TEWMA–MA SignC = 7.305370.61
(259)
176.88
(125)
97.05
(70)
59.55
(44)
40.02
(30)
11.80
(10)
6.86
(7)
5.70
(5)
Note: The MRL value is in parentheses. Bold text indicates the lowest ARL and MRL values.
Table 5. RMI, AEQL, and PCI values of control charts.
Control ChartRMIAEQLPCIControl ChartRMIAEQLPCI
normal (0, 1) distributionexponential (1) distribution
MA0.775.803.46MA0.723.671.79
TEWMA0.403.772.25TEWMA0.563.351.63
MA–TEWMA0.423.932.35MA–TEWMA0.613.561.74
TEWMA–MA0.383.612.16TEWMA–MA0.543.271.60
MA–TEWMA Sign0.062.071.24MA–TEWMA Sign0.142.491.21
TEWMA–MA Sign01.671.00TEWMA–MA Sign02.051.00
Laplace (0, 1) distributiongamma (4, 1) distribution
MA5.3514.659.51MA0.941.321.37
TEWMA2.406.664.32TEWMA0.961.531.59
MA–TEWMA2.416.724.36MA–TEWMA1.091.751.82
TEWMA–MA2.296.394.15TEWMA–MA0.931.511.57
MA–TEWMA Sign0.141.931.25MA–TEWMA Sign0.281.351.40
TEWMA–MA Sign01.541.00TEWMA–MA Sign0.050.961.00
Note: The smallest RMI, AEQL, and PCI values are highlighted in bold.
Disclaimer/Publisher’s Note: The statements, opinions and data contained in all publications are solely those of the individual author(s) and contributor(s) and not of MDPI and/or the editor(s). MDPI and/or the editor(s) disclaim responsibility for any injury to people or property resulting from any ideas, methods, instructions or products referred to in the content.