Abstract
This paper investigates how institutional investors address the double externalities of green innovation (knowledge spillovers and environmental benefits) in China’s transition economy. Methodologically, we integrate fixed-effects econometric models with a double machine learning framework, employing random forest, gradient boosting, Lasso, and Ridge to optimize causal inference under high-dimensional controls. The results consistently show that institutional ownership significantly enhances both the scale and quality of green innovation, particularly when formal institutions inadequately internalize externalities. Mechanism analysis further reveals that corporate transparency acts as a compensatory governance tool, strengthening the role of institutional investors in mitigating market failures. We also document heterogeneous effects across informal institutional environments, where weaker Confucian culture and stronger market sentiment amplify investor influence. By combining econometric identification with machine learning optimization, this study advances methodological approaches to sustainable finance and offers policy insights into leveraging institutional investors as catalysts for environmental governance.
Keywords:
machine learning; green innovation; institutional investors; knowledge spillover externalities; environmental externalities MSC:
68T05; 62P20; 91B76
1. Introduction
The accelerating global climate crisis has brought corporate green innovation to the forefront of strategies for reconciling economic growth with environmental sustainability. Yet, despite its strategic importance, firms continue to underinvest in green innovation because it embodies a double externality: environmental benefits that diffuse broadly to society and knowledge spillovers that competitors can freely appropriate [1,2,3]. Double externalities reduce firms’ ability to capture private returns while exposing them to higher risks and uncertainties, thereby weakening incentives to invest in long-term green innovation [4]. These dynamics suggest that firms alone are unlikely to sustain the level of innovation required to meet societal demands. Against this backdrop, institutional investors have emerged as pivotal governance actors, as their concentrated ownership, active engagement, and long-term orientation enable them to influence managerial decisions and help mitigate the distortions created by unpriced externalities [5,6]. Understanding how institutional investors address the dual externalities of green innovation is essential for advancing both theory and practice in sustainable development.
Existing literature establishes two critical consensus points. First, institutional investors enhance corporate governance through active monitoring and engagement, mitigating agency costs and aligning management incentives with long-term value creation [7,8,9,10]. Second, green innovation is increasingly recognized as a strategic imperative where private returns intersect with public goods, necessitating alignment between firm-level incentives and societal environmental goals [11,12,13,14]. Rennings (2000) categorized the antecedents of green innovation into three types: technology push, market pull, and regulation push or pull [2]. Government policies that internalize environmental or knowledge spillover externalities enhance the ability of institutional investors to promote corporate green innovation [2,15]. By reducing regulatory uncertainty and aligning financial returns with sustainability goals, such policies amplify institutional investors’ influence in steering firms toward greener R&D investments [16,17]. This synergistic effect underscores the importance of cohesive environmental governance and investor stewardship in accelerating the low-carbon transition [18]. These foundations imply that institutional investors’ influence on green innovation should logically intensify when governments ensure the internalization of environmental and knowledge spillover externalities [18,19].
Moreover, the double externalities of green innovation have long been theorized to suppress green innovation absent policy interventions [2,11]. Simultaneously, institutional investors are posited to amplify governance quality where government supports, or regulatory infrastructures are robust [5,18]. In addition, when environmental benefits or knowledge spillovers are not internalized, firms face a “tragedy of the commons” [20], dampening investment incentives. Thus, a natural synthesis predicts that institutional investors’ pro-green impact peaks when externalities are internalized through affluent government subsidies, stringent environmental regulations, or intellectual property protection (IPP).
We analyze the effect of institutional investors on firms’ green innovation under the challenge of double externalities, emphasizing whether their impact intensifies when formal mechanisms of externality internalization are weak. Formally, we estimate a firm- and year-fixed effects Poisson model as the baseline specification and then extend the analysis using a double machine learning framework. The DML procedure combines cross-fitting with flexible learners—including random forest, gradient boosting, Lasso, and Ridge—to approximate high-dimensional nuisance functions m and g, thereby satisfying Neyman-orthogonality conditions. This design enables us to capture both linear and nonlinear structures in the data, reduce bias from high-dimensional confounders, and rigorously test whether institutional investors act as substitutes for incomplete institutional arrangements.
Contrary to the conventional prediction that stronger internalization of externalities should amplify investor influence, our results indicate that institutional ownership is more strongly associated with green innovation output under low government environmental subsidies or lax IPP regimes. Such findings suggest that institutional investors act as substitutes for weak externality internalization. To interpret this paradox, we situate the analysis in China’s economic transition and draw on insights from new institutional economics (NIE). China’s transition was marked by reforms that reshaped capital markets [21]. For example, the split-share reform expanded institutional ownership by enabling institutions to hold stock options previously off-limits, which in turn strengthened managerial oversight and provided buffers against risks in R&D experimentation [22,23]. As Menard et al. (2021) emphasize, macro institutions establish foundational regulations that shape the functioning of micro-level institutional arrangements, such as firm-level governance [24].
Our study contributes to the corporate governance and green innovation literature as well as to the co-evolutionary perspective in transitional economies [25]. First, to the best of our knowledge, this is the first attempt to show that institutional investors can substitute for weak externality internalization, challenging the expectation that more externalities necessarily suppress investment incentives [2]. While prior works emphasize ESG (Environmental, Social, and Governance) stewardship and impact investing [6,18], this study advances the debate by conceptualizing institutional investors as compensatory governors that internalize environmental and knowledge externalities through governance and ownership. Drawing on new institutional economics, we argue that institutional investors reduce transaction costs and clarify property rights in weak institutional environments, thus enhancing firms’ incentives for green innovation [26]. This integration positions institutional investors not merely as financiers [10], but as active institutional mechanisms in the green transition process. Second, by combining fixed-effects econometric estimation with double machine learning, our study provides a more comprehensive empirical strategy to uncover the paradox of stronger influence under market failures. We further highlight transparency as a compensatory governance mechanism, thereby recasting institutional investors from passive monitors to active architects of disclosure regimes. Third, we enrich the theoretical understanding of informal institutions in transitional economies by demonstrating how formal market reforms interact with informal institutions to shape environmental governance, echoing the NIE argument that institutions reduce transaction costs by aligning incentives [27,28].
Our findings hold critical lessons for policymakers navigating sustainability transitions in emerging markets. Rather than delaying green reforms until externality pricing mechanisms mature, regulators can strategically empower institutional investors through disclosure mandates to amplify transparency’s governance role and through stewardship incentives to align investor horizons with environmental goals.
2. Theoretical Analysis and Hypotheses Development
2.1. Institutional Investors and Firms’ Green Innovation
The relationship between institutional ownership and corporate green innovation is fundamentally shaped by the double externalities inherent in green technologies: environmental benefits that diffuse as non-excludable public goods and knowledge spillovers that competitors may freely appropriate [29,30]. Environmental benefits often take the form of non-excludable public goods, while spillovers enable competitors to imitate without bearing equivalent R&D costs.
Pigou (1920) suggest these market failures can be corrected through taxes or subsidies [31]. Yet Coase (2013) argues that the root cause of externalities lies in ambiguous property rights and costly coordination rather than market failure itself [26]. When property rights are clearly defined and transaction costs are low, private bargaining can internalize externalities efficiently [32,33]. However, in emerging markets with institutional imperfections, such ideal conditions rarely hold, and market-based solutions become less effective.
Drawing on new institutional economics, institutional investors can mitigate these inefficiencies by reducing transaction costs, improving contract enforcement, and promoting information disclosure [24,27]. Concentrated ownership enhances monitoring efficiency and mitigates managerial myopia, encouraging long-term environmental projects [34,35]. Moreover, environmental sustainability is a way to generate and capture value from externalities [36]. Integrating ESG considerations can improve firms’ risk-adjusted returns and cost of capital [37]. Furthermore, investors with explicit ESG mandates integrate environmental and social metrics into executive incentives, effectively transforming societal costs into corporate accountability [13,38,39]. By imposing disclosure requirements and sustainability-linked performance targets, institutional investors create quasi-regulatory frameworks that substitute for incomplete environmental governance mechanisms [40]. Thus, the following is proposed:
Hypothesis 1.
Institutional ownership is positively associated with firms’ green innovation. Moreover, when the double externalities of green innovation (i.e., environmental benefits or knowledge spillovers) are not effectively internalized, the positive effect of institutional investors on firms’ green innovation becomes even stronger.
2.2. Institutional Investors, Corporate Information Transparency and Green Innovation
Institutional investors influence green innovation not only directly but also through corporate information transparency, which serves as a governance mechanism to reduce agency costs and transaction frictions [41]. Transparency aligns managerial decisions with investor expectations and transforms the intangible social value of green innovation into measurable and verifiable indicators [42,43]. This mechanism echoes Tirole’s (2021) argument that modern economic systems increasingly rely on information transparency and reputation systems to promote prosocial behavior [44]. In the context of green finance, ESG disclosures and transparency practices operate as “soft control” mechanisms that substitute for incomplete formal regulation, encouraging firms to internalize environmental and knowledge externalities through reputational and market-based incentives. By enhancing the visibility and credibility of firms’ environmental efforts, institutional investors can leverage transparency to bridge the gap between private incentives and collective welfare, thereby reducing transaction costs and reinforcing sustainable innovation.
The effect of transparency is contingent on the degree to which externalities are internalized. In institutional environments with strong environmental subsidies and intellectual property protection, transparency mainly confirms compliance with existing norms. In contrast, under weak institutional environments, where environmental benefits and knowledge spillovers are not effectively internalized, transparency plays a compensatory role. By enforcing disclosure standards and sustainability reporting, institutional investors impose a form of shadow pricing on uninternalized externalities, thereby improving the accountability and efficiency of green investments [41,45].
Both types of externalities amplify this effect. When environmental subsidies are insufficient, disclosure of environmental performance provides investors with credible information to assess firms’ social value creation, enabling more targeted capital allocation. When knowledge spillovers are high and IPP weak, transparency over collaboration, licensing, or patent pooling reduces the risk of free-riding and facilitates cooperative innovation [41,42]. In both cases, greater transparency reduces information asymmetry, lowers financing costs, and strengthens investor confidence [5,46]. Taken together, we predict:
Hypothesis 2.
Institutional ownership drives firm green innovation through the mechanism of corporate information transparency. Moreover, when the positive externalities of green innovation (i.e., environmental benefits or knowledge spillovers) are not effectively internalized, the driving effect of this mechanism becomes even stronger.
2.3. Varying Responses Across Different Informal Institutions
Formal and informal institutions constitute interdependent pillars of institutions [27]. These two institutions function complementarily [28,47]. Confucian traditions, embodied through socially mandated virtues of benevolence, righteousness and ecological harmony, represent a pervasive informal institution in China, shaping managerial ethics via implicit normative constraints [47,48]. Conversely, institutional investors operate through codified contracts, audit mechanisms, and voting sanctions to exert formal institutional pressure.
From the perspective of new institutional economics, informal and formal institutions interact to determine how effectively environmental and knowledge externalities are internalized. In regions where Confucian heritage remains strong, shared moral norms and long-term orientation reduce the transaction costs of collective coordination and enhance firms’ capacity for self-regulated environmental responsibility and knowledge sharing [47,49]. These relational norms complement formal investor governance by fostering trust and legitimacy in sustainability-oriented collaboration, thereby facilitating the internalization of environmental externalities through moral self-restraint and of knowledge spillovers through socially embedded cooperation.
However, when Confucian values weaken, the informal mechanisms of self-discipline and trust-based coordination erode, creating governance voids that hinder firms’ ability to internalize externalities. In such contexts, institutional investors’ governance mechanisms, through contractual obligations, ESG disclosure requirements, and sustainability-linked performance monitoring [41], serve as formal complements that restore incentive alignment. By codifying accountability and institutionalizing missing incentive channels, institutional investors bridge the gap between private and social returns, partially substituting for the moral and relational enforcement once sustained by informal cultural norms. Therefore, this study proposes Hypothesis 3.
Hypothesis 3.
Institutional ownership has a greater positive influence on firms’ green innovation for firms located in regions with weaker Confucian values than those with stronger Confucian values.
In addition to cultural factors, market sentiment represents another important informal institution that shapes the cognitive and affective dimensions of investment and innovation behavior [50,51,52,53]. Market sentiment influences how institutional investors perceive and respond to green innovation’s double externalities by modulating risk tolerance and temporal orientation. During periods of high market sentiment, optimism about future market performance enhances investors’ willingness to bear short-term costs for long-term environmental and technological returns. Such conditions strengthen investors’ capacity to internalize environmental externalities by funding low-return but high-societal-benefit projects, and to internalize knowledge spillovers by supporting open innovation and technology diffusion [52,54].
Conversely, under low market sentiment, uncertainty and pessimism constrain investors’ willingness to assume the risks associated with long-term innovation [55], thereby weakening their role in externality internalization. Market contraction amplifies short-term profit motives and limits resources available for ESG engagement, reducing institutional investors’ corrective influence over green innovation. Therefore, we hypothesize:
Hypothesis 4.
Institutional ownership is more likely to influence firms’ green innovation at times of high market sentiment than of low market sentiment.
3. Data and Methodology
3.1. Sample and Data
We select A-share listed companies from 2007 to 2022 as research sample. We obtain data of green patent, environmental subsidies and Confucian academies from the Chinese Research Data Services Platform (CNRDS) database. Regional intellectual property protection (IPP) index is collected from China’s National Intellectual Property Administration. Other data are collected from the China Stock Market and Accounting Research database (CSMAR).
We processed the data in the following manner. First, we excluded ST, ST* and PT companies because their multi-year losses may skew the overall sample. Second, to mitigate the impact of outliers, we winsorized the continuous variables by 1% in both tails. We excluded corporates with missing values in relevant data. The resulting sample is diverse, spanning all major industries classified by the China Securities Regulatory Commission (CSRC), with a significant representation from manufacturing (approx. 60%), information technology, and wholesale & retail sectors. Geographically, the firms are distributed across 31 provinces in mainland China, with higher concentrations in economically developed coastal regions such as Guangdong, Zhejiang, and Jiangsu, which is representative of the landscape of listed companies in China.
To enhance transparency, we have now added a concise data flow table in the paper and explanatory notes on sample size variation. Eventually, 4771 companies were obtained, resulting in 32,392 company-year observations, see Supplementary Material Table S1 for details.
3.2. Variables and Measures
The independent variable “institutional ownership” is the proportion of shares held by institutional investors. The dependent variable is assessed through the number of green patent applications [56], while the quality of green innovation is evaluated by the number of green invention patent applications as invention is imbedded with stricter technology standards compared to other patents [57,58].
To capture environmental and knowledge spillover externalities, this study employs corporate environmental subsidies and the regional level of intellectual property protection (IPP), respectively, following the approach of Wang et al. (2024) [59]. First, lower levels of government environmental subsidies are interpreted as indicators of higher environmental externalities. Environmental subsidies are a major policy tool to internalize environmental externalities by bridging the gap between private and social returns [60,61]. When such subsidies are limited, firms bear the environmental innovation costs privately while the benefits accrue socially, reflecting a higher degree of uncorrected environmental externalities [62]. Second, weaker regional intellectual property protection (IPP) indicates higher knowledge spillover externalities, as firms are less able to appropriate returns from innovation. Stronger IPP mitigates knowledge spillovers by securing firms’ innovation rents and reducing free-riding incentives [63]. Therefore, regions with lower IPP face a wider gap between private and social returns.
In line with previous studies on green innovation [64,65], this research controls a series of variables that might influence firm’s green innovation. The mechanism variable is corporate information transparency. Following prior research [66,67], corporate information transparency is measured by the evaluation results of information disclosure by the Shanghai Stock Exchange and Shenzhen Stock Exchange. Table 1 gives detailed variable definitions.

Table 1.
Variable definitions.
3.3. Model Specification
3.3.1. Fixed Effects Poisson
Because the total number of green innovations is a count variable that has discrete nonnegative integer values, we used fixed effects Poisson Pseudo-Maximum Likelihood (PPML) regression models to test our hypotheses [68,69,70]. The main regression model is outlined below.
where is a measure of green innovation (green patent applications) for firm and reference year . And measures the proportion of institutional ownership. is a vector of controls. denotes a full set of individual fixed effects while represents a full set of year dummies; we always control both to remove the unobservable factors at individual and temporal levels. We cluster at the industry-year level. We use this specification when estimating effects for the whole sample, the subsamples, the mechanism and the heterogeneity. During estimation, some observations are automatically excluded by the ppmlhdfe estimator due to singleton or separated fixed-effect groups to ensure estimation stability [71].
To analyze the mechanism of institutional ownership on corporate green innovation, we constructed the following econometric models taking cues from the prior literature [67,72]. As the first step to evaluate the mechanism hypothesis, we use mediation analyses to formally evaluate the mediation effect of corporate information transparency (denoted by “”) on the relationship between institutional ownership and green innovation, by estimating the model below.
Then, we investigate whether the relationship between institutional ownership and green innovation evaluated in Equation (1) changes when we include corporate information transparency as additional control variable by analyzing the regression model below.
3.3.2. Double Machine Learning
To estimate the causal effect of institutional investors on firms’ green innovation under the challenge of double externalities, we adopt the double machine learning (DML) framework proposed by Chernozhukov et al. (2018) [73]. Compared with conventional fixed effects models, DML flexibly incorporates high-dimensional, potentially nonlinear controls through machine learning and then estimates the target parameter on orthogonalized residuals. This approach mitigates bias introduced by first-stage prediction errors and ensures robustness in causal inference [74,75].
Formally, let denote firm i green innovation outcome in year t, institutional investor ownership, and a high-dimensional vector of control variables including firm characteristics, market sentiment, and fixed effects. The baseline specification is:
where g is an unknown nuisance function, and is an error term with | = 0.
The treatment variable is modeled as:
where m is another unknown nuisance function and is the residual treatment component.
To obtain a Neyman-orthogonal score that is robust to first-stage estimation errors, we construct residuals from machine learning estimators .
The orthogonal estimating equation is then:
which yields the estimator:
To prevent overfitting and ensure valid asymptotics, we use K-fold cross-fitting. Specifically, partition the sample into K folds . For each fold K, we estimate nuisance functions and using data from all folds except , and compute residuals on :
Stacking across folds, the final DML estimator is obtained by regression of on .
Under standard regularity conditions [73], the DML estimator is root-n consistent and asymptotically normal:
with asymptotic variance:
In practice, we implement the nuisance function estimators using multiple machine learning algorithms. Random Forest (RF) and Gradient Boosting (GBM) to capture nonlinearities and interactions; Lasso and Ridge regressions for regularization and high-dimensional variable selection. This ensemble approach ensures robustness to model specification and allows us to assess the stability of estimates across different learners [76].
To ensure the robustness and replicability of our DML estimation, we provide further implementation details. We employ a K = 5-fold cross-fitting procedure with a fixed random seed (42) for all estimations. The high-dimensional vector of controls includes all firm-level control variables as defined in Table 1. To be consistent with our panel data structure, we apply a two-way (firm and year) de-meaning transformation to the outcome, treatment, and all control variables to account for fixed effects before the DML procedure.
The nuisance functions g and m are estimated using four distinct machine learning algorithms. For each algorithm, hyperparameters are tuned within each training fold using an internal 5-fold cross-validation grid search to minimize the Mean Squared Error (MSE), thus preventing overfitting and information leakage. The specific tuning approach for each learner is as follows. (1) Random Forest: We tuned the number of trees (n_estimators in {100, 200, 300}), maximum tree depth (max_depth in {5, 10, 15}), and the maximum number of features considered at each split (max_features in {‘sqrt’, 0.33}). (2) Gradient Boosting: The grid search included the number of boosting stages (n_estimators in {100, 200, 300}), the learning rate (learning_rate in {0.01, 0.05, 0.1}), and the maximum depth of individual trees (max_depth in {3, 4, 5}). (3) Lasso and Ridge: We utilized the LassoCV and RidgeCV implementations, which automatically perform cross-validation over a predefined grid of regularization parameters to select the one that minimizes prediction error.
This systematic approach ensures that our estimation is both data-driven and replicable. To visually summarize the estimation procedure, Figure 1 presents the workflow of our double machine learning implementation.
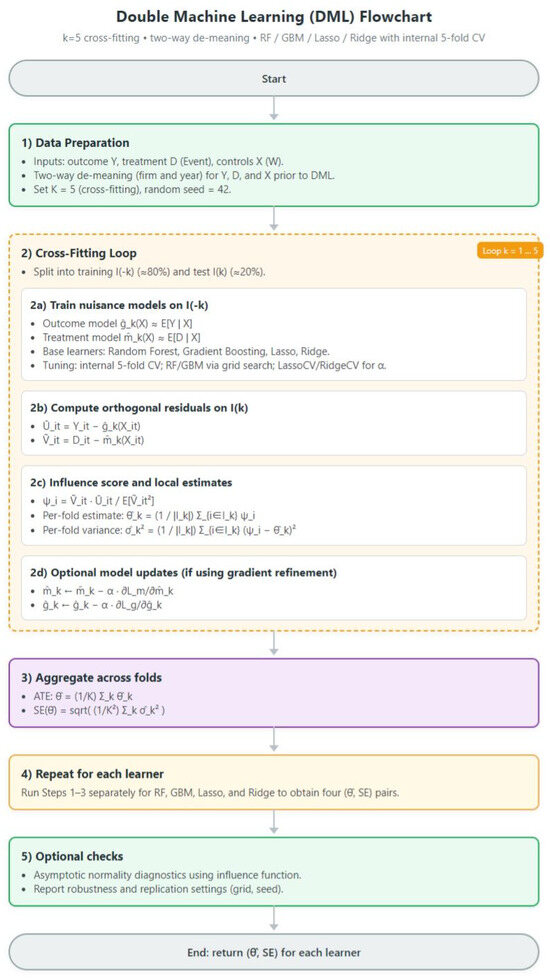
Figure 1.
Graphical workflow of DML.
4. Results and Discussion
4.1. Descriptive Statistics
Table 2 shows the descriptive statistics. The summary shows that the green patent application average at 7.374, while the max value and standard deviation are 1485 and 38.258, respectively. This indicates considerable differences in green innovation among firms. The mean of institutional ownership is 0.432, with a paramount of 0.938 and a standard deviation of 0.253, implying differences in institutional ownership level among Chinese listed companies. In addition, the proportion of zero observations is 52% for GreenPatent, 62.9% for GreenInvent, and 62.4% for GreenUtility. Figure 2 illustrates the distribution of green innovation.
Table 2.
Description of statistics.
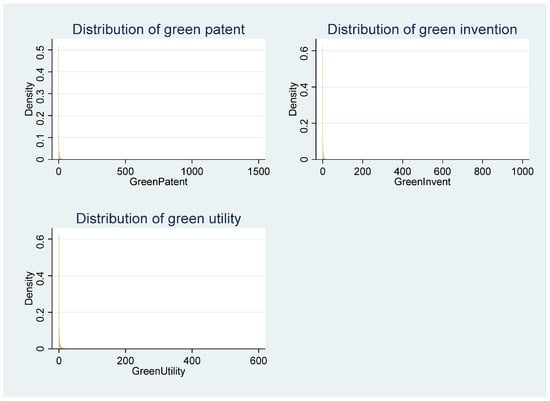
Figure 2.
Distribution of green innovation.
To examine variable correlations and assess multicollinearity of the variables, our study presents Pearson correlations in Table 3. The significantly positive correlation coefficients at 1% level for institutional ownership indicates institutional investor is positively correlated with both green patent and green invention. This provides preliminary support for Hypothesis 1. Furthermore, the coefficients between controls exhibit beneath 0.5, and the variance inflation factor (VIF) analysis yields an average VIF of 1.33, indicating that the absence of multicollinearity among variables.
Table 3.
Correlation test.
4.2. Results of Fixed-Effects Regression
We start with Poisson regressions to quantitatively estimate the influence of institutional ownership on corporate green innovation. In Table 4, the regression outcomes corresponding to Equation (1) are presented. In addition, Supplementary Material Figure S1 shows the path of the fixed effects coefficients for each year.
Table 4.
Results of baseline regression.
The estimated coefficients for institutional ownership in columns (1) and (2) of Table 4, 0.372 and 0.554, indicate that a 10% increase in institutional ownership leads to 0.0372 more green innovation quantity (GreenPatent) while the same increase leads to 0.0554 more green innovation quality (GreenInvent). For instance, using the mean and standard deviation of institutional ownership, a one-standard-deviation increase in institutional ownership corresponds to approximately a 6.8% rise in green patent applications and a 5.2% improvement in green patent quality. On the contrary, column (3) suggests the absence of a significant association between institutional investors and green utility innovation—the estimate is small and insignificant. Consistent with our expectations, the numbers in columns (1) and (2) of Table 4 reveal that institutional ownership exhibits a positive relationship relative to green innovation. This effect can be attributed to two reasons. First, institutional investors alleviate firms’ apprehensions regarding the positive externalities of green innovation, incentivizing managerial commitment to long-term sustainability investments that may lack immediate financial returns. Second, their stewardship enhances information transparency, enabling firms to credibly signal ESG alignment and mobilize complementary resources through strategic collaborations with eco-conscious stakeholders.
4.3. Results of Double Machine Learning
The double machine learning estimations reported in Table 5 and Table 6 provide consistent evidence that institutional investors significantly promote corporate green innovation. In Table 5, both random forest and gradient boosting yield positive and significant coefficients for green patents and green invention patents. For instance, the coefficient of institutional ownership on green patents is 3.262 under the random forest model and 2.689 under gradient boosting, both statistically significant. Similarly, the effect on green invention patents is 2.676 and 2.934, respectively, indicating that institutional investors foster not only the expansion of overall green patenting but also the generation of more technologically sophisticated inventions.
Table 5.
Results of DML (random forest and gradient boosting).
Table 6.
Results of DML (Lasso and Ridge).
Table 6 reports the results based on Lasso and Ridge regression, which provide further robustness checks with regularized estimation techniques. The findings are again consistent: institutional ownership has strong and highly significant effects on both green patents and green invention patents, with coefficients of 4.618 and 3.469 in the Lasso model, and 4.612 and 3.468 in the Ridge model, all significant at the 1% level. These results reinforce the conclusion that institutional investors are crucial drivers of green innovation. Interestingly, for green utility models, Lasso and Ridge estimations reveal positive and significant effects (coefficients of 1.148 and 1.144, respectively), in contrast to the insignificant results in Table 5. This divergence highlights that while institutional investors’ strongest influence lies in promoting high-value, invention-oriented green innovation, they may also indirectly support more incremental innovation activities when evaluated under linear regularization methods [77].
Taken together, the results across Table 5 and Table 6 demonstrate the robustness of our findings to different machine learning algorithms. The consistency of positive and significant effects on green patents and green invention patents underscores the role of institutional investors as compensatory governors in the face of weak externality internalization. Moreover, the nuanced differences observed for green utility models reveal that investors’ influence is not uniform across innovation types, but instead reflects a long-term orientation toward supporting innovation activities that are more likely to deliver sustainable competitive advantage and environmental benefits.
Fixed-effects regressions remain the gold standard for identifying within-firm variation and controlling for unobserved heterogeneity across firms and over time. However, such models may be limited in capturing high-dimensional, nonlinear relationships between covariates and outcomes. By employing double machine learning (DML) with algorithms such as random forest, gradient boosting, Lasso, and Ridge, we mitigate these limitations and provide a robustness check that flexibly accounts for complex interactions among firm characteristics, ownership structures, and institutional environments. This approach is particularly well suited for research on green innovation, where drivers are inherently multifaceted and nonlinear [73,78]. The consistency of our findings across econometric and machine learning estimators increases confidence that the observed effects are not artifacts of model specification but reflect genuine causal relationships.
Figure 3 visualizes the estimated coefficients and 95% confidence intervals from the four machine learning estimators, complementing the regression results presented in Table 5 and Table 6. For both green patents and green invention patents, the coefficients are consistently positive and statistically significant across all models. Random forest and gradient boosting, reported in Table 5, generate coefficients around 2.5–3.0, while Lasso and Ridge regressions, reported in Table 6, yield even larger effects exceeding 4.0 for green patents and around 3.5 for green invention patents. The relatively narrow confidence intervals in Figure 3 underscore the robustness of these findings and highlight that institutional investors exert a substantial and reliable positive influence on both the volume and the quality of green innovation [2].
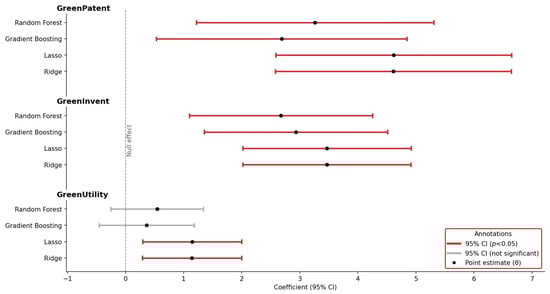
Figure 3.
Confidence interval.
By contrast, the results for green utility models display greater heterogeneity across methods. As shown in both Table 5 and Figure 3, random forest and gradient boosting produce coefficients that are close to zero with wide confidence intervals, indicating no systematic effect. In Table 6, however, the Lasso and Ridge estimations align with Figure 3 by showing positive and statistically significant coefficients of approximately 1.1, with narrower confidence intervals. This divergence across algorithms illustrates the methodological complementarity of nonparametric and regularized estimators: while tree-based methods may attenuate weaker innovation signals, penalized linear models emphasize more stable incremental effects. Taken together, Figure 3 and Table 5 and Table 6 demonstrate that institutional investors’ strongest impact is concentrated on high-value innovation outcomes—green patents and inventions—while their influence on utility models remains more modest and method-dependent [73].
It is important to note that the purpose of employing multiple machine learning algorithms is not to select a single “best” model, but rather to demonstrate the robustness of our core finding. The slight variations in the coefficient magnitudes across models reflect the different ways each algorithm approximates the underlying nuisance functions; for instance, tree-based models excel at capturing non-linear interactions, while regularized linear models are efficient in high-dimensional settings with potentially sparse signals. The consistent direction and statistical significance of the InstInvest coefficient across all four distinct learners strongly suggest that the positive causal relationship with green innovation is a robust feature of the data, not an artifact of a particular model specification.
4.4. Endogeneity Tests
While the baseline regression results confirm a significant positive correlation between institutional ownership and corporate green innovation, these findings may be subject to endogeneity concerns. On the one hand, unobserved factors that simultaneously affect both institutional investors’ asset allocation decisions and corporate green innovation could introduce endogeneity. On the other hand, institutional investors, guided by their asset allocation strategies, might proactively select and hold firms that already exhibit strong performance in green innovation to reap higher short-term profits. This behavior suggests a sample selection bias as well as reverse causality, as the positive relationship may not stem from the influence of institutional ownership on corporate decisions but rather from the initial choice of firms. To avoid endogeneity, this study employs two-stage least squares (2SLS) and Heckman two-step regression to correct for omitted variable bias, reverse causality and sample selection bias.
4.4.1. Two-Stage Least Squares Model
To attain consistent estimates of the relationship between institutional ownership and green innovation and mitigate potential biases due to unobserved factors and reverse causality, we employ 2SLS with two instrumental variables (IVs). The first is a binary variable representing the changes whether a firm is included in the CSI 500 Index (In500): In500 equal to 1 if a firm’s stock moved from outside to inside the index in the previous period and 0 otherwise. The second IV is the attention from security analyst specializing in the industry of the focal firms (Analyst). Analyst is the number of analysts in the securities company who have published research reports in the year. These two IVs satisfy the relevance principle: when a firm becomes part of the index, it tends to attract index-tracking and passive institutional funds, thereby increasing institutional ownership [79,80]; analysts closely monitor companies within the same industry, and their reports and recommendations have a substantial impact on institutional investor interest and decisions [81]. Meanwhile, these two share variables are not directly related to corporate green innovation, satisfying the exclusion principle of IV.
In column (1) of Table 7, both coefficients of In500 and Analyst are significantly positive in the first-stage regression. The second-stage regression results in column (2) and (3) verify the baseline results are reliable. Moreover, the Kleibergen-Paap rk LM statistic is significant at the level of 1%, which can reject the hypothesis of insufficient identification of instrumental variable. The weak instrumental variable test shows that both the Kleibergen-Paap rk Wald and Cragg-Donald Wald F statistics are greater than 19.93, rejecting the null hypothesis of weak IV at 1% level. The robust weak identification test, conducted with Anderson-Rubin Wald test, rejects the null hypothesis that the sum of the endogenous regression coefficients is zero at 1% level, which further supports the strong relevance of the IVs and institutional ownership. The Hansen J-statistic fails to reject the null hypothesis, suggesting that there are no issues with overidentification.
Table 7.
Endogeneity test: Two-stage least squares model.
4.4.2. Heckman Two-Stage Model
To address the potential issue of sample selection bias, this study employs the Heckman two-step regression model. In the first stage, we transform the independent variable into a dummy variable of institutional investors. This variable is coded as 1 if a firm’s institutional ownership is above the median of the distribution of the sample in the current year, and 0 otherwise. Following this, we construct a Probit regression model of on the control variables employed in regression (1) to calculate the inverse Mills ratio (IMR). In the second stage, we include the IMR obtained from the first stage as a control variable in the benchmark regression model to test the effect of possible selection bias on the research conclusion. We report the results of the second stage in Table 8.
Table 8.
Endogeneity test: Heckman selection model.
The results in Table 8 indicate that the IMR is significant in the two regressions, which suggests that the baseline regression results are indeed subject to endogeneity issues arising from sample selection bias. Therefore, it is necessary to control for this bias using the Heckman two-step regression. Unsurprisingly, the coefficients of the institutional ownership remain significantly positive at the 5% level for green patent and at the 1% level for green invention, indicating that the baseline regression results are robust and the conclusions hold after accounting for sample selection bias.
4.4.3. GMM Test
The dynamic GMM estimations presented in Table 9 highlight a significant and persistent influence of institutional investors on corporate green innovation. Across specifications, the coefficient of InstInvest is positive and statistically significant for both green invention patents and overall green patents, suggesting that firms with higher institutional ownership exhibit stronger incentives to engage in environmentally oriented innovation. This finding aligns with the view that institutional investors act as effective governance agents who reduce information asymmetry and encourage long-term, sustainability-driven R&D strategies.
Table 9.
Endogeneity test: Generalized Method of Moments (GMM).
The lagged dependent variables are also positive and significant, confirming the path-dependent and cumulative nature of green innovation—firms with past innovation records tend to maintain or expand such efforts. Diagnostic tests validate the reliability of the GMM specification: the Arellano–Bond AR (1) test indicates expected first-order autocorrelation, while AR (2) fails to reject the null of no second-order autocorrelation, and both Sargan and Hansen tests confirm instrument validity. Overall, these results provide strong empirical evidence that institutional investors play a sustained and catalytic role in promoting firms’ green innovation capacity.
4.5. Robustness Tests
4.5.1. Alternative Measure of Green Innovation
To enhance the robustness of our results, we use the number of a corporate’s authorized green patents as an alternative measure of green innovation quantity and the number of authorized green inventions as an alternative proxy for green innovation quality. The results, presented in columns (1) and (2) of Table 10, show that the coefficients for institutional ownership are both significantly positive in both models, further supporting the robustness of our main findings.
Table 10.
Other robustness tests.
4.5.2. High-Dimensional Fixed Effects and Standard Error Assumptions
Although the benchmark regressions controlled for year and individual fixed effects, the results might vary due to different regions and industries. This paper further control for city and industry fixed effects. The results in column (3) and (4) of Table 10 show that institutional investors significantly enhance green innovation after controlling for year, firm, city and industry fixed effects, indicating that the findings are robust. Furthermore, we controlled for joint fixed effects, including industry-year and region-year interaction fixed effects. See Supplementary Material Tables S2 and S3 for details.
4.5.3. Zero-Inflated Poisson Estimation
Furthermore, we conduct a robustness check by applying the zero-inflated Poisson model, which jointly models both the zeros and the nonzero counts. Column (5) and (6) of Table 10 present that zero-inflated Poisson regression results on the associations between institutional ownership and both types of green innovation are significantly positive. This is consistent with the baseline results.
4.6. Driving Role of “Double Externalities” and Mechanism Analysis
The preceding analysis has established that institutional ownership exerts a significant positive influence on corporate green innovation, attributable to their capacity to rectify the “dual externalities” of environmental protection and knowledge spillovers. Our theoretical analysis posits that when the positive environmental externalities of corporate green innovation are not effectively rectified (i.e., when government environmental subsidies are low), the incentive effect and mechanism of institutional investor involvement on green innovation are more pronounced. Here, this study conducts group regressions based on the mean level of government environmental subsidies. If the incentive effect and mechanism of institutional investors on corporate green innovation are more significant in firms with lower environmental subsidies, this would validate the driving role of environmental externalities.
Similarly, this study further considers the positive externalities of knowledge spillovers. If the incentive effect and mechanism of institutional ownership on corporate green innovation are more pronounced in regions with lower IPP, this would validate the driving role of knowledge spillover externalities. Accordingly, this study identifies whether the “dual externalities” of environment and knowledge spillovers play a key role in the incentive effect of institutional ownership on corporate green innovation.
4.6.1. Results of the Driving Role of “Double Externalities”
To verify the role of “double externalities” of green innovation in the impact of institutional investors on corporate green innovation, this study divides the sample into two groups based on the mean levels of government environmental subsidies and regional IPP and re-conducts group regressions on Equation (1). Table 11 reports the results of the group regressions based on the mean level of environmental subsidies, which are used to test the driving effect of positive environmental externalities. Columns (1) and (2) of Table 11 present the regression results for the high environmental subsidy group, while columns (3) and (4) show the results for the low environmental subsidy group. Consistent with our expectations, the impacts of institutional investors on green innovation are substantially positive in setting with low environmental subsidies where environmental externalities are greater. In contrast, there is no effect on firms with high environmental subsidies. Moreover, the coefficient difference tests are significant. This suggests that positive environmental externalities are indeed a significant factor in the impact of institutional ownership on corporate green innovation.
Table 11.
Impact of positive environmental externalities.
Table 12 presents the results of the group regressions based on the mean level of regional IPP which are used to test the driving effect of positive knowledge spillover externalities. The regression results for the high IPP group are shown in columns (1) and (2), and those for the low IPP group are shown in columns (3) and (4). The results indicate that for firms in regions with low levels of IPP, institutional ownership significantly enhances their green innovation performance. Conversely, for firms in regions with high levels of IPP, there is no correlation between institutional ownership and green innovation. Further, the coefficient difference tests reveal that for green innovation quantity, there is no significant difference in the impact of institutional ownership on green innovation between firms in regions with high and low levels of IPP. However, for green innovation quality, the inter-group difference is significant. Therefore, the positive knowledge spillover externalities are a key factor in the impact of institutional ownership on green innovation, and this impact is more pronounced in terms of green innovation quality.
Table 12.
Impact of positive knowledge spillover externalities.
4.6.2. Mechanism Analysis Under the Driving Role of “Double Externalities”
The empirical results of mechanism analysis based on Equations (2) and (3) are listed in Table 13. Column (1) shows that InstInvest is positively related to Opacity (coeff. = 0.174; p-value < 0.01). Column (2) shows a significant positive relationship between institutional ownership and green patent (coeff. = 0.06; p-value < 0.05). Column (3) shows that institutional ownership is positively and significantly related to green invention (coeff. = 0.073; p-value < 0.05). These results show that in the presence of corporate information transparency, institutional investors are positively related to green innovation quantity as well as its quality.
Table 13.
Mechanism analysis: corporate information transparency.
To further validate whether the “corporate information transparency” mechanism through which institutional ownership promotes corporate green innovation is driven by the “double externalities”, we conduct subsample mechanism tests. The subsample test results for environmental externalities are shown in Table 14. Columns (4)–(6) show that for firms with low environmental subsidies, where the positive environmental externalities of green innovation have not been effectively internalized, institutional investors can incentivize green innovation by enhancing corporate transparency. In contrast, in columns (1)–(3) for firms with high environmental subsidies, where the positive environmental externalities have been partially internalized, the effect of institutional investors on green innovation through the corporate transparency mechanism is not significant. In addition, the coefficient difference tests are significant.
Table 14.
Subsamples of environmental externalities: mechanism analysis.
Table 15 reports the impact of positive knowledge spillover externalities. Columns (4)–(6) show that for firms in regions with low levels of IPP, where the positive knowledge spillover externalities of green innovation have not been effectively internalized, institutional investors can incentivize green innovation by increasing corporate transparency. Conversely, columns (1)–(3) present that for firms in regions with high levels of IPP, where the gap between private and social returns from green innovation is relatively smaller and firms have a stronger motivation for green innovation, the effect of institutional investors on green innovation through the corporate transparency mechanism is not significant. The coefficient difference tests are also significant.
Table 15.
Subsamples of knowledge spillover externalities: mechanism analysis.
Therefore, the above results confirm Hypothesis 2 that both positive environmental externalities and positive knowledge spillover externalities are key factors driving institutional investors to promote corporate green innovation through information transparency.
4.7. Heterogeneity Effects
4.7.1. Confucian Culture Heterogeneity Analysis
To test Hypothesis 3, we conduct a heterogeneity analysis based on whether the intensity of Confucian culture is above or below the median of the sample. Drawing on the previous research [48,82,83,84], we use the number of Confucian academies within a 150-km radius of a firm’s registered address as proxy variable for the intensity of Confucian culture. We first split the sample around the median of Confucian culture intensity and then repeat the baseline regression in Equation (1). The regression results, in Table 16, show clear evidence that institutional investors positively affect both green patent and green invention at 1% significant level in the group of companies located in weak Confucianism atmosphere, while there are no effects from institutional shareholders to green innovation in the sample of firms in strong Confucian culture. The coefficient difference tests are significant.
Table 16.
Confucian culture heterogeneity regression.
4.7.2. Market Sentiment Heterogeneity Analysis
Next, we turn to the heterogeneity in market sentiment in Table 17. First, we use the total number of posts in the post forum of the listed company as a proxy for market sentiment [50,85,86,87]. Stock forums operate as unofficial, non-mandatory communication spaces where most participants are small investors who either hold or intend to hold the firm’s stock. The posting volume thus provides a firm-specific, high-frequency indicator of collective sentiment. Then, we divide the sample around the median of the market sentiment. The regression results, in Table 17, are consistent with our expectation in Hypothesis 4. Columns (1) and (2) show that the positive effects on green innovation are clearly driven by an increase in institutional ownership in the period of high market sentiment. However, there is no significant effect of the institutional investors on green innovation on the chances of low market sentiment, as shown in columns (3) and (4).
Table 17.
Market sentiment heterogeneity regression.
4.7.3. Institutional Ownership Heterogeneity Analysis
To further explore the heterogeneity of institutional investors, we distinguish between stable and trading institutional investors, following Sakaki & Jory (2019) and Zhang et al. (2025) [84,88]. This distinction captures differences in investment horizons and behavioral characteristics that may shape firms’ green innovation in distinct ways. We analyze the impact of different types of institutional investors on corporate green innovation by dividing firms into two groups, based on institutional ownership volatility.
Following previous research [84,88], we classified institutional investors into stable institutional investors and trading institutional investors according to institutional ownership volatility. Specifically, we calculate an indicator to measure institutional ownership volatility.
where represents institutional ownership for firm i on year t. represents the standard deviation of institutional ownership over the previous three years, which is used to measure institutional ownership volatility. represents the median of the volatility of institutional ownership for industry j on year t. Then, we classify institutional investors as stable institutional investors in the firm i on year t if is greater than or equal to the median. Conversely, we define institutional investors as trading institutional investors in the firm i on year t if is lower than the median.
We report the results in Table 18. Column (3) and (4) show that the coefficients of stable institutional ownership are 0.859 and 1.124, which are statistically significant at the 1% level. This indicates a positive correlation between trading institutional ownership and corporate green innovation. Column (1) and (2) show that the coefficients of stable institutional ownership are not significant. This indicates no significant impact of stable institutional ownership on corporate green innovation. This finding provides a novel insight into the heterogeneity of institutional investors. Contrary to the conventional view that long-horizon investors are the primary promoters of sustainability-oriented innovation, the results suggest that short-horizon trading institutional investors are more responsive to market-based ESG incentives and policy signals in China’s transition economy, whereas stable investors tend to adopt a more cautious approach amid institutional uncertainty.
Table 18.
Institutional investor heterogeneity regression.
5. Implications and Limitations
5.1. Theoretical Implications
First, this study highlights the positive role of institutional ownership in promoting green innovation, offering new insights from the perspective of externality internalization. Our findings suggest that institutional investors help drive green innovation even in the presence of weak externality internalization, underscoring their compensatory role in China’s transition economy. This extends the classic argument that institutions reduce transaction costs by showing that financial market actors can also mitigate the market failures associated with the double externalities of green innovation [1,2,27]. In doing so, our study emphasizes how external governance actors shape firms’ sustainability strategies under institutional voids [89], and enrich the growing sustainable finance and ESG stewardship literature [6,10,18], by conceptualizing institutional investors not merely as capital providers but as institutional agents capable of aligning private incentives with social sustainability goals.
Second, this study enriches the literature on corporate governance and sustainable finance by introducing transparency as a key mechanism through which institutional investors exert influence. While prior work has often focused on regulatory disclosure mandates [90], we show that investors themselves can strategically leverage transparency to alleviate information asymmetries and innovation-related uncertainties. This mechanism not only complements research on corporate information environments [91], but also extends that private actors increasingly shape environmental outcomes through soft governance and voluntary monitoring [92]. By framing transparency as an active tool of investor governance, we reposition institutional investors from passive monitors to proactive architects of innovation-oriented disclosure regimes.
Third, our findings contribute to the co-evolutionary perspective on institutions in transitional economies. The Chinese context illustrates how macro-level reforms, such as the split-share reform, interact with micro-level governance mechanisms like institutional investor activism to produce systemic effects on innovation. This shows how ownership structures and capital market reforms shape firm-level innovation trajectories [93]. By situating institutional investors within the framework of new institutional economics, we demonstrate that they operate at the intersection of formal and informal institutions, bridging regulatory gaps while aligning corporate strategies with long-term environmental objectives. In this way, our study advances theories of institutional change and sustainability governance by showing how financial actors become embedded in the institutional fabric of green transitions [94].
Beyond the theoretical insights, this study makes a methodological contribution by integrating econometric identification with modern machine learning optimization. Specifically, we employ a double machine learning (DML) framework that combines cross-fitting with flexible estimators such as random forest, gradient boosting, Lasso, and Ridge. This approach ensures that the estimation of nuisance functions satisfies Neyman-orthogonality conditions, thereby delivering unbiased and root-n consistent estimates even in the presence of high-dimensional confounders [95]. By capturing both linear and nonlinear dependencies, the framework extends beyond conventional fixed-effects regressions to uncover more complex substitution patterns between institutional investors and formal governance mechanisms. Moreover, the comparative analysis across multiple algorithms highlights the trade-offs between variance reduction in tree-based methods and regularization in penalized linear models, illustrating the complementarity of different optimization strategies. Taken together, our methodological design contributes to the growing literature at the intersection of causal inference and machine learning, providing a replicable framework for studying sustainability transitions and other domains characterized by double externalities and high-dimensional data environments [74,77].
5.2. Practical Implications
First, for policymakers in emerging markets, our findings suggest that empowering institutional investors through enhanced disclosure requirements and targeted stewardship incentives can significantly stimulate green innovation, even in contexts where externality pricing mechanisms are not fully developed. Instead of delaying reforms until market-based instruments such as carbon pricing or green subsidies mature, regulators can strategically mobilize institutional investors to bridge the governance gap. Concrete measures may include mandating standardized environmental disclosure, expanding ESG rating systems, and designing tax or reputational incentives that encourage long-term stewardship. These actions can amplify the monitoring capacity of institutional investors and channel private capital toward innovation aligned with national sustainability strategies.
Second, for firms, recognizing the influence of institutional investors in shaping innovation outcomes highlights the need to align internal sustainability agendas with investor expectations. Companies can proactively improve the transparency of their R&D processes, strengthen ESG communication, and integrate environmental objectives into strategic planning to attract and retain long-term oriented investors. By building trust through credible disclosure and consistent performance, firms not only secure financing but also reduce the uncertainty associated with high-risk green innovation projects.
Finally, for institutional investors themselves, the results underscore the value of adopting an active governance approach that goes beyond financial oversight. By systematically integrating environmental considerations into portfolio management, investors can enhance both firm-level innovation and their own long-term returns. This entails refining engagement strategies with portfolio firms, demanding clearer environmental disclosure, and incorporating green innovation metrics into investment decision-making. Such practices enable institutional investors to position themselves as central actors in sustainability transitions, simultaneously achieving fiduciary duties and advancing environmental goals.
5.3. Limitations and Future Research
While this study offers novel insights, it has several limitations that suggest directions for future research. First, our market sentiment framework is based on a single-country context. China’s hybrid institutional system, marked by strong government involvement and evolving market institutions, may amplify the compensatory role of institutional investors in internalizing green innovation externalities. Future research could extend this analysis to cross-country settings to assess whether similar mechanisms hold in advanced markets with mature ESG governance systems or in other emerging economies with different institutional voids. Second, although patent data provide an objective and comparable indicator of technological output, they may not capture all forms of green innovation, particularly non-patentable or process-oriented improvements. In addition, macroeconomic fluctuations and regulatory reforms during the study period may have influenced both investor behavior and innovation incentives; however, these contextual dynamics were beyond the analytical focus of this study and were controlled through year and industry fixed effects. Future research could explicitly examine how such macro-level shifts interact with institutional mechanisms to shape green innovation outcomes. Furthermore, while we highlight the importance of financial governance systems in fostering green innovation, further research is needed to explore how specific governance structures may vary across industries or firm sizes. Finally, while this study emphasizes the role of institutional investors, future research could investigate the interactions between different types of investors and their varying impacts on sustainability outcomes.
6. Conclusions
This study examines the role of institutional investors in promoting green innovation under the challenge of double externalities. Drawing on data from Chinese listed firms and combining fixed-effects regressions with double machine learning, we show that institutional ownership significantly enhances both the scale and quality of green innovation. By highlighting transparency as a compensatory governance mechanism, our findings extend theories of externality internalization and corporate governance, while also illustrating how financial actors can substitute for incomplete formal institutions in transitional economies. For practice, the results imply that regulators can strategically empower institutional investors to bridge governance gaps, firms can align sustainability strategies with investor expectations, and investors themselves can leverage active stewardship to advance both environmental and financial performance. Overall, the study demonstrates that institutional investors are indispensable drivers of sustainable innovation in emerging markets.
Supplementary Materials
The following supporting information can be downloaded at: https://www.mdpi.com/article/10.3390/math13223718/s1, Figure S1: Year FE paths; Table S1: Sample Deletion Process; Table S2: Fixed effects controlling for the interaction between year and industry; Table S3: Fixed effects controlling for the interaction between year and region.
Author Contributions
Conceptualization, C.L. and S.L.; Methodology, C.L. and S.L.; Software, C.L. and S.L.; Validation, C.L.; Formal analysis, C.L.; Data curation, S.L.; Writing—original draft, S.L.; Writing—review and editing, C.L. and S.L.; Visualization, S.L.; Supervision, C.L.; Project administration, C.L. All authors have read and agreed to the published version of the manuscript.
Funding
This research received no external funding.
Data Availability Statement
The original contributions presented in this study are included in Supplementary Materials. Further inquiries can be directed to the corresponding author.
Acknowledgments
The authors are grateful to the reviewers for their suggestions.
Conflicts of Interest
The authors declare no conflicts of interest.
References
- Nordhaus, W.D. The Spirit of Green: The Economics of Collisions and Contagions in a Crowded World; Princeton University Press: Princeton, NJ, USA, 2021; ISBN 978-0-691-21434-4. [Google Scholar]
- Rennings, K. Redefining Innovation—Eco-Innovation Research and the Contribution from Ecological Economics. Ecol. Econ. 2000, 32, 319–332. [Google Scholar] [CrossRef]
- Qin, X.; Muskat, B.; Ambrosini, V.; Mair, J.; Chih, Y.-Y. Green Innovation Implementation: A Systematic Review and Research Directions. J. Manag. 2025, 01492063241312656. [Google Scholar] [CrossRef]
- Xiang, X.; Liu, C.; Yang, M. Who Is Financing Corporate Green Innovation? Int. Rev. Econ. Financ. 2022, 78, 321–337. [Google Scholar] [CrossRef]
- Dyck, A.; Lins, K.V.; Roth, L.; Wagner, H.F. Do Institutional Investors Drive Corporate Social Responsibility? International Evidence. J. Financ. Econ. 2019, 131, 693–714. [Google Scholar] [CrossRef]
- Velte, P. Which Institutional Investors Drive Corporate Sustainability? A Systematic Literature Review. Bus. Strateg. Environ. 2023, 32, 42–71. [Google Scholar] [CrossRef]
- Chen, T.; Dong, H.; Lin, C. Institutional Shareholders and Corporate Social Responsibility. J. Financ. Econ. 2020, 135, 483–504. [Google Scholar] [CrossRef]
- McCahery, J.A.; Sautner, Z.; Starks, L.T. Behind the Scenes: The Corporate Governance Preferences of Institutional Investors. J. Financ. 2016, 71, 2905–2932. [Google Scholar] [CrossRef]
- Ren, X.; Xu, Z.; Lei, C. Institutional Blockholder, Exit Threats, and Firms CSR Performance. Int. Rev. Econ. Financ. 2025, 98, 103932. [Google Scholar] [CrossRef]
- Kreander, N.; McPhail, K.; Geels, F.W. Institutional Investors and Low-Carbon Transitions: A Multi-Level Analysis of Lead Firm Reorientation in Northern Europe. Energy Res. Soc. Sci. 2025, 123, 104031. [Google Scholar] [CrossRef]
- Karimi Takalo, S.; Sayyadi Tooranloo, H.; Shahabaldini parizi, Z. Green Innovation: A Systematic Literature Review. J. Clean. Prod. 2021, 279, 122474. [Google Scholar] [CrossRef]
- Khan, S.J.; Kaur, P.; Jabeen, F.; Dhir, A. Green Process Innovation: Where We Are and Where We Are Going. Bus. Strateg. Environ. 2021, 30, 3273–3296. [Google Scholar] [CrossRef]
- Krueger, P.; Sautner, Z.; Starks, L.T. The Importance of Climate Risks for Institutional Investors. Rev. Financ. Stud. 2020, 33, 1067–1111. [Google Scholar] [CrossRef]
- Zhang, F.; Zhu, L. Enhancing Corporate Sustainable Development: Stakeholder Pressures, Organizational Learning, and Green Innovation. Bus. Strateg. Environ. 2019, 28, 1012–1026. [Google Scholar] [CrossRef]
- Oduro, S.; Maccario, G.; De Nisco, A. Green Innovation: A Multidomain Systematic Review. Eur. J. Innov. Manag. 2022, 25, 567–591. [Google Scholar] [CrossRef]
- Ashton, J.; Wang, Y.; Zhang, Y. Does Mutual Fund Ownership Increase Corporate Environmental Spending? J. Bus. Res. 2024, 184, 114878. [Google Scholar] [CrossRef]
- Yang, W.-E.; Lai, P.-W.; Han, Z.-Q.; Tang, Z.-P. Do Government Policies Drive Institutional Preferences on Green Investment? Evidence from China. Environ. Sci. Pollut. Res. 2023, 30, 8297–8316. [Google Scholar] [CrossRef]
- Lei, X.; Yu, J. Striving for Sustainable Development: Green Financial Policy, Institutional Investors, and Corporate ESG Performance. Corp. Soc. Responsib. Environ. Manag. 2024, 31, 1177–1202. [Google Scholar] [CrossRef]
- Porter, M.E.; van der Linde, C. Toward a New Conception of the Environment-Competitiveness Relationship. J. Econ. Perspect. 1995, 9, 97–118. [Google Scholar] [CrossRef]
- Hardin, G. The Tragedy of the Commons. Science 1968, 162, 1243–1248. [Google Scholar] [CrossRef]
- Renaldi, V. Examining China’s Recent Economic Transformation: The State’s Role and Structural Challenges. Asia Pac. Bus. Rev. 2025, 1–6. [Google Scholar] [CrossRef]
- Chan, K.C.; Jiang, X.; Wu, D.; Xu, N.; Zeng, H. When Is the Client King? Evidence from Affiliated-Analyst Recommendations in China’s Split-Share Reform. Contemp. Account. Res. 2020, 37, 1044–1072. [Google Scholar] [CrossRef]
- Zhang, J.; Li, K.; Long, C.X. Institutional Investors, Competition and Corporate Innovation: Evidence from Chinese Listed Firms. Econ. Transit. Inst. Change 2024, 32, 583–615. [Google Scholar] [CrossRef]
- Menard, C.; Shabalov, I.; Shastitko, A. Institutions to the Rescue: Untangling Industrial Fragmentation, Institutional Misalignment, and Political Constraints in the Russian Gas Pipeline Industry. Energy Res. Soc. Sci. 2021, 80, 102223. [Google Scholar] [CrossRef]
- Hu, H.W.; Zhang, J. How Do Corporate Social Responsibility and Innovation Co-Evolve with Organizational Forms? Evidence from a Transitional Economy. J. Bus. Ethics 2023, 186, 815–829. [Google Scholar] [CrossRef]
- Coase, R.H. The Problem of Social Cost. J. Law. Econ. 2013, 56, 837–877. [Google Scholar] [CrossRef]
- North, D.C. Institutions, Institutional Change and Economic Performance; Political Economy of Institutions and Decisions; Cambridge University Press: Cambridge, UK, 1990; ISBN 978-0-521-39416-1. [Google Scholar]
- Allen, F.; Qian, J.; Qian, M. Law, Finance, and Economic Growth in China. J. Financ. Econ. 2005, 77, 57–116. [Google Scholar] [CrossRef]
- Jaffe, A.B.; Newell, R.G.; Stavins, R.N. A Tale of Two Market Failures: Technology and Environmental Policy. Ecol. Econ. 2005, 54, 164–174. [Google Scholar] [CrossRef]
- Wu, X.; Li, Y.; Feng, C. Green Innovation Peer Effects in Common Institutional Ownership Networks. Corp. Soc. Responsib. Environ. Manag. 2023, 30, 641–660. [Google Scholar] [CrossRef]
- Pigou, A.C. The Economics of Welfare; Macmillan: London, UK, 1920. [Google Scholar]
- Paavola, J. Institutions and Environmental Governance: A Reconceptualization. Ecol. Econ. 2007, 63, 93–103. [Google Scholar] [CrossRef]
- Soto-Oñate, D.; Caballero, G. Oil Spills, Governance and Institutional Performance: The 1992 Regime of Liability and Compensation for Oil Pollution Damage. J. Clean. Prod. 2017, 166, 299–311. [Google Scholar] [CrossRef]
- Drobetz, W.; El Ghoul, S.; Guedhami, O.; Yu, X. Beyond Ownership: The Role of Institutional Investors in International Corporate Governance. Corp. Gov. 2025, 33, 1024–1038. [Google Scholar] [CrossRef]
- Shleifer, A.; Vishny, R.W. Large Shareholders and Corporate Control. J. Polit. Econ. 1986, 94, 461–488. [Google Scholar] [CrossRef]
- Dorobantu, S.; Kaul, A.; Zelner, B. Nonmarket Strategy Research through the Lens of New Institutional Economics: An Integrative Review and Future Directions. Strateg. Manag. J. 2017, 38, 114–140. [Google Scholar] [CrossRef]
- Clark, G.L.; Feiner, A.; Viehs, M. From the Stockholder to the Stakeholder: How Sustainability Can Drive Financial Outperformance. Soc. Sci. Res. Netw. 2015. [Google Scholar] [CrossRef]
- Tateishi, H.R.; Bragagnolo, C.; de Faria, R.N. Economic and Environmental Efficiencies of Greenhouse Gases’ Emissions under Institutional Influence. Technol. Forecast. Soc. Change 2020, 161, 120321. [Google Scholar] [CrossRef]
- Gega, M.; Hohler, J.; Bijman, J.; Lansink, A.O. Firm Ownership and ESG Performance in European Agri-Food Companies: The Mediating Effect of Risk-Taking and Time Horizon. Corp. Soc. Responsib. Environ. Manag. 2025, 32, 1161–1181. [Google Scholar] [CrossRef]
- Park, Y.; Lee, K.-P.; You, C.-Y. Does ESG Performance Enhance the Financial Performance and Valuation of Chinese Private Enterprises? The Moderating Role of Political Connection and State Ownership. Asia Pac. Bus. Rev. 2025, 1–20. [Google Scholar] [CrossRef]
- Ghosh, M.; Singh, M.P. Unveiling Sustainable Practices in Financial Institutions: A Bibliometric Analysis Cum Meta-Analytical Review on Enhancing Financial Performance. Corp. Soc. Responsib. Environ. Manag. 2025, 32, 2295–2316. [Google Scholar] [CrossRef]
- Chen, J.Z.; Kim, Y.; Yang, L.L.; Zhang, J.H. Information Transparency and Investment in Follow-on Innovation. Contemp. Account. Res. 2023, 40, 1176–1209. [Google Scholar] [CrossRef]
- Wu, Y.; Zhang, K.; Xie, J. Bad Greenwashing, Good Greenwashing: Corporate Social Responsibility and Information Transparency. Manag. Sci. 2020, 66, 3095–3112. [Google Scholar] [CrossRef]
- Tirole, J. Digital Dystopia. Am. Econ. Rev. 2021, 111, 2007–2048. [Google Scholar] [CrossRef]
- Yu, E.P.; Guo, Q.; Luu, B.V. Environmental, Social and Governance Transparency and Firm Value. Bus. Strateg. Environ. 2018, 27, 987–1004. [Google Scholar] [CrossRef]
- Brown, J.R.; Martinsson, G. Does Transparency Stifle or Facilitate Innovation? Manag. Sci. 2019, 65, 1600–1623. [Google Scholar] [CrossRef]
- Zhao, M.; Wang, X.; Zhang, S.; Cheng, L. Business Strategy and Environmental Information Disclosure from a Confucian Cultural Perspective: Evidence from China. Bus. Strateg. Environ. 2024, 33, 1557–1577. [Google Scholar] [CrossRef]
- Du, X. Does Confucianism Reduce Minority Shareholder Expropriation? Evidence from China. J. Bus. Ethics 2015, 132, 661–716. [Google Scholar] [CrossRef]
- Cao, K.; Jiang, W.; Jin, L.; Zhu, Y. Does Confucian Culture Reduce Firms’ Pollution Emissions. Corp. Soc. Responsib. Environ. Manag. 2024, 31, 1838–1852. [Google Scholar] [CrossRef]
- Yiu, D.W.; Wan, W.P.; Chen, K.X.; Tian, X. Public Sentiment Is Everything: Host-Country Public Sentiment toward Home Country and Acquisition Ownership during Institutional Transition. J. Int. Bus. Stud. 2022, 53, 1202–1227. [Google Scholar] [CrossRef]
- Zyglidopoulos, S.C.; Georgiadis, A.P.; Carroll, C.E.; Siegel, D.S. Does Media Attention Drive Corporate Social Responsibility? J. Bus. Res. 2012, 65, 1622–1627. [Google Scholar] [CrossRef]
- Dang, T.V.; Xu, Z. Market Sentiment and Innovation Activities. J. Financ. Quant. Anal. 2018, 53, 1135–1161. [Google Scholar] [CrossRef]
- He, F.; Yan, Y.; Hao, J.; Wu (George), J. Retail Investor Attention and Corporate Green Innovation: Evidence from China. Energy Econ. 2022, 115, 106308. [Google Scholar] [CrossRef]
- Dong, L.; Zhang, X.; Chen, J. Does Investor Sentiment Drive Corporate Green Innovation: Evidence from China. Sustainability 2024, 16, 3220. [Google Scholar] [CrossRef]
- Riedl, E.J.; Sun, E.Y.; Wang, G. Sentiment, Loss Firms, and Investor Expectations of Future Earnings. Contemp. Account. Res. 2021, 38, 518–544. [Google Scholar] [CrossRef]
- Xu, R.; Yao, D.; Zhou, M. Does the Development of Digital Inclusive Finance Improve the Enthusiasm and Quality of Corporate Green Technology Innovation? J. Innov. Knowl. 2023, 8, 100382. [Google Scholar] [CrossRef]
- Guo, B.; Hu, P. Investigating the Relationship between Energy-Consuming Rights Trading and Urban Innovation Quality. Sustain. Dev. 2024, 32, 3248–3270. [Google Scholar] [CrossRef]
- Hu, J.; Pan, X.; Huang, Q. Quantity or Quality? The Impacts of Environmental Regulation on Firms’ Innovation–Quasi-Natural Experiment Based on China’s Carbon Emissions Trading Pilot. Technol. Forecast. Soc. Change 2020, 158, 120122. [Google Scholar] [CrossRef]
- Wang, H.; Feng, Z.; Yuan, L.; Lin, W. Green R&D Intervention of Public Research Institutions and Green Innovation of Enterprises: From the Perspective of Environmental Externalities. China Ind. Econ. 2024, 9, 81–99. [Google Scholar]
- Acemoglu, D.; Aghion, P.; Bursztyn, L.; Hemous, D. The Environment and Directed Technical Change. Am. Econ. Rev. 2012, 102, 131–166. [Google Scholar] [CrossRef]
- Kleer, R. Government R&D Subsidies as a Signal for Private Investors. Res. Policy 2010, 39, 1361–1374. [Google Scholar] [CrossRef]
- Han, F.; Mao, X.; Yu, X.; Yang, L. Government Environmental Protection Subsidies and Corporate Green Innovation: Evidence from Chinese Microenterprises. J. Innov. Knowl. 2024, 9, 100458. [Google Scholar] [CrossRef]
- Zhou, Z.; Wang, S.; Zhang, Y. Intellectual property protection and information dilemma of enterprise innovation. China Ind. Econ. 2022, 6, 136–154. [Google Scholar]
- Duan, Y.; Xi, B.; Xu, X.; Xuan, S. The Impact of Government Subsidies on Green Innovation Performance in New Energy Enterprises: A Digital Transformation Perspective. Int. Rev. Econ. Financ. 2024, 94, 103414. [Google Scholar] [CrossRef]
- Han, Y.; Li, Z.; Feng, T.; Qiu, S.; Hu, J.; Yadav, K.K.; Obaidullah, A.J. Unraveling the Impact of Digital Transformation on Green Innovation through Microdata and Machine Learning. J. Environ. Manag. 2024, 354, 120271. [Google Scholar] [CrossRef]
- He, L.; Gan, S. Floodlight or Spotlight? Public Attention and Corporate Social Responsibility Decoupling. Corp. Soc. Responsib. Environ. Manag. 2025, 32, 212–233. [Google Scholar] [CrossRef]
- Zhang, H.; Wu, J.; Mei, Y.; Hong, X. Exploring the Relationship Between Digital Transformation and Green Innovation: The Mediating Role of Financing Modes. J. Environ. Manag. 2024, 356, 120558. [Google Scholar] [CrossRef]
- Chen, J.; Roth, J. Logs with Zeros? Some Problems and Solutions. Q. J. Econ. 2024, 139, 891–936. [Google Scholar] [CrossRef]
- Wooldridge, J.M. Econometric Analysis of Cross Section and Panel Data, 2nd ed.; MIT Press: Cambridge, MA, USA, 2010; pp. 1–1064. ISBN 978-0-262-30324-8. [Google Scholar]
- Ascani, A.; Balachandran Nair, L. Innovation and Zombie Firms: Empirical Evidence from Italy. Res. Policy 2025, 54, 105172. [Google Scholar] [CrossRef]
- Correia, S.; Guimarães, P.; Zylkin, T. Fast Poisson Estimation with High-Dimensional Fixed Effects. Stata J. 2020, 20, 95–115. [Google Scholar] [CrossRef]
- Baron, R.M.; Kenny, D.A. The Moderator–Mediator Variable Distinction in Social Psychological Research: Conceptual, Strategic, and Statistical Considerations. J. Pers. Soc. Psychol. 1986, 51, 1173–1182. [Google Scholar] [CrossRef]
- Chernozhukov, V.; Chetverikov, D.; Demirer, M.; Duflo, E.; Hansen, C.; Newey, W.; Robins, J. Double/Debiased Machine Learning for Treatment and Structural Parameters. Econom. J. 2018, 21, C1–C68. [Google Scholar] [CrossRef]
- Huang, Y.; Xiong, N.; Liu, C. Smart City Policies and Corporate Renewable Energy Technology Innovation: Insights from Patent Text and Machine Learning. Energy Econ. 2025, 148, 108612. [Google Scholar] [CrossRef]
- Zhang, X.; Ai, X.; Wang, X.; Zong, G.; Zhang, J. A Study on the Effects of Digital Finance on Green Low-Carbon Circular Development Based on Machine Learning Models. Mathematics 2023, 11, 3903. [Google Scholar] [CrossRef]
- Davidescu, A.A.; Agafiței, M.-D.; Gheorghe, M.; Strat, V.A. A Machine Learning and Econometric Framework for Credibility-Aware AI Adoption Measurement and Macroeconomic Impact Assessment in the Energy Sector. Mathematics 2025, 13, 3075. [Google Scholar] [CrossRef]
- Huang, Y.; Xiong, N.; Liu, C. Renewable Energy Technology Innovation and ESG Greenwashing: Evidence from Supervised Machine Learning Methods Using Patent Text. J. Environ. Manag. 2024, 370, 122833. [Google Scholar] [CrossRef] [PubMed]
- Mullainathan, S.; Spiess, J. Machine Learning: An Applied Econometric Approach. J. Econ. Perspect. 2017, 31, 87–106. [Google Scholar] [CrossRef]
- Crane, A.D.; Michenaud, S.; Weston, J.P. The Effect of Institutional Ownership on Payout Policy: Evidence from Index Thresholds. Rev. Financ. Stud. 2016, 29, 1377–1408. [Google Scholar] [CrossRef]
- Lin, Y.; Deng, H.; Wang, Y. Institutional Investors’ Site Visits and Corporate Financialization in China. Int. Rev. Financ. Anal. 2025, 97, 103852. [Google Scholar] [CrossRef]
- Cheng, P.; Zhang, J.; Chen, J.; Zheng, Y.; Li, Z. Stakeholder Attention and Ambidextrous Green Innovation: Evidence from China. Bus. Strateg. Environ. 2025, 34, 1007–1026. [Google Scholar] [CrossRef]
- Wang, W.; Hu, G. The Power of Ethics: Merchant Culture and Corporate Environmental, Social, and Governance (ESG) Disclosure. Corp. Soc. Responsib. Environ. Manag. 2025, 32, 2630–2650. [Google Scholar] [CrossRef]
- Xiong, N.; Du, L. Can Confucian Culture Promote Enterprise Total Factor Productivity? Evidence from China. Int. J. Emerg. Mark. 2025, 20, 745–766. [Google Scholar] [CrossRef]
- Zhang, N.; Bo, L.; Wang, S.; Wang, X. Exploring Confucian Culture’s Impact on Corporate Debt Default Risk: An Ethical Decision-Making Approach. J. Bus. Ethics 2025, 198, 467–484. [Google Scholar] [CrossRef]
- He, L.; Hu, S.; Kong, D.; Li, X. Sincere Action or Sweet Talk: How Do Firms Respond to Retail Investors’ Green Appeals? J. Bus. Ethics 2025, 201, 193–218. [Google Scholar] [CrossRef]
- Huang, Y.; Qiu, H.; Wu, Z. Local Bias in Investor Attention: Evidence from China’s Internet Stock Message Boards. J. Empir. Financ. 2016, 38, 338–354. [Google Scholar] [CrossRef]
- Long, L.; Wang, C.; Zhang, M. Does Social Media Pressure Induce Corporate Hypocrisy? Evidence of ESG Greenwashing from China. J. Bus. Ethics 2025, 197, 311–338. [Google Scholar] [CrossRef]
- Sakaki, H.; Jory, S.R. Institutional Investors’ Ownership Stability and Firms’ Innovation. J. Bus. Res. 2019, 103, 10–22. [Google Scholar] [CrossRef]
- Aguilera, R.V.; Marano, V.; Haxhi, I. International Corporate Governance: A Review and Opportunities for Future Research. J. Int. Bus. Stud. 2019, 50, 457–498. [Google Scholar] [CrossRef]
- Christensen, H.B.; Hail, L.; Leuz, C. Mandatory CSR and Sustainability Reporting: Economic Analysis and Literature Review. Rev. Account. Stud. 2021, 26, 1176–1248. [Google Scholar] [CrossRef]
- Bushman, R.M.; Piotroski, J.D.; Smith, A.J. What Determines Corporate Transparency? J. Account. Res. 2004, 42, 207–252. [Google Scholar] [CrossRef]
- Pinkse, J.; Kolk, A. Multinational Enterprises and Climate Change: Exploring Institutional Failures and Embeddedness. J. Int. Bus. Stud. 2012, 43, 332–341. [Google Scholar] [CrossRef]
- Aghion, P.; Van Reenen, J.; Zingales, L. Innovation and Institutional Ownership. Am. Econ. Rev. 2013, 103, 277–304. [Google Scholar] [CrossRef]
- Greenwood, R.; Raynard, M.; Kodeih, F.; Micelotta, E.R.; Lounsbury, M. Institutional Complexity and Organizational Responses. Acad. Manag. Ann. 2011, 5, 317–371. [Google Scholar] [CrossRef]
- Olaniran, O.R.; Olaniran, S.F.; Alzahrani, A.R.R.; Alharbi, N.M.; Alzahrani, A.A. Random Forest Adaptation for High-Dimensional Count Regression. Mathematics 2025, 13, 3041. [Google Scholar] [CrossRef]


Disclaimer/Publisher’s Note: The statements, opinions and data contained in all publications are solely those of the individual author(s) and contributor(s) and not of MDPI and/or the editor(s). MDPI and/or the editor(s) disclaim responsibility for any injury to people or property resulting from any ideas, methods, instructions or products referred to in the content. |
© 2025 by the authors. Licensee MDPI, Basel, Switzerland. This article is an open access article distributed under the terms and conditions of the Creative Commons Attribution (CC BY) license (https://creativecommons.org/licenses/by/4.0/).