Abstract
Recent developments of Normalized Compressed Distance (NCD) matrices show potential to become a widely used method to develop phylogenetic trees among a group of organisms. However, such NCD matrices lack the biological and evolutionary context that is important to the development of phylogenetic trees. This study applied mathematical models of DNA evolution to NCD matrices with the goal of applying evolutionary context to improve the results of NCD methods and thus create better phylogenetic trees. Mammalian mitochondrial, Arabidopsis thaliana, and Tomato Solanum lycopersicum genomes were used in this study as benchmarks and underwent validation techniques to analyze whether the NCD matrix models were of better quality than their original NCD. The mathematical models applied were not sufficient in implementing a biological context towards NCD compression algorithms for phylogenetic trees, resulting in no successful improvement of them. However, this opens opportunities to explore ways to integrate biological context internally to NCD compression algorithms, rather than external methods of correcting NCD matrices after compression has been carried out.
MSC:
92-08; 92-10
1. Introduction
NCD Matrices and Their Significance
Phylogenomics utilizes genomic data from a group of organisms in order to describe the evolutionary relationships between all organisms in the group. These relationships are of significant importance, as they can be used to develop an understanding of the origin of diseases, to develop new crops and the tree of life, and to even classify organisms based on a common ancestor. Phylogenetic trees are the main source of analyzing such relationships and events. They are a visual diagram describing the evolutionary history of a group of organisms which must be computed via methods that utilize FASTA files [1,2].
Traditional methods of building phylogenetic trees involve the use of Multiple Sequence Alignment (MSA) methods [3]. These methods take a group of sequences such as mitochondrial DNA, rRNA sequences, and whole genomes in FASTA format, align every sequence to one another, and calculate their similarity to produce a phylogenetic tree [4]. These are often seen as the most reliable way to calculate phylogenetic trees. However, this makes aligning complex genomes and whole genomes impossible due to their very large size, the main limitation of using MSA-based methods [5,6]. One specific example of this is Eukaryotic genomes, which cannot be sequenced entirely due to their large size and complex genetic structure [7].
Due to this limitation being easily exploited by larger, more complex genomic datasets, there has been a movement of exploration towards alignment-free methods to compute phylogenomic trees.
Compression algorithms have risen towards the possibility of processing very large genomic datasets, such as whole genomes because they are computationally inexpensive when compared to other standard methods [8]. One of them is Normalized Compression Distance (NCD), a compression algorithm that is used to find the similarity between two pieces of texts such as emails and paragraphs [9]. When applied to FASTA files, they can find the similarity between two or more biological genomes and discover how similar they are through text pattern finding [9,10].
A recent study showed that Normalized Compression Distance (NCD) matrices allow for an alternative way to create phylogenetic trees. NCD matrices are produced via Phylotools (version 1.0.0), a software that uses the 7zip compression algorithm to find patterns in DNA sequences to produce a distance matrix that describes the pairwise differences among a group of organisms [9,10]. With promising results, NCD seems to be an effective and efficient approach to creating accurate phylogenetic trees without needing alignment.
However, NCD lacks evolutionary context when creating NCD matrices [9]. The 7zip compressor built into Phylotools has no knowledge of how likely certain nucleotides are to change over time within a species and how likely they are to change from organism to organism [9]. NCD and the 7zip compressor tool simply recognize patterns from different genomic sequences to generate a number describing how similar the sequences of the organisms are. This may create a bias in the creation of the NCD matrix, leading to results that may not capture the true relationship between a group of organisms.
In an attempt to contextualize the NCD, we applied models of DNA evolution to these NCD matrices produced by Phylotools. The goal of this study was to determine whether models of DNA evolution would produce more accurate NCD matrices and thus more accurate phylogenetic trees. This is a novel application of such mathematical models, since they were originally created to compute pairwise distances via alignment-based methods. However, in this study, the models were used as a way to integrate biological context into an NCD matrix to correct potentially inaccurate pairwise distance values and mitigate potential errors from the NCD algorithm.
2. Methods
2.1. Datasets
The genomic data used in this study consists of 3 different groups of organisms: 153 Mammalian mitochondrial sequences (Table A1), 14 tomato (Solanum lycopersicum) sequences (refer to the Data Availability Statement Section to access tomato genomes used in this study), and 79 Arabidopsis thaliana sequences (Table A2). All of the genomic data were in FASTA format, which were then later converted to non-aligned Normalized Compression Distance (NCD) matrices using Phylotools [11]. The datasets had the following GC%: mitochondria—38%, tomato—36%, Arabidopsis thaliana—36%. The justification for the datasets selected for this work was as follows: To evaluate the performance of the NCD method for phylogenetic inference, we selected three diverse genomic datasets spanning distinct evolutionary, structural, and biological contexts, 153 Mammalian mitochondrial genomes, 79 Arabidopsis thaliana genomes, and 14 tomato (Solanum lycopersicum) genomes. The Mammalian mitochondrial genomes dataset represents small circular genomes (16 to 20 kb) with well-established evolutionary relationships, providing a benchmark for assessing the NCD method. The A. thaliana dataset is characterized by a medium-sized nuclear genome (125–130 Mb) with high-quality chromosome-level assemblies and extensive population-level diversity data. This enables evaluation of NCD’s resolution in detecting intraspecific and subspecies-level variation. Lastly, in contrast, the tomato dataset, with a large and more complex nuclear genome (750–800 Mb), also completes chromosome-level assemblies. This dataset will help access NCD’s ability to handle higher genomic complexity and evolutionary distances. Collectively, these datasets span a continuum of genome sizes, complexities, and divergence scales, providing a comprehensive and representative framework to assess the robustness and adaptability of the NCD-based phylogenetic approach across biological domains.
2.2. NCD as an Alignment-Free Alternative
We measure the distance between two sequences using the Normalized Compression Distance (NCD) technique. NCD is an algorithmic approximation of the Normalized Information Distance (NID) measure. Informally, a measure of the similarity between two strings, over a finite alphabet, is how much their concatenation can be losslessly compressed relative to how much each string can be individually compressed. The idea is that if similar strings share a structure, a compressor can be used to minimize the number of bits needed to represent the concatenated strings.
The theoretical minimum compressed size of a string s is its Kolmogorov complexity [12], which is the length of the shortest program p such that, when run, produces s as output. We denote this size .
Based on this, Li et al. [13] defined the Normalized Information Distance (NID):
Because the Kolmogorov complexity of a string is uncomputable [12], the NID cannot be computed exactly. But it can be approximated from above by selecting a compression algorithm A and replacing by , which is the size of the bit string resulting from applying A to s. This new distance is called the Normalized Compression Distance (NCD):
Note that the NCD is always non-negative and, in general, less than or equal to 1 and greater than 0. A small NCD for two strings indicates that they are similar; values of less than 0.5 indicate greater similarity. We assume lossless compression, so, for example, one may use a compressor based on the Huffman algorithm, the various Lempel–Ziv algorithms, or a compressor designed specifically for a particular kind of data. One advantage is that a pair of sequences does not have to be aligned before determining their distance.
Wilson and Rogers [9] present a proof of concept for utilizing NCDs as an alternative approach to phylogeny estimation. In their study, they compare NCDs with traditional methods such as Maximum Likelihood (ML) and Bayesian inference using biological and simulated data. A key aspect of their analysis focuses on evaluating NCDs’ performance in the presence of incomplete lineage sorting (ILS), a common challenge in phylogenetic studies.
The results indicate that NCD performs comparably to traditional methods, particularly in scenarios with high levels of ILS, where methods such as ML and Bayesian inference often encounter difficulties. Wilson and Rogers highlight the computational efficiency of NCD, as it bypasses the need for sequence alignment, which can be computationally expensive with large datasets. This demonstrates the robustness of NCD in handling large and complex genomic data, offering a scalable and alignment-free alternative to traditional phylogeny estimation methods [9].
Phylotools utilized the 7zip compressor since it is an open-source command line tool that allowed for an effective compression ratio that is approximately 2–10% more effective than other compressors such as PKZip and WinZip [14]. Specifically, when applied to Phylogenetic data, 7zip outperformed other compressors such as MFC3 and PPMZ9 [9].
In this study, 153 Mammalian mitochondrial sequences, 14 Tomato (Solanum lycopersicum) genomes, and 79 Arabidopsis thaliana genomes were combined into one FASTA file, one for each species, for a total of three FASTA files as shown in Figure 1. Each FASTA file was used as input into Phylotools to compute a non-aligned NCD matrix representing the pairwise, evolutionary differences among all the species within the group of organisms mentioned earlier. NCD-based distances operate outside traditional model-based frameworks.
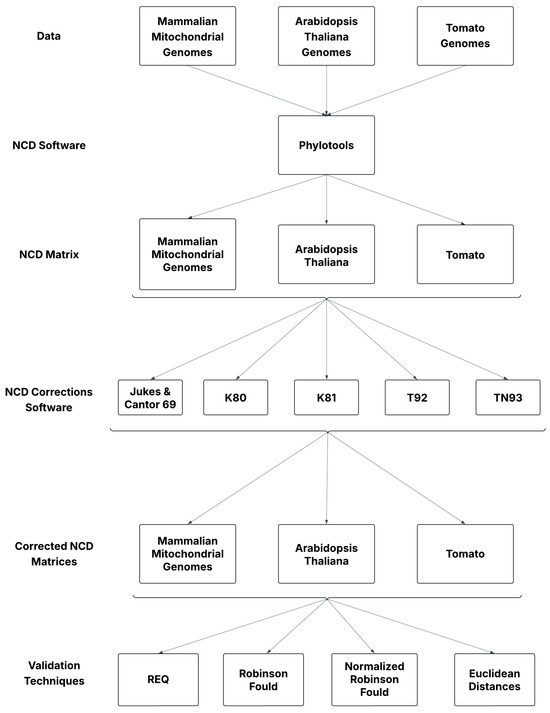
Figure 1.
Workflow of the methods used for this study.
2.3. Models of DNA Evolution
The NCD matrix form Phylotools was then used as input for the NCD Corrections Program, a program that allowed for the application of five different models of DNA evolution to mathematically contextualize the evolutionary pairwise distances between each species [15]. Every model was programmed as a mathematical formula and applied to a NumPy matrix for faster and more efficient implementation of the models.
Most of the models used in this study are typically calculated via a rate matrix that allows for the representation of nucleotide rate changes between species. However, since the focus of this study was to apply these models without alignment methods, the models were applied to the NCD matrix produced by Phylotools. This was performed by taking derivations of the models that used pairwise distances instead of rate matrices. These models were chosen because they are time-continuous Markov Chain models, meaning that the next state of an environment is based on the current state [4]. This is the behavior that best mimics how genetic mutations occur throughout time.
2.4. MLE for Transition and Transversion Rates
In addition, there were some models that required the use of transition and transversion rates. Due to the lack of alignment utilization, transition and transversion rates were calculated via Maximum Likelihood Estimation (MLE) [16], which utilized the input of a very small initial arbitrary value to calculate optimal values in correspondence to transition and transversion rates. The initial arbitrary values that we used were 0.15 for transitions and 0.01 for transversions since transitions are approximately about 15 times more likely to occur than transversions [17]. MLE was programmed in the Scipy Python package using scipy.optimize.minimize and iteratively run until the sum of squared differences between the original distance matrix and the model-predicted distances was less than . This convergence criterion allowed for the parameter estimates to be as close as possible to the parameters that would likely be used to create the original matrix. Standard errors of the parameters were not computed since the focus of the study was to find the most optimal transition and transversion rates to use in the mathematical models of DNA evolution.
2.5. JC69 (Jukes and Cantor 1969)
Jukes and Cantor’s is known as the simplest model of DNA evolution due to having a single input parameter and several assumptions when computing evolutionary distances between species. These assumptions include equal base frequencies of 25% and equal mutation rates between base pairs [18]. The Jukes and Cantor model applied to the NCD matrix is denoted as
where p is the proportion of sites that differ between sequence alignment and d is the evolutionary distance between each sequence. Due to the lack of alignment knowledge, this study replaced p with every value of the NCD matrix. This is because the proportion of sites that differ is analogous to the original NCD matrix value, and d is analogous to the model-predicted distance that is calculated after the model has been applied.
2.6. K80 (Kimura 1980)
Kimura 80 requires two parameters, one of which is the rate of transitions and the other being the rate of transversions. Similar to Jukes and Cantor’s model, however, it was also constructed with the idea that each base is equally frequent at 25%. The pairwise difference formula representing this model is denoted as
where K is the output of the corrected NCD matrix, p is the rate of transitions, and q is the rate of transversions between all organisms in the dataset [19].
2.7. K81 (Kimura 1981)
K81 is similar to K80 in that it utilizes the rate of transitions and transversions in order to calculate pairwise distances, but differs in that there are two rates for transversions. Like all other previous models, each equilibrium base frequency is 25%. The pairwise difference formula has the following parameters and formulas:
Ultimately,
where K is the output of the corrected NCD matrix, is the rate of transitions, is the first rate of transversions, and is the second rate of transversions [20].
2.8. T92 (Tamura 1992)
T92 is well suited for sequences that have a strong G and C base content. It is an extension of K80, but with the addition of a parameter that describes the frequency of the content of G and C, which is denoted as . Thus, T92 does not assume equal base pair frequencies among sequences.
where d is the output to the NCD matrix, p is the rate of transitions, and q is the rate of transversions [21].
2.9. TN93 (Tamura and Nei 1993)
TN93 allows two different transition rates and two different transversion rates. In addition, this model does not assume any equal base frequencies. The derivation of this model that was used was the one that allowed the computation of the number of nucleotide substitutions between sequences, which we then used to apply to the NCD matrix [22]. In using this derivation of the model, we used the following parameters:
where is the number of transition differences between purines and is the transition differences between pyrimidines. Furthermore, is the rate of transversion differences.
The underlying parameters of , , , all represent base frequencies. The parameter a represents the index of dispersion, which tells how dispersed data points are relative to their mean. Specifically, it is expressed as
where m is the mean of nucleotide substitutions per site and p is the variance of nucleotide substitutions.
Additionally, is considered to be the average transversion rate and is considered to be the average transition rate among all organisms. This is usually calculated before applying to the overlying parameters that they are in. The parameter t is considered to be a time parameter to take into account how much evolutionary time has passed before two sequences diverged. Due to the lack of this knowledge, we decided to keep . MLE was used to optimize the parameters mentioned (besides t) as accurately as possible and then used in the formula below.
3. Results
3.1. Rate of Elementary Quartets (REQ)
For context, REQ is a distance-based approach for assessing branch support, which calculates the proportion of elementary quartets induced by each internal branch that align with the four-point condition applied to pairwise evolutionary distances [23]. Unlike bootstrap-based methods, REQ directly utilizes the dissimilarity matrix and provides branch confidence values ranging from 0 to 1, with higher values indicating stronger support for the branch.
Based on the results of Table 1, most REQ values are uniform and have little to no differences between all tables, with the exception of tomatoes. They have the largest disparity of values among one group of species. This is worth noting, as tomato genomes are of the same lineage and are not very different from each other genetically.

Table 1.
Comparison of REQ values.
For all REQ values in general, especially those of Arabidopsis thaliana and tomatoes, the values are less than 0.9 and typically fall in the range of 0.5–0.6. This means that the confidence level of the original vs. the NCD matrices is relatively low and shows only moderate similarity.
3.2. Robinson Fould and Normalized Robinson Fould (RF and nRF)
Structural similarity among these trees was quantified using the Robinson–Foulds (RF) distance [24]. The RF metric measures topological differences between trees, with lower values indicating greater similarity.
As shown in Table 2 all values with the exception of the Jukes and Cantor model had the same value. Similar to REQ, the Normalized RF shows moderate similarity, with some scores being 0.1–0.2. This is one tier below being very confident and shows that there were a large number of similarities, however, not enough to be considered very similar. However, most of the data points across the table are 0.3 and higher, indicating that there were a small number of similarities in the distance matrices between the original NCD and the model NCD.
Table 2.
Comparison of Robinson Fould and Normalized Robinson Fould.
3.3. Euclidean Distances
Euclidean Distance is a general way to compute the distance between two points in a space. In the context of this study, the goal was to utilize the Euclidean Distance to further establish how similar the original NCD matrix was to the corrected NCD matrices. The average Euclidean Distance was taken between each original matrix and a model matrix. The lower the values, generally the more similar to matrices are [25].
The values in Table 3 give a different indication of how similar each matrix is when compared to the other validation techniques. They show relatively small values, indicating that every original matrix is very similar to the model matrix. However, this is computed with values from matrices and is given no other context. It is possible that the overall values of the distance matrices are very similar since each matrix is normalized from 0 to 1 and thus gives a small value even if the matrices result in very different phylogenetic trees.
Table 3.
Average Euclidean Distances.
4. Discussion
As demonstrated by the results, the NCD correction models appear to give very similar results for the input matrix, with the exception of the Jukes and Cantor model. There are several possibilities as to why this may have occurred.
4.1. Maximum Likelihood Estimation
The goal of Maximum Likelihood Estimation (MLE) in the context of this study is to optimize a set of input parameters to minimize the difference between a new and original dataset. This makes MLE very accurate for predicting missing or unknown parameters of mathematical expressions and models that would change one dataset to another. This would indicate that every optimal parameter computed from MLE will attempt to create a matrix that is as close as possible to its original.
4.2. Models Are Non-Applicable to NCD Matrices
Another possibility of why the models are producing similar results is due to the applicability of the models to NCD matrices. As noted earlier, the study was adjusted to apply the models to the NCD matrices directly instead of creating rate matrices, which involve alignment. Since these models utilize alignments to count transition, transversion, and general point mutations, the modified versions of alignments are not accurate and lead to different results. Thus, the statistics provided in Table 1, Table 2 and Table 3 represent a lack of incompatibility with NCD matrices as the models do not provide sufficient biological context to NCD algorithms.
4.3. NCD Accuracy
It is also likely that the NCD matrices are accurate enough and do not need a correction model to be applied to. This would indicate that Phylotools computes accurate distance matrices and phylogenetic trees. Therefore, another method besides applying models of DNA evolution may correct the anomalies of NCD matrices.
4.4. Novel Evaluation Metrics
Due to the novelty of NCD distance matrices, it is possible that other metrics must be used in order to evaluate their results. Since compression algorithms are not typically used to create matrices, novel validation techniques may be needed to evaluate how well the matrices represent evolutionary change. Additionally, metrics that measure how much biological context is included within the compressor may be helpful.
5. Conclusions
Based on the results, applying mathematical models of DNA evolution to NCD matrices does not give a more accurate representation of phylogenomic trees.
This result supports the rationale that phylogenetic distance matrices produced based on NCD closely represent the evolutionary relationship among a group of organisms. We can confidently use these NCD matrices to look at Phylogeny from a whole-genome perspective rather than selecting representative sequences such as mitochondrial DNA or rRNA, which are well-suited for MSA-based methods.
Although NCD corrections did not show any improvements from our original NCD matrices, there is still potential to improve NCD matrices.
One future direction includes exploring different ways to take on even longer genomic sequences than the ones used in this study. Limitations such as compression window sizes can be addressed in order to improve the quality of NCD matrices. This would allow for sequences of any length to be compressed without applying any segmentation.
In addition, the exploration of existing techniques such as MFcompress [26] or developing other compression techniques that would specifically be designed to work with DNA sequences. This is so that no segmentation would be needed during the compression phase. This would allow for generating even more reliable NCD matrices.
Other methods besides compression such as Genome Language Processing [27] and Genome Large Language Models [27] may be used to continue exploration of non-alignment based methods. This allows for the fusion of Machine Learning and genomics to better study how nucleotides change over time. K-mer-based approaches are also gaining popularity due to their ability to take multiple short sequence alignment data from multiple genomes and analyze them for similarity [28]. This approach also utilizes distance matrices to compare the relationships among a group of organisms. Similarly, MinHash approaches, which fuse k-mers with hashing algorithms, have been shown to efficiently profile large eukaryotic genomes [29].
At the moment, Phylotools and compression-based methods seem to have a promising future, with the potential to be widely used for creating phylogenetic trees.
Author Contributions
Conceptualization, T.R. and J.R.; methodology, D.M. and H.H.; software, D.M. and H.H.; validation, T.R., J.R. and D.M.; formal analysis, D.M., H.H., T.R. and J.R.; investigation, D.M.; resources, T.R. and J.R.; data curation, D.M.; writing—original draft preparation, D.M.; writing—review and editing, T.R. and J.R.; visualization, D.M. and T.R.; supervision, T.R. and J.R.; project administration, T.R. and J.R.; funding acquisition, T.R. All authors have read and agreed to the published version of the manuscript.
Funding
This research received no external funding. We express our gratitude to DePaul University’s Graduate and Undergraduate Research Assistant Program (GRAP/URAP) for its funding support. These awards have provided a unique opportunity for undergraduate and graduate students to engage in research, fostering a collaborative environment between students and faculty.
Data Availability Statement
The original data of the NCD matrices produced in the study are openly available in NCD-Matrices at https://github.com/domoreno23/NCD-Matrices (accessed on 2 August 2025) The original data of the Newick files produced in this study are also openly available in NCD-Newick-Files at https://github.com/domoreno23/NCD-Newick-Files (accessed on 2 August 2025). The original data of the tomato genomes can be found at https://solgenomics.net/ftp/genomes/tomato100/March_02_2020_sv_landscape/ (accessed on 2 August 2025) and https://zenodo.org/records/17166769 (accessed on 2 August 2025).
Acknowledgments
We would like to thank the members of the Computational Biology and Applied Bioinformatics (CoBaAB) laboratory research group in the School of Computing at DePaul University for their invaluable contributions, particularly DeAngelo Wilson, Catherine Huber, and Diego Izzaguire, whose knowledge and prior work have significantly influenced this research.
Conflicts of Interest
The authors declare no conflicts of interest.
Abbreviations
The following abbreviations are used in this manuscript:
| NCD | Normalized Compression Distance |
| NID | Normalized Information Distance |
| RF | Robinson Foulds |
| nRF | Normalized Robinson Foulds |
| RF-Norm | Normalized Robinson Foulds |
| REQ | Rate of Elementary Quartets |
| MLE | Maximum Likelihood Estimation |
| MSA | Multiple Sequence Alignment |
Appendix A
The Accession IDs of Mammalian mitochondrial genomes and Arabidopsis thaliana genomes are found below. These are the exact genomes used in this study.
Table A1.
Mammalian mitochondrial Genomes Accession IDs.
Table A1.
Mammalian mitochondrial Genomes Accession IDs.
| Species | NCBI Accession IDs |
|---|---|
| Ailuropoda_melanoleuca | EF196663.1 |
| Ailurus_fulgens_styani | AB291074.1 |
| Anoura_caudifer | NC_022420.1 |
| Anourosorex_squamipes | NC_024563.1 |
| Antilope_cervicapra | NC_012098.1 |
| Artibeus_jamaicensis | AF061340.1 |
| Artibeus_lituratus | NC_016871.1 |
| Balaena_mysticetus | AP006472.1 |
| Blarina_brevicauda | NC_027902.1 |
| Bos_mutus | DQ124389.1 |
| Bos_taurus | V00654.1 |
| Bubalus_bubalis | AY488491.1 |
| Camelus_bactrianus | AJ409393.1 |
| Camelus_dromedarius | NC_009849.1 |
| Canis_lupus_familiaris | U96639.2 |
| Capra_hircus | GU295658.1 |
| Castor_canadensis | FJ959094.1 |
| Cavia_porcellus | AJ222767.1 |
| Cebus_albifrons | NC_021952.1 |
| Ceratotherium_simum | Y07726.1 |
| Chinchilla_lanigera | EF567130.1 |
| Cricetulus_griseus | NC_007936.1 |
| Crocidura_tanakae | NC_035941.1 |
| Cynopterus_sphinx | EU289411.1 |
| Dasypus_novemcinctus | Y11832.1 |
| Delphinapterus_leucas | NC_005279.1 |
| Dipodomys_ordii | NC_005314.1 |
| Elephas_maximus | DQ316068.1 |
| Eptesicus_fuscus | NC_029342.1 |
| Equus_asinus | NC_001788.1 |
| Equus_caballus | NC_001640.1 |
| Erinaceus_europaeus | X88898.1 |
| Eubalaena_japonica | AP006472.1 |
| Felis_catus | U20753.1 |
| Gorilla_gorilla | D38114.1 |
| Halichoerus_grypus | NC_001602.1 |
| Hippopotamus_amphibius | AP003425.1 |
| Homo_sapiens | NC_012920.1 |
| Hylobates_lar | NC_002082.1 |
| Loxodonta_africana | X56292.1 |
| Macaca_fascicularis | X79547.1 |
| Macaca_mulatta | AY612638.1 |
| Microtus_arvalis | EF489115.1 |
| Monodelphis_domestica | NC_006299.1 |
| Mus_musculus | V00711.1 |
| Mustela_putorius_furo | AJ544416.1 |
| Myotis_lucifugus | NC_006897.1 |
| Nomascus_leucogenys | NC_013993.1 |
| Nycticebus_coucang | NC_002765.1 |
| Ochotona_curzoniae | NC_011029.1 |
| Odocoileus_virginianus | NC_008414.1 |
| Orcinus_orca | Y13856.1 |
| Oryctolagus_cuniculus | AJ001588.1 |
| Ovis_aries | AF010406.1 |
| Pan_troglodytes | D38116.1 |
| Panthera_leo | NC_028302.1 |
| Panthera_tigris | EF551002.1 |
| Papio_hamadryas | Y18001.1 |
| Phocoena_phocoena | NC_005280.1 |
| Physeter_catodon | X72204.1 |
| Pongo_pygmaeus | X97707.1 |
| Pteropus_vampyrus | NC_009063.1 |
| Rattus_norvegicus | X14848.1 |
| Saimiri_sciureus | NC_025235.1 |
| Sus_scrofa | AJ002189.1 |
| Tarsius_syrichta | Y18001.1 |
| Trichechus_manatus | NC_005279.1 |
| Tursiops_truncatus | X72204.1 |
| Ursus_arctos | AF303110.1 |
| Ursus_maritimus | AJ428577.1 |
| Vicugna_pacos | EF397824.1 |
| Vulpes_vulpes_montana | KF387633.1 |
Table A2.
Arabidopsis thaliana Genome Accession IDs.
Table A2.
Arabidopsis thaliana Genome Accession IDs.
| Lines | NCBI Accession IDs |
|---|---|
| AUZE-A-5 | GCA_946402385.1 |
| FERR-A-8 | GCA_946403025.1 |
| BELC-C-10 | GCA_946403525.1 |
| ANGE-B-10 | GCA_946404075.1 |
| BARA-C-5 | GCA_946404385.1 |
| IP-San-9 | GCA_946404515.1 |
| BANI-C-1 | GCA_946404995.1 |
| IP-Met-6 | GCA_946405265.1 |
| FERR-A-12 | GCA_946405525.1 |
| IP-Evs-12 | GCA_946405545.1 |
| IP-Med-0 | GCA_946405725.1 |
| MONTM-B-16 | GCA_946405905.1 |
| IP-Alo-0.9506 | GCA_946406325.1 |
| Ler-0.7213 | GCA_946406525.1 |
| BANI-C-12 | GCA_946406595.1 |
| IP-Hom-4.9546 | GCA_946406625.1 |
| BARA-C-3 | GCA_946406735.1 |
| Rabacal-1.22005 | GCA_946406895.1 |
| CAMA-C-2 | GCA_946406975.1 |
| BARC-A-17 | GCA_946407145.1 |
| IP-Lor-16 | GCA_946407795.1 |
| SALE-A-10 | GCA_946408365.1 |
| CAMA-C-9 | GCA_946408575.1 |
| BELC-C-12 | GCA_946408975.1 |
| BROU-A-10 | GCA_946409395.1 |
| SALE-A-17 | GCA_946409815.1 |
| Tanz-1.10024 | GCA_946409825.1 |
| BARC-A-12 | GCA_946410165.1 |
| IP-Alo-19 | GCA_946410485.1 |
| IP-Cas-0.9831 | GCA_946411375.1 |
| IP-Hom-0 | GCA_946411425.1 |
| MERE-A-13 | GCA_946411655.1 |
| IP-Mos-9 | GCA_946411805.1 |
| IP-Mos-5 | GCA_946411885.1 |
| IP-Hum-4 | GCA_946412005.1 |
| GAIL-B-11 | GCA_946412065.1 |
| IP-Mdc-14 | GCA_946412225.1 |
| IP-Hum-2.9549 | GCA_946413285.1 |
| IP-Med-3 | GCA_946413305.1 |
| PREI-A-14 | GCA_946413405.1 |
| IP-Sln-22 | GCA_946413935.1 |
| Cvi-0.6911 | GCA_946414125.1 |
| IP-Cat-0.9832 | GCA_946414305.1 |
| ANGE-B-2 | GCA_946415005.1 |
| IP-Evs-0.9845 | GCA_946415165.1 |
| IP-Cas-6 | GCA_946415445.1 |
| MONTM-B-7 | GCA_946415625.1 |
| LACR-C-14 | GCA_946415655.1 |
| Ey15-2.9994 | GCA_946499665.1 |
| Col-0.6909 | GCA_946499705.1 |
| Pent-46.2212 | GCA_964057255.1 |
| LI-EF-011.685 | GCA_964057265.1 |
| 14INRCT07 | GCA_964057275.1 |
| MONF-A-1.22045 | GCA_965117475.1 |
| RAYR-A-17.22055 | GCA_965117485.1 |
| LANT-B-1.22039 | GCA_965117495.1 |
| LUZE-A-14.22042 | GCA_965117505.1 |
| MONT-B-14.22048 | GCA_965117515.1 |
| NAUV-B-7.22052 | GCA_965117525.1 |
| LACR-C-4.22038 | GCA_965117535.1 |
| BELL-A-1.22021 | GCA_965117545.1 |
| PREI-A-9.22054 | GCA_965117555.1 |
| MERE-A-7.22044 | GCA_965117565.1 |
| LANT-B-10.22040 | GCA_965117575.1 |
| LUZE-A-12.22041 | GCA_965117585.1 |
| MONF-A-14.22046 | GCA_965117595.1 |
| RAYR-A-9.22056 | GCA_965117605.1 |
| JUZE-A-3.22036 | GCA_965117615.1 |
| BOULO-A-16.22024 | GCA_965117625.1 |
| BELL-A-7.22022 | GCA_965117635.1 |
| BROU-A-2.22026 | GCA_965117645.1 |
| NAUV-B-14.22051 | GCA_965117655.1 |
| JUZE-A-2.22035 | GCA_965117665.1 |
| BOULO-A-1.22023 | GCA_965117675.1 |
| CARL-A-16.22030 | GCA_965117685.1 |
| CARL-A-10.22029 | GCA_965117695.1 |
| MONT-B-12.22047 | GCA_965117705.1 |
| GAIL-B-9.22034 | GCA_965117715.1 |
| AUZE-A-11.22011 | GCA_965117725.1 |
References
- Jarvis, E.D.; Mirarab, S.; Aberer, A.J.; Li, B.; Houde, P.; Li, C.; Ho, S.Y.; Faircloth, B.C.; Nabholz, B.; Howard, J.T.; et al. Whole-genome analyses resolve early branches in the tree of life of modern birds. Science 2014, 346, 1320–1331. [Google Scholar] [CrossRef] [PubMed]
- Liu, K.; Linder, C.R.; Warnow, T. RAxML and FastTree: Comparing two methods for large-scale maximum likelihood phylogeny estimation. PLoS ONE 2011, 6, e27731. [Google Scholar] [CrossRef] [PubMed]
- Chatzou, M.; Magis, C.; Chang, J.M.; Kemena, C.; Bussotti, G.; Erb, I.; Notredame, C. Multiple sequence alignment modeling: Methods and applications. Briefings Bioinform. 2015, 17, 1009–1023. [Google Scholar] [CrossRef]
- Suchard, M.A.; Weiss, R.E.; Sinsheimer, J.S. Bayesian Selection of Continuous-Time Markov Chain Evolutionary Models. Mol. Biol. Evol. 2001, 18, 1001–1013. [Google Scholar] [CrossRef]
- Daugelaite, J.; O’ Driscoll, A.; Sleator, R.D. An overview of multiple sequence alignments and cloud computing in bioinformatics. Int. Sch. Res. Not. 2013, 2013, 615630. [Google Scholar] [CrossRef]
- Izquierdo-Carrasco, F.; Gagneur, J.; Stamatakis, A. Trading memory for running time in phylogenetic likelihood computations. Heidelb. Inst. Theor. Stud. 2012, 86–95. [Google Scholar] [CrossRef]
- Claros, M.G.; Bautista, R.; Guerrero-Fernández, D.; Benzerki, H.; Seoane, P.; Fernández-Pozo, N. Why assembling plant genome sequences is so challenging. Biology 2012, 1, 439–459. [Google Scholar] [CrossRef]
- Ozan, Ş. DNA Sequence Classification with Compressors. arXiv 2024, arXiv:2401.14025. [Google Scholar] [CrossRef]
- Wilson, D.; Rogers, J. Evaluating Compression-Based Phylogeny Estimation in the Presence of Incomplete Lineage Sorting. J. Comput. Biol. 2023, 30, 250–260. [Google Scholar] [CrossRef] [PubMed]
- Rogers, J.; Wilson, D. Comparing phylogeny by compression to phylogeny by NJp and Bayesian Inference. In Proceedings of the 2020 IEEE International Conference on Bioinformatics and Biomedicine (BIBM), Seoul, Republic of Korea, 16–19 December 2020; IEEE: Piscataway, NJ, USA, 2020; pp. 2195–2202. [Google Scholar]
- Rogers, D.W.J. PhyloTools: A Software Package for Analyzing Phylogenetic Trees; GitHub Repository: San Francisco, CA, USA, 2021. [Google Scholar]
- Li, M.; Vit’anyi, P.M. An Introduction to Kolmogorov Complexity and Its Applications, 3rd ed.; Springer Publishing Company, Incorporated: Berlin/Heidelberg, Germany, 2008. [Google Scholar]
- Li, M.; Chen, X.; Li, X.; Ma, B.; Vit’anyi, P.M.B. The similarity metric. IEEE Trans. Inf. Theory 2004, 50, 3250–3264. [Google Scholar] [CrossRef]
- Pavlov, I. 7-Zip, Version 24.08 or Later; [Computer Software]; Moscow, Russia. 2025. Available online: https://www.7-zip.org/ (accessed on 2 August 2025).
- Moreno, D. NCD-Corrections: Correction Tools for Normalized Compression Distance (NCD); GitHub Repository: San Francisco, CA, USA, 2025. [Google Scholar]
- Astrom, K. Maximum Likelihood and Prediction Error Methods. Ifac Proc. Vol. 1979, 12, 551–574. [Google Scholar] [CrossRef]
- Stoltzfus, A.; Norris, R.W. On the Causes of Evolutionary Transition: Transversion Bias. Mol. Biol. Evol. 2016, 33, 595–602. [Google Scholar] [CrossRef]
- Jukes, T.; Cantor, C. Evolution of Protein Molecules. In Mammalian Protein Metabolism; Munro, H., Ed.; Academic Press: New York, NY, USA, 1969; pp. 21–132. [Google Scholar] [CrossRef]
- Kimura, M. A simple method for estimating evolutionary rates of base substitutions through comparative studies of nucleotide sequences. J. Mol. Evol. 1980, 16, 111–120. [Google Scholar] [CrossRef] [PubMed]
- Kimura, M. Estimation of evolutionary distances between homologous nucleotide sequences. Proc. Natl. Acad. Sci. USA 1981, 78, 454–458. [Google Scholar] [CrossRef]
- Tamura, K. Estimation of the number of nucleotide substitutions when there are strong transition-transversion and G+C-content biases. Mol. Biol. Evol. 1992, 9, 678–687. [Google Scholar] [CrossRef] [PubMed]
- Tamura, K.; Nei, M. Estimation of the number of nucleotide substitutions in the control region of mitochondrial DNA in humans and chimpanzees. Mol. Biol. Evol. 1993, 10, 512–526. [Google Scholar] [CrossRef]
- Guénoche, A.; Garreta, H. Can we have confidence in a tree representation? In Proceedings of the International Conference on Biology, Informatics, and Mathematics, Montpellier, France, 3–5 May 2000; Springer: Berlin/Heidelberg, Germany, 2000; pp. 45–56. [Google Scholar]
- Robinson, D.F.; Foulds, L.R. Comparison of phylogenetic trees. Math. Biosci. 1981, 53, 131–147. [Google Scholar] [CrossRef]
- de Vienne, D.M.; Aguileta, G.; Ollier, S. Euclidean nature of phylogenetic distance matrices. Syst. Biol. 2011, 60, 826–832. [Google Scholar] [CrossRef]
- Pinho, A.; Pratas, D. MFCompress: A compression tool for FASTA and multi-FASTA data. Bioinformatics 2014, 30, 117–118. [Google Scholar] [CrossRef]
- Consens, M.; Dufault, C.; Wainberg, M.; Forster, D.; Karimzadeh, M.; Goodarzi, H.; Theis, F.J.; Moses, A.; Wang, B. Transformers and genome language models. Nat. Mach. Intell. 2025, 7, 346–362. [Google Scholar] [CrossRef]
- Wen, J.; Chan, R.H.; Yau, S.C.; He, R.L.; Yau, S.S. K-mer natural vector and its application to the phylogenetic analysis of genetic sequences. Gene 2014, 546, 25–34. [Google Scholar] [CrossRef] [PubMed]
- Moi, D.; Kilchoer, L.; Aguilar, P.S.; Dessimoz, C. Scalable phylogenetic profiling using MinHash uncovers likely eukaryotic sexual reproduction genes. PLoS Comput. Biol. 2020, 16, 1–21. [Google Scholar] [CrossRef] [PubMed]

Disclaimer/Publisher’s Note: The statements, opinions and data contained in all publications are solely those of the individual author(s) and contributor(s) and not of MDPI and/or the editor(s). MDPI and/or the editor(s) disclaim responsibility for any injury to people or property resulting from any ideas, methods, instructions or products referred to in the content. |
© 2025 by the authors. Licensee MDPI, Basel, Switzerland. This article is an open access article distributed under the terms and conditions of the Creative Commons Attribution (CC BY) license (https://creativecommons.org/licenses/by/4.0/).