1. Introduction
Univariate probability distributions with positive support are fundamental in reliability engineering, biomedicine, economics, and environmental sciences. Many variables of interest, such as waiting times, lifetimes of materials, hospital stays, or environmental measurements, are non-negative by nature; see, for instance, [
1,
2,
3,
4].
In this context, the Lindley (L) distribution [
5] emerged as an alternative to the exponential model, providing an improved fit for duration data characterized by an increasing hazard rate.
A random variable
X is said to follow the L distribution with shape parameter
, denoted by
, if its probability density function (PDF), cumulative distribution function (CDF), and quantile function (QF) are given by
respectively, where
denotes the secondary branch of the Lambert
W function.
For background on the Lambert W function, see [
6]; for the derivation of Equation (
3), [
7]; and for a review of the L distribution, [
8].
Although the L distribution has been successfully applied in lifetime analysis due to its analytical simplicity and decreasing hazard rate, it exhibits limited flexibility in controlling skewness and tail behavior. In particular, its range of skewness and kurtosis values is narrower than that of the Gamma [
9] and Weibull [
9,
10] distributions, restricting its ability to capture data with heavier tails or different degrees of asymmetry.
To overcome these limitations, several two-parameter extensions of the L distribution have been proposed in the literature, such as the generalized Lindley distribution [
11], the power-Lindley distribution [
12], the Marshall–Olkin–Lindley distribution [
13], and the transmuted Lindley distribution [
14]. These distributions, due to their higher parameter dimension, extend the flexibility of the classical L model in terms of skewness and kurtosis.
A widely used strategy for extending classical models is the application of distributional generators. This strategy has led to several well-known distributional families, including the Marshall–Olkin distributions [
15], the Beta–G distributions [
16], the Gamma–G distributions [
17], the transmuted distributions [
18], the Kumaraswamy–G distributions [
19], and the alpha–power distributions [
20]. These families represent flexible extensions of classical models that, by introducing additional parameters, enhance their ability to accommodate a wide range of density shapes, skewness, kurtosis, and hazard rate behaviors, reinforcing the methodological relevance of transformation-based generators in modern statistical modeling.
A more recent example within this research line is the Lambert-
F generator, introduced by [
21], which allows the induction of an additional shape parameter into an arbitrary baseline distribution, thus providing flexibility in terms of skewness and tail behavior. Given a baseline distribution with CDF
, the Lambert-
F generator defines a new family through the transformation
where the parameter
controls skewness and tail behavior. This approach has been successfully combined with classical models, producing flexible distributions capable of modeling positive data with a wide range of shapes; see, for example, [
22,
23,
24,
25,
26].
The PDF and the QF associated with Equation (
4) are given by
where
is the PDF of the baseline distribution,
denotes the associated QF, and
represents the principal branch of the Lambert
W function.
In this paper, we introduce a new extension of the L distribution obtained through the Lambert-F generator, with the L distribution taken as the baseline model. The increasing demand for handling diverse types of information, including positive data, underscores the importance of having alternative probabilistic models available for data analysis, since a richer set of models enhances the chances of adequately capturing the characteristics observed in real datasets. To the best of our knowledge, a Lambert-type version of the L distribution has not yet been explored in the literature. This naturally raises the question of whether such a model can outperform well-known two-parameter distributions such as Weibull and Gamma, as well as existing extensions of the L distribution, in terms of goodness-of-fit in real-world applications.
The rest of the paper is organized as follows. In
Section 2, we introduce the new extension of the L distribution and derive some of its structural properties.
Section 3 discusses parameter estimation methods and presents a Monte Carlo simulation study. In
Section 4, the applicability of the proposed distribution is illustrated through two real datasets. Finally,
Section 5 provides concluding remarks.
4. Data Analysis
In this section, two real datasets are analyzed to demonstrate the usefulness of the LL distribution in applied contexts. The Gamma (G) and Weibull (W) models, together with well-known two-parameter extensions of the L distribution from the literature, are considered for comparative modeling of positive and skewed data.
The parameters of each model are estimated using the ML method, and the quality of fit is assessed through the Akaike information criterion (AIC) [
30] and the Bayesian information criterion (BIC) [
31]. In addition, the Anderson–Darling (AD) and Cramér–von Mises (CvM) goodness-of-fit tests [
32] are employed to provide statistical support for the suitability of the LL distribution to model the analyzed data.
Below, we present the PDFs corresponding to the distributions considered in the comparative analysis.
Power Lindley (PL) distribution [
12]
Generalized (GL) Lindley distribution [
11]
where
.
Transmuted (TL) Lindley distribution [
14]
where
.
Marshall-Olkin Lindley (MOL) distribution [
33]
where
.
Weibull (W) distribution [
10]
Gamma (G) distribution [
9]
Except for the L distribution, the distributions described above have the same number of parameters as the LL distribution, which allows for a fair and direct comparison among them. In this sense, the LL distribution is proposed as a natural alternative within this group. On the other hand, the G and W distributions are included because of their widespread use in modeling continuous, positive, and skewed data, serving as classical references in this type of application.
4.1. Stress Rupture Time Data
In reliability data analysis, it is essential to rely on flexible distributional models that can adequately capture the asymmetric and highly variable nature of failure times observed in real experiments. For example, in material fatigue studies, observations often exhibit right-skewness and extreme behavior that cannot be well described by classical models, either symmetric or with light tails.
In this application, we consider a dataset of 76 observations on the rupture times of Kevlar 373/epoxy composite specimens, subjected to a constant load of 90% of their maximum stress until complete failure. These data were previously analyzed in Andrews and Herzberg [
34] and are displayed in
Table 4.
Some descriptive measures for these data are: mean 1.959, standard deviation 1.574, skewness coefficient 1.979, and kurtosis coefficient 8.160. These results indicate a positively skewed distribution with high kurtosis, reflecting the presence of outliers, as also observed in
Figure 4.
Table 5 reports the ML estimates (with standard errors in parentheses) for the parameters of the LL, PL, GL, TL, MOL, W, and G distributions fitted to the rupture time data. It also includes the
p-values from the AD and CvM goodness-of-fit tests, as well as AIC and BIC values for each fitted distribution. The LL distribution yields the highest
p-values for the AD and CvM tests, indicating that at the 5% significance level there is no statistical evidence to reject the hypothesis that the data come from this distribution. In addition, the LL distribution attains the lowest AIC and BIC values, suggesting superior comparative performance.
A Wald test with the null hypothesis was applied to evaluate whether the inclusion of the additional parameter significantly improves the fit of the LL model compared with the baseline L distribution. Using the ML estimate and its standard error , the test statistic which follows asymptotically a distribution, yielded a p-value of . This result provides statistical evidence that the parameter plays a meaningful role in improving model flexibility. Specifically, the inclusion of allows the LL distribution to capture additional skewness and tail variability beyond what the classical L model can represent.
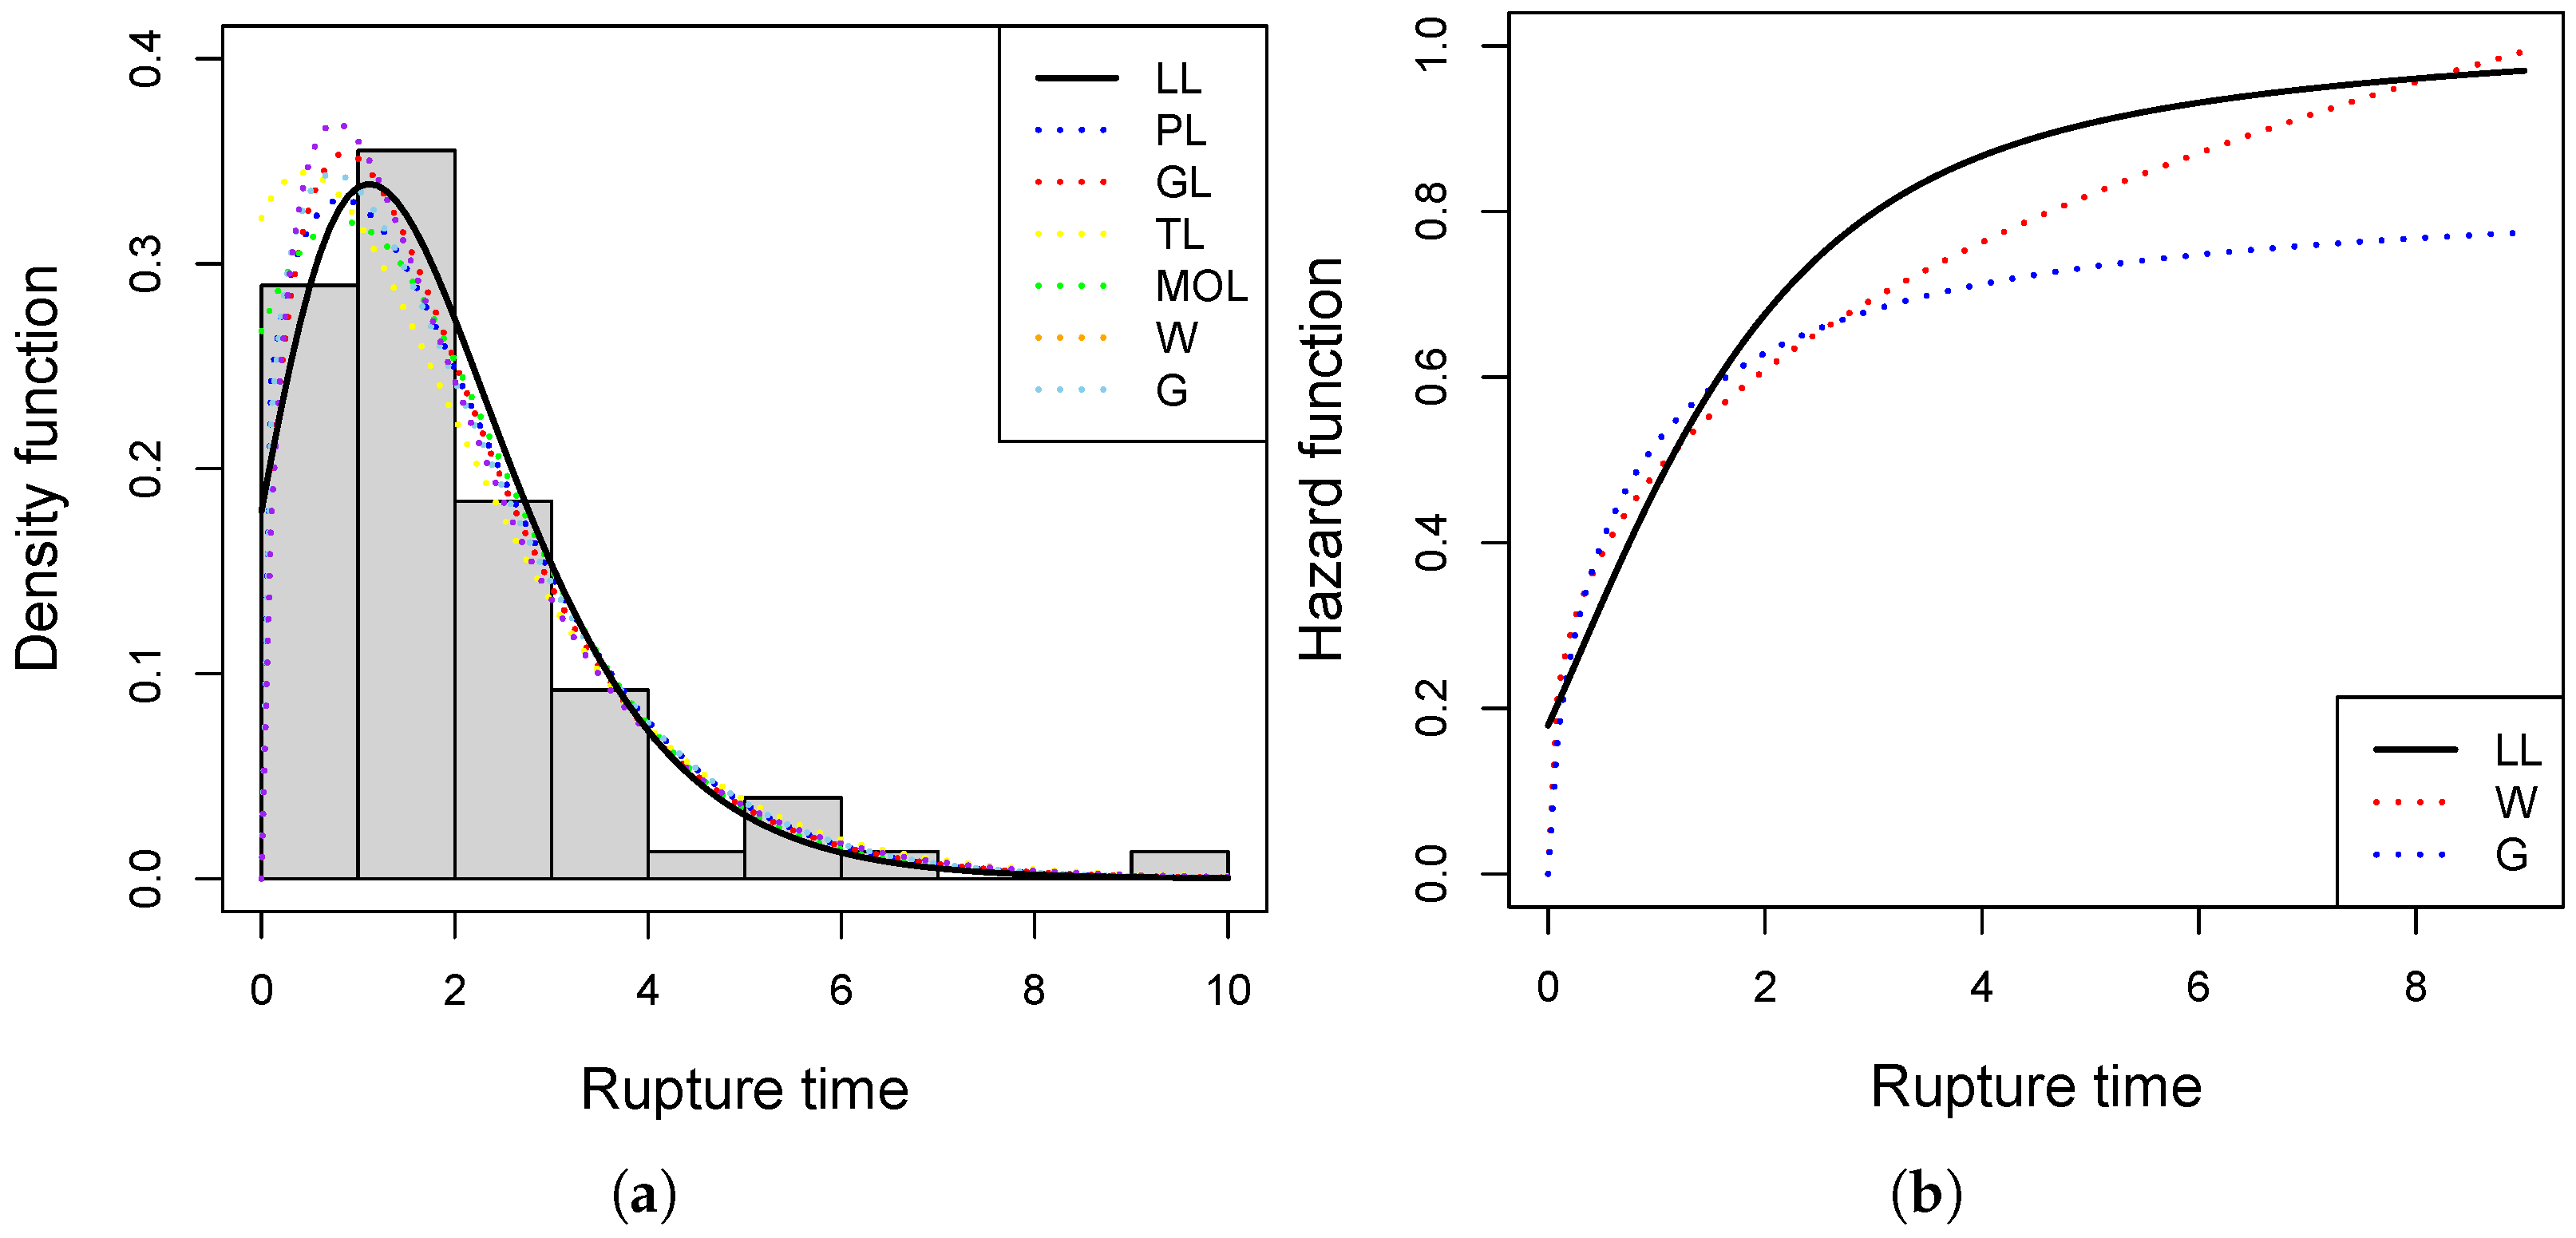
Figure 5 displays the rupture time data together with the fitted models. The left panel shows the histogram with the fitted PDFs. The LL distribution provides densities closer to the histogram frequencies, particularly around the modal region. The right panel compares the HRFs of the LL, W, and G distributions. The LL distribution exhibits a more sharply increasing hazard rate as rupture time increases, suggesting greater sensitivity to progressive system deterioration. In contrast, the W distribution shows a moderately increasing hazard, while the G distribution presents a smoother increase, underestimating the risk of failure at higher rupture times.
4.2. Hospital Stay Times Data
In the analysis of duration data in clinical contexts, it is essential to rely on distributional models flexible enough to adequately capture the strong skewness and dispersion typically exhibited by hospital stay times. In this type of data, a substantial proportion of observations correspond to short stays, while a smaller subset may present exceptionally long stays. This combination of frequent and extreme events generates positively skewed distributions with heavy tails, which are not well described by classical symmetric or light-tailed models.
In this application, we consider a dataset of 300 hospital stay times (in days) for patients diagnosed with breast cancer. Each observation represents the total number of days elapsed between hospital admission and medical discharge. These data were previously analyzed by Safari et al. [
35] and are presented in
Table 6.
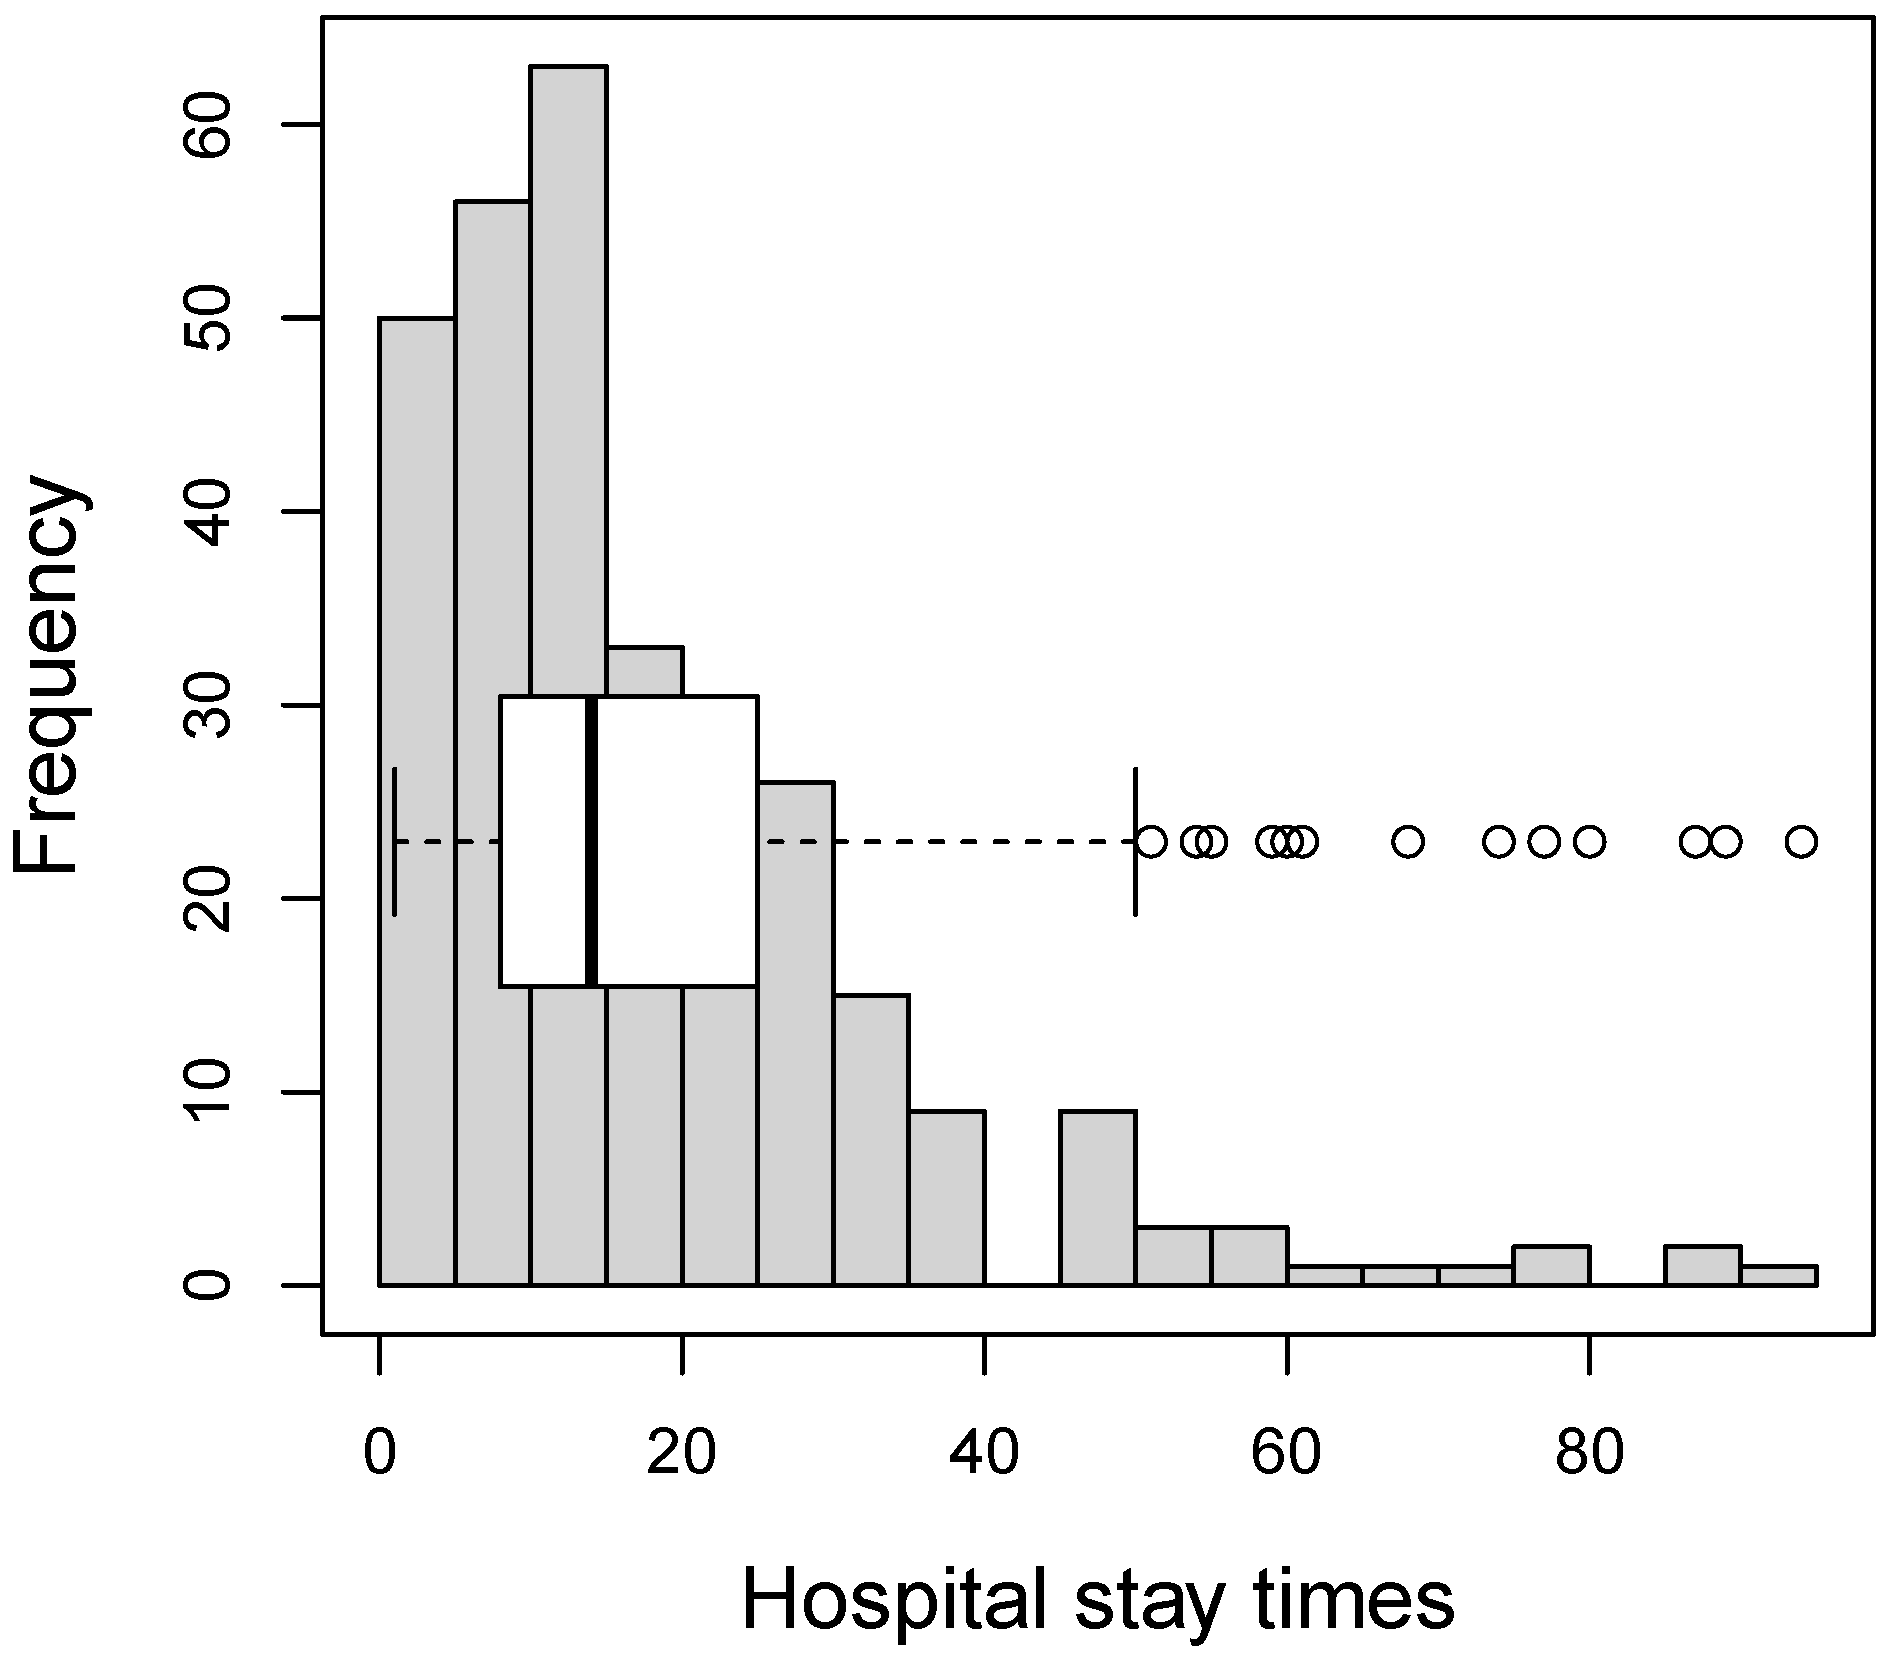
Some descriptive measures for these data are: mean 18.44, standard deviation 15.89, skewness coefficient 1.96, and kurtosis coefficient 7.91. These values indicate substantial variability and strong positive skewness, as well as heavy-tailed behavior due to the presence of outliers. This pattern is also reflected in
Figure 6, where the histogram shows unimodality with a large concentration of stays shorter than 20 days, while the boxplot highlights a few extremely long hospitalizations.
Table 7 summarizes the ML estimates (with standard errors), together with
p-values from the AD and CvM tests and the AIC and BIC criteria for all fitted models. The LL distribution clearly stands out by achieving the highest goodness-of-fit
p-values and the lowest information criteria, thereby emerging as the most suitable model for these data.
Applying the Wald test analogously to the analysis conducted in
Section 4.1, we tested the null hypothesis
for the hospital stay time data. Using the ML estimate
and its standard error
, the test statistic
, which follows a
distribution, resulted in a
p-value smaller than
. This indicates that the parameter
significantly differs from one, providing statistical evidence that the LL distribution offers a substantially better fit than the classical L model.
Figure 7 provides a graphical comparison of the fitted models. The left panel shows the histogram of hospital stay times together with the fitted PDFs. The LL distribution provides a closer fit to the empirical frequencies, capturing both the main peak and the heavy right tail. The right panel displays the hazard rate functions of the LL, W, and G distributions. The LL distribution exhibits a sharper increase at early times followed by stabilization, reflecting greater sensitivity to the concentration of short stays and the occurrence of longer hospitalizations. In contrast, the W distribution shows a more gradual increase, while the G distribution yields an even smoother hazard, underestimating the probability of longer stays.
5. Final Comments
The Lambert–Lindley (LL) distribution introduced in this paper provides a flexible alternative for modeling positive, skewed, and unimodal data. Its formulation, based on the application of the Lambert-F generator to the Lindley (L) distribution, introduces an additional parameter that improves the ability of the distribution to capture varying levels of skewness and kurtosis.
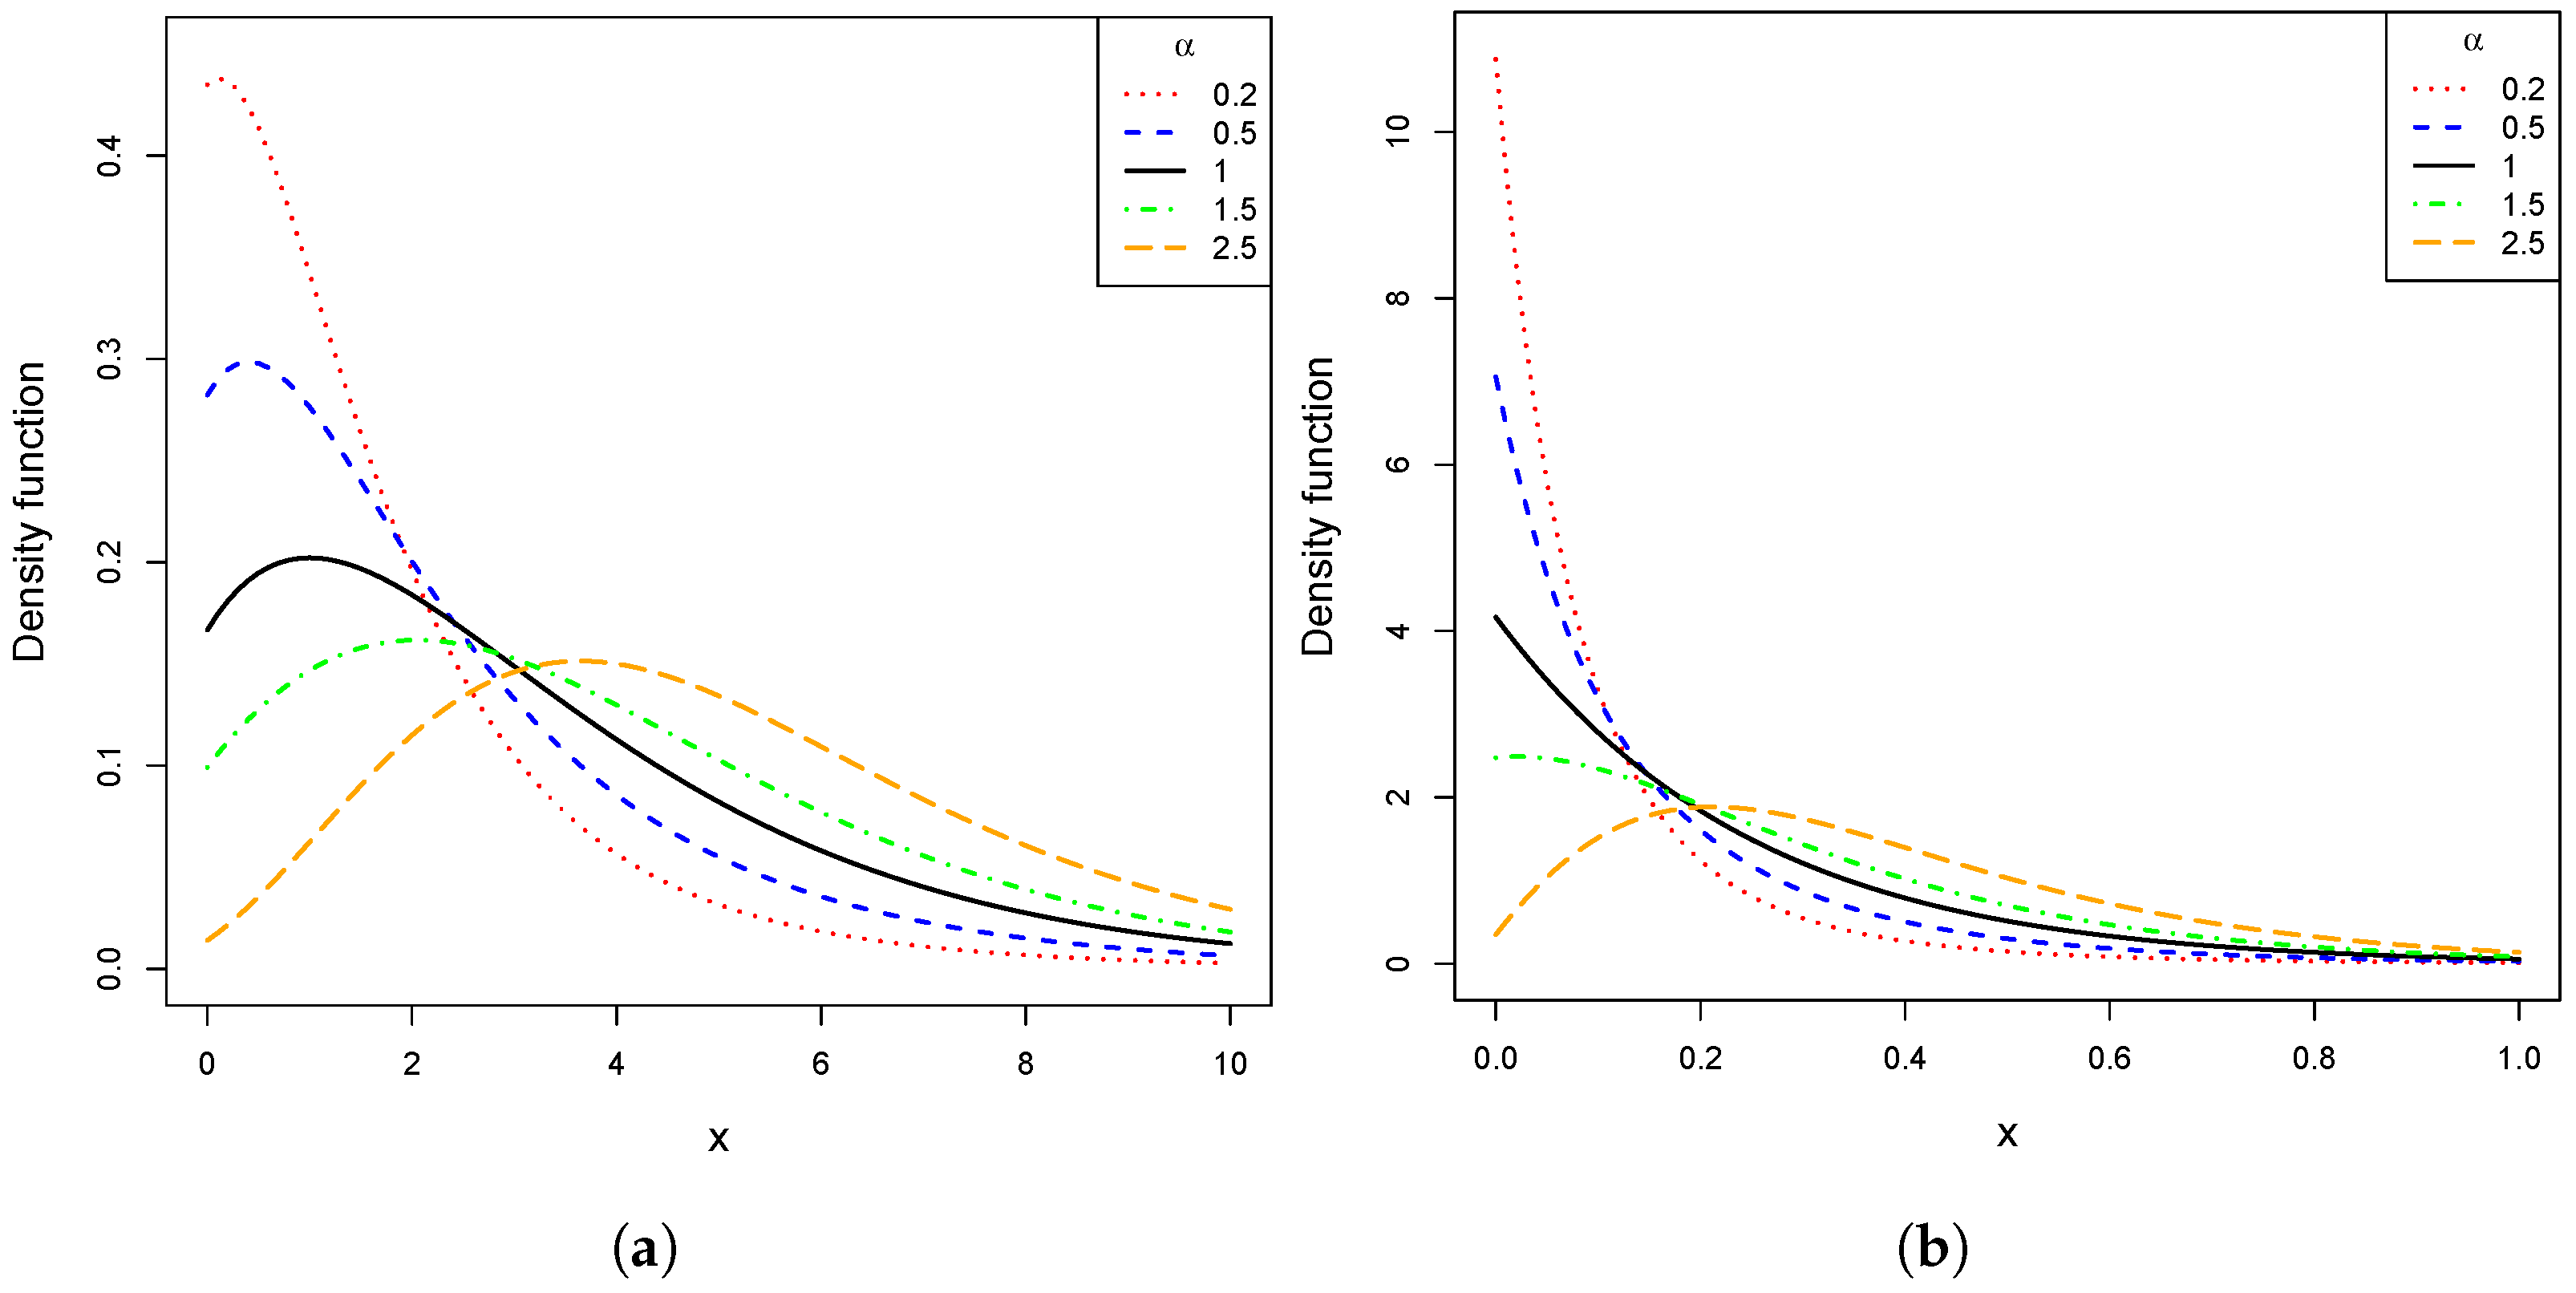
Fundamental structural forms (including the probability density, distribution, quantile, and hazard rate functions) were derived, along with expressions for moments, measures of variability, and shape coefficients. These results indicate that the LL distribution overcomes the limitations of the classical L distribution by accommodating both unimodal and decreasing shapes, thereby offering greater versatility for analyzing data with different tail behaviors.
An important feature is the behavior of the PDF of the LL distribution at the lower bound of the support. Depending on the value of the shape parameter induced by the generator, the density in this region can be either higher or lower than that of the classical L distribution. This property enhances the ability to adequately model the lower quantiles, which is particularly relevant in applications that require describing short-duration phenomena or data with strong concentration near small values.
The analysis of the hazard rate function further showed that the LL distribution represents a modification of the classical L hazard rate at early times of the support. Depending on the value of the additional parameter, the hazard rate may lie above or below that of the L distribution in this initial region, thereby enabling a more accurate modeling of phenomena where early risk is relevant. In the long run, both distributions exhibit a similar asymptotic behavior, ensuring consistency in interpretation. This property enables the LL distribution to accommodate both monotonic hazard rates (different from those of the classical L) and non-monotonic shapes, broadening its applicability in reliability and survival analysis.
Parameter estimation was addressed using the method of moments and maximum likelihood, both requiring numerical procedures. A Monte Carlo simulation study confirmed the consistency and good performance of the estimators under different scenarios, thereby supporting their practical relevance.
In the applied setting, analyses with real datasets showed that the LL distribution can provide a better fit than widely used two-parameter models such as Gamma, Weibull, and several extensions of the L distribution. These results indicate that the new distribution is not only of theoretical interest but also offers tangible advantages in reliability engineering, healthcare, and other fields where modeling lifetimes or non-negative variables is required.
Beyond these numerical improvements, the LL distribution demonstrates practical relevance in real-world contexts such as reliability engineering, material fatigue, and environmental lifetime studies, where failure times or degradation processes often exhibit asymmetric patterns and non-constant risks. Its ability to capture both short-duration and long-tailed behaviors allows practitioners to represent systems with early failures, variable stress conditions, or lifetime dispersion driven by environmental or operational uncertainty. Therefore, the LL distribution extends beyond numerical superiority, providing a theoretically grounded and interpretable framework for modeling positive lifetime data observed in diverse applied disciplines.
Finally, a repository with the main functions and analyses developed in this study is made available.


