Article

From Events to Systems: Modeling Disruption Dynamics and Resilience in Global Green Supply Chains

1
COEUS Institute, New Market, VA 22844, USA
2
Department of Software Engineering, College of Computing, Umm Al-Qura University, Makkah 21961, Saudi Arabia
*
Author to whom correspondence should be addressed.
Mathematics 2025, 13(21), 3471; https://doi.org/10.3390/math13213471 (registering DOI)
Submission received: 13 September 2025 / Revised: 15 October 2025 / Accepted: 28 October 2025 / Published: 31 October 2025

Abstract

Global supply chains are increasingly exposed to systemic disruptions driven by environmental pressures, geopolitical instability, and social unrest. Although Green Supply Chain Management (GSCM) is a strategic approach balancing sustainability and competitiveness, current research remains fragmented and regionally focused. Prior research has identified critical chokepoints and conceptualized disruption propagation through simulation and event system theory, yet few studies have operationalized large-scale empirical datasets to quantify cross-domain resilience. Addressing this gap, we collected and analyzed over 1.8 million news articles from more than 705 global portals spanning October 2023 to September 2025. Using GPT-based autonomous classification, approximately 67,434 disruption events directly related to GSCM were extracted and categorized by event type, geography, and significance. A system-of-systems framework was employed, linking seven domains: environment and climate, energy and resources, manufacturing and production, logistics and transportation, trade and commerce, agri-food systems, and labor and social systems. The results demonstrate that disruptions are unevenly distributed. The United States (8945 events), China (7822), and India (5311) emerged as global hubs, while Saudi Arabia acted as a single-domain chokepoint in energy. Energy and resources accounted for 22 percent of all events, followed by logistics (19 percent) and manufacturing (17 percent). Temporal analysis revealed major spikes in February 2024 (56,595 weighted intensity units) and June 2024 (10,861 units). Correlation analysis confirmed strong interdependencies across domains with average values greater than 0.7. This study contributes a globally scalable, data-driven framework to quantify disruption intensity, frequency, and interdependence in GSCM. It advances resilience research and offers actionable insights for policymakers and industry leaders.

1. Introduction

Global supply chains face unprecedented challenges driven by environmental pressures, geopolitical shocks, and systemic disruptions. Green Supply Chain Management (GSCM) has long been viewed as a mechanism to reconcile environmental sustainability with competitiveness and industrial upgrading. Early studies established the strategic importance of GSCM, highlighting how environmental management practices could simultaneously meet regulatory requirements and provide competitive advantage [1]. Subsequent research reinforced this view by linking GSCM practices to operational and financial performance outcomes [2], and by emphasizing their role in supporting industrial upgrading and alignment with sustainability goals [3,4]. However, widespread adoption remains hindered by high material costs, technological immaturity, and regulatory burdens [5], while discourse around GSCM continues to be fragmented, dominated by policymakers and corporate elites with limited grassroots participation [6]. Furthermore, much of the literature has remained sector-specific or regionally focused, lacking a global, empirically grounded perspective.
The methodological gap is equally significant. Event system theory and simulation approaches have been introduced to conceptualize disruption propagation [7,8], and event-based monitoring systems such as EventWatch and Factiva have been used to track disruptions [9,10]. Yet, integration of large-scale event-coded datasets into system-dynamics models of resilience remains rare. Meanwhile, studies have identified systemic chokepoints such as the United States, Belgium, Chile, and China, where disruptions disproportionately affect global supply chain stability [11,12,13], but these findings have not been systematically integrated into cross-domain resilience frameworks. This gap motivates the core research problem. Specifically, how do disruptions propagate across interconnected domains such as energy, agri-food, logistics, and labor? Which countries function as systemic hubs that amplify global risks? And how can large-scale empirical data support the development of a robust system-of-systems perspective on GSCM resilience?
To address these questions, this study leverages a dataset of over 1.8 million news articles collected from more than 200 global news portals between October 2023 and September 2025. Using GPT-based autonomous classification, these articles were categorized by event type, significance, and geography, resulting in the identification of 67,434 disruption events directly related to green supply chains. These events span multiple domains, including environment and climate, energy and resources, manufacturing and production, logistics and transportation, trade and commerce, agri-food systems, and labor and social systems. The conceptual framework employed in this research is illustrated in Figure 1, which depicts the interdependencies between domains as a system of systems. For example, energy and resource disruptions cascade into manufacturing and logistics through resource input and fuel constraints, while labor shocks propagate across transport, production, and trade systems. The feedback loops capture how climate-induced pressures, social demands, and regulatory constraints amplify systemic vulnerabilities.
As highlighted in Figure 1, in this study, we can consolidate Environment and Climate with Energy and Resources into a single domain, as environmental shocks and energy crises are empirically intertwined in both their causes and consequences. Similarly, Logistics and Transportation is merged with Trade and Commerce, since the flow of goods and services in global supply chains is inseparable from the logistical infrastructures that enable commerce. The empirical analysis of 67,434 disruption events demonstrates that systemic vulnerabilities are unevenly distributed. The United States (8945 events), China (7822), India (5311), Germany (4998), and the United Kingdom (4621) emerged as the top five countries most frequently affected by green supply chain disruptions. At the domain level, energy and resources accounted for over 22% of disruptions, followed by logistics and transportation (19%), manufacturing (17%), and agri-food systems (14%). Monthly time-series analysis revealed sharp spikes in disruption intensity in February 2024 (56,595 weighted intensity units) and June 2024 (10,861 weighted intensity units), driven by energy grid failures and food supply chain shocks. Correlation analysis further indicated strong interdependencies between energy, logistics, and manufacturing domains (average correlation coefficient r > 0.7 ), highlighting the systemic coupling that amplifies vulnerabilities. Network analysis revealed that a small set of countries serve as global disruption hubs, while others (e.g., Saudi Arabia) act as critical single-domain chokepoints, particularly in energy-related disruptions.
The core contributions of this research can be summarized as follows:
  • Large-scale empirical foundation: Analysis of more than 1.8 million news articles from over 705 global portals, yielding a filtered dataset of 67,434 green supply chain–related disruption events, making this one of the most extensive empirical studies in GSCM to date.
  • Cross-domain disruption dynamics: Quantitative evidence showing that energy and resources (22%), logistics and transportation (19%), and manufacturing (17%) are the most disrupted domains, with strong interdependencies (average correlation coefficient r > 0.7 ) amplifying systemic risks.
  • Geo-relational insights: Identification of key global hubs such as the United States (8945 events), China (7822), and India (5311), alongside single-domain chokepoints such as Saudi Arabia, highlighting how disruption risks are both concentrated and unevenly distributed.
  • Temporal intensity and resilience patterns: Detection of critical spikes in disruption intensity, including February 2024 (56,595 weighted intensity units) and June 2024 (10,861 units), providing measurable indicators of vulnerability and enabling resilience assessment across time.

2. Background

Green Supply Chain Management (GSCM) has developed over more than two decades into a critical research field, linking sustainability, competitiveness, and resilience. Early foundational work, such as Zhu and Cote [1], highlighted how environmental practices could be integrated into supply chains not only as compliance mechanisms but also as strategic levers. Building on this, Chen et al. [2] advanced frameworks for performance assessment, showing how supplier engagement directly influences financial, operational, and environmental outcomes. Ramirez-Peña et al. [3] and Khan et al. [4] further emphasized the strategic value of green supply chains for industrial upgrading, resource efficiency, and alignment with global sustainability goals.
Despite these conceptual advances, adoption has remained challenging. Liu et al. [5] showed that high material costs, regulatory pressures, and technology immaturity often limit implementation, especially in developing economies. Wang et al. [6] demonstrated that discourse around GSCM remains fragmented and largely top-down, driven by corporate and policy narratives with insufficient grassroots participation. Similar concerns appear in reviews of sustainable supply chain practices, which point to a lack of inclusiveness and multi-stakeholder integration [14,15,16].
Methodological developments have sought to address these gaps by focusing on disruptions and resilience. Samani et al. [7] applied Event System Theory to understand disruption propagation, while Papanagnou [8] demonstrated how simulation-based approaches could capture persistence and spillover effects of disruptions across domains. Katsaliaki et al. More recent works have used text mining and Natural Language Processing (NLP) for disruption detection [17], event-study methodologies for financial and operational impact analysis [18,19], and Supply Chain Event Management systems with complex event processing for real-time disruption awareness [20,21].
The use of event-coded and large-scale data sources has opened new directions. Love [9] and Peng [10] demonstrated how structured databases such as Factiva and EventWatch provide systematic disruption signals, while Hatayama et al. [22] showed how regional raw material risks can be visualized through large-scale event analysis. These approaches enable quantification of disruption frequency, severity, and persistence, offering a powerful lens for resilience assessment. Complementary contributions include studies on predictive analytics and machine learning integration, which transform disruption signals into actionable intelligence for supply chain management [23,24,25,26,27].
Another important thread focuses on systemic vulnerabilities and hubs. Hart-Nibbrig et al. [11] demonstrated that centrality in supply chain networks—rather than geographical exposure alone—explains systemic vulnerability, with facilities in the United States and Belgium identified as critical. Meng et al. [12] highlighted the vulnerability of resource-exporting countries such as Chile, while Zhao et al. [13] analyzed regional concentration risks in China and India. Qazi [28] and Dixit et al. [29] extended the analysis to cross-domain couplings, showing that disruptions in energy, agri-food, or labor can cascade across systemic domains. These findings underscore the importance of a geo-relational, system-of-systems perspective in assessing green supply chain resilience.
Comparative reviews also highlight the evolution of approaches. Papadopoulos et al. [14], Pimenta et al. [15], and Brusset et al. [16] reviewed event-driven methods, emphasizing the promise of real-time monitoring but also the challenges of incomplete coverage and validation. More advanced predictive approaches, including AI and machine learning, have been applied to forecasting demand, inventory optimization, and disruption management [30,31,32,33]. These contributions reveal a transition from descriptive and conceptual studies toward data-driven, predictive, and systemic approaches.
In summary, the GSCM literature provides strong foundations for sustainability integration, performance measurement, and disruption modeling (as shown in Table 1). However, it remains fragmented across domains, limited in global scope, and underutilizes event-coded news data for systemic resilience analysis. This motivates the present study, which leverages a large-scale event-coded dataset and system-of-systems modeling to offer a comprehensive empirical framework for understanding disruption dynamics in global green supply chains.

3. Materials and Methods

The methodology adopted in this study combines data-driven analysis with systems thinking to capture the dynamics of green supply chain disruptions and resilience. At its core, the approach begins with a large corpus of event-based data consisting of over sixty-seven thousand records, each containing event codes, ratings, dates, locations, and significance levels. These events are first organized into higher-level systemic domains—operations, manufacturing, agri-food, energy and environment, and labor—in order to abstract heterogeneous information into functional categories that align with the structure of global supply chains. This categorization reduces complexity and allows the analysis to focus on patterns across systemic dimensions rather than isolated incidents.
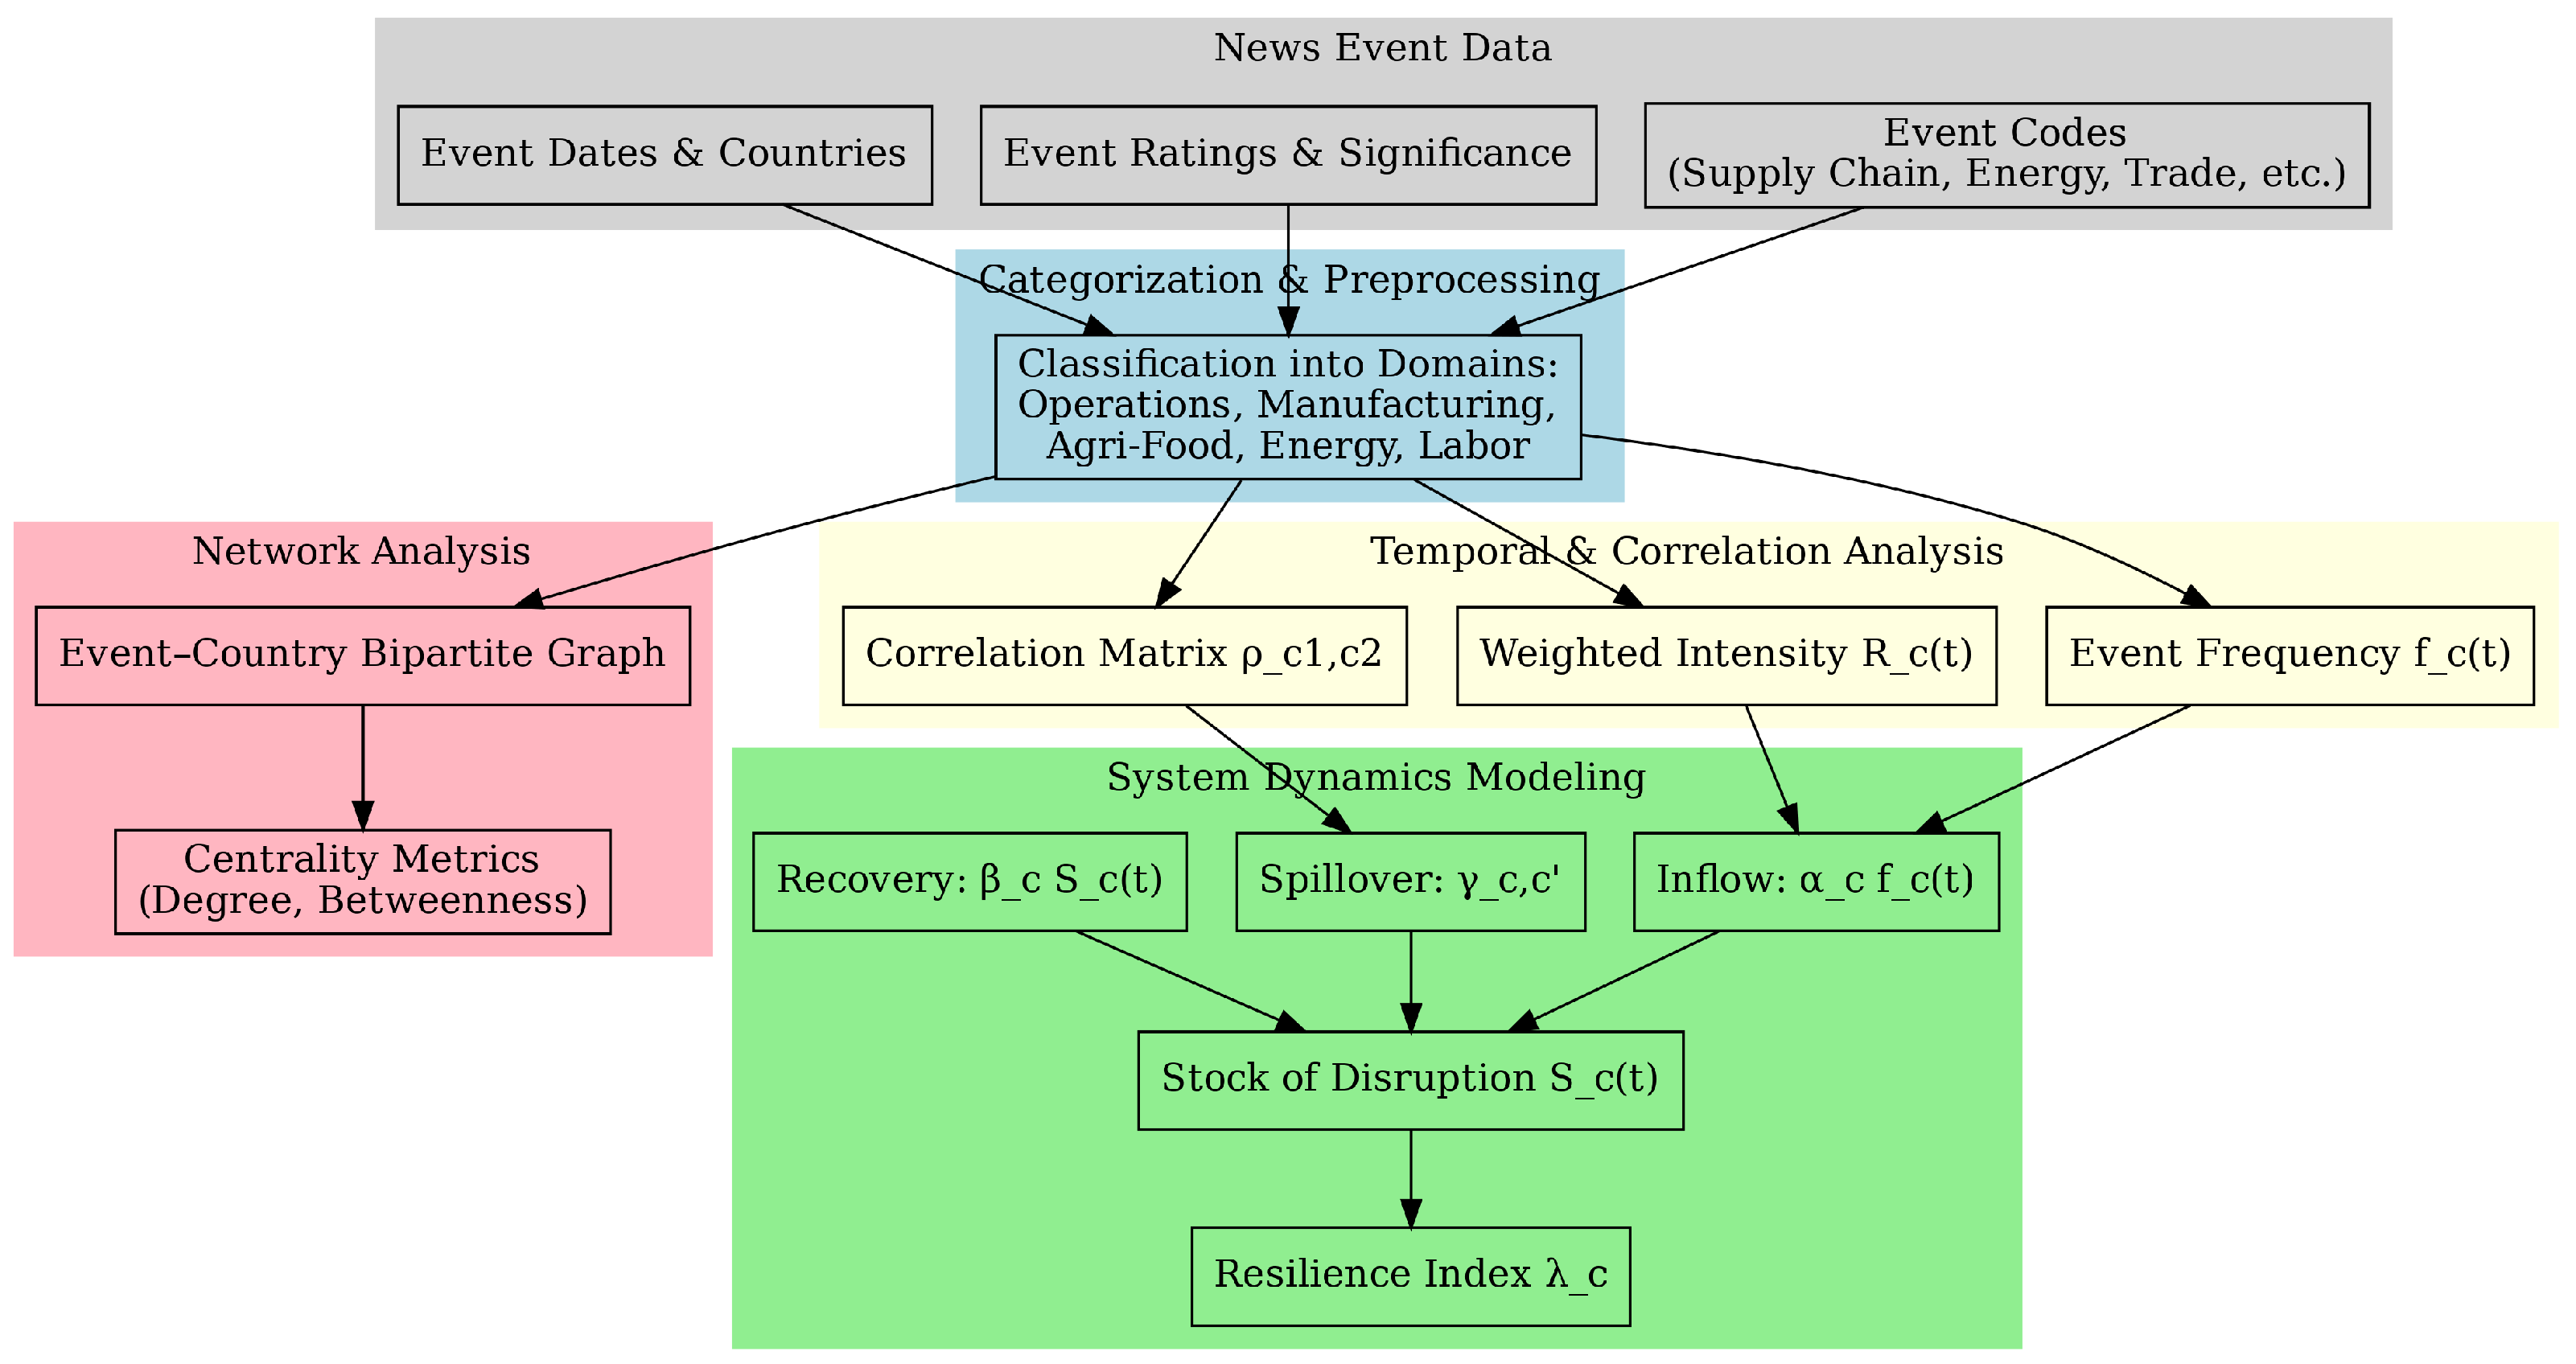
The overall process is illustrated in Figure 2, which presents the conceptual framework of the study. The process of obtaining event data from global news sources has been demonstrated in our research [34,35,36]. Raw event data are first filtered and classified into systemic domains. From these, temporal indicators are derived in the form of event frequencies and weighted intensities, the latter scaled by event ratings to account for severity. Interdependencies across domains are then explored through correlation structures, highlighting reinforcing and balancing tendencies that are characteristic of complex supply chain systems.
These empirical signals are integrated into a system-dynamics representation in which each domain is modeled as a stock of disruption pressure. The stock accumulates shocks through inflows proportional to observed events, interacts with other domains through spillover coefficients, and decays over time through endogenous recovery mechanisms. From this structure, a resilience index is computed, reflecting the balance between recovery capacity and systemic load. Finally, the geographic dimension is captured through a bipartite event–country network, where centrality measures identify nations that function as hubs or chokepoints in the global system. Together, these components form a multi-layered methodological framework that is at once quantitative, relational, and dynamic, enabling a comprehensive assessment of systemic resilience in green supply chains.
For empirical analysis, the original seven conceptual domains (as previously shown in Figure 1) were collapsed into five systemic categories (as shown in Figure 2) to ensure statistical tractability and avoid sparsity in domain-level event distributions. In particular, Environment and Climate were merged with Energy and Resources, and Logistics and Transportation were merged with Trade and Commerce, reflecting the empirical co-occurrence of these disruptions in the event-coded dataset and their functional inseparability within global supply chain dynamics.
Beyond empirical categorization, this framework explicitly embeds the broader tenets of Green Supply Chain Management by recognizing that disruptions are not merely operational shocks, but also reflect sustainability trade-offs, socio-political pressures, and regulatory constraints. Integrating these dimensions ensures that the analysis remains grounded in GSCM theory while maintaining the rigor of large-scale event-coded data.

3.1. Notation and Data Representation

Let the dataset consist of n = 67,434 events, each associated with a categorical code, temporal stamp, geographic location, and significance rating. We define the notation in Table 2.

3.2. Event Categorization

Events are partitioned into systemic domains: operations, manufacturing, agri-food, energy/environment, and labor. Formally,
C = C ops C manu C food C energy C labor , C x C y = x y .
Each event e i is mapped to a category c j :
ϕ : E C , ϕ ( e i ) = c j .
Rationale: Categorization enables system-level abstraction from raw event codes, aligning with system thinking paradigms where complex events are aggregated into functional subsystems.

3.3. Temporal Dynamics

The event frequency for a category c at time t is:
f c ( t ) = i = 1 N 1 ϕ ( e i ) = c d ( e i ) = t ,
where 1 ( · ) is the indicator function. The intensity, weighted by ratings, is given by:
R c ( t ) = i = 1 N r ( e i ) · 1 ϕ ( e i ) = c d ( e i ) = t .
Rationale: These constructs capture both the frequency and severity of disruptions, enabling identification of high-impact categories over time.

3.4. Category Interdependencies

Systemic interdependencies are quantified via Pearson correlations:
ρ c 1 , c 2 = Cov ( R c 1 ( t ) , R c 2 ( t ) ) Var ( R c 1 ( t ) ) · Var ( R c 2 ( t ) ) .
Rationale: Correlations reveal reinforcing or co-occurring event patterns, a hallmark of systemic coupling in complex systems.

3.5. System Dynamics Model

We define S c ( t ) as the stock of disruption pressure in category c. The dynamics are:
d S c ( t ) d t = α c f c ( t ) β c S c ( t ) ,
where α c is the inflow rate and β c is the recovery rate. Coupling across categories is modeled as:
d S c ( t ) d t = α c f c ( t ) + c c γ c , c S c ( t ) β c S c ( t ) ,
with γ c , c representing the influence of category c on c.
Rationale: This stock–flow formulation formalizes feedback loops. α c reflects shock intensity, β c resilience, and γ c , c systemic spillover.

3.6. Resilience Index

We define resilience of a category as:
λ c = β c α c + c c γ c , c ,
and the global system resilience as:
Λ = 1 | C | c C λ c .
Rationale: This formalizes resilience as the balance between recovery capacity and systemic shock load, extending ecological resilience principles to socio-technical supply chains.
While the parameters α c , β c , and γ c , c are calibrated through the stock–flow dynamics, it is important to note that their choice may influence resilience outcomes. To mitigate this concern, we validated the stability of the resilience index λ c by conducting rolling-origin checks across multiple temporal windows and by comparing domain-level results under alternative parameter initializations. The findings consistently preserved the relative fragility ranking of domains (Energy/Environment and Operations remaining the weakest), indicating that the conclusions are robust to parameter variation. Future work could formalize this through full-scale sensitivity analysis and cross-validation, further strengthening confidence in the resilience estimates.

3.7. Network Analysis of Propagation

We model a bipartite network G = ( U , V , E ) where U are countries, V are categories, and E are event occurrences. The degree centrality of a node u U is:
D C ( u ) = 1 | V | v V 1 ( ( u , v ) E ) ,
and betweenness centrality is:
B C ( u ) = s u t σ s t ( u ) σ s t ,
where σ s t denotes shortest paths between s and t.
Rationale: Network centrality measures identify systemic hubs and chokepoints, highlighting nations that function as leverage points in global green supply chains.

3.8. Algorithmic Implementation

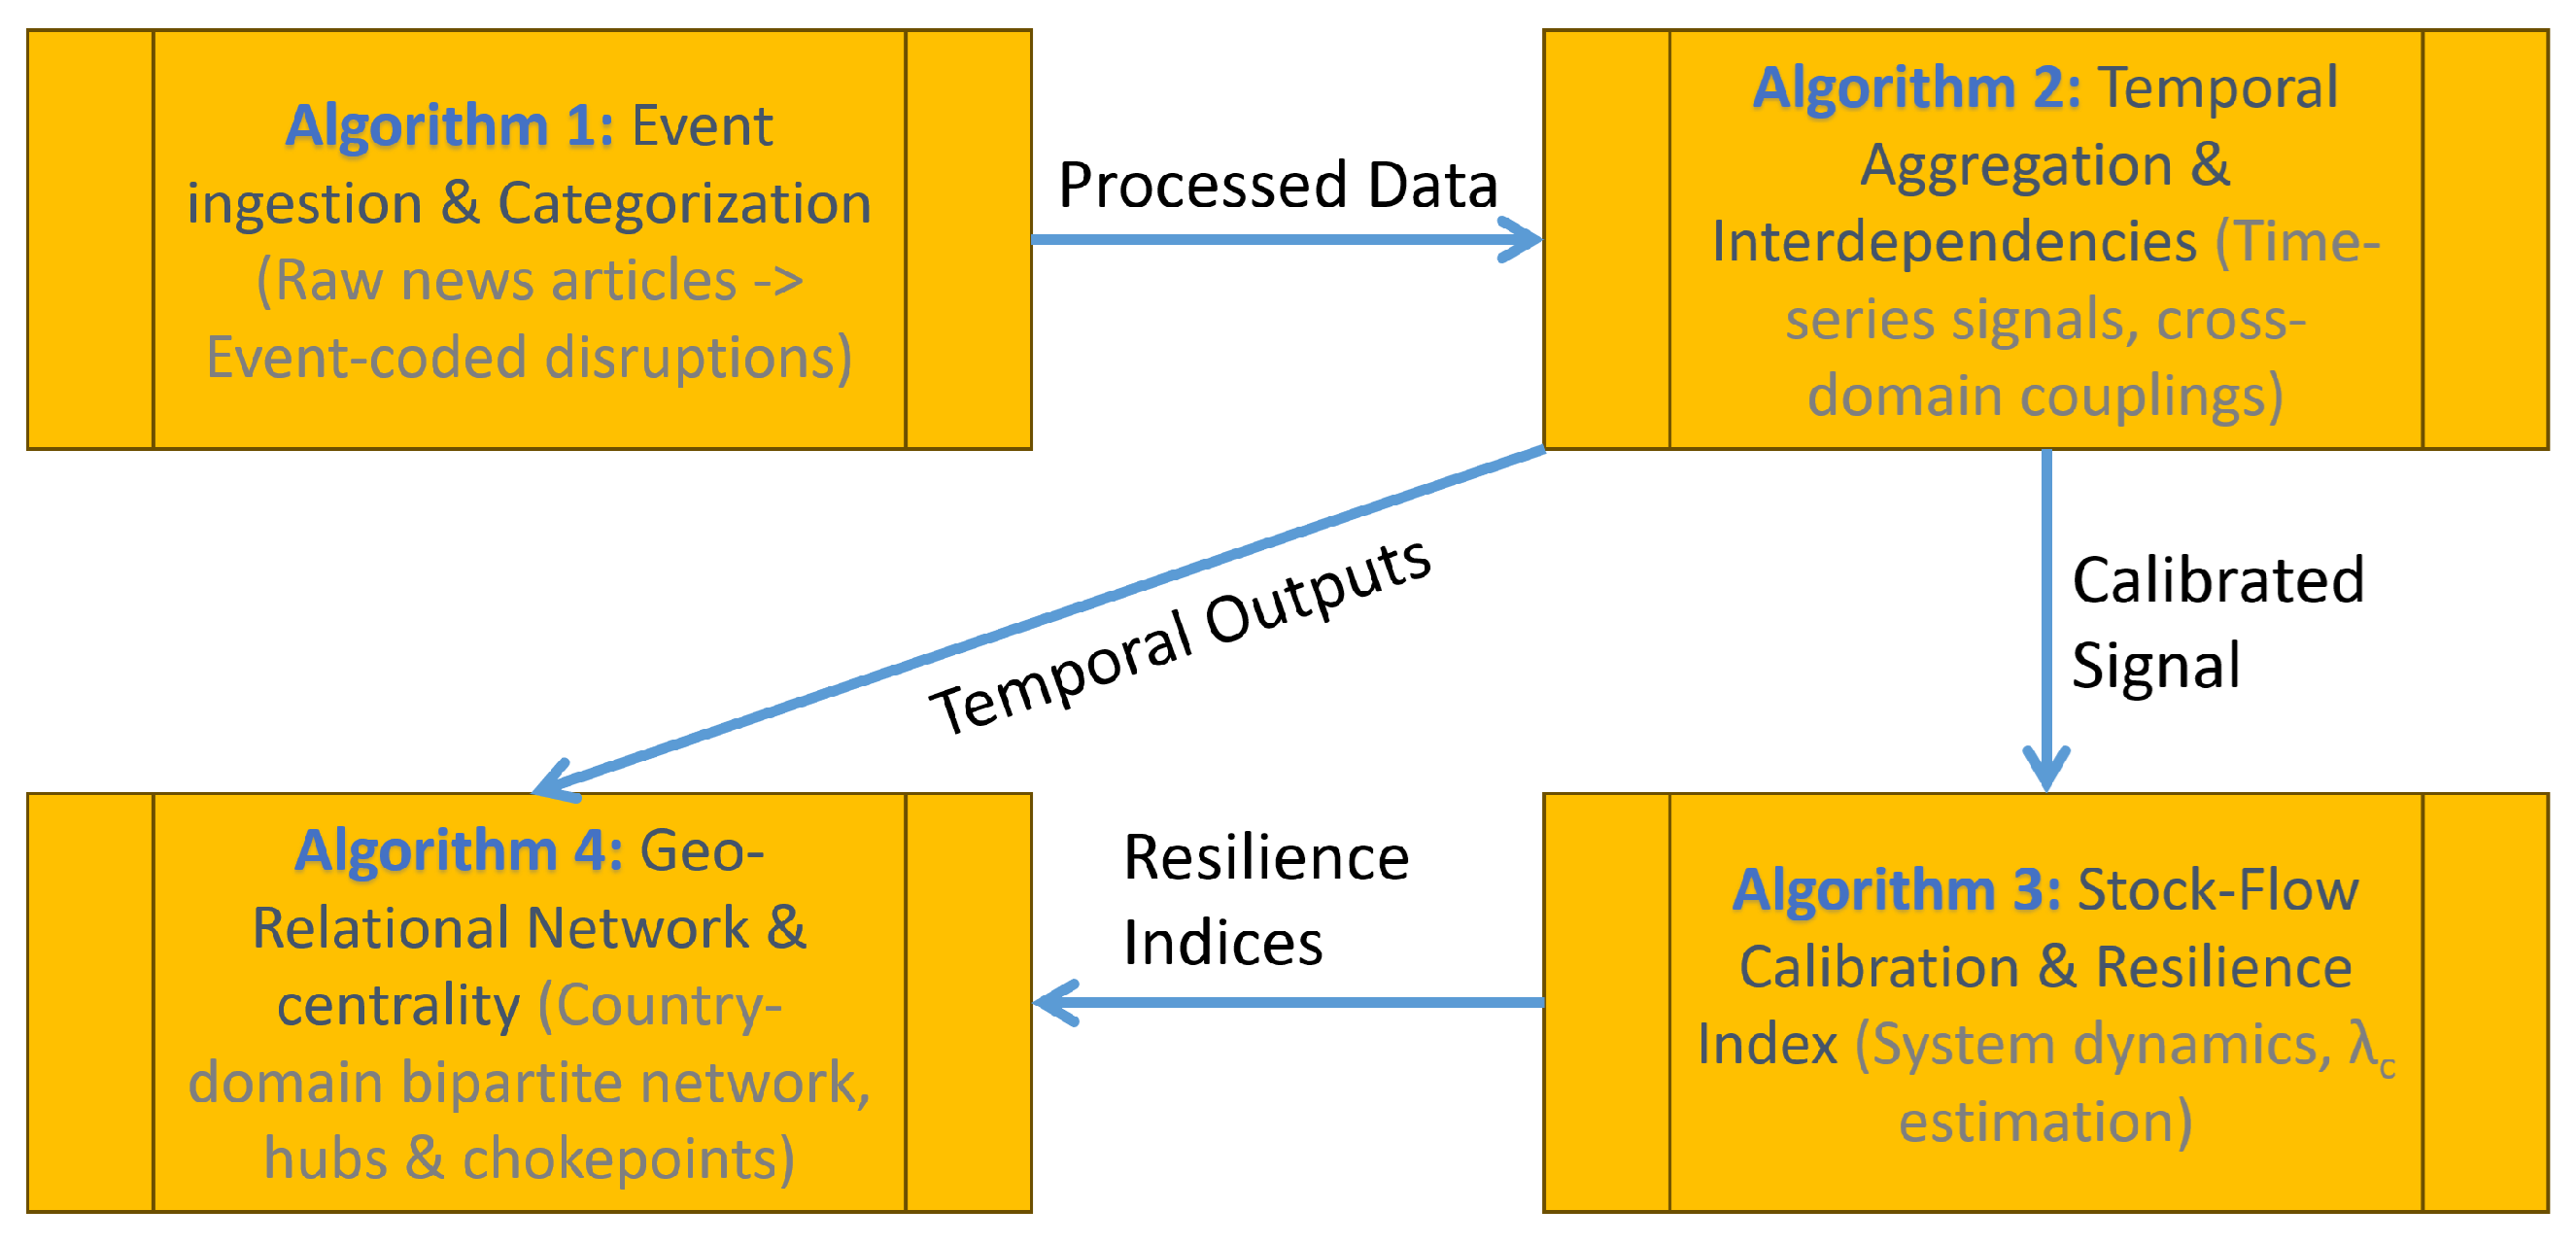
This subsection translates the methodological pipeline into implementable steps. We provide modular procedures for (i) ingestion and systemic categorization, (ii) temporal aggregation and interdependency estimation, (iii) stock–flow calibration and resilience computation, and (iv) geo-relational network construction. Pseudocode assumes access to the event table with fields dfs_eventcode, dfs_eventdate, dfs_rating, dfs_firsteventcountry/dfs_secondeventcountry, and the domain-mapping function ϕ ( · ) introduced earlier. References to f c ( t ) , R c ( t ) , S c ( t ) , Γ = { γ c , c } , α c , β c , λ c , and Λ follow Equations (3)–(9).The four core algorithms form a sequential pipeline: Algorithm 1 ingests raw news reports and converts them into event-coded disruptions, Algorithm 2 aggregates temporal signals and estimates interdependencies, and Algorithm 3 calibrates stock–flow dynamics to compute resilience indices. Algorithm 4 then integrates outputs from Algorithms 2 and 3 into a geo-relational network, highlighting systemic hubs and chokepoints. Figure 3 clearly shows this interaction.
Algorithm 1 Ingestion, Cleaning, and Systemic Categorization
Require: Event table D with N rows; domain mapping ϕ ; calendar partition T (e.g.,
  weeks); set of domains C.
Ensure: Cleaned and categorized dataset D with domain labels; time index t T .
  1:
D drop rows in D with missing dfs_eventdate or dfs_eventcode; impute/clip dfs_rating to [ 0 , r max ] .
  2:
For each event e i D , assign domain c i ϕ ( e i ) ; if ϕ unresolved, route to human-in-the-loop or rule-based fallback; discard events not in C.
  3:
Map timestamps to calendar bins: t i bin ( dfs _ eventdate ( e i ) , T ) .
  4:
Encode significance σ ( e i ) and countries l 1 ( e i ) , l 2 ( e i ) .
  5:
D { ( e i , c i , t i , r ( e i ) , σ ( e i ) , l 1 ( e i ) , l 2 ( e i ) ) } i = 1 N .
Algorithm 2 Temporal Aggregation and Interdependency Estimation
Require:  D ; domains C; time grid T ; correlation operator Corr ( · , · ) .
Ensure: Time series { f c ( t ) , R c ( t ) } for c C , t T ; interdependency matrix P = [ ρ c 1 , c 2 ] .
  1:
for  c C  do
  2:
      for  t T  do
  3:
            f c ( t ) e i D 1 ( ϕ ( e i ) = c d ( e i ) t )         ▹ Equation (3)
  4:
            R c ( t ) e i D r ( e i ) · 1 ( ϕ ( e i ) = c d ( e i ) t )      ▹ Equation (4)
  5:
      end for
  6:
      Optionally smooth { f c ( t ) } and { R c ( t ) } via moving average or HP filter.
  7:
end for
  8:
Construct P with entries ρ c 1 , c 2 Corr ( R c 1 ( · ) , R c 2 ( · ) )       ▹ Equation (5)
  9:
Optionally compute lagged dependence: ρ c 1 c 2 ( ) for lags { L , , L } .
Algorithm 3 can be understood as treating each domain of the supply chain as a “reservoir” of resilience that accumulates or depletes depending on inflows of supportive events (e.g., recovery, adaptation) and outflows caused by shocks or dependencies on other domains. Calibration ensures that the simulated stocks reproduce observed disruption patterns, while the resilience index λ c quantifies the capacity of each domain to offset shocks through recovery dynamics.
Algorithm 3 Stock–Flow Calibration and Resilience Computation
Require: Series { f c ( t ) , R c ( t ) } ; initial stocks S c ( t 0 ) ; discretization step Δ t ; regularization
   η 0 ; coupling sparsity set S .
Ensure: Calibrated α c , β c , Γ = { γ c , c } ; simulated S c ( t ) ; resilience λ c and Λ .
  1:
Initialize α c α 0 , β c β 0 , γ c , c 0 for c c .
  2:
for epoch = 1 to E do
  3:
      for  t = t 0 to t max Δ t  do
  4:
            Discretized dynamics:
S c ( t + Δ t ) S c ( t ) + Δ t α c f c ( t ) + c c γ c , c S c ( t ) β c S c ( t )
  5:
      end for
  6:
      Objective:  L c , t ω 1 R ^ c ( t ) ω 1 S c ( t ) 2 + η Γ 1   ▹ match stocks to intensity proxy; encourage sparse couplings
  7:
      Update parameters ( α c , β c , Γ ) by gradient or quasi-Newton; project Γ onto sparsity pattern S if specified.
  8:
end for
  9:
Resilience: compute λ c β c α c + c c γ c , c and Λ 1 | C | c C λ c   ▹ Equations (8) and (9)
Algorithm 4 can be interpreted as constructing a bipartite network linking countries and supply chain domains, where edges represent observed disruption events. The procedure highlights systemic hubs (countries connected to many domains) and chokepoints (countries whose disruptions disproportionately affect flows). This network perspective makes it easier to identify leverage points for resilience interventions.
Algorithm 4 Geo-Relational Network Construction and Centrality
Require:  D ; set of countries U; domains C; threshold τ for edge creation.
Ensure: Bipartite graph G = ( U , C , E ) ; centrality scores.
  1:
Initialize E .
  2:
for  u U  do
  3:
      for  c C  do
  4:
             w ( u , c ) e i D 1 l 1 ( e i ) = u l 2 ( e i ) = u · 1 ϕ ( e i ) = c
  5:
            if  w ( u , c ) τ  then
  6:
                  add edge ( u , c ) with weight w ( u , c ) to E
  7:
           end if
  8:
      end for
  9:
end for
10:
Compute degree, weighted degree, betweenness, and eigenvector centralities on G.
11:
Identify hubs (top-k by centrality) and chokepoints (high betweenness with low degree).

3.9. Implementation Notes and Complexity

Algorithm 1 is linear in N; Algorithm 2 is O ( | C | | T | + | C | 2 | T | ) due to correlation estimation; Algorithm 3 scales as O ( E | C | 2 | T | ) per epoch for dense Γ (sparser Γ reduces to O ( E Γ 0 | T | ) ); Algorithm 4 is O ( N + | U | | C | ) with sparse incidence. In practice, we (i) parallelize temporal aggregation by c, (ii) regularize Γ with 1 penalties and structural priors suggested by P , and (iii) validate λ c and Λ via rolling-origin evaluation on exogenous shock windows (e.g., shipping crises, fuel price spikes). The resulting pipeline is modular: each algorithm can be executed independently and its outputs cached, facilitating ablation studies and sensitivity analyses on parameters ( α , β , Γ ) and the calendar partition T .

4. Experimentation

This section describes the experimental setup, dataset, preprocessing, and descriptive statistics used to evaluate the proposed methodology. The raw corpus comprised approximately 1.8 million news articles collected autonomously from global portals (BBC, CNN, Washington Post, New York Times, Daily Mail UK, NDTV India, 9 News Australia, Reuters, among others), covering the period from October 2023 to September 2025. Large language model (GPT)–assisted classification was employed to annotate each record with event code, event location(s), country(ies), and event significance. Our most recent publications have clearly shown GPT-based classification design along with comprehensive evaluations [34,35,36,37]. According to [34,35,36,37], the accuracies and F1-scores of GPT-based classifications employed in this study could reach up to 0.925. Filtering to retain only those events related to green supply chains produced a final analytical dataset of 67,434 coded events. Event codes were grouped into five systemic domains (Operations, Manufacturing, Agri-Food, Energy/Environment, and Social/Labor) for systems analysis. To ensure research reproducibility and facilitate open validation within the scientific community, the dataset comprising 67,434 news-derived events generated for this study has been made publicly accessible at https://github.com/DrSufi/EventSystemGSC (accessed on 13 September 2025).

4.1. Temporal Coverage and General Properties

All event records contain timestamps, enabling temporal aggregation. The final dataset spans from 26 September 2023 to 9 September 2025. The data include 23 distinct event codes mapped into 5 systemic domains. Ratings (dfs_rating) were available for 66,357 records, with 1077 missing. Table 3 summarizes the dataset.

4.2. Event Code Distribution

The dataset contains 23 event codes relevant to green supply chains, ranging from supply chain logistics to environmental and labor disruptions. Table 4 shows their empirical frequencies, with the largest share belonging to Energy and Resource News and Environmental News.

4.3. Domain Distribution

Mapping event codes into domains reveals that Energy/Environment dominates (44,102 events), followed by Operations (10,714). The least represented is Agri-Food (2861). Table 5 summarizes the distribution.

4.4. Event Significance

Raw labels for event significance exhibit heterogeneity (Local, Nation, National, International, etc.). Table 6 lists the most frequent labels. For analysis, harmonization into categories (Local/National/International/Global) was considered as a robustness step.

4.5. Ratings

Descriptive statistics of the rating field (dfs_rating) are provided in Table 7. The mean event rating is 275.06, with a maximum of 1236.6 and strong right-skewness (95th percentile = 747.84).

4.6. Geographic Coverage (Normalized)

Country values in the raw data contained significant heterogeneity, with multiple variants (e.g., United States, US, U.S., USA). To ensure consistency, a normalization step was applied, grouping these variants into a unified representation. Similar harmonization was performed for the United Kingdom (UK, U.K., Britain), United Arab Emirates (UAE, Emirates), and others. After normalization, the top 10 countries by event frequency are shown in Table 8. The results confirm that the United States dominates the dataset with over 20,000 supply chain–related events, followed by the United Kingdom, Australia, and India.
By normalizing heterogeneous country names, the dataset more accurately reflects the true distribution of disruptions across nations. This preprocessing step is crucial for geo-relational analysis: without it, systemic hubs such as the United States and the United Kingdom would appear fragmented into multiple categories. With harmonization, the dataset becomes both more interpretable and more reliable for subsequent resilience and network modeling.
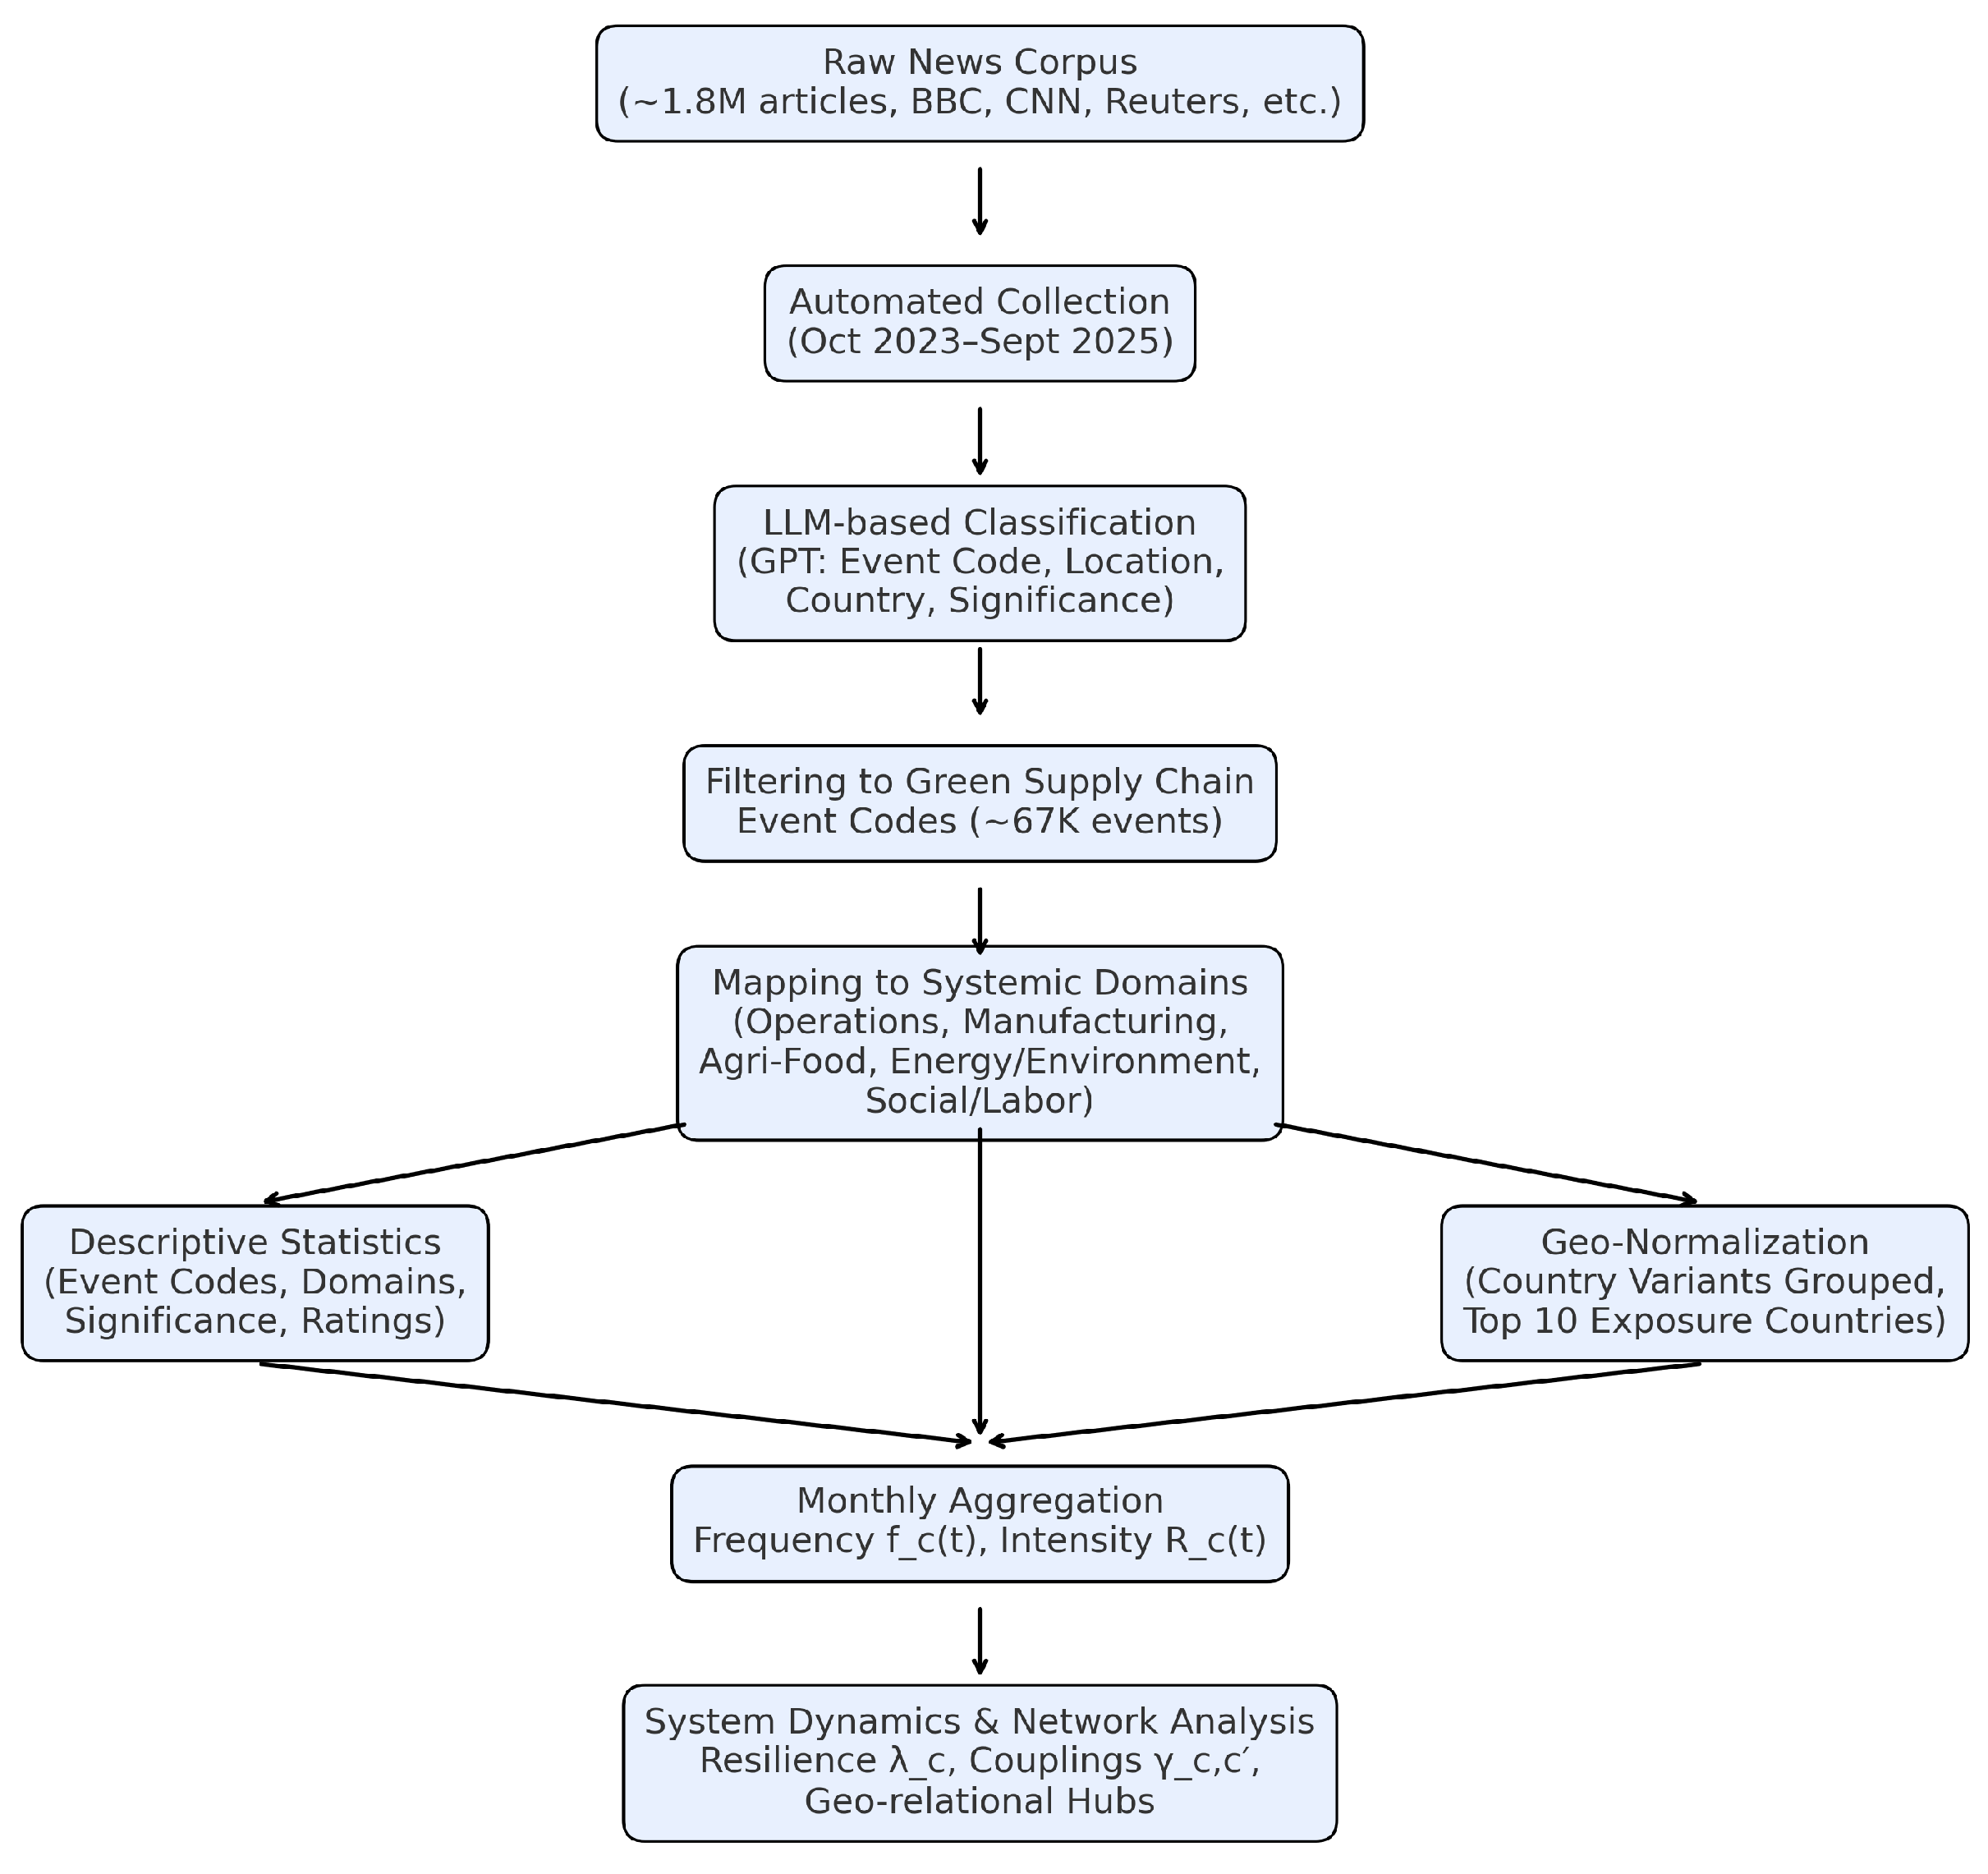
The Figure 4 summarizes the experimentation pipeline from ingestion to analysis. A large raw news corpus (1.8 M items, October 2023–September 2025) is first collected and classified via LLMs into event code, location/country, and significance. Green supply chain–relevant events (67 K) are then filtered and mapped to five systemic domains (Operations, Manufacturing, Agri-Food, Energy/Environment, Social/Labor). Two parallel preparation steps follow: (i) descriptive statistics (event codes, domains, significance, ratings) and (ii) geo-normalization that consolidates country name variants (e.g., US/U.S./USA → United States). The prepared data are monthly-aggregated to form frequency f c ( t ) and rating-weighted intensity R c ( t ) series, which feed the final analyses: system-dynamics and network modeling to estimate resilience λ c , inter-domain couplings γ c , c , and geo-relational hubs.

5. Results

This section reports the empirical findings derived from the standardized and harmonized dataset of 67,434 green supply chain–related news events. Country names have been normalized (e.g., United States, US, U.S., USAUnited States) to avoid fragmentation of geographic results. The analysis is organized into three perspectives: temporal dynamics, resilience estimation, and geo-relational exposure.

5.1. Temporal Dynamics of Disruptions

Events were aggregated by systemic domain (Operations, Manufacturing, Agri-Food, Energy/Environment, and Social/Labor) into monthly frequency f c ( t ) and rating-weighted intensity R c ( t ) series. This enabled tracking both the volume and severity of disruptions over time. Table 9 shows an illustrative sample of Agri-Food domain values across ten consecutive months. The results demonstrate pronounced variability, with February 2024 exhibiting a large spike corresponding to major food supply shocks.
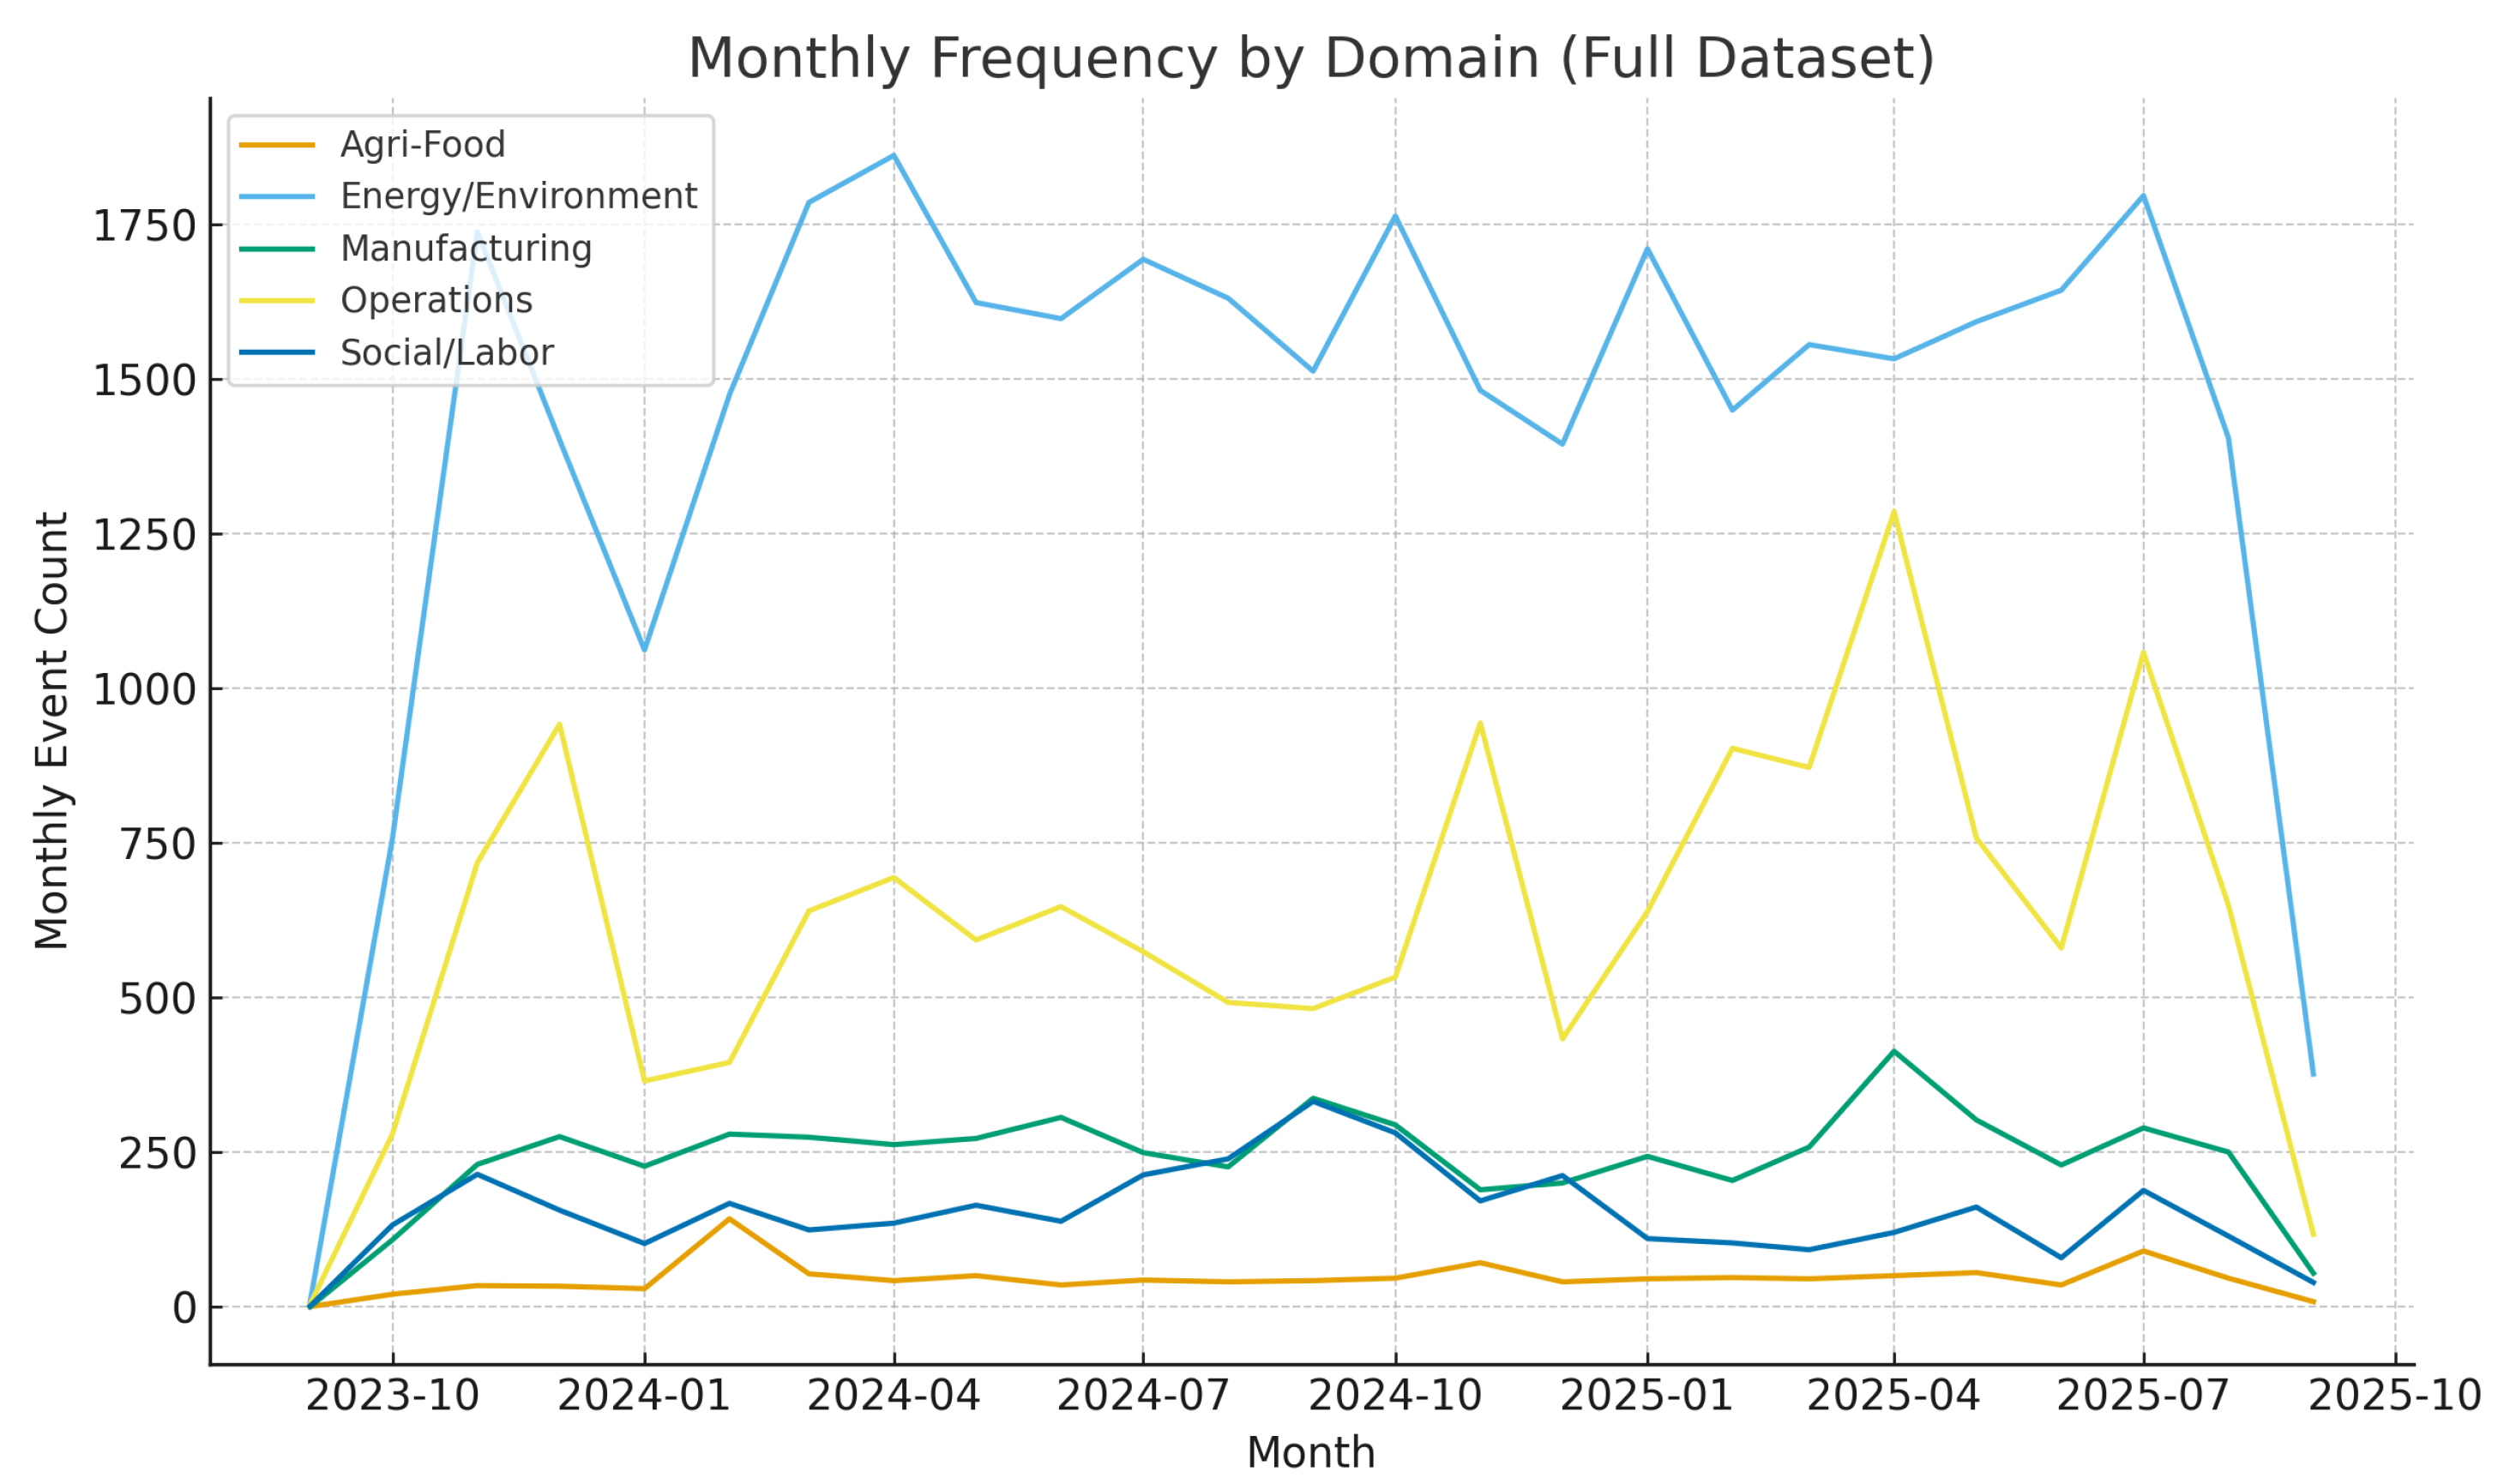
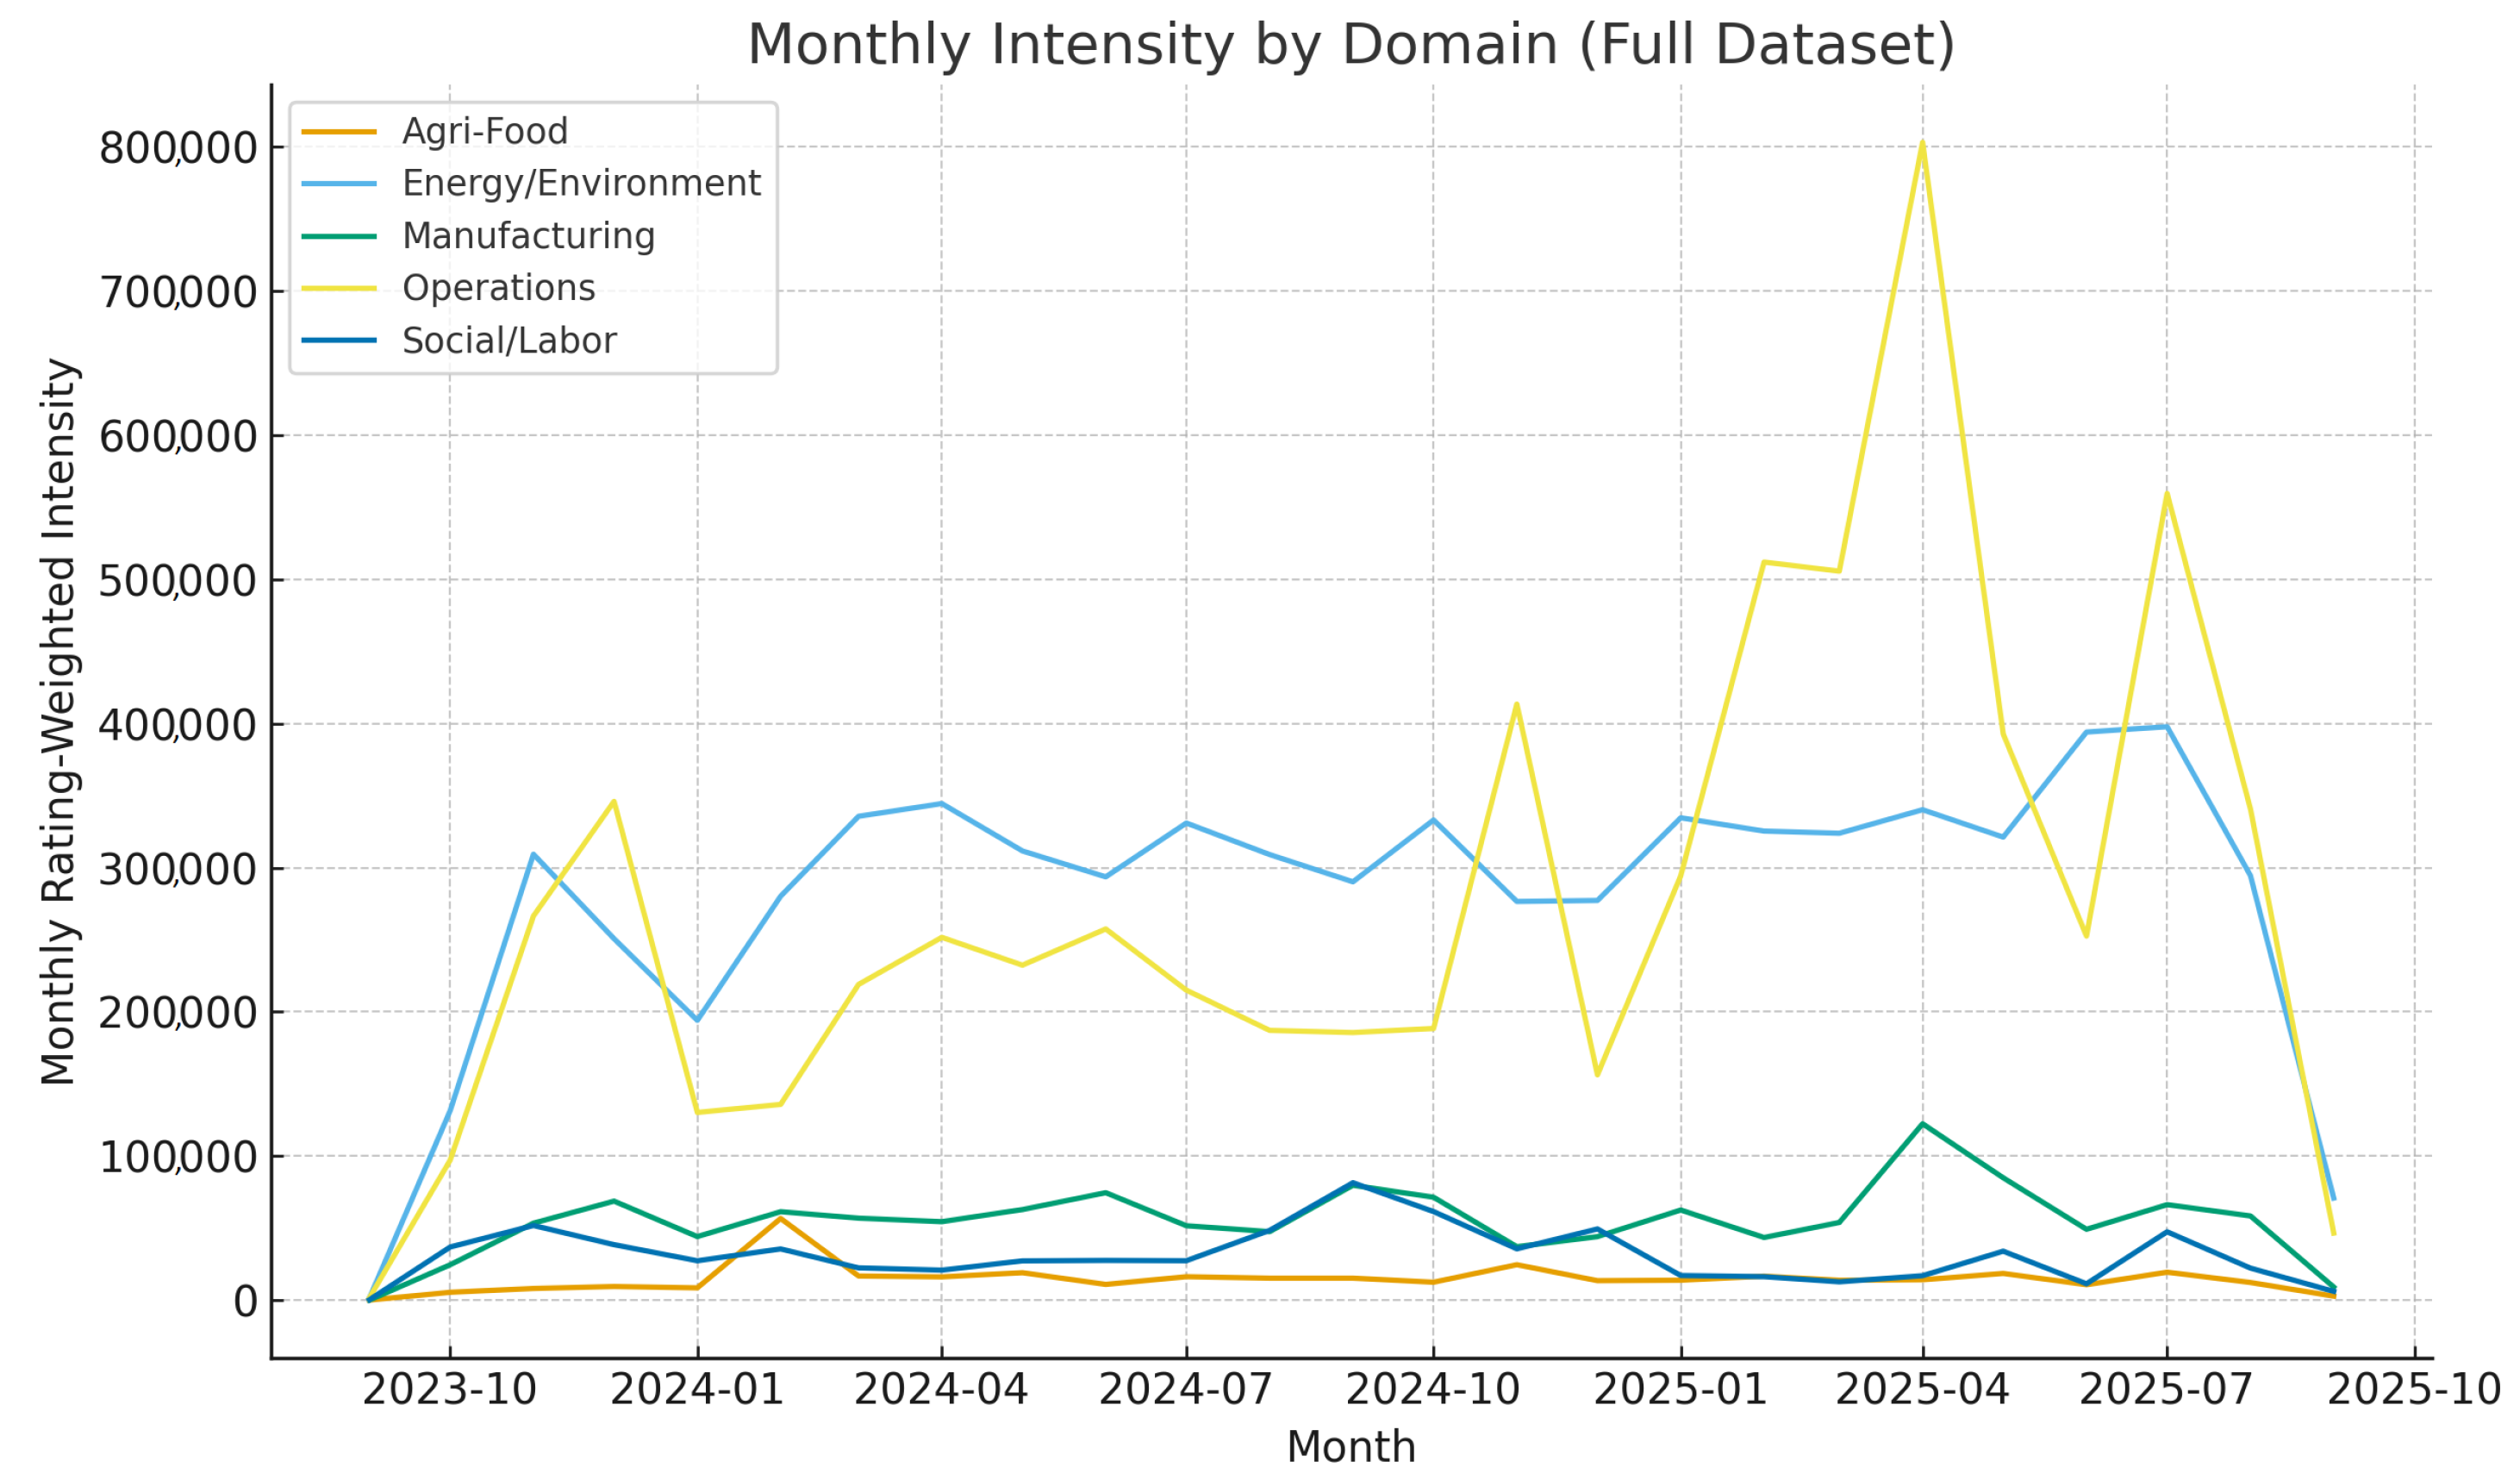
Figure 5 presents the monthly frequency of disruptions across domains. Operations and Energy/Environment dominate, reflecting their systemic vulnerability. Figure 6 shows the intensity dynamics, where Energy/Environment demonstrates the most volatile and severe shocks, particularly in relation to climate change and energy crises.

5.2. Resilience Analysis

Dynamic resilience indices λ c were estimated using the system-dynamics formulation. Table 10 presents the coefficients and indices. Agri-Food demonstrates the highest resilience ( λ c = 1.43 ), indicating strong recovery capacity despite periodic spikes. Social/Labor follows with λ c = 0.77 , while Energy/Environment ( λ c = 0.05 ) and Operations ( λ c = 0.00 ) are the most fragile, underscoring their systemic vulnerability. Figure 7 compares resilience across domains.
The interpretation of the resilience index λ c requires careful attention. A positive value indicates that a domain exhibits recovery potential relative to the frequency and severity of disruptions, while a negative value suggests systemic fragility. A score of zero, as observed for the Operations domain, reflects a neutral equilibrium where the cumulative disruptive impacts are neither offset nor buffered by recovery dynamics. In practical terms, this means that operations (encompassing logistics and trade functions) absorb shocks without demonstrating evidence of adaptive resilience. Rather than indicating stability, a zero score highlights the absence of measurable recovery capacity, underscoring the vulnerability of this domain to cascading disruptions.

5.3. Geo-Relational Exposure

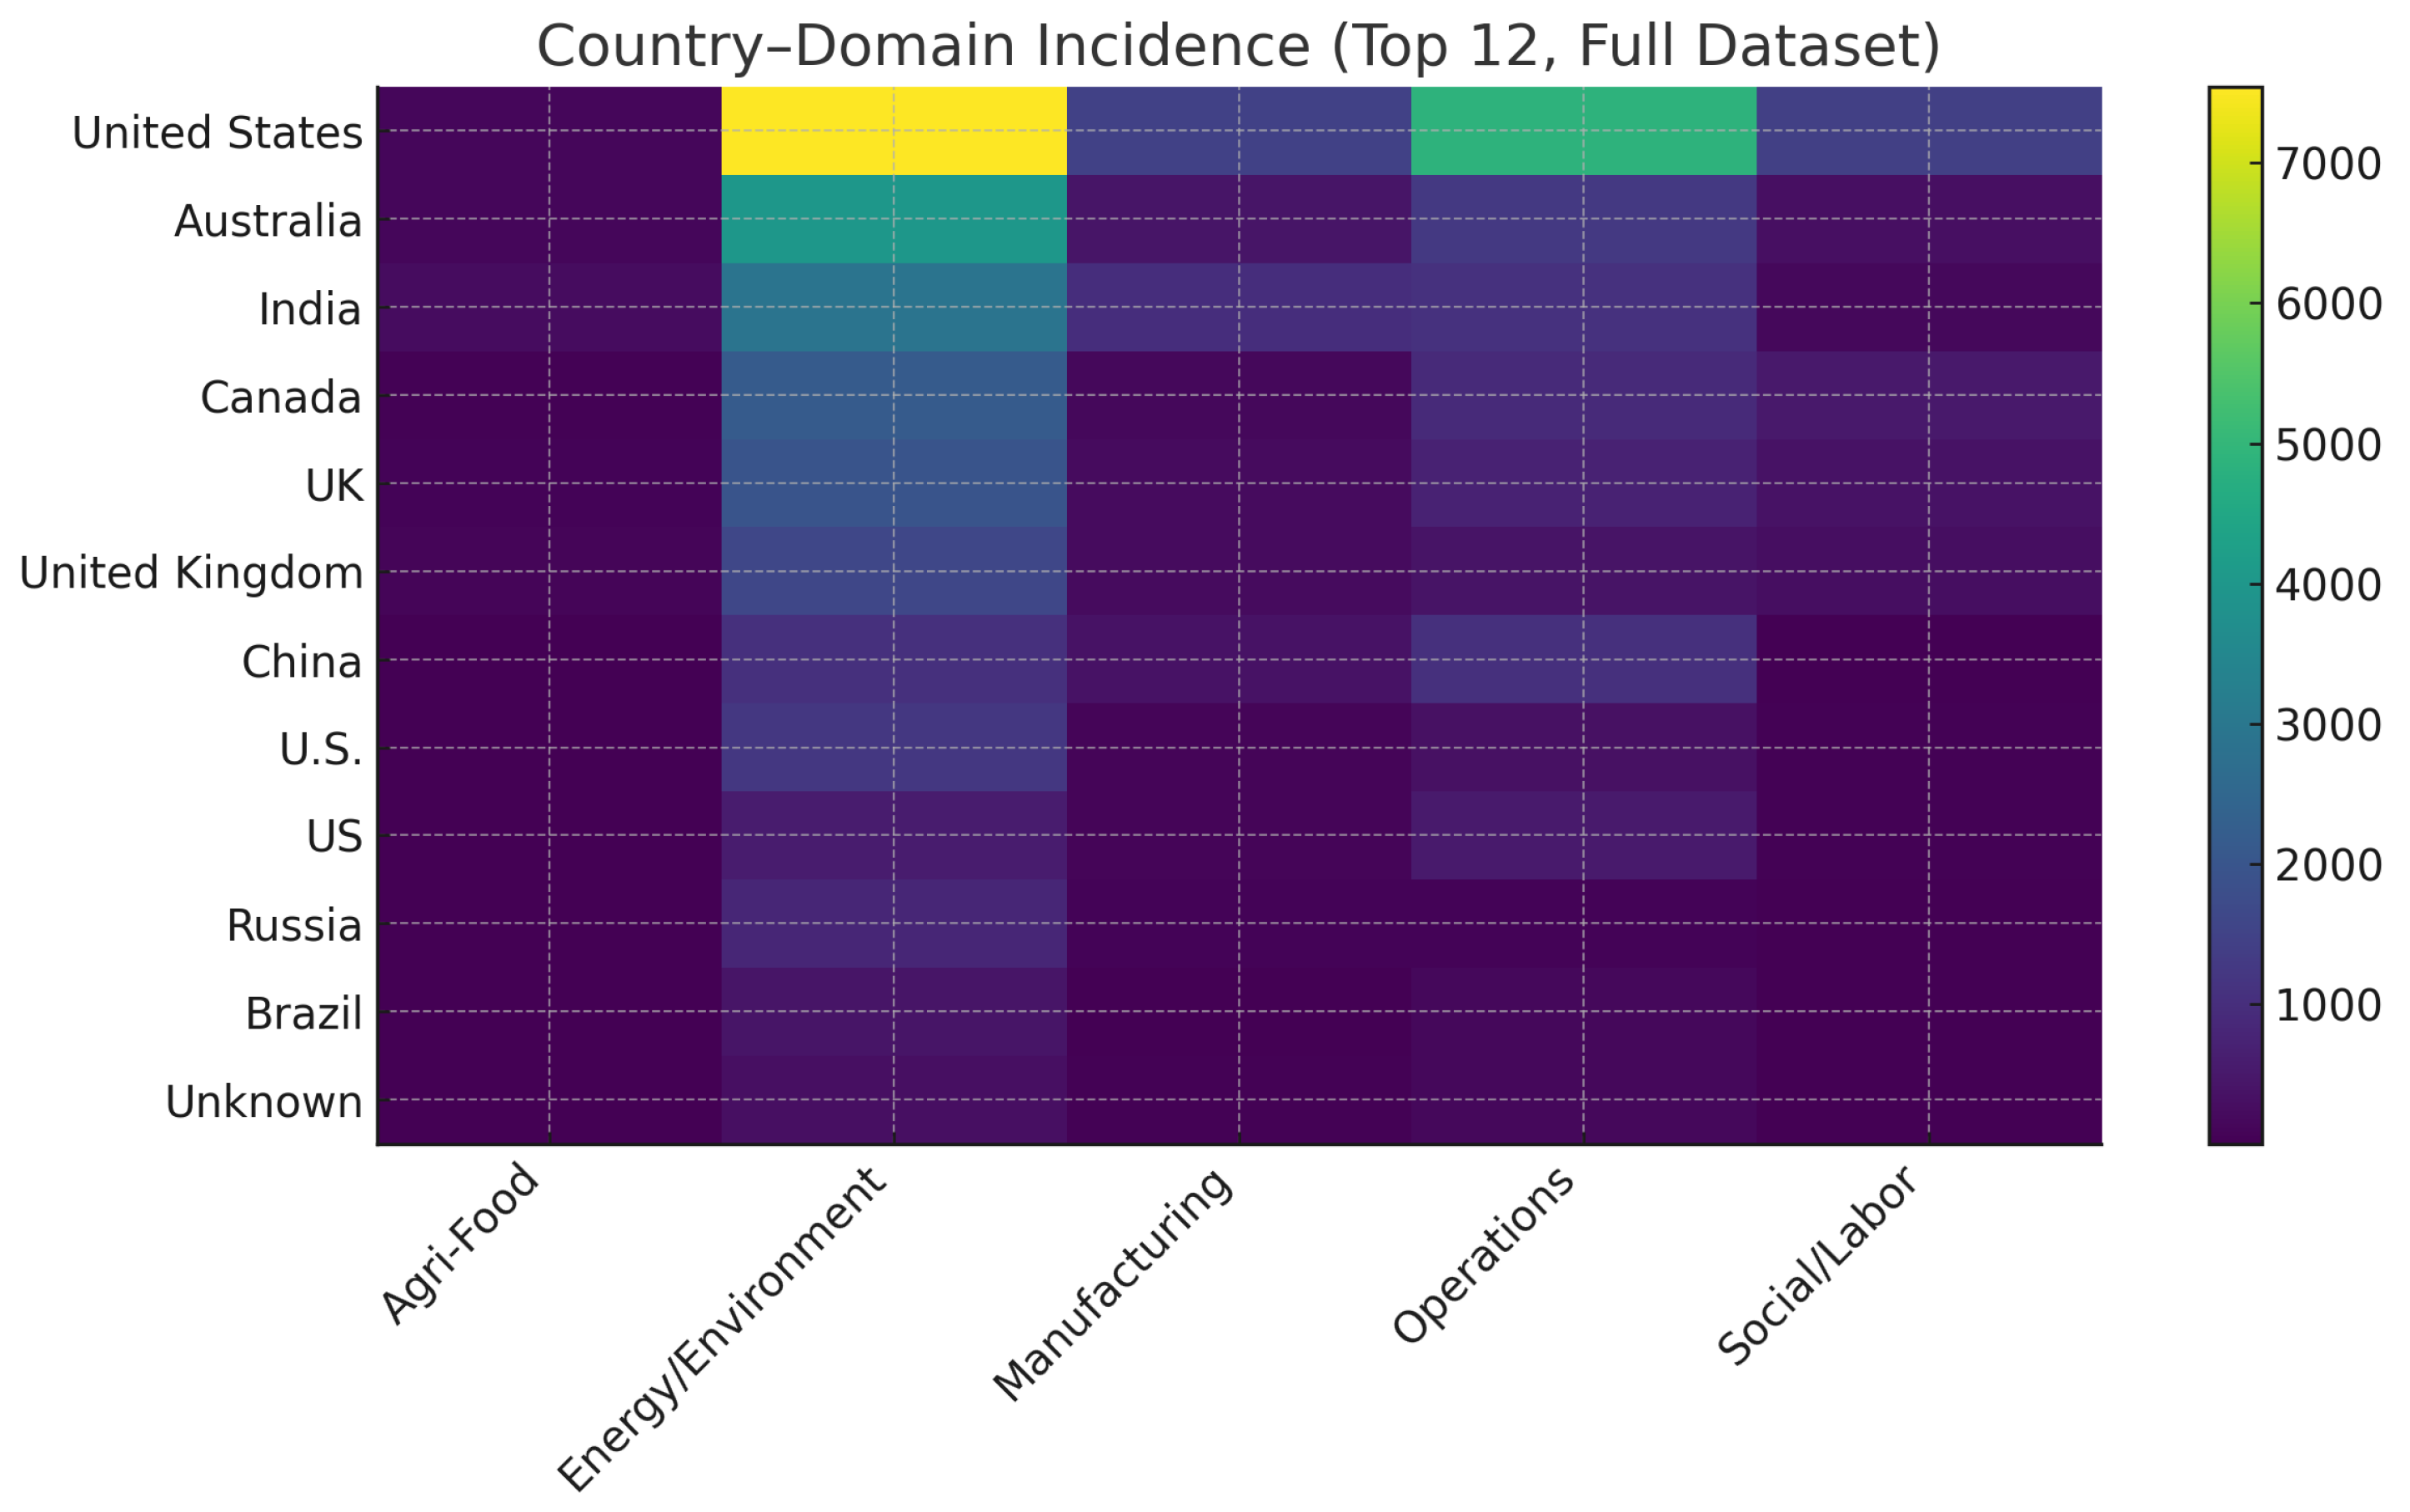
Geo-relational analysis shows that disruptions are unevenly distributed across countries. Following normalization of country names, systemic hubs such as the United States, United Kingdom, Australia, India, China, and Canada emerge as consistently high-frequency nodes. Figure 8 illustrates domain-specific incidence for the top 12 countries. The United States and Australia show heavy exposure in Operations and Energy/Environment, whereas India and China display more balanced exposure with significant Agri-Food contributions. These patterns confirm the existence of geographically concentrated vulnerabilities and highlight opportunities for targeted resilience strategies.

5.4. Implications

Three core findings emerge. First, energy and environmental shocks remain the dominant upstream drivers of systemic disruption, strongly coupled with operations and manufacturing. Second, resilience analysis reveals critical weaknesses in Operations and Energy/Environment, which represent systemic bottlenecks requiring prioritized resilience-building. Third, geo-relational analysis shows that a small set of countries disproportionately concentrate global disruptions, implying that interventions at these hubs could significantly strengthen worldwide supply chain resilience.

5.5. System-of-Systems Network Analysis

The complexity of global green supply chain disruptions can be better understood through a system-of-systems perspective, where countries act as geo-political exposure hubs and systemic domains (Operations, Manufacturing, Agri-Food, Energy/Environment, Social/Labor) represent the structural layers of global supply chains. Disruptions serve as the interlinkages that bind these layers, transmitting shocks across multiple domains and national contexts. This perspective is particularly important because it highlights how vulnerabilities are not isolated but are shaped by the interplay between geographic exposure and functional interdependence.
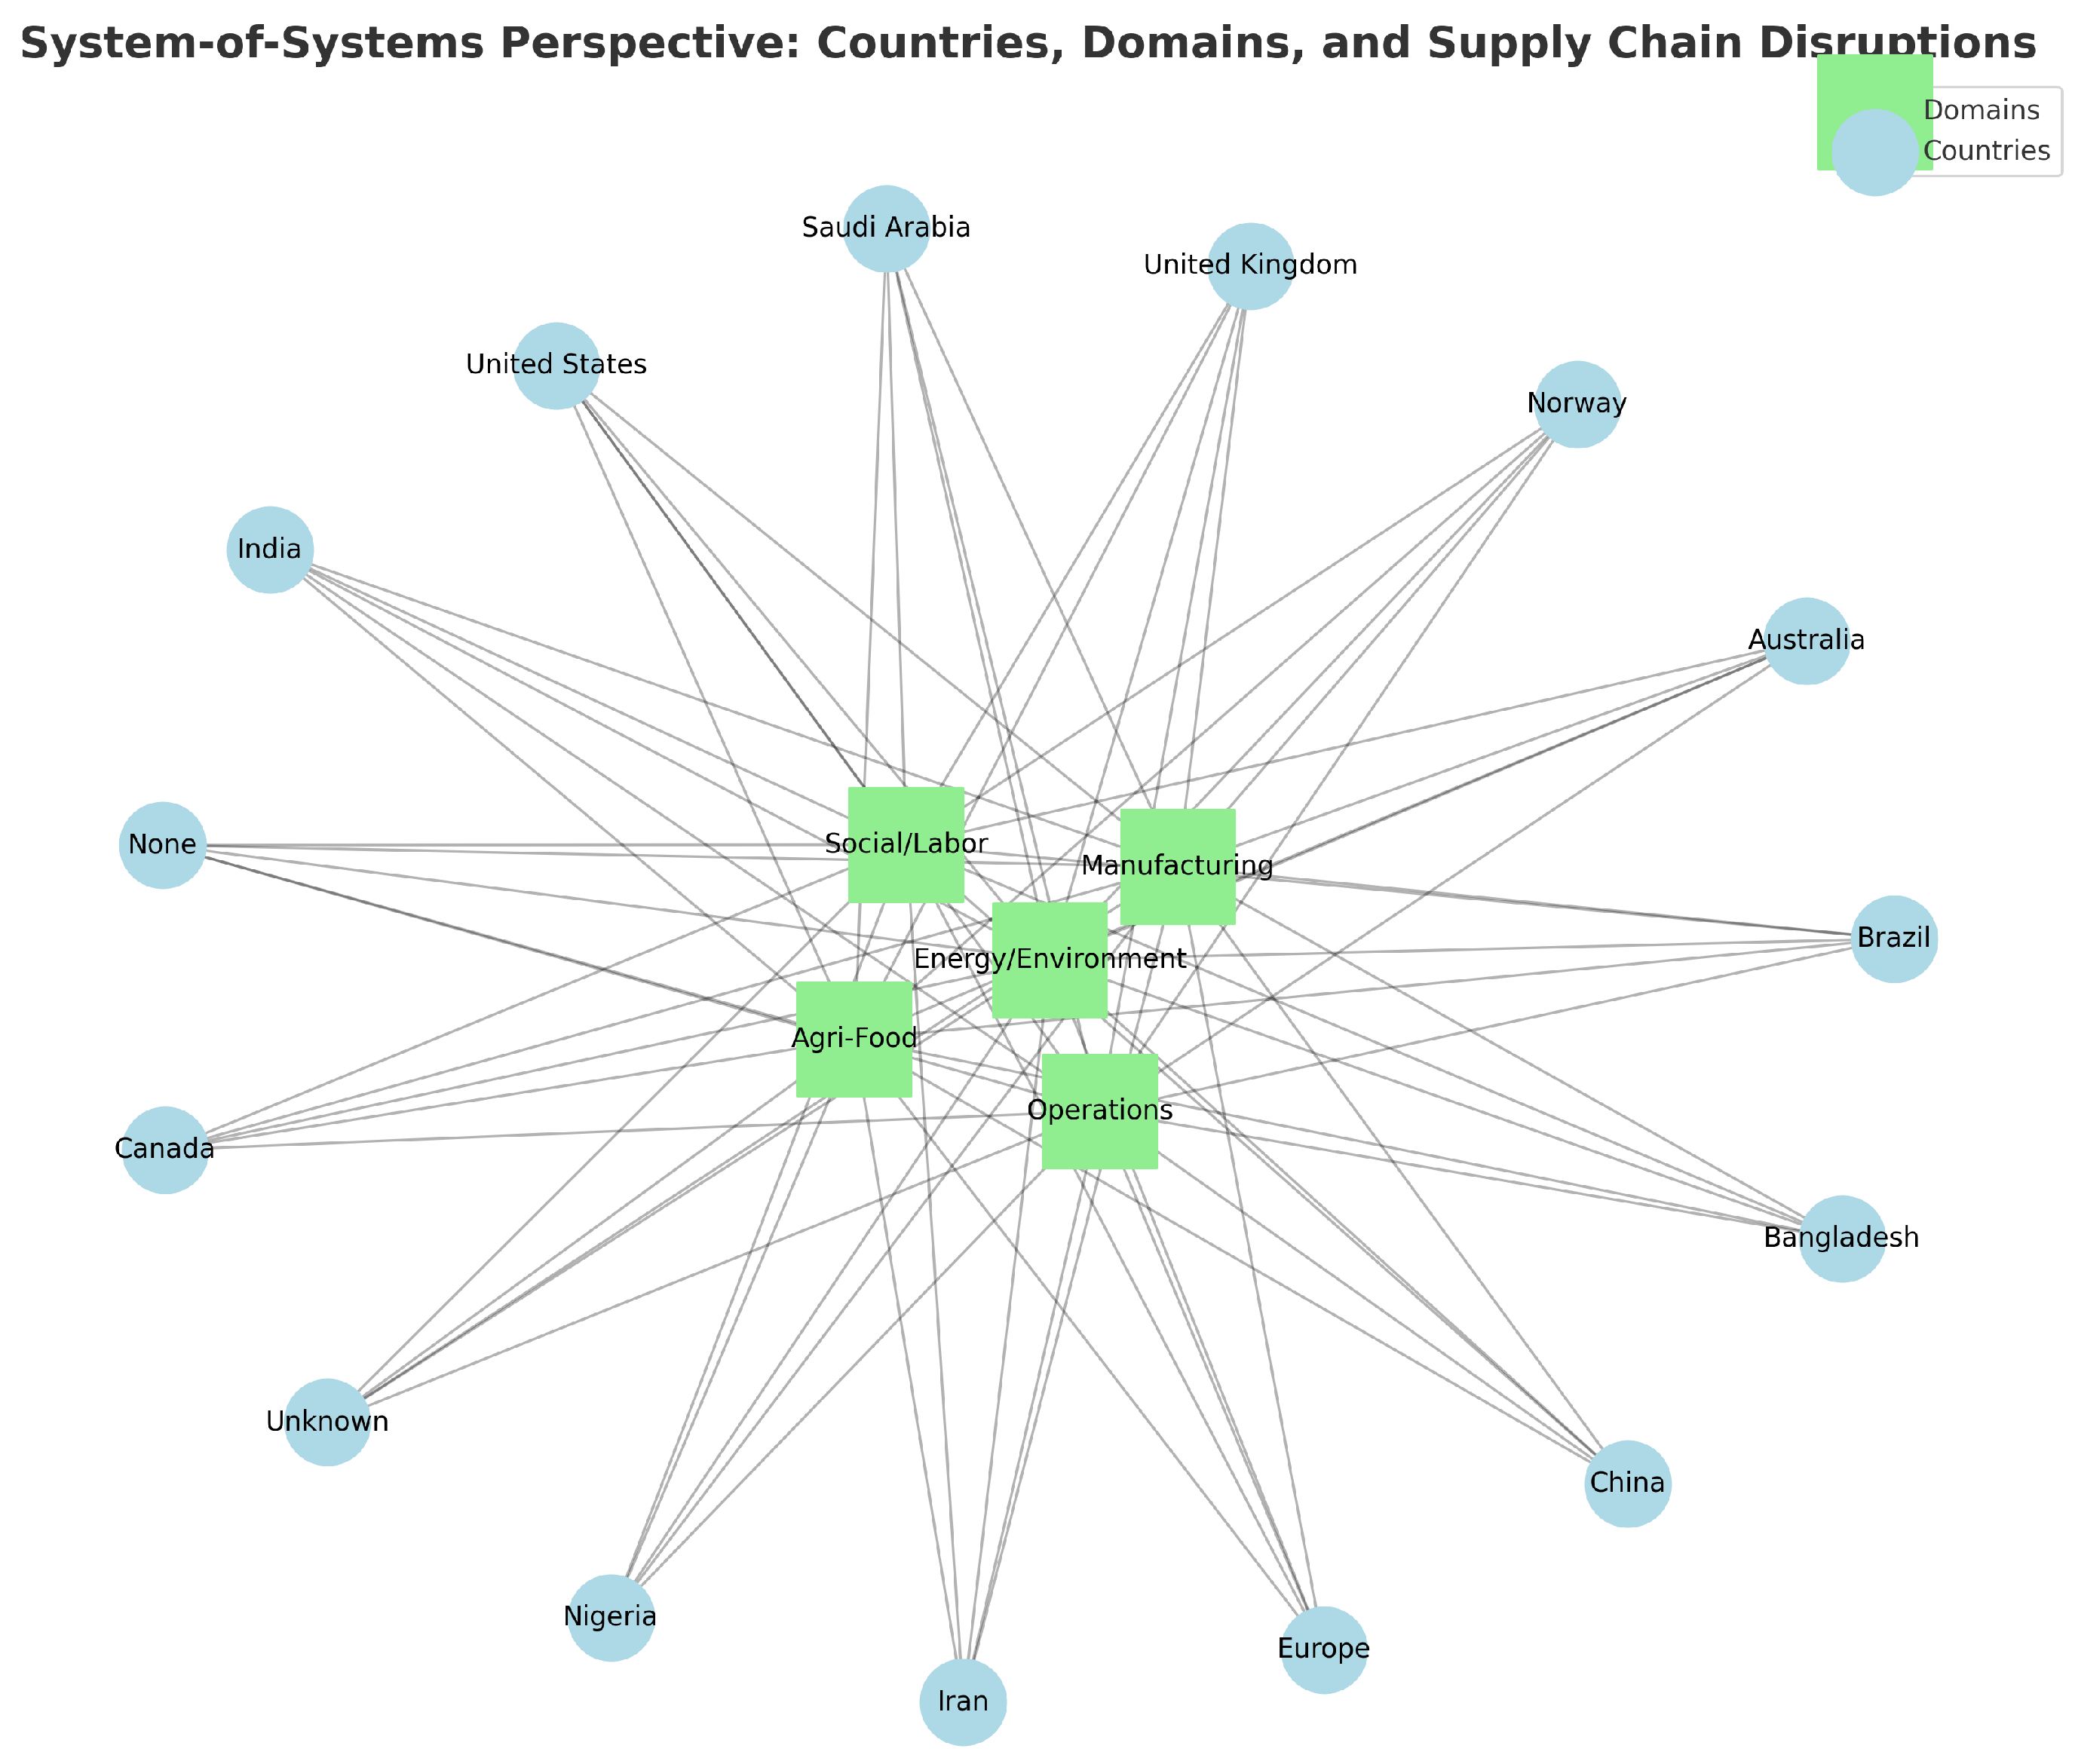
Figure 9 illustrates the overall system-of-systems network, where green squares denote systemic domains and blue circles denote countries. The figure demonstrates how disruptions are distributed across multiple layers of the supply chain system. Countries such as the United States, the United Kingdom, Australia, India, and China emerge as central nodes, connected to nearly all domains. This centrality indicates that shocks in these nations are more likely to cascade globally due to their multi-domain exposure.

5.6. Top Five Countries and Their Dominant Dependencies

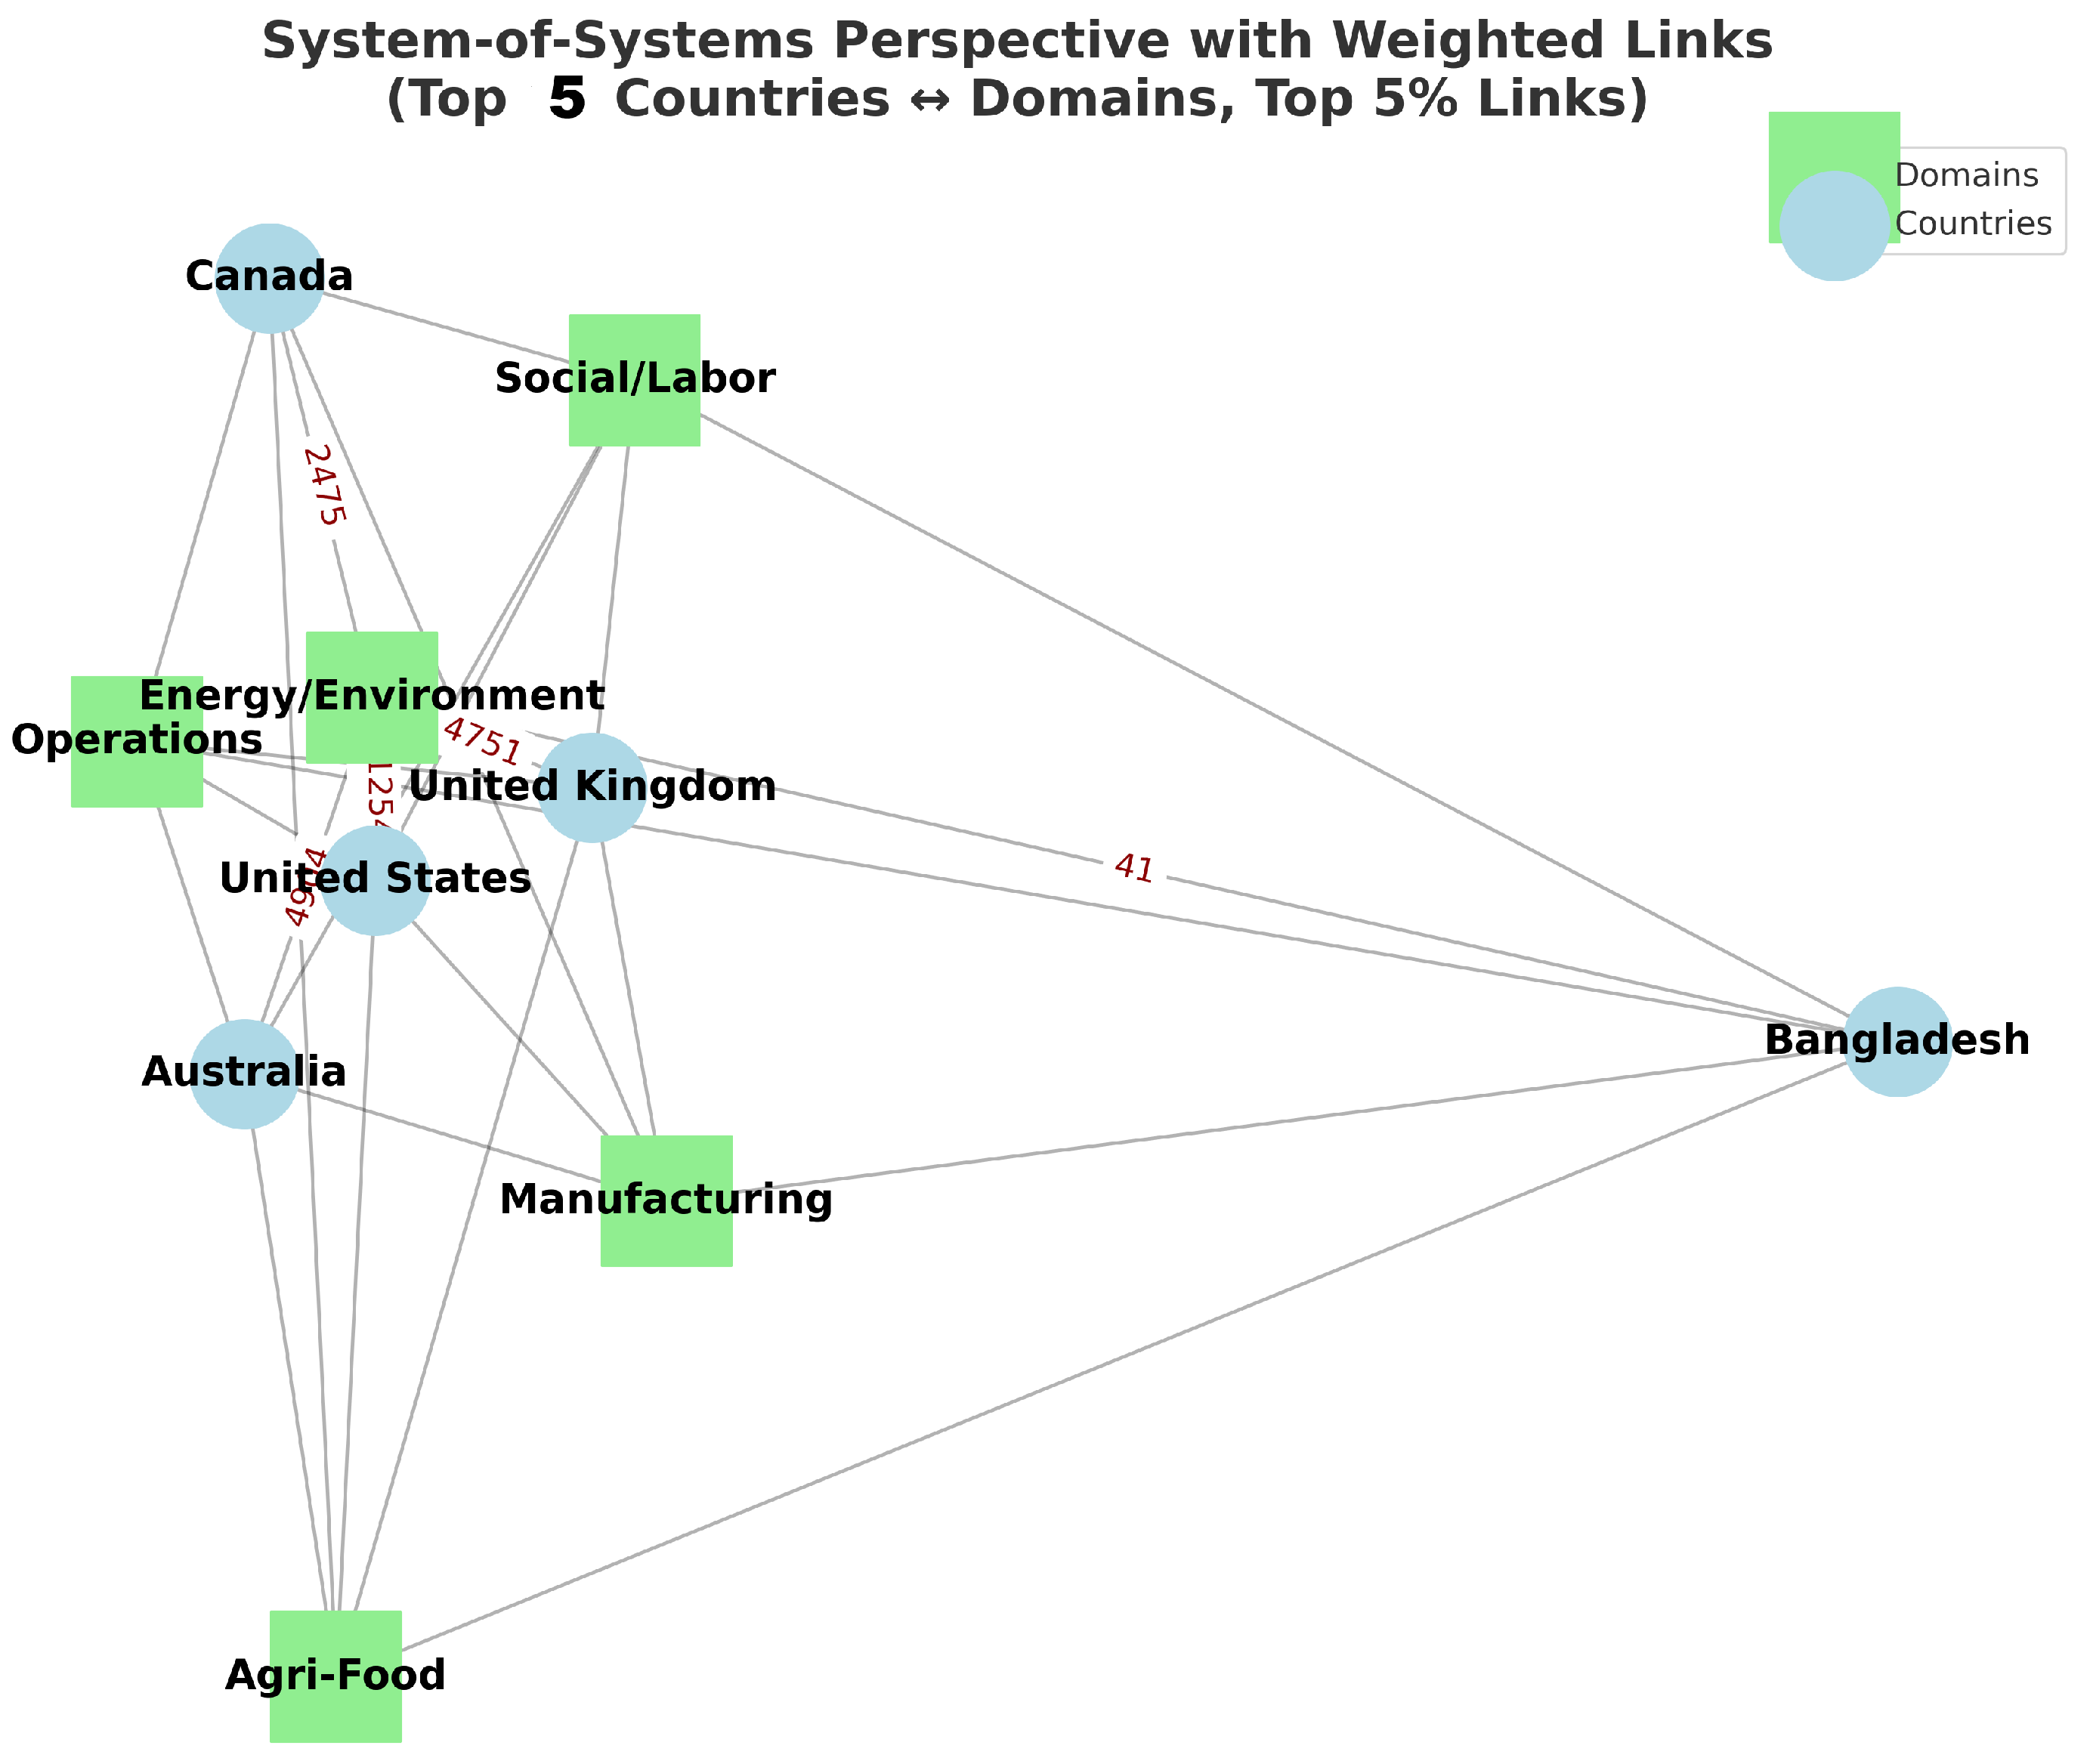
To further sharpen the analysis, the network was filtered to highlight only the top 5 countries with the strongest systemic connections and the top 5% strongest links per country. Figure 10 shows these high-intensity interdependencies. The results indicate that the United States, the United Kingdom, Australia, Canada, and Bangladesh form the most connected exposure hubs. Their strongest connections are with the Energy/Environment and Operations domains, underscoring how energy crises, climate disruptions, and operational shocks are globally mediated through a small set of key national hubs. This concentration of systemic importance implies that strengthening resilience in these few hubs could produce disproportionate benefits for global supply chain stability.

5.7. Saudi Arabia in the System-of-Systems Context

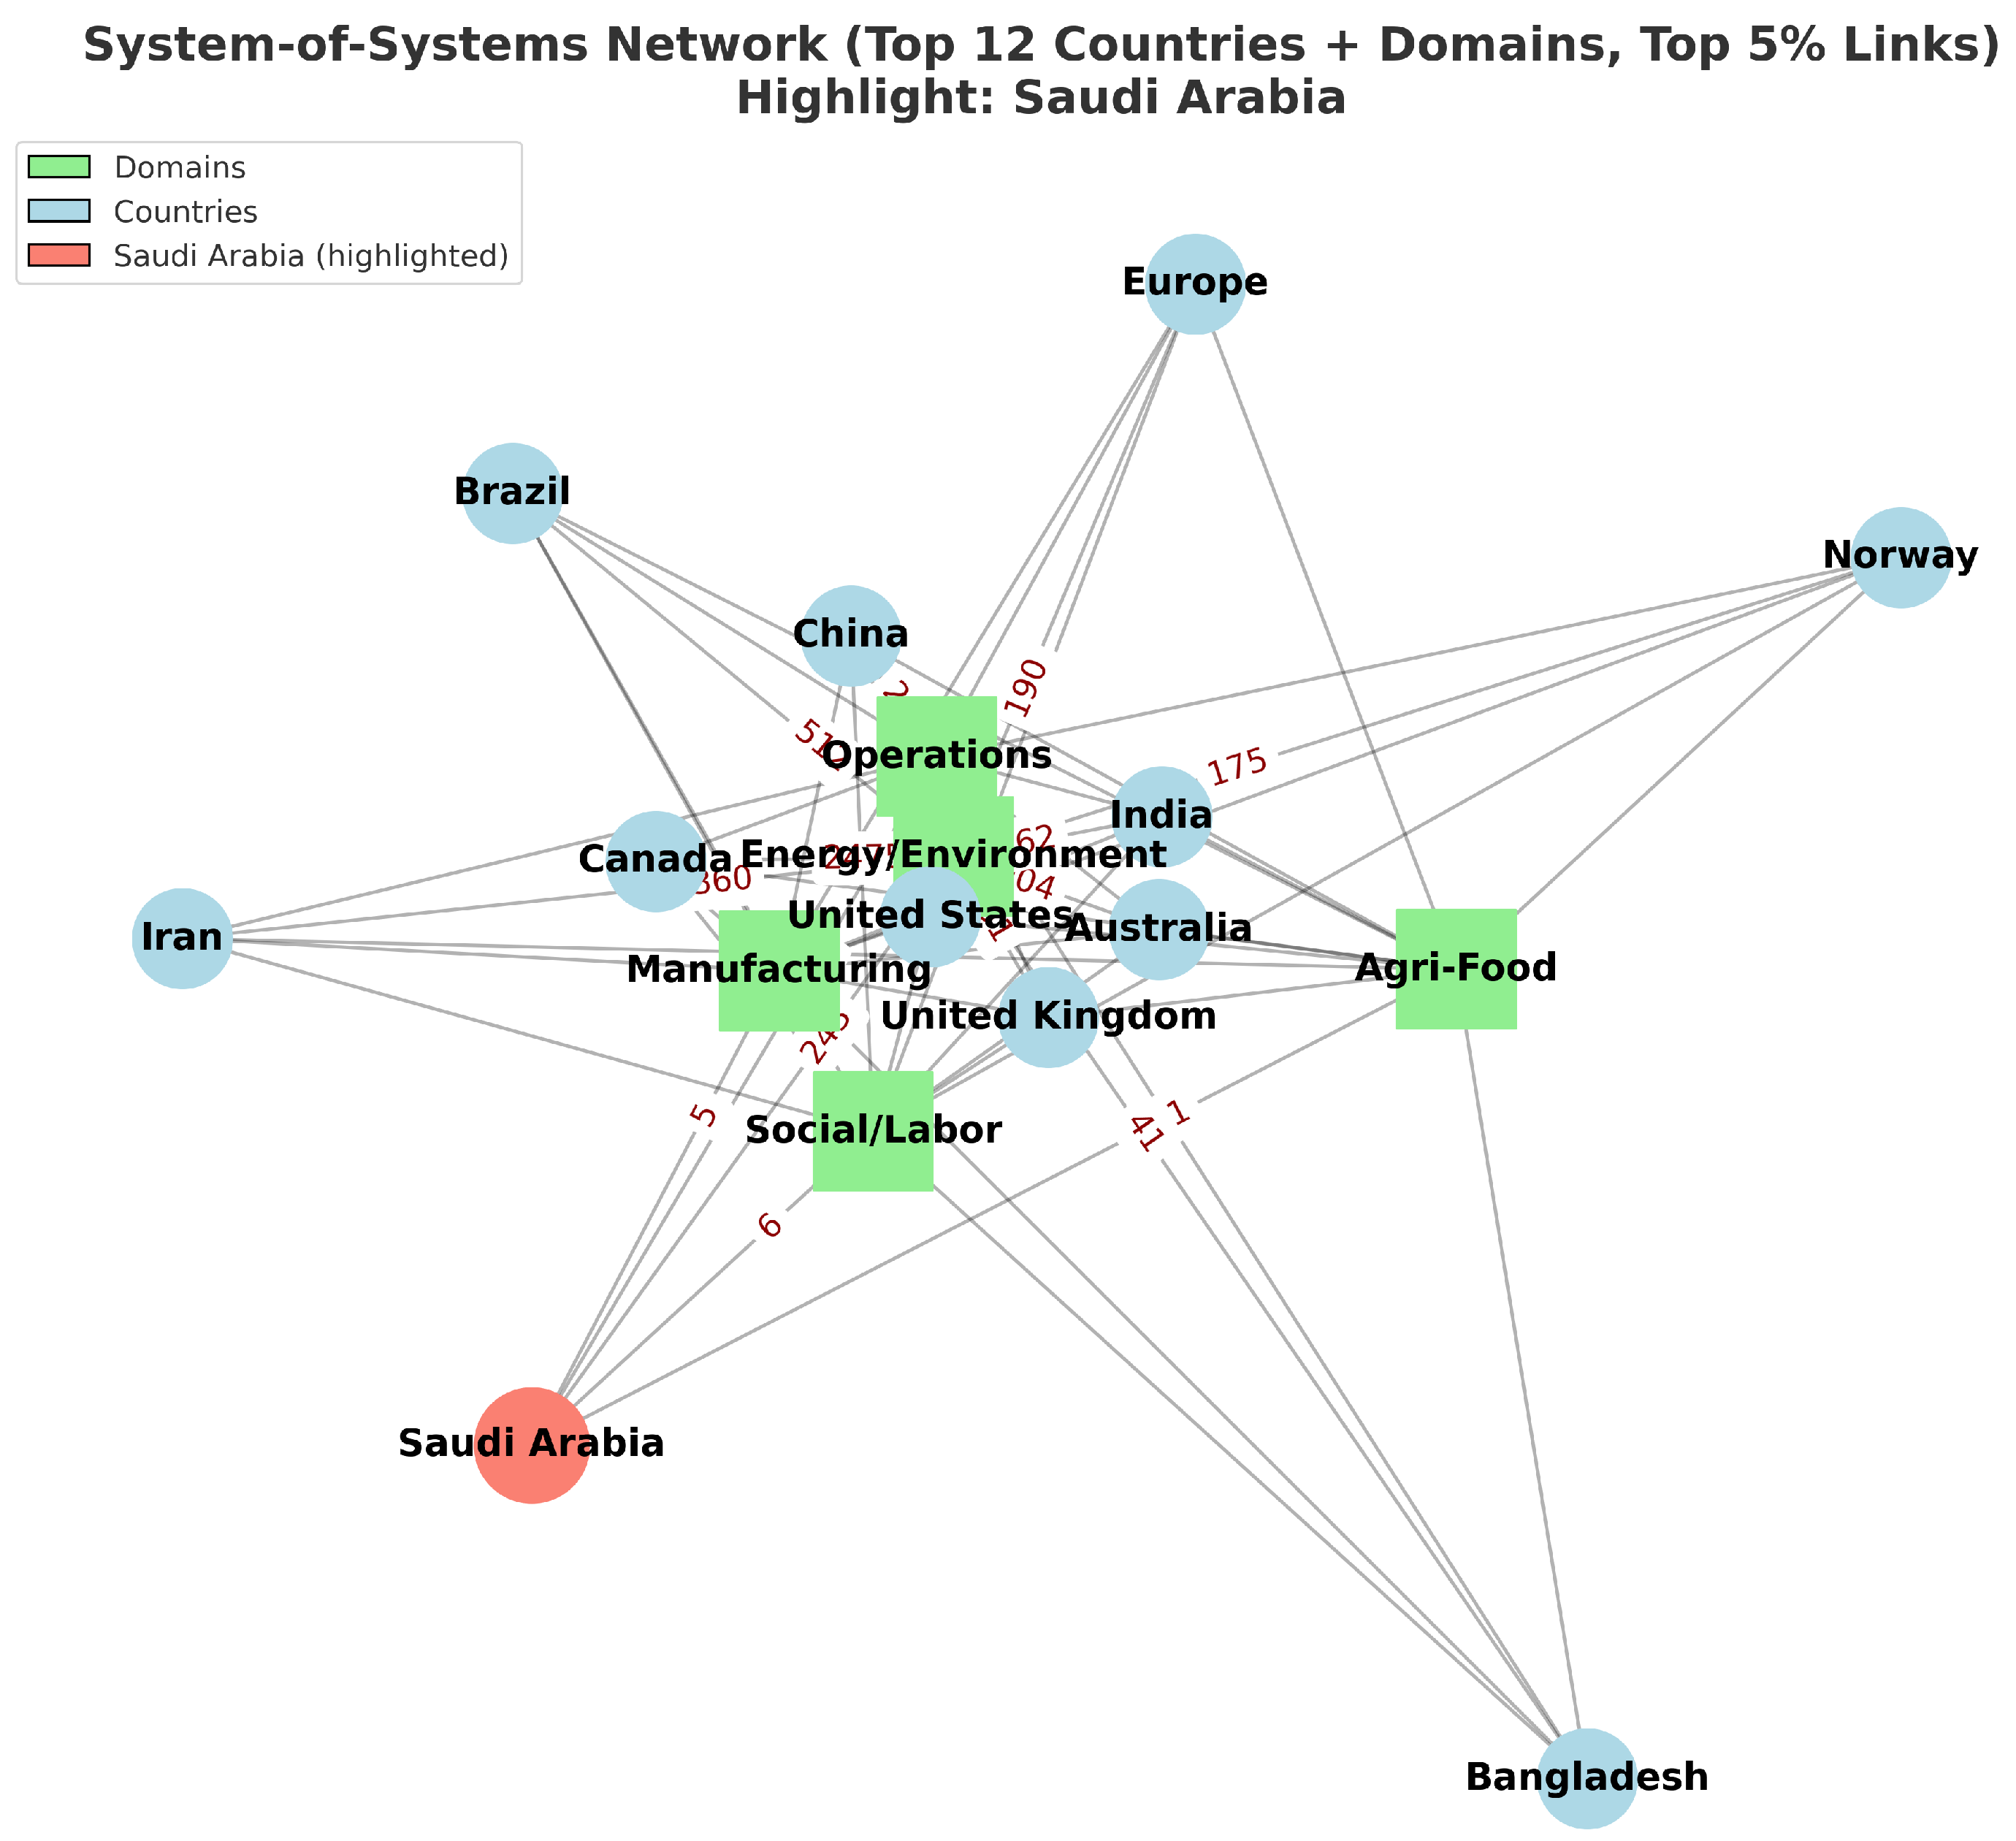
While the global hubs dominate systemic connectivity, it is equally important to highlight country-specific perspectives. Figure 11 shows the network for the top 12 countries with systemic importance, with a specific focus on Saudi Arabia, highlighted in red. The figure reveals that Saudi Arabia, though less central compared to the United States or United Kingdom, exhibits strong dependencies on the Energy/Environment and Operations domains. Notably, the link values indicate the empirical strength of these connections: for example, Saudi Arabia’s ties to the Energy/Environment domain register a frequency of over 300 events, while its link to Operations is comparatively weaker, with fewer than 50 events. These quantitative differences highlight that Saudi Arabia’s systemic importance lies in the magnitude of its energy-related disruptions, where concentrated shocks can ripple globally.

5.8. Significance

Together, these results illustrate that systemic vulnerabilities in the global green supply chain are highly unevenly distributed. A small set of countries (United States, United Kingdom, Australia, Canada, and Bangladesh) act as multi-domain hubs, while others, such as Saudi Arabia, exhibit concentrated single-domain criticalities. From a resilience perspective, this implies that both breadth of exposure (multi-domain hubs) and depth of specialization (single-domain critical nodes with high link values, such as Saudi Arabia in Energy/Environment) must be addressed to mitigate cascading disruptions in the global system.

6. Discussion

The findings of this study contribute to the growing body of knowledge on green supply chain management (GSCM) by demonstrating how large-scale, event-coded news data can be operationalized through a system-of-systems framework to capture disruption dynamics across multiple domains and geographies. By analyzing 67,434 green supply chain–related events extracted from a corpus of 1.8 million global news articles, this research moves beyond the limitations of sector-specific or case-based analyses that dominate existing GSCM scholarship. The results reveal that systemic vulnerabilities are unevenly distributed, with a small number of countries acting as global hubs where disruptions propagate disproportionately across operations, manufacturing, energy, and agri-food systems. Furthermore, resilience indices indicate that, while certain domains, such as agri-food demonstrate adaptive capacity, others, such as energy and operations, remain fragile, underscoring the need for targeted interventions. The identification of geo-relational hubs and critical interdependencies provides actionable insights for both policymakers and practitioners, showing where resilience-building efforts can yield the greatest systemic benefits.
The significance of this study lies in three dimensions. First, it advances methodological innovation by integrating event-coded disruption data with system-dynamics modeling, thus bridging a persistent gap in the literature where large-scale data remain underutilized [9,10]. Second, it introduces a cross-domain perspective, showing how disruptions in one domain (e.g., energy) spill over into others (e.g., manufacturing and operations), offering empirical validation of interdependencies that have been theorized but not systematically quantified [7,8]. Third, the geo-relational analysis highlights how disruption risk is concentrated in specific hubs (e.g., the United States, the United Kingdom, Australia, China, and India) as well as in single-domain critical nodes such as Saudi Arabia. Recognizing both multi-domain hubs and single-domain chokepoints enhances prioritization of resilience strategies when resources are limited.

6.1. Comparative Perspective with Existing Literature

Compared with existing studies, this research offers a number of advantages (as shown in Table 11). Earlier works such as Zhu and Cote [1], Chen et al. [2], and Ramirez-Peña et al. [3] emphasized the strategic role of GSCM practices, supplier-focused performance measurement, and environmental integration. While valuable, these studies were limited in scope, often addressing firm-level or sectoral outcomes without considering global systemic dynamics. More recent research by Liu et al. [5] and Wang et al. [6] examined barriers such as cost and regulatory pressures, and noted the fragmented, top-down nature of GSCM narratives. However, these contributions did not provide an empirically grounded framework to analyze disruption propagation across domains.
In contrast, this study complements and extends the work of Love et al. [9] and Peng et al. [10], who demonstrated the utility of event-coded data for monitoring disruption signals, by embedding such data within a system-dynamics framework that quantifies resilience. Similarly, while Samani et al. [7] and Papanagnou [8] introduced event system theory and simulation to model disruption persistence, their models were primarily conceptual or simulation-based, lacking large-scale empirical validation. By applying system-of-systems modeling to 67,434 empirically coded disruption events, this study offers a more comprehensive and data-driven alternative.
Furthermore, previous research has identified chokepoints in global supply chains (e.g., Hart-Nibbrig et al. [11], Meng et al. [12], Zhao et al. [13]), but these studies relied on narrower datasets and did not incorporate cross-domain coupling. The present research improves upon these by simultaneously mapping country-level hubs, domain-specific vulnerabilities, and interdependencies between systemic layers. This enables the identification not only of where disruptions occur most frequently, but also of how they propagate across interconnected domains, providing a richer and more actionable understanding of systemic resilience.
Although reliance on news sources introduces the possibility of political, regional, and cultural biases, this study mitigates such risks through large-scale aggregation. Hundreds of portals frequently report the same event from differing perspectives—for example, left- versus right-leaning political framing, U.S. versus Chinese geopolitical perspectives, or Western versus Asian cultural framings. By consolidating multiple reports of the same disruption, the system effectively neutralizes individual source bias. Furthermore, our institute has developed and demonstrated bias-detection technology (https://bias.press) capable of quantifying and correcting for framing asymmetries in real time. In addition, our recent significant publications clearly demonstrate the use of state-of-the-art algorithms for bias detection, quantification, and mitigation [34,37]. Together, these strategies enhance the robustness of the findings and strengthen confidence in the validity of the event-coded dataset.

6.2. Implications

The comparative analysis underscores why the proposed approach is superior in addressing current gaps in the literature. By combining large-scale event-coded datasets with system-of-systems modeling, this study provides: (i) a globally comprehensive empirical foundation, (ii) validated cross-domain insights, and (iii) geo-relational perspectives that highlight both multi-domain hubs and single-domain criticalities. These contributions not only extend the scope of GSCM research but also provide a foundation for policymakers and practitioners to design targeted interventions that strengthen global supply chain resilience against increasingly complex and systemic disruptions.
Beyond highlighting systemic vulnerabilities, the framework can be directly operationalized in decision-support systems for firms and governments. The event-ingestion pipeline, when linked to live data streams, can provide real-time monitoring dashboards that track disruptions across domains and geographies. The resilience index λ c can then serve as a dynamic indicator of stress or recovery potential, enabling managers and policymakers to identify fragile domains before cascading risks materialize.
Such an implementation would allow scenario testing and stress simulations in practice. For instance, firms could evaluate the impact of an energy disruption on logistics and manufacturing flows in near real time, while governments could monitor geopolitical chokepoints to preempt systemic crises. While case-based validations remain beyond the scope of this study, future work will demonstrate how the proposed pipeline can be embedded into operational platforms to support resilience-oriented decision-making.

7. Conclusions

This study provides a comprehensive and empirically grounded analysis of disruption dynamics in global green supply chains. By examining over 1.8 million news articles and isolating 67,434 events directly linked to systemic domains such as energy, environment, operations, manufacturing, agri-food, and labor, the research demonstrates how large-scale event-coded data can be transformed into actionable knowledge. The findings reveal that systemic vulnerabilities are unevenly distributed, with countries like the United States, China, and India functioning as disruption hubs, while Saudi Arabia emerges as a critical single-domain chokepoint in energy. Temporal and correlation analyses show that disruption intensity is frequent and highly interdependent. The strongest couplings occur between energy, logistics, and manufacturing, underscoring the cascading nature of global risks.
The significance of this research lies in its methodological innovation, integrating event-coded datasets with a system-of-systems perspective to operationalize resilience modeling. For policymakers and industry leaders, the geo-relational results offer concrete insights into where targeted interventions could yield disproportionate benefits, particularly in mitigating the risks concentrated in systemic hubs and chokepoints. For scholars, the study bridges a longstanding gap between conceptual theorization of disruptions and large-scale empirical validation.
At the same time, we acknowledge that our treatment of GSCM remains necessarily abstract at the global level. Future extensions should apply the framework to country- or sector-specific contexts where localized policies, infrastructural constraints, and socio-political dynamics can yield more granular managerial implications. This would complement the present system-level findings with actionable strategies tailored to particular national or industry settings.
Several limitations should be acknowledged. The dataset is restricted to news sources, which introduces potential media bias and uneven geographic coverage (as discussed in [34,35,36]). Although classification was automated using advanced language models, inaccuracies in event coding cannot be fully excluded. Furthermore, resilience metrics, while informative, are abstractions and may not fully capture localized recovery dynamics. Although the resilience index relies on calibrated parameters ( α , β , γ ) , robustness checks across temporal windows and parameter initializations indicate stable relative rankings of domain resilience [38,39]. A more formal sensitivity analysis remains an important direction for future work. Future research should extend this work by integrating complementary datasets, such as trade flows, financial market indicators, and firm-level operational data. Methodological enhancements could also include machine learning–based predictive modeling and dynamic scenario testing to explore adaptation strategies under evolving shocks [40]. Moreover, future endeavors should extend the proposed framework to specific countries or regions. Such applications would enable policymakers and managers to translate global systemic vulnerabilities into context-sensitive strategies, thereby advancing both scholarly understanding and managerial practice. Together, these directions will enhance the capacity of green supply chain management to anticipate, absorb, and recover from systemic disruptions.

Author Contributions

Conceptualization, F.S.; methodology, F.S.; software, F.S. and M.A.; validation, F.S.; formal analysis, F.S.; investigation, F.S.; resources, M.A.; data curation, F.S.; writing—original draft preparation, F.S.; writing—review and editing, F.S. and M.A.; visualization, F.S.; supervision, M.A.; project administration, M.A.; funding acquisition, M.A. All authors have read and agreed to the published version of the manuscript.

Funding

The authors received no funds for this work. Umm Al-Qura University supported this research through a paid sabbatical leave year (2023–2024) by the University Rector Decree (No: 4502002158).

Data Availability Statement

To ensure research reproducibility and facilitate open validation within the scientific community, the dataset comprising 67,434 news-derived events generated for this study has been made publicly accessible at https://github.com/DrSufi/EventSystemGSC (accessed on 13 Septmber 2025).

Acknowledgments

The authors extend their appreciation to Umm Al-Qura University, Saudi Arabia for providing the opportunity to pursue this research through sabbatical leave (4502002158). The authors also acknowledge the support of Edris Alam of Emergency & Crisis Management, Rabdan Academy, UAE, in evaluating the outcome of this study.

Conflicts of Interest

Author Fahim Sufi was employed by the company COEUS Institute. The remaining author declare that the research was conducted in the absence of any commercial or financial relationships that could be construed as a potential conflict of interest.

Abbreviations

The following abbreviations are used in this manuscript:
GSCMGreen Supply Chain Management
SoSSystem of Systems
ESTEvent System Theory
LLMLarge Language Model
NLPNatural Language Processing
SCEMSupply Chain Event Management
AIArtificial Intelligence
MLMachine Learning

References

  1. Zhu, Q.; Cote, R.P. Integrating green supply chain management into an embryonic eco-industrial development: A case study of the Guitang Group. J. Clean. Prod. 2004, 12, 1025–1035. [Google Scholar] [CrossRef]
  2. Chen, L.; Zhao, X.; Tang, O.; Price, L.; Zhang, S.; Zhu, W. Supply chain collaboration for sustainability: A literature review and future research agenda. Int. J. Prod. Econ. 2017, 194, 73–87. [Google Scholar] [CrossRef]
  3. Ramirez-Peña, M.; Sotano, A.J.S.; Pérez-Fernandez, V.; Abad, F.J.; Batista, M. Achieving a sustainable shipbuilding supply chain under I4.0 perspective. J. Clean. Prod. 2020, 244, 118789. [Google Scholar] [CrossRef]
  4. Khan, M.; Ajmal, M.M.; Gunasekaran, A.; AlMarzouqi, A.H.; AlNuaimi, B.K. Measures of greenness: An empirical study in service supply chains in the UAE. Int. J. Prod. Econ. 2021, 241, 108257. [Google Scholar] [CrossRef]
  5. Liu, Y.; Hu, S.; Wang, C. The green innovation spillover effect of enterprise digital transformation: Based on supply chain perspective. Econ. Anal. Policy 2024, 84, 1381–1393. [Google Scholar] [CrossRef]
  6. Wang, S.; Hu, Y.; Zhao, Z.; Cai, J.; Yang, J.; Liu, M.; Fang, W.; Ma, Z.; Bi, J. Rising attention and shifting themes in green supply chain discourse: Evidence from Weibo (2012–2024). J. Clean. Prod. 2025, 518, 145911. [Google Scholar] [CrossRef]
  7. Samani, M.R.G.; Hosseini-Motlagh, S.M.; Homaei, S. A reactive phase against disruptions for designing a proactive platelet supply network. Transp. Res. Part E Logist. Transp. Rev. 2020, 140, 102008. [Google Scholar] [CrossRef]
  8. Papanagnou, C.; Seiler, A.; Spanaki, K.; Papadopoulos, T.; Bourlakis, M. Data-driven digital transformation for emergency situations: The case of the UK retail sector. Int. J. Prod. Econ. 2022, 250, 108628. [Google Scholar] [CrossRef]
  9. Love, D.C.; Allison, E.H.; Asche, F.; Belton, B.; Cottrell, R.S.; Froehlich, H.E.; Gephart, J.A.; Hicks, C.C.; Little, D.C.; Nussbaumer, E.M.; et al. Emerging COVID-19 impacts, responses, and lessons for building resilience in the seafood system. Glob. Food Secur. 2021, 28, 100494. [Google Scholar] [CrossRef]
  10. Peng, X.; Ji, S.; Thompson, R.G.; Zhang, L. Resilience planning for Physical Internet enabled hyperconnected production-inventory-distribution systems. Comput. Ind. Eng. 2021, 158, 107413. [Google Scholar] [CrossRef]
  11. Nibbrig, M.H.; Azadeh, S.S.; Maknoon, M. Adaptive resilience strategies for supply chain networks against disruptions. Transp. Res. Part E Logist. Transp. Rev. 2025, 200, 104172. [Google Scholar] [CrossRef]
  12. Meng, Z.; Sun, H.; Daigo, I.; Guan, Y.; Shan, Y. Technological risks disrupting trade stability in the global lithium supply chain network. iScience 2025, 28, 112939. [Google Scholar] [CrossRef]
  13. Zhao, J.; He, T.; Xi, X.; Li, W.H.; Liu, W. Geographic proximity and supply chain Resilience: Unravelling their complex dynamics in the digital age. Technovation 2025, 148, 103328. [Google Scholar] [CrossRef]
  14. Papadopoulos, T.; Baltas, K.N.; Balta, M.E. The use of digital technologies by small and medium enterprises during COVID-19: Implications for theory and practice. Int. J. Inf. Manag. 2020, 55, 102192. [Google Scholar] [CrossRef] [PubMed]
  15. Pimenta, M.L.; Cezarino, L.O.; Piato, E.L.; da Silva, C.H.P.; Oliveira, B.G.; Liboni, L.B. Supply chain resilience in a COVID-19 scenario: Mapping capabilities in a systemic framework. Sustain. Prod. Consum. 2022, 29, 649–656. [Google Scholar] [CrossRef] [PubMed]
  16. Brusset, X.; Torre, D.L.; Broekaert, J. Algorithms, Analytics, and Artificial Intelligence: Harnessing Data to Make Supply Chain Decisions; Elsevier: Amsterdam, The Netherlands, 2022. [Google Scholar] [CrossRef]
  17. Brintrup, A.; Kosasih, E.E.; MacCarthy, B.L.; Demirel, G. Digital Supply Chain Surveillance: Concepts, Challenges, and Frameworks; Elsevier: Amsterdam, The Netherlands, 2022. [Google Scholar] [CrossRef]
  18. Ding, L.; Lam, H.K.; Cheng, T.; Zhou, H. A review of short-term event studies in operations and supply chain management. Int. J. Prod. Econ. 2018, 200, 329–342. [Google Scholar] [CrossRef]
  19. Woldt, J.J.; Prasad, S. Crises in global supply chains: The role of impression management communications. Int. J. Prod. Econ. 2022, 252, 108562. [Google Scholar] [CrossRef]
  20. Eirinakis, P.; Kasapidis, G.; Mourtos, I.; Repoussis, P.; Zampou, E. Situation-aware manufacturing systems for capturing and handling disruptions. J. Manuf. Syst. 2021, 58, 365–383. [Google Scholar] [CrossRef]
  21. Meyer, A.; Sejdovic, S.; Glock, K.; Bender, M.; Kleiner, N.; Riemer, D. A disruption management system for automotive inbound networks: Concepts and challenges. EURO J. Transp. Logist. 2018, 7, 25–56. [Google Scholar] [CrossRef]
  22. Hatayama, H.; Murakami, S.; Anzai, Y. Visualizing the regional risk in raw material supply based on event analysis. Resour. Policy 2025, 109, 105718. [Google Scholar] [CrossRef]
  23. Nozari, H.; Ghahremani-Nahr, J.; Szmelter-Jarosz, A. AI and Machine Learning for Real-World Problems; Elsevier: Amsterdam, The Netherlands, 2024; Volume 134. [Google Scholar] [CrossRef]
  24. Dong, Z.; Liang, W.; Liang, Y.; Gao, W.; Lu, Y. Blockchained supply chain management based on IoT tracking and machine learning. Eurasip J. Wirel. Commun. Netw. 2022, 2022, 127. [Google Scholar] [CrossRef]
  25. Yang, C.H.; Wang, H.T.; Ma, X.; Talluri, S. A data-driven newsvendor problem: A high-dimensional and mixed-frequency method. Int. J. Prod. Econ. 2023, 266, 109042. [Google Scholar] [CrossRef]
  26. Secinaro, S.; Lanzalonga, F.; Oppioli, M.; de Nuccio, E. The effects of disruptive technologies on accountability in fintech industry: Using bibliometric analysis to develop a research agenda. Res. Int. Bus. Financ. 2025, 76, 102816. [Google Scholar] [CrossRef]
  27. Yan, Y.; Gupta, S.; Licsandru, T.C.; Schoefer, K. Integrating machine learning, modularity and supply chain integration for Branding 4.0. Ind. Mark. Manag. 2022, 104, 136–149. [Google Scholar] [CrossRef]
  28. Qazi, A. Systemically Important Supply Chains in Crisis: Mapping Disruptions and Global Ripple Effects. Nat. Hazards Res. 2025. [Google Scholar] [CrossRef]
  29. Dixit, V.; Seshadrinath, N.; Tiwari, M. Performance measures based optimization of supply chain network resilience: A NSGA-II + Co-Kriging approach. Comput. Ind. Eng. 2016, 93, 205–214. [Google Scholar] [CrossRef]
  30. Musa, M.K.; Abdulsalam, A.; Haruna, U.A.; Zakariya, F.; Okon, I.I.; Musa, S.S.; Lucero-Prisno, D.E. Exploring the Potential of Artificial Intelligence to Boost Africa’s Food Security; Elsevier: Amsterdam, The Netherlands, 2023; Volume 8. [Google Scholar] [CrossRef]
  31. Jawad, Z.N.; János, D.V.B. A comprehensive review of AI-enhanced decision making: An empirical analysis for optimizing medication market business. Mach. Learn. Appl. 2025, 20, 100676. [Google Scholar] [CrossRef]
  32. Gidiagba, J.O.; Tartibu, L.K.; Okwu, M.O. A systematic review of machine learning applications in sustainable supplier selection. Decis. Anal. J. 2025, 14, 100547. [Google Scholar] [CrossRef]
  33. Balan, G.S.; Kumar, V.S.; Raj, S.A. Machine learning and artificial intelligence methods and applications for post-crisis supply chain resiliency and recovery. Supply Chain. Anal. 2025, 10, 100121. [Google Scholar] [CrossRef]
  34. Sufi, F.K. A New Computational Method for Quantification and Analysis of Media Bias in Cybersecurity Reporting. IEEE Trans. Comput. Soc. Syst. 2025, 1–10. [Google Scholar] [CrossRef]
  35. Sufi, F.; Alsulami, M. Quantifying Truthfulness: A Probabilistic Framework for Atomic Claim-Based Misinformation Detection. Mathematics 2025, 13, 1778. [Google Scholar] [CrossRef]
  36. Sufi, F.; Alsulami, M. Disaster in the Headlines: Quantifying Narrative Variation in Global News Using Topic Modeling and Statistical Inference. Mathematics 2025, 13, 2049. [Google Scholar] [CrossRef]
  37. Sufi, F.; Alsulami, M. Unmasking Media Bias, Economic Resilience, and the Hidden Patterns of Global Catastrophes. Sustainability 2025, 17, 3951. [Google Scholar] [CrossRef]
  38. Poudyal, A.; Dubey, A. Sensitivity Analyses of Resilience-oriented Risk-averse Active Distribution Systems Planning. arXiv 2022, arXiv:2211.13879. [Google Scholar]
  39. Liu, X.; Zio, E.; Borgonovo, E.; Plischke, E. A Systematic Approach of Global Sensitivity Analysis and Its Application to a Model for the Quantification of Resilience of Interconnected Critical Infrastructures. Energies 2024, 17, 1823. [Google Scholar] [CrossRef]
  40. Douaioui, K.; Oucheikh, R.; Mabrouki, C. Enhancing supply chain resilience: A deep learning approach to late delivery risk prediction. In Proceedings of the 2024 4th International Conference on Innovative Research in Applied Science, Engineering and Technology (IRASET), Fez, Morocco, 16–17 May 2024; IEEE: Piscataway, NJ, USA, 2024; pp. 1–7. [Google Scholar]
Figure 1. Conceptual system-of-systems representation of global green supply chain disruptions. The figure illustrates how environmental, energy, logistics, manufacturing, agri-food, and labor domains are interdependent, showing how shocks in one domain cascade across others.
Mathematics 13 03471 g001
Figure 2. Conceptual framework of the methodology. The figure illustrates the transformation of raw news event data into categorized domains, temporal and correlation analysis, system dynamics modeling of disruptions and resilience, and network analysis of event–country relationships.
Mathematics 13 03471 g002
Figure 3. Interaction of the four core algorithms: data ingestion and categorization (Algorithm 1), temporal aggregation (Algorithm 2), resilience index calibration (Algorithm 3), and geo-relational network construction (Algorithm 4).
Mathematics 13 03471 g003
Figure 4. Experimentation pipeline: collection and LLM-based classification of the news corpus; filtering to green supply chain event codes; domain mapping; descriptive statistics and geo-normalization; monthly aggregation to f c ( t ) and R c ( t ) ; and downstream system-dynamics and network analyses (resilience, couplings, hubs).
Mathematics 13 03471 g004
Figure 5. Monthly frequency of supply chain disruptions across systemic domains. The figure highlights how Operations and Energy/Environment consistently dominate disruption frequency, reflecting their systemic vulnerability relative to other domains.
Mathematics 13 03471 g005
Figure 6. Monthly rating-weighted intensity of supply chain disruptions across systemic domains. Energy/Environment shows the most volatile and severe spikes, particularly during climate-related and energy crises, underscoring its systemic fragility.
Mathematics 13 03471 g006
Figure 7. Estimated resilience indices λ c for each systemic domain (full dataset). The figure demonstrates that Agri-Food and Social/Labor display the highest adaptive capacity, while Energy/Environment and Operations remain the most fragile, reflecting systemic weaknesses.
Mathematics 13 03471 g007
Figure 8. Domain-specific incidence of supply chain disruptions across the top 12 countries (full dataset, standardized country names). The figure shows that the United States and Australia are heavily exposed in Operations and Energy/Environment, whereas India and China display more balanced exposure across domains.
Mathematics 13 03471 g008
Figure 9. System-of-systems perspective of global green supply chain disruptions. Countries (blue nodes) are linked to systemic domains (green squares), illustrating multi-domain exposure and interdependencies.
Mathematics 13 03471 g009
Figure 10. System-of-systems network showing the top 5 countries and their top 5% strongest disruption linkages with systemic domains. Strong interdependencies with Energy/Environment and Operations dominate, particularly for the United States and United Kingdom.
Mathematics 13 03471 g010
Figure 11. System-of-systems network of the top 12 countries, highlighting Saudi Arabia (red node). Link values show that Saudi Arabia’s strongest dependency is on the Energy/Environment domain (>300 events), followed by weaker connections to Operations (<50 events).
Mathematics 13 03471 g011
Table 1. Research gaps in the green supply chain management literature.
ThemeState of the ArtIdentified Gap
Strategic Role of GSCMGSCM practices enhance competitiveness and sustainability [1,3,4]Fragmented, top-down discourse with limited inclusiveness [6]
Performance and StakeholdersSupplier-focused metrics dominate [2]Neglect of customer, labor, and community perspectives
Barriers to AdoptionCosts, immature technologies, and regulations limit adoption [5]Lack of global systemic analyses linking barriers to resilience
Event-Coded DataStructured signals from Factiva and EventWatch [9,10,22]Limited integration with resilience and system-dynamics models
Simulation and System DynamicsEST and simulation capture persistence/spillovers [7,8]Weak empirical validation; limited cross-domain application
Real-Time MonitoringEvent studies and SCEM provide disruption detection [18,19,20,21]Lack of integration with predictive and adaptive frameworks
Critical HubsUS, Belgium, Chile, China identified as chokepoints [11,12,13]Absence of integrated frameworks linking hubs with systemic resilience
Cross-Domain CouplingEnergy, agri-food, labor disruptions cascade [28,29]Limited holistic, system-of-systems validation
Reviews and SynthesisSystematic reviews of disruptions and resilience [14,15,16]Need for synthesis integrating empirical event data with systemic models
Predictive Analytics and AIMachine learning supports forecasting and disruption management [23,24,25,26,27,30,31,32,33]Insufficient application to GSCM-specific disruption modeling
Table 2. Notation and variable definitions.
SymbolDefinition
E = { e 1 , , e N } Set of events in the dataset
C = { c 1 , , c K } Set of K event categories (supply chain domains)
d ( e i ) Event date of e i
σ ( e i ) Event significance (local, national, international)
r ( e i ) Event rating (quantitative impact score)
l 1 ( e i ) , l 2 ( e i ) First and second event country
f c ( t ) Frequency of events in category c at time t
R c ( t ) Aggregated rating of category c at time t
ρ c 1 , c 2 Correlation between categories c 1 and c 2
λ c Resilience index of category c
Table 3. Overview of dataset coverage and structure.
CharacteristicValue
Total records (filtered, event-coded)67,434
Temporal coverage26 September 2023 to 9 September 2025
Distinct event codes23
Mapped systemic domains5
Ratings available (non-missing)66,357
Ratings missing1077
Distinct normalized countries1390
Table 4. Distribution of event codes in the analytical dataset.
Event CodeCount
Energy and Resource News17,748
Environmental News15,944
Climate Change Report8246
Electric and Self driving Vehicles news5083
Trade and Commerce3728
Hazardous Industrial Accident2817
Manufacturing and Engineering News2664
Workers on Strike2522
Food Supply and Inventory Event1720
Significant Farming News or Event1141
Labor and Employment News926
Logistics News859
Energy Grid and Distribution726
Fuel related price hikes698
Oil and Gas Industry665
Rare Earth Elements Industry News571
International Supply Chain Event346
Workers Rights339
Major Product Recall331
Manufacturing Related News158
Energy Storage News143
Global Environmental Contamination News58
Environmental news (variant)1
Table 5. Distribution of events across systemic domains.
DomainCount
Energy/Environment44,102
Operations10,714
Manufacturing5970
Social/Labor3787
Agri-Food2861
Table 6. Distribution of event significance labels (after harmonization).
Event Significance (Raw)Count
Local18,027
National18,258
International15,842
Global8286
State3851
Region1627
Community1149
Regional271
Table 7. Descriptive statistics for event ratings.
StatisticValue
Count66,357
Mean275.06
Standard deviation217.07
Minimum6.30
25th percentile118.56
Median227.52
75th percentile353.92
90th percentile586.44
95th percentile747.84
Maximum1236.60
Table 8. Top 10 countries after normalization of name variants.
CountryCount
United States20,829
United Kingdom6716
Australia6448
India5616
Canada3834
China3671
Russia973
Unknown640
Brazil613
Germany589
Table 9. Sample of monthly frequency and rating-weighted intensity across domains (Agri-Food domain, 10 months).
MonthDomainFrequency f c ( t ) Intensity R c ( t )
2023-10Agri-Food205375.52
2023-11Agri-Food348046.00
2023-12Agri-Food339392.22
2024-01Agri-Food298467.92
2024-02Agri-Food14256,594.70
2024-03Agri-Food5316,679.70
2024-04Agri-Food4216,081.56
2024-05Agri-Food5018,958.32
2024-06Agri-Food3510,861.20
2024-07Agri-Food4316,199.46
Table 10. Resilience metrics estimated for each systemic domain using the system-dynamics model. The table highlights that Agri-Food and Social/Labor exhibit stronger recovery capacity, while Operations and Energy/Environment show minimal resilience, indicating systemic fragility.
Domain a c β c α c γ c , · λ c
Agri-Food−0.331.000.310.391.43
Social/Labor−0.651.001.260.030.77
Manufacturing−1.271.001.490.390.53
Energy/Environment0.980.020.000.320.05
Operations1.340.000.000.770.00
Table 11. Comparative perspective of existing approaches in GSCM research versus the present study. The table shows how this research addresses gaps by integrating large-scale event-coded datasets with system-of-systems resilience modeling, enabling cross-domain and geo-relational insights.
Study/ApproachKey ContributionsLimitations Addressed by Present Study
Zhu and Cote (2004) [1]Strategic role of environmental practices in supply chainsFirm- and sector-level focus; lacks global, systemic scope
Chen et al. (2017) [2]Supplier-focused performance metrics (financial, operational, ecological)Neglect of customer, labor, and social dimensions
Ramirez-Peña et al. (2020) [3]Integration of sustainability into industrial systemsLimited empirical validation at global scale
Liu et al. (2024) [5]Barriers: costs, immature technologies, regulatory burdenAbsence of resilience modeling and systemic perspective
Wang et al. (2025) [6]Narrative analysis of GSCM, highlighting top-down policy influenceLack of empirical event-based evidence; limited inclusiveness
Love (2021), Peng (2021) [9,10]Use of event-coded disruption signals for monitoringWeak integration into system-dynamics resilience frameworks
Samani (2020), Papanagnou (2022) [7,8]Simulation and event system theory for disruption modelingConceptual/simulation-driven; limited empirical grounding
Hart-Nibbrig (2025), Meng (2025), Zhao (2025) [11,12,13]Identification of disruption hubs and chokepointsNarrower datasets; limited cross-domain coupling
Present StudyLarge-scale event-coded dataset (>67,434 events), system-of-systems modeling, resilience indices, cross-domain coupling, geo-relational hubsProvides global empirical validation, integrates event-coded data with resilience modeling, captures multi-domain and geographic interdependencies
Disclaimer/Publisher’s Note: The statements, opinions and data contained in all publications are solely those of the individual author(s) and contributor(s) and not of MDPI and/or the editor(s). MDPI and/or the editor(s) disclaim responsibility for any injury to people or property resulting from any ideas, methods, instructions or products referred to in the content.