1. Introduction
The exponential growth of live-streaming e-commerce and cross-border business has revolutionized retail paradigms but also placed unprecedented strain on supply chain logistics. This new retail landscape exacerbates challenges such as severe regional supply–demand imbalances and declining inventory turnover rates, largely due to the proliferation of long-tail products with sporadic and volatile demand patterns [
1]. Traditional warehousing and forecasting systems, often reliant on historical averages or simple statistical models, struggle to adapt to this new reality. Consequently, developing intelligent, multi-scenario decision-support systems with a sharp focus on improving forecasting accuracy—particularly at the Stock-Keeping Unit (SKU) level for long-tail items—has become a critical imperative for operational efficiency and cost reduction [
2].
Substantial research efforts have been dedicated to addressing these forecasting challenges, evolving from statistical methods to machine learning and ensemble techniques. On one hand, statistical time series models like the Seasonal Autoregressive Integrated Moving Average (SARIMA) are proficient in capturing linear trends and seasonal patterns. Their effectiveness has been demonstrated in fields ranging from traffic flow [
3] to disease forecasting [
4], and improved versions have been applied to retail inventory, significantly reducing prediction errors [
5]. However, their fundamental limitation lies in handling the complex non-linearities induced by promotions, market shifts, and competition in e-commerce. To bridge this gap, hybrid models that combine SARIMA with non-linear models like Support Vector Machines (SVM) or Long Short-Term Memory (LSTM) networks have been proposed for water consumption [
6] and freight volume [
7], showing that synergistic combinations can outperform individual components.
On the other hand, machine learning (ML), particularly Gradient Boosting Decision Tree (GBDT) algorithms, has emerged as a powerful tool for modeling complex, non-linear relationships. XGBoost has shown remarkable success in financial [
8,
9] and rental markets [
10]; LightGBM excels in scenarios requiring high efficiency [
10,
11]; and CatBoost is robust for categorical feature handling [
5,
12]. In the context of sales forecasting, comparative studies confirm that these ML techniques generally surpass traditional methods [
2,
13]. Nevertheless, a consensus indicates that no single GBDT model is universally optimal; their performance is highly dependent on data characteristics [
2]. This underscores the need for a framework that leverages their collective strengths rather than relying on a single choice.
This realization has catalyzed the adoption of ensemble learning, with Stacking emerging as a premier strategy for building robust meta-models by integrating diverse base learners. The superiority of Stacking has been validated across domains, including customer churn prediction in banking [
14], urban rent forecasting [
15], building energy performance [
16], and power load forecasting [
17]. These studies collectively demonstrate that Stacking effectively mitigates model-specific biases and variances, yielding superior generalization ability. For instance, the integration of Prophet with Random Forest within a Stacking framework has shown excellent results on supply chain data [
14,
18], highlighting its potential for e-commerce applications.
Despite significant advancements, a research gap persists in developing robust forecasting frameworks that effectively integrate the strengths of multiple advanced algorithms, specifically tailored for SKU-level predictions in complex e-commerce environments. To address this gap and provide managerial decision-support, this paper proposes a novel multi-model fusion architecture based on a stacking paradigm. The proposed framework employs XGBoost, LightGBM, and CatBoost as base learners and introduces an innovative application of the naive bayes classification ensemble algorithm based on K-means algorithm to predictions generated on the validation set, thereby deriving distinct warehouse importance levels for subsequent performance optimization. Furthermore, the framework synergistically combines the Stacking model’s ability to capture complex nonlinear relationships and feature interactions with a Seasonal Autoregressive Integrated Moving Average (SARIMA) model, which specifically captures linear temporal dependencies within the Stacking residuals for joint forecasting. This integrated approach aims to significantly enhance forecasting accuracy at the Stock Keeping Unit (SKU) level, thereby establishing a reliable foundation for optimizing cross-regional inventory allocation strategies. To comprehensively evaluate the robustness of the Stacking framework, we conducted systematic sensitivity analyses under various feature configurations, revealing the model’s dependency on specific feature types and underscoring the critical importance of properly handling categorical features within the ensemble components.
2. Design of the Stacking Fusion Model
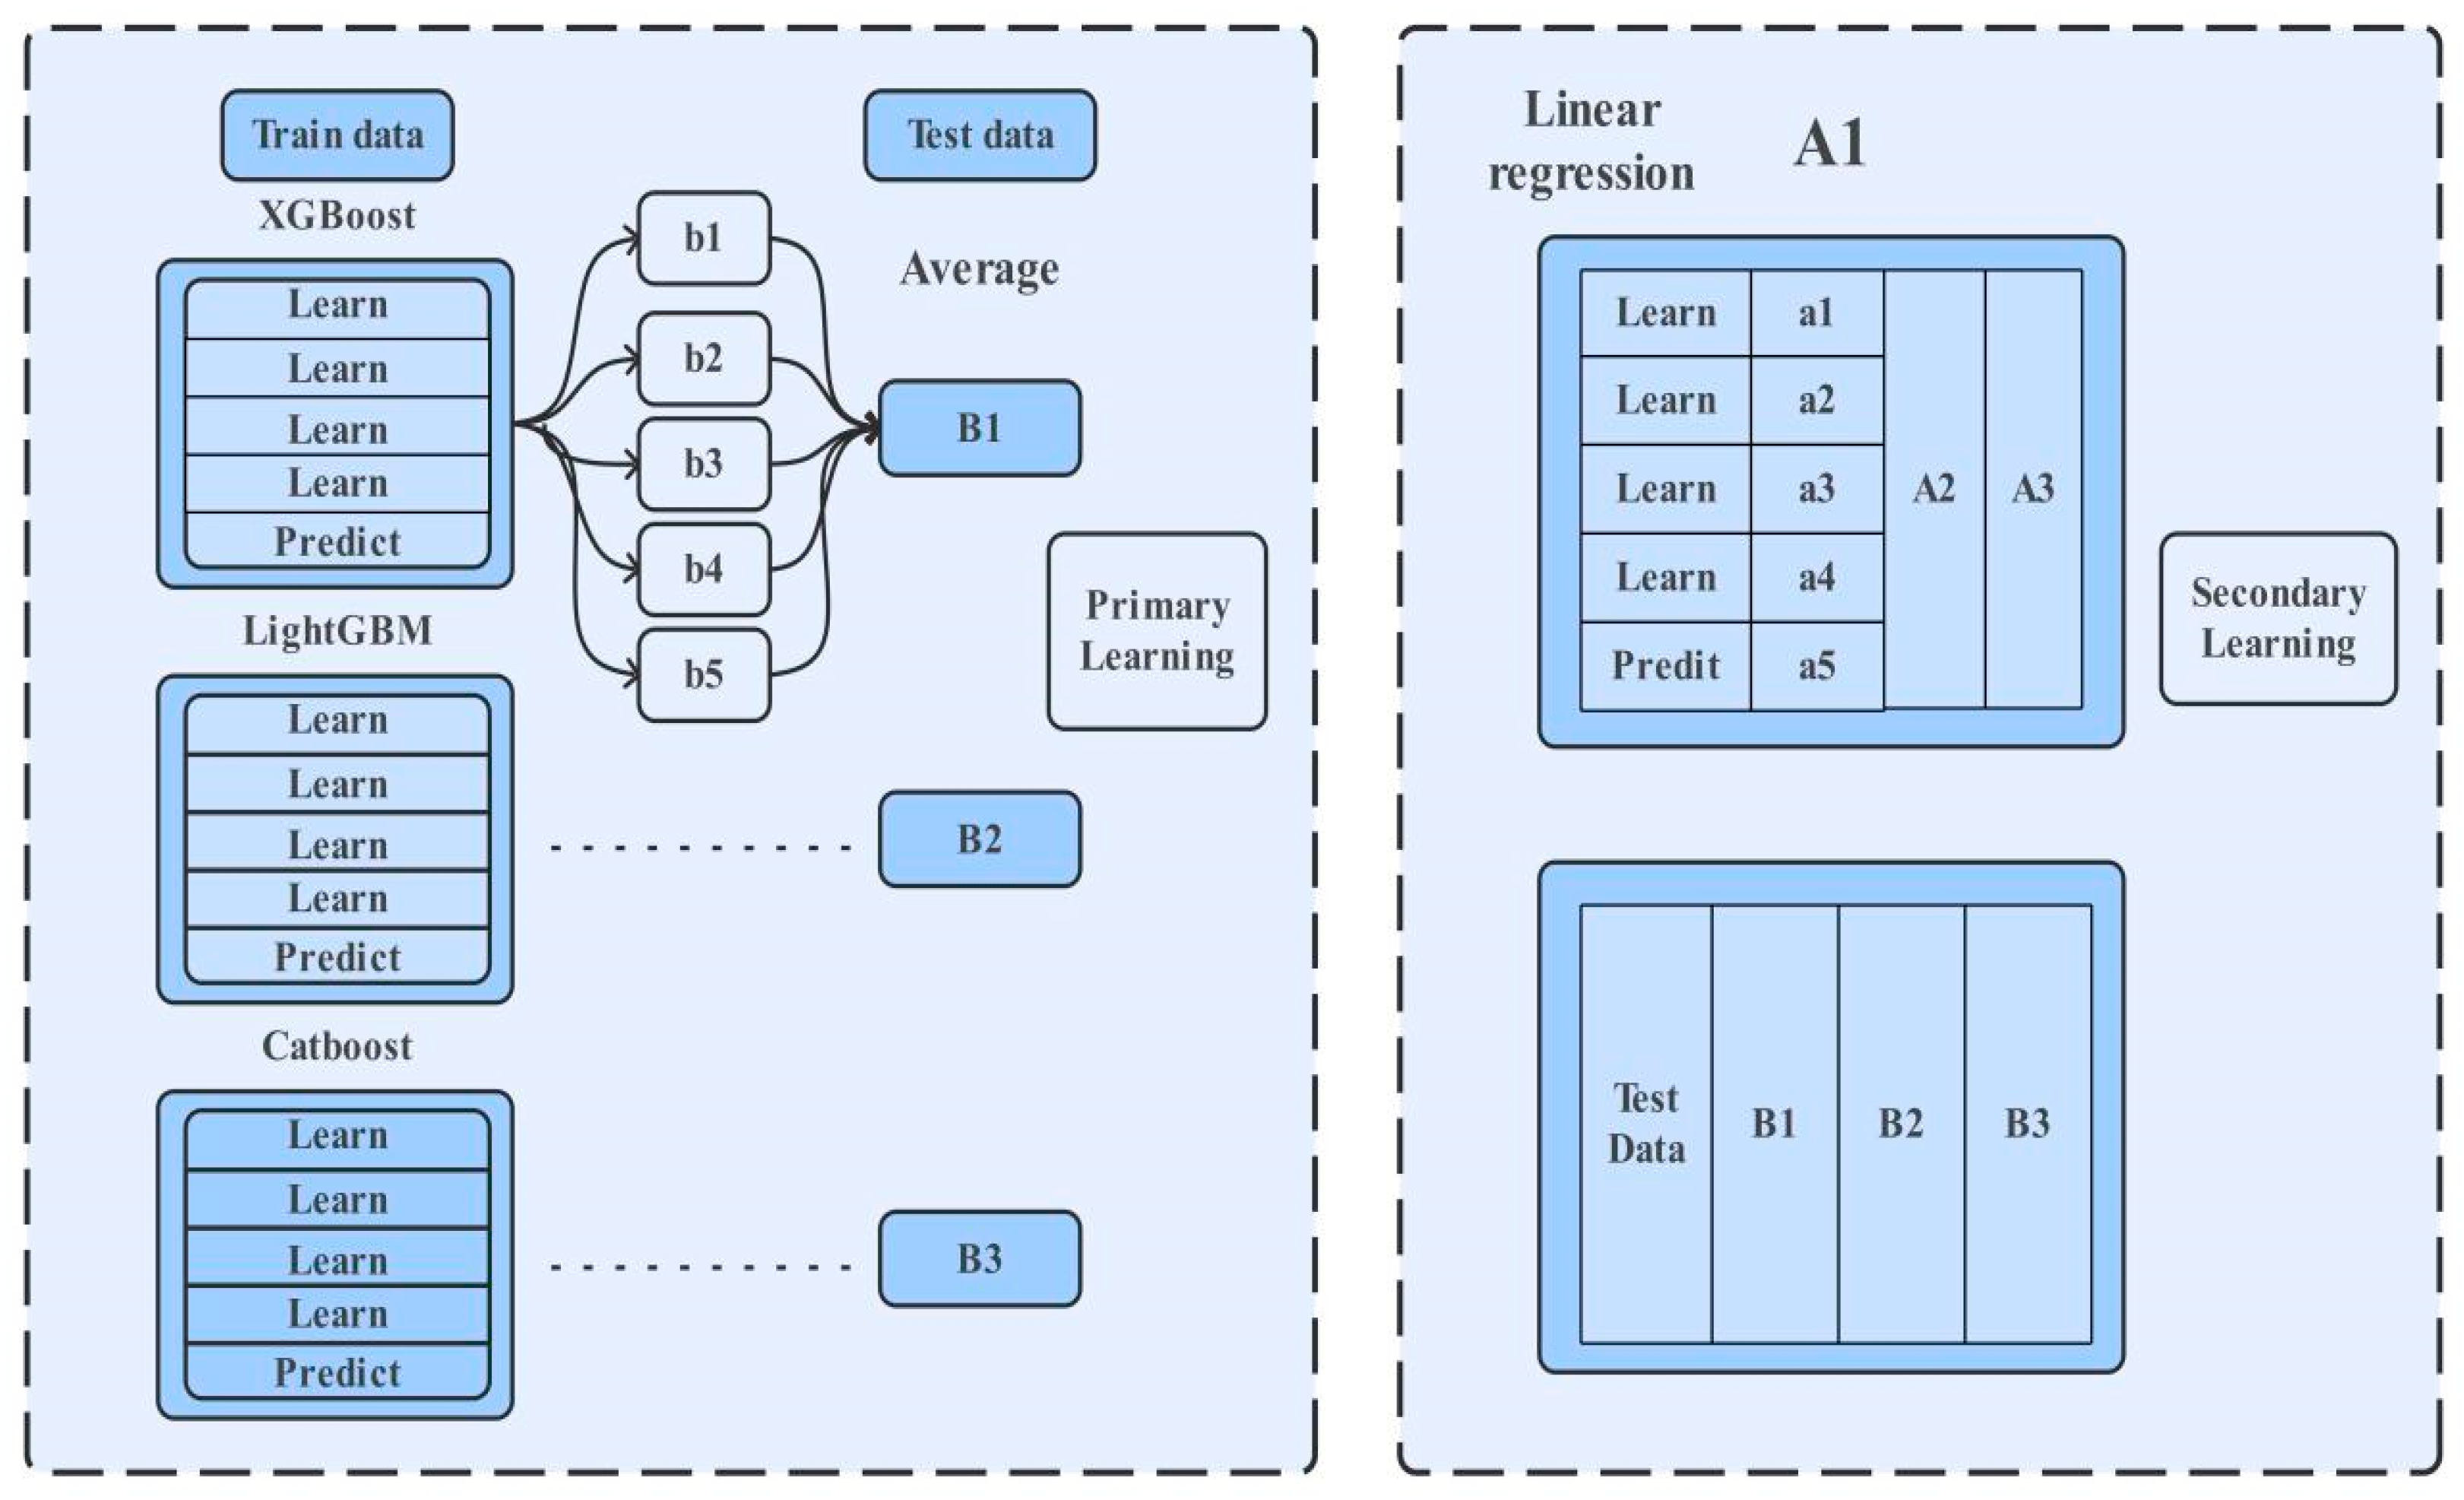
To address the multidimensional challenges in e-commerce supply chains, such as the vast heterogeneity in merchant attributes, divergent operational strategies, constraints on warehouse resources, and the dynamic nature of product demand., this paper proposes a hierarchical Stacking fusion modeling strategy to enhance forecasting accuracy. This strategy employs a meta-learner to integrate multiple base models, whereby the outputs of the base learners are used as new features to train the secondary learner (meta-learner). To mitigate the risk of overfitting, a structurally simple and stable model is selected for the meta-learner. The cross-validation framework employed within this Stacking architecture is illustrated in
Figure 1.
In the construction of the base learner layer:
- (1)
The XGBoost model, built on a gradient-boosting framework, is utilized to handle high-dimensional sparse features. It combines weak CART decision tree learners and approximates the optimal solution for the objective function by incorporating the first and second-order derivatives of the loss function along with a regularization term [
9].
- (2)
The LightGBM model enhances training efficiency through its histogram-based decision tree algorithm. By employing feature binning and histogram statistics, it optimizes split point selection, thereby significantly reducing computational overhead [
19].
- (3)
The CatBoost model effectively addresses the issue of prediction shift by introducing a prior probability weighting scheme. It automatically handles categorical feature encoding and captures multi-dimensional feature interactions [
20].
- (4)
An Ensemble analysis was performed using the K-means algorithm on the base learner predictions from the validation set [
21,
22,
23]. The resulting represent different levels of warehouse importance, which serve as a basis for further optimization planning research.
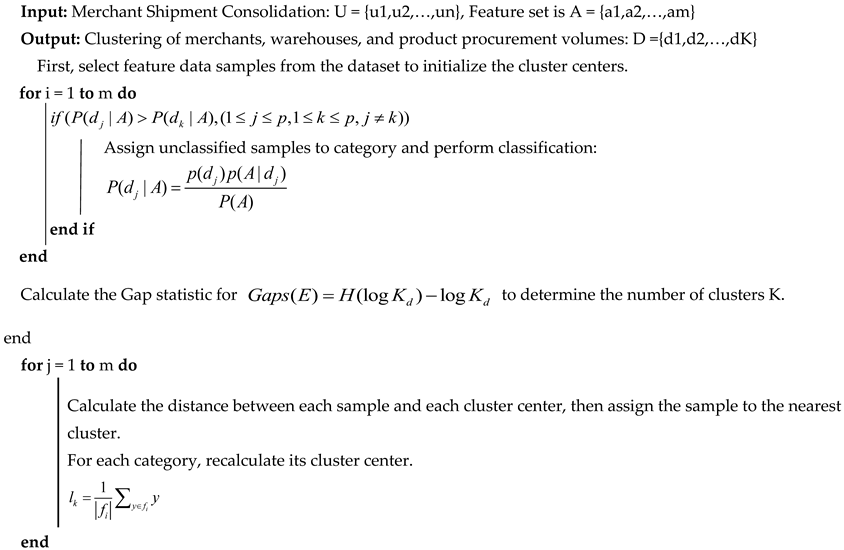
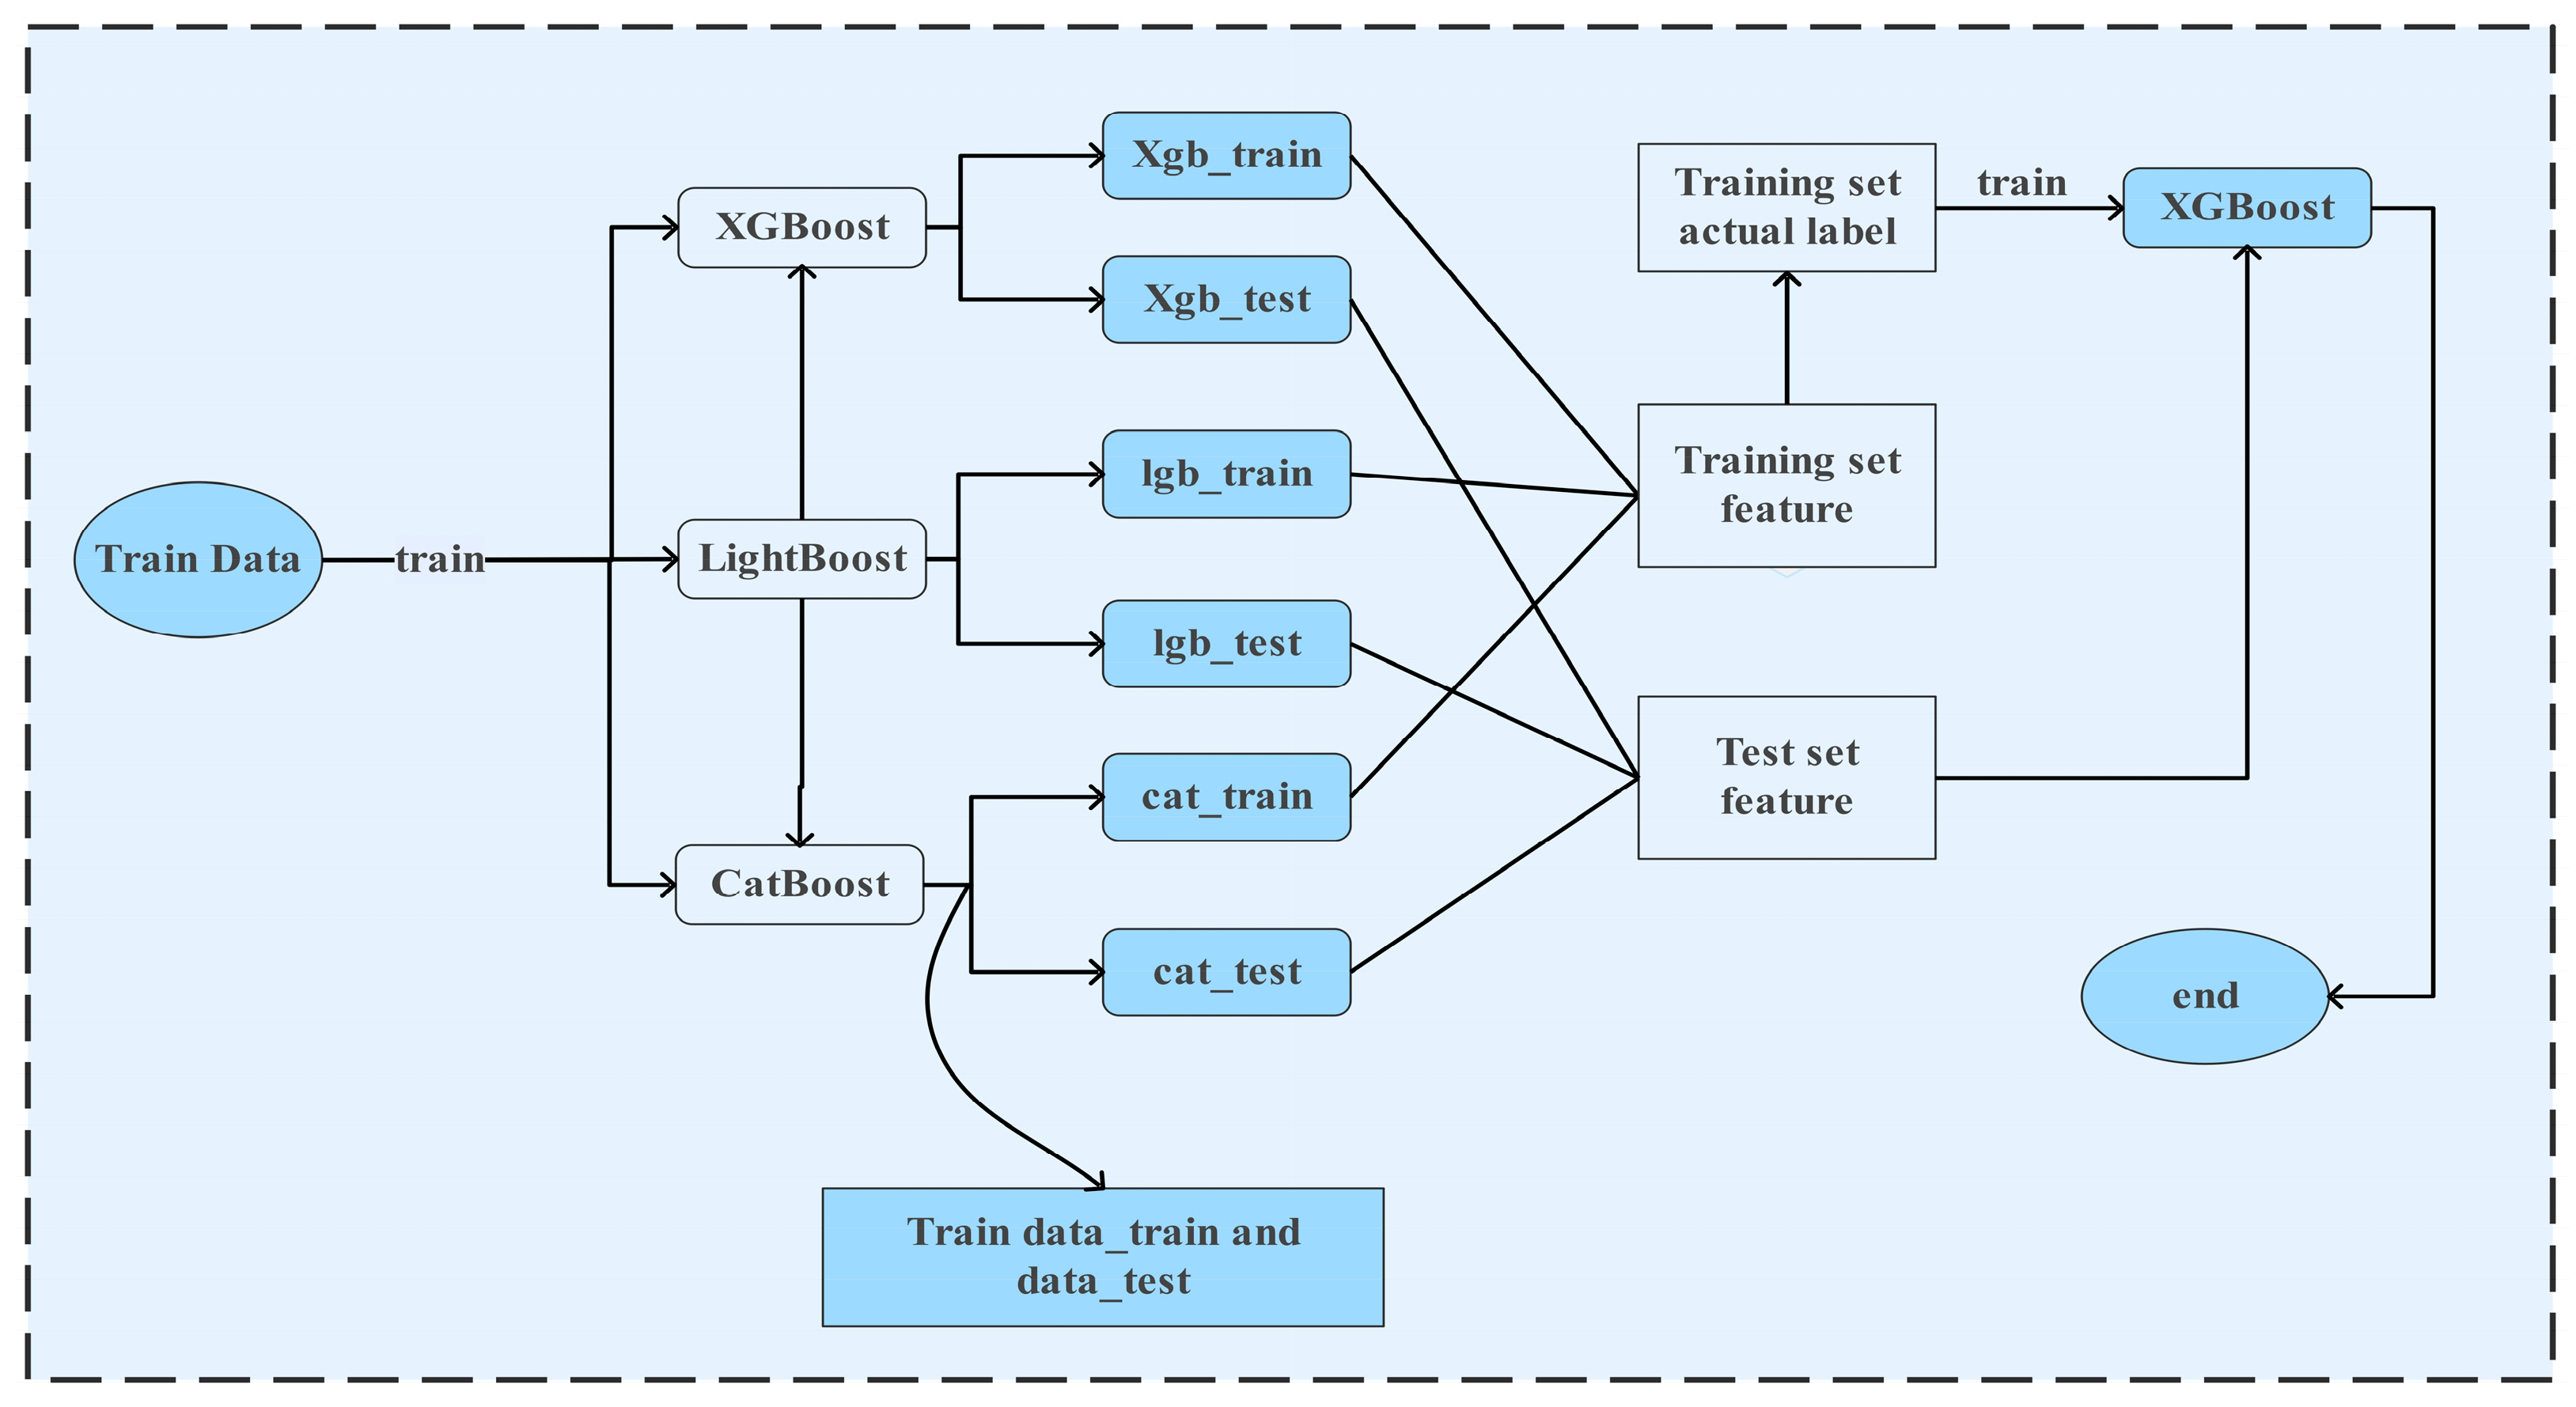
When stacking, outputs can act as class-conditional probability estimators given that each model is treated as independent, which serves to enhance classification accuracy while simultaneously accelerating the computational process. The overall model training workflow is presented in
Figure 2, and the pseudo code for Naive Bayes Classification Ensemble Algorithm Based on K-means presented in Algorithm 1.
| Algorithm 1. Pseudocode for Naive Bayes Classification Ensemble Algorithm Based on K-Means |
![Mathematics 13 03436 i001 Mathematics 13 03436 i001]() |
3. Data Processing and Experimental Setup
3.1. Data Source and Preprocessing
To establish a joint analytical framework for product demand forecasting and warehouse allocation optimization, this study utilizes operational data sourced from E-commerce platform. The dataset encompasses daily sales data of a certain e-commerce platform for one years. Key information was extracted and categorized into the following four types:
- (1)
Time Series Forecasting Data: This includes daily sales volumes, inventory dynamics, and promotional flags for 350 product categories.
- (2)
Warehouse Constraint Data: Operational parameters for 12 regional warehouses are considered, covering storage costs and maximum capacity limits.
- (3)
Affinity Data: A category affinity matrix, generated using a collaborative filtering algorithm, quantifies co-purchase rates and logistics coupling strength between product categories.
- (4)
Attribute Encoding Data: This comprises categorical encodings, product dimensions/type parameters, and product lifecycle stage labels.
Meanwhile, descriptive statistical analysis was conducted on the overall dataset, and the results are shown in
Table 1.
The raw data underwent a comprehensive preprocessing pipeline to form a structured dataset. The minimal analytical unit was defined as the “Merchant-Warehouse-Product” combination. Ultimately, this process resulted in 6416 independent forecasting sequences. A subset of these combinations is illustrated in
Table 2. For the convenience of subsequent prediction, the data will be divided with 70% used as the training set and 30% as the testing set.
3.2. Experimental Optimization
In this experiment, a combined approach of grid search and random search was employed, coupled with 5-fold cross-validation, to balance computational efficiency and search comprehensiveness. The complete hyperparameter search spaces for each model are as follows:
- (1)
XGBoost: learning_rate: [0.01, 0.1, 0.2, 0.3], max_depth: [3, 5, 7, 9], n_estimators: [50, 100, 200, 500], reg_alpha: [0, 0.001, 0.005, 0.01, 0.1]
- (2)
LightGBM: num_leaves: [7, 15, 31, 63], max_depth: [3, 5, 7, −1], learning_rate: [0.01, 0.05, 0.1, 0.2], n_estimators: [50, 100, 200]
- (3)
CatBoost: iterations: [50, 100, 200, 500], learning_rate: [0.01, 0.05, 0.1, 0.2], depth: [4, 6, 8, 10]
The corresponding computational resource usage for each model is summarized in
Table 3.
To achieve optimal performance for the Stacking fusion model, hyperparameter tuning was conducted during the training phase using a combination of grid search and cross-validation. This process iteratively adjusted the parameters to select the optimal configuration, thereby enhancing the model’s overall predictive capability. The finalized hyperparameter settings for each individual model are detailed in
Table 4.
3.3. Experimental Analysis
To validate the performance of the proposed fusion model, a comparative evaluation was carried out against the single models—LightGBM, XGBoost, and CatBoost. The assessment was based on standard metrics: Accuracy, Precision, Recall, Root Mean Square Error (RMSE), 5% accuracy rate (Accuracy
5), R-squared (R
2), MAE, and MAPE. The results are summarized in
Table 5.
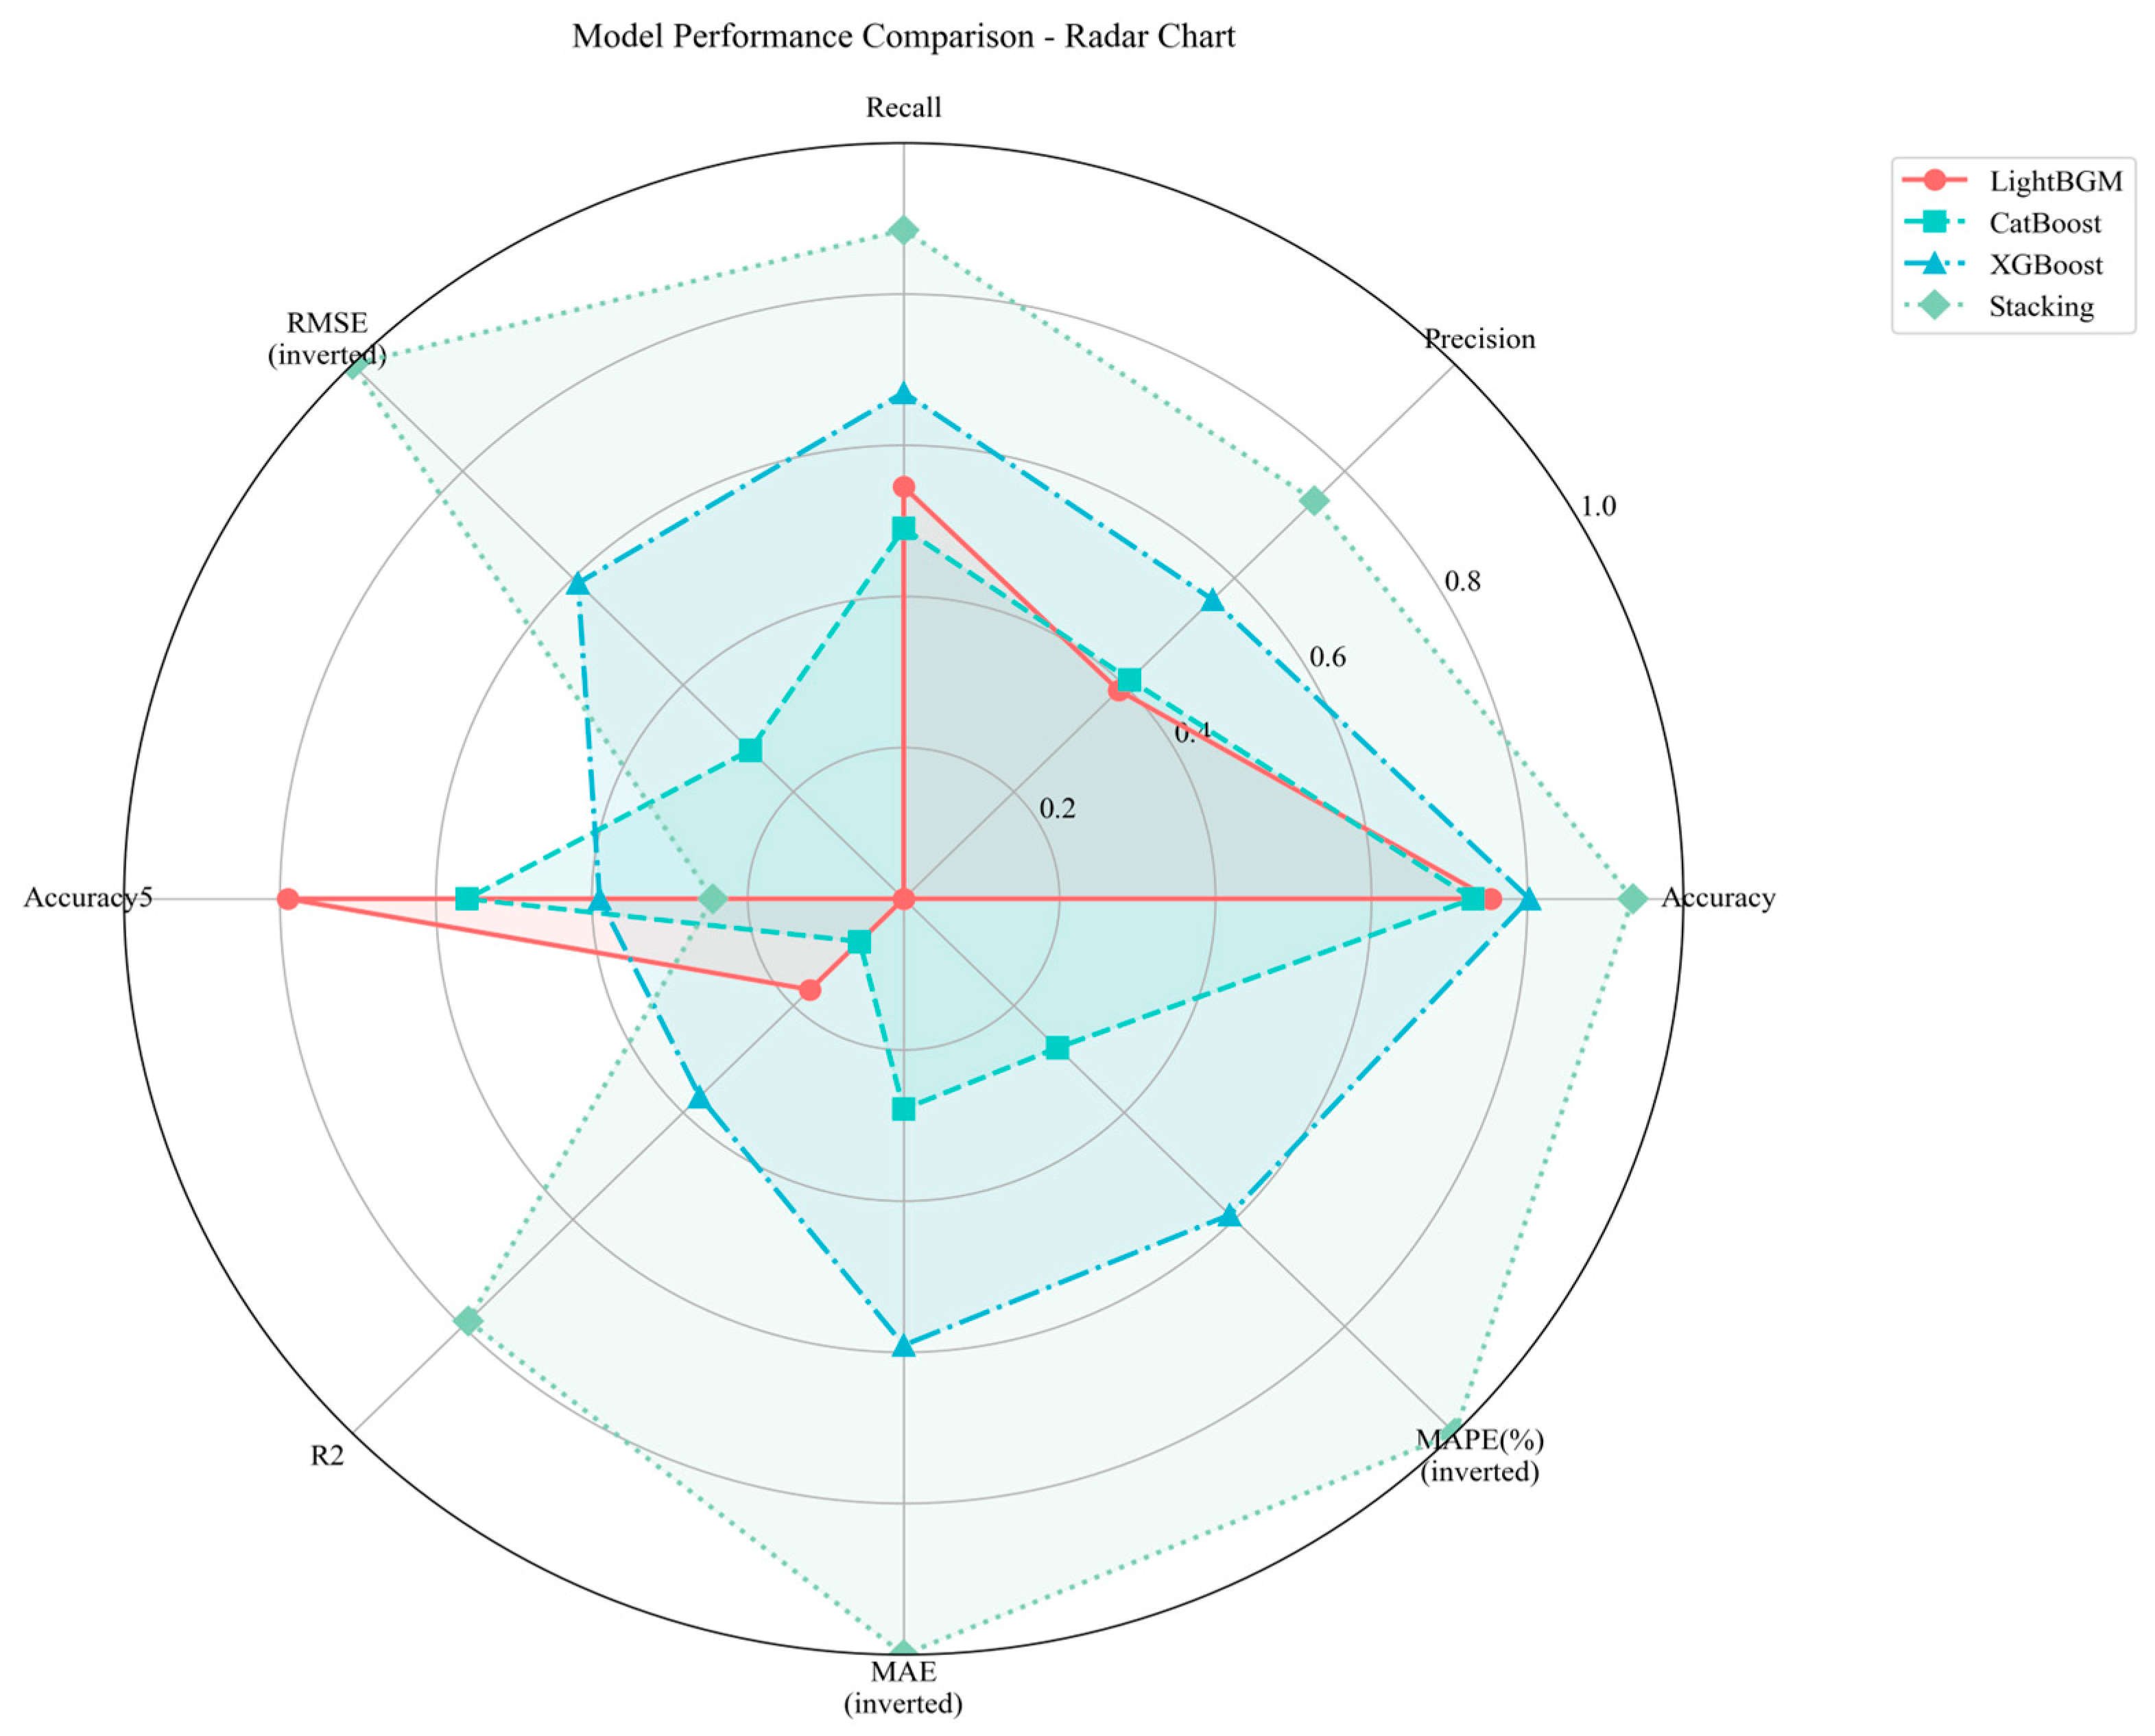
As shown in
Table 5 and
Figure 3, the Stacking fusion model achieved superior performance across all key metrics. It attained an Accuracy
5 of 0.674, a Precision of 0.649, and a Recall of 0.677, outperforming each individual benchmark algorithm. Furthermore, the model’s R
2 value reached 0.679, indicating a significantly better goodness-of-fit compared to the single models (LightGBM: 0.617, XGBoost: 0.637, CatBoost: 0.608). Concurrently, the RMSE was reduced to 214.59, which represents a 16.6% improvement over the second-best model (XGBoost). These results collectively demonstrate the higher predictive accuracy of the proposed Stacking framework.
The practical utility of the model is further evidenced by the replenishment forecasting results presented in
Table 6. For instance, the forecast indicates a required replenishment quantity of 189 units for product P448 in warehouse wh30 for seller S19, showcasing the model’s direct applicability to real-world inventory management decisions.
3.4. Experimental Design for Sensitivity Evaluation
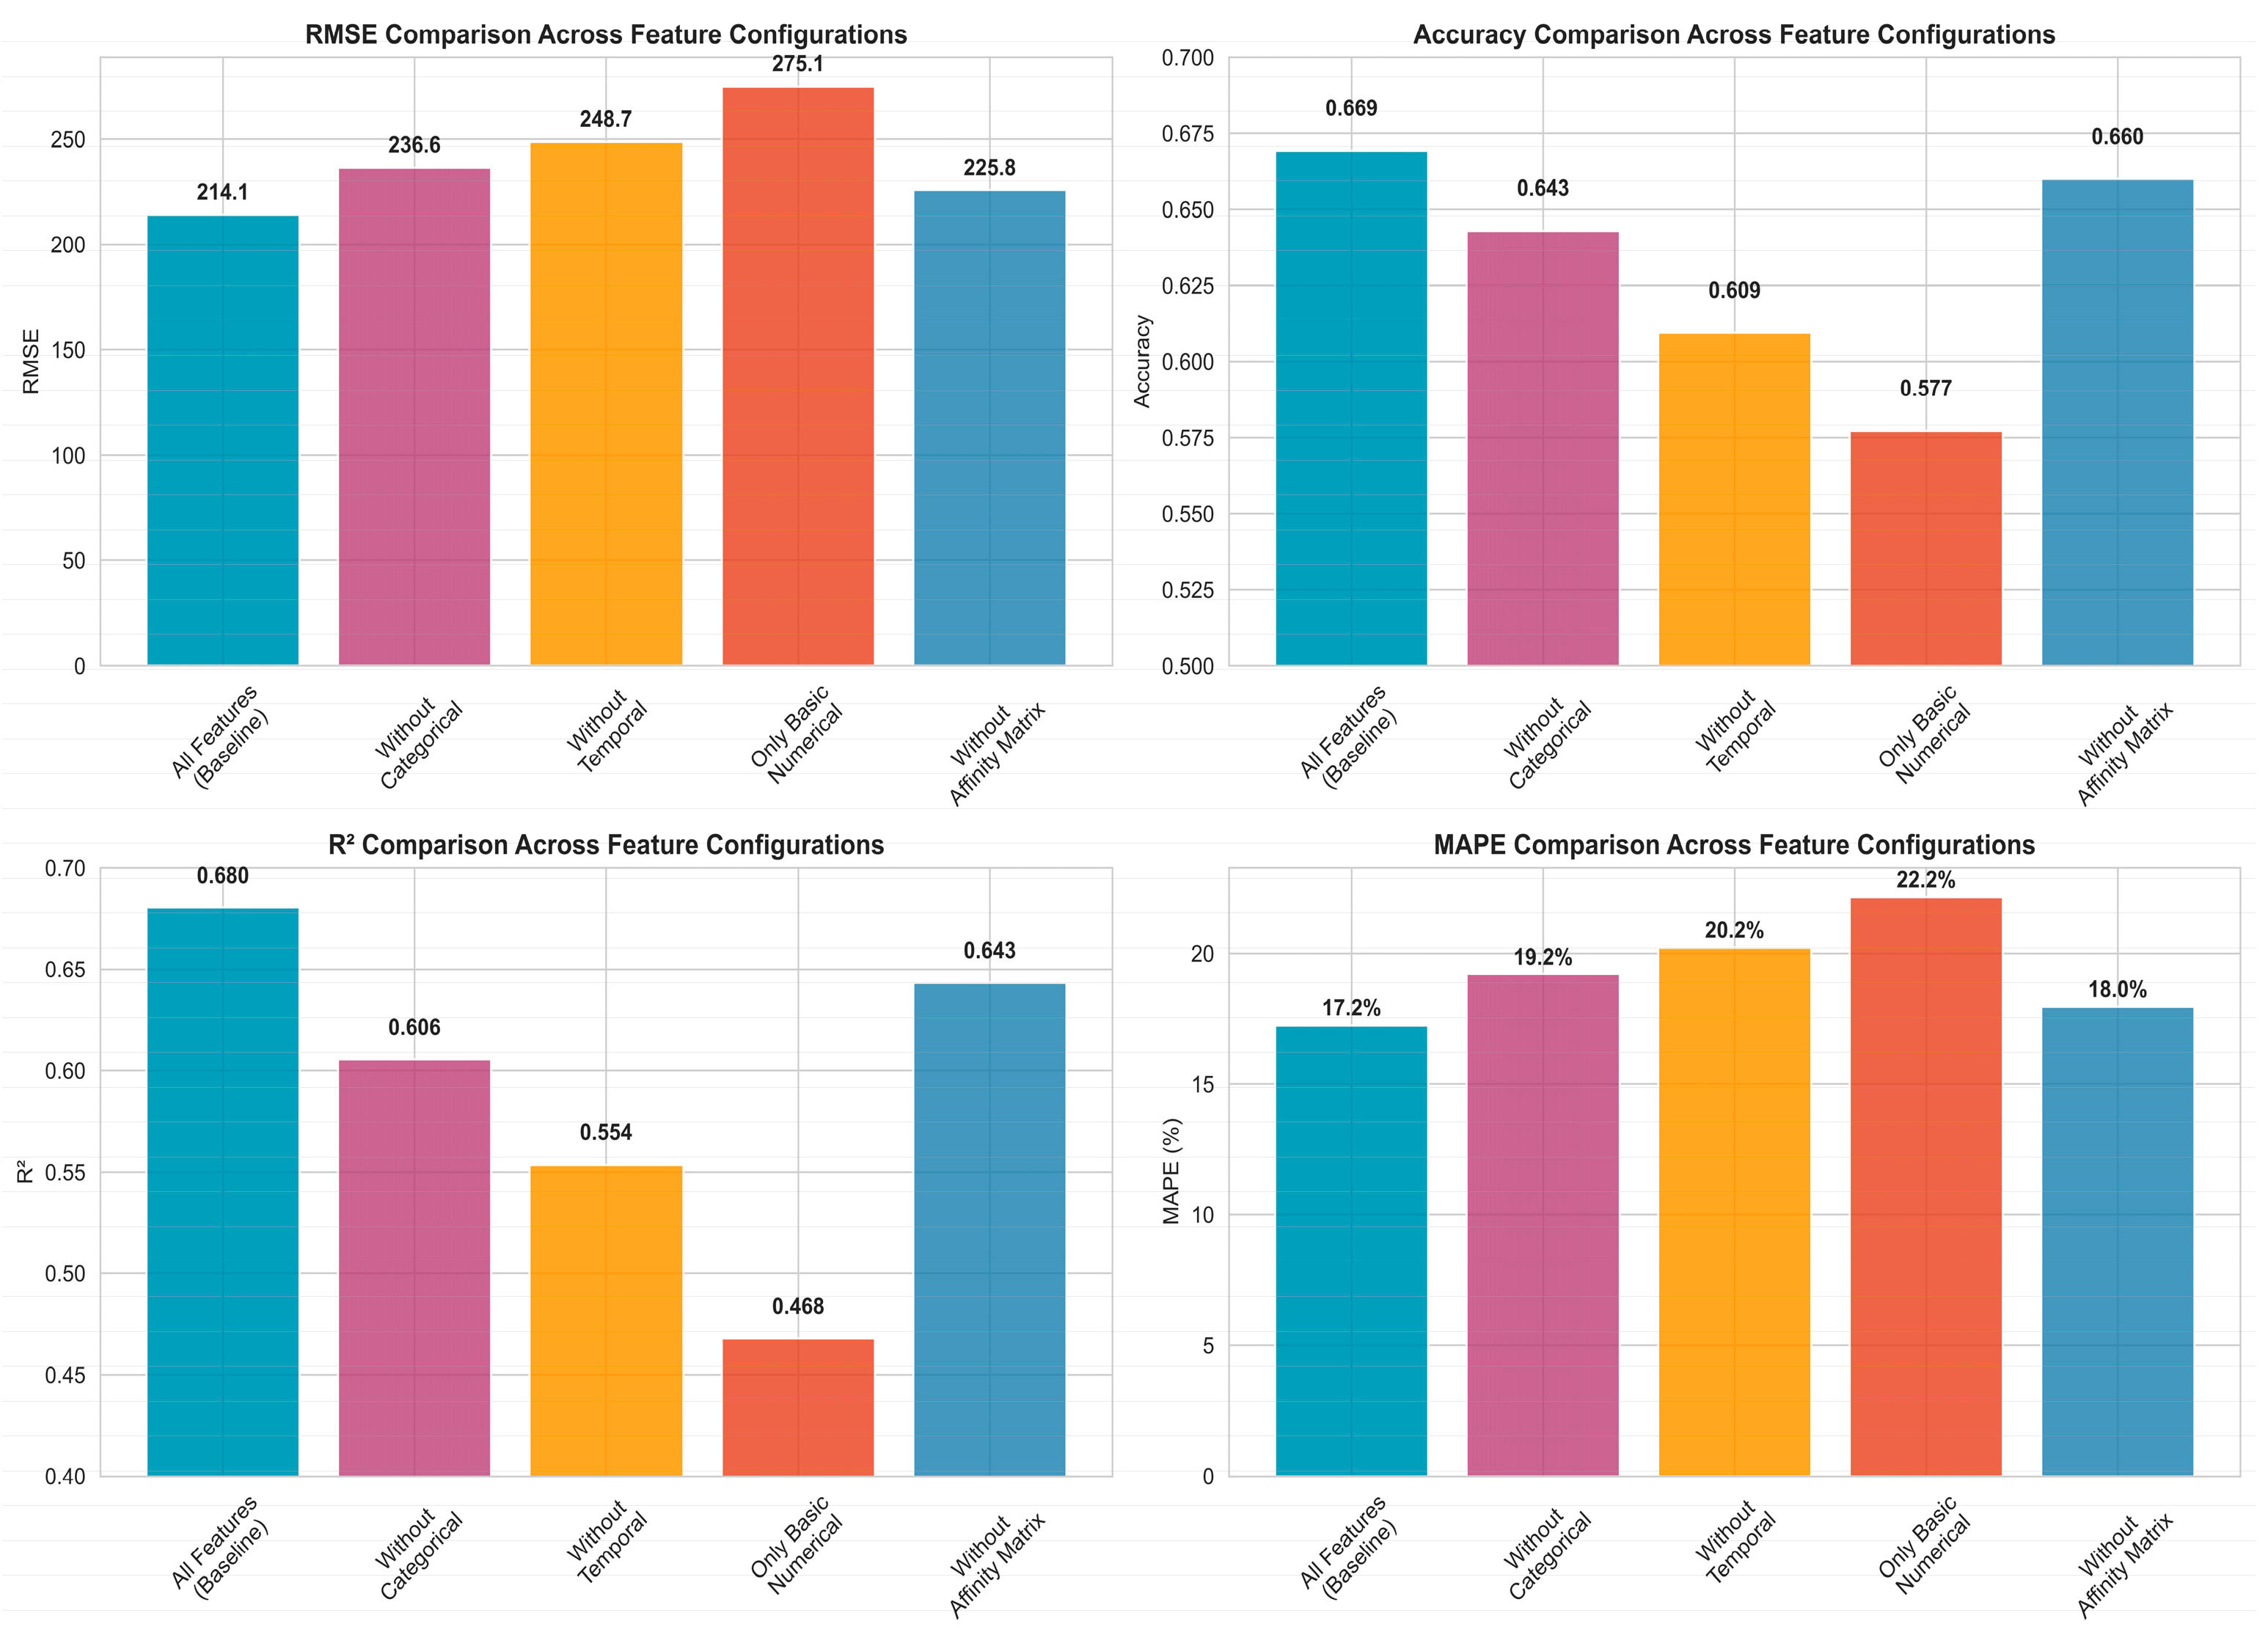
To comprehensively evaluate the robustness of the proposed Stacking framework, we conducted a systematic sensitivity analysis under multiple feature configurations. This analysis was designed to address two key aspects: the model’s dependency on specific types of features and the importance of appropriately handling categorical features within the ensemble components. Accordingly, five distinct experimental configurations were designed:
- (1)
All available features, including categorical, temporal, numerical, and affinity matrix features;
- (2)
Exclusion of categorical features to evaluate CatBoost’s capability in processing categorical data;
- (3)
Removal of temporal features to assess time-series dependencies;
- (4)
Only basic numerical features (sales and inventory data);
- (5)
Exclusion of the affinity matrix to measure the importance of cross-product relationships.
All experiments maintained identical hyperparameter settings and employed 5-fold time-series cross-validation to ensure consistent evaluation conditions.
As illustrated in
Figure 4, the configuration “Without Categorical” features, for example, shows that the RMSE increased from 214.1 to 236.6, while the R
2 value decreased from 0.690 to 0.606. These results further confirm the performance degradation and highlight the crucial role of categorical feature encoding in demand forecasting accuracy.
Figure 5 displays a heatmap of the relative performance degradation, illustrating the percentage changes in other configurations compared to the baseline. Shades of red indicate performance deterioration, whereas shades of blue represent performance improvement. The most pronounced performance decline is observed in the configurations excluding categorical features and using only basic numerical features. The heatmap clearly indicates that temporal features represent the second most critical feature category, with an average performance drop of 17% across all metrics. This finding aligns with the time-series nature of demand forecasting. Meanwhile, the removal of the affinity matrix resulted in the mildest performance impact (average decrease of 5.1%), suggesting that although cross-product relationships help improve prediction accuracy, their absence can be partially compensated by other feature types in the Stacking framework.
4. Modeling and Validation with Seasonal Factors
4.1. Model Construction
This study employs a Stacking ensemble model to capture complex nonlinear relationships and feature interactions, while utilizing a Seasonal Autoregressive Integrated Moving Average (SARIMA) time series model to account for the linear temporal dependencies present in the residuals of the Stacking predictions. The specific procedure is as follows: First, the Stacking ensemble model is trained on the training dataset. Predictions are then generated on the training set
, and the corresponding residuals are computed as shown in Equation (1).
Second, these residual series are subsequently treated as a new time series and used to train a SARIMA model. By incorporating seasonal hyperparameters (P,Q,D)and a period parameter m, the SARIMA framework extends the standard SARIMA (p,d,q) model [
24,
25], resulting in a composite (p,d,q) (P,Q,D,m) structure capable of effectively capturing seasonal variations. The construction of the seasonal factors (P,Q,D,m) model involves the following steps:
The model construction process involved the following steps:
- (1)
Seasonal Differencing: Seasonal differencing of order D (with period m = 7 days) was applied to the original series to remove periodic effects.
- (2)
Trend Differencing: Ordinary differencing of order d was performed to eliminate trend components, yielding the series described by Equation (2).
- (3)
Additive Modeling: The differenced series was expressed as a linear combination of autoregressive and moving average terms, both seasonal and non-seasonal.
The trained models are subsequently applied to the test set. Specifically, the initial predictions
are generated using the Stacking model, after which the corresponding residuals are forecasted by the SARIMA model to obtain values
. The final predictions are then computed as shown in Equation (3).
4.2. Results Analysis
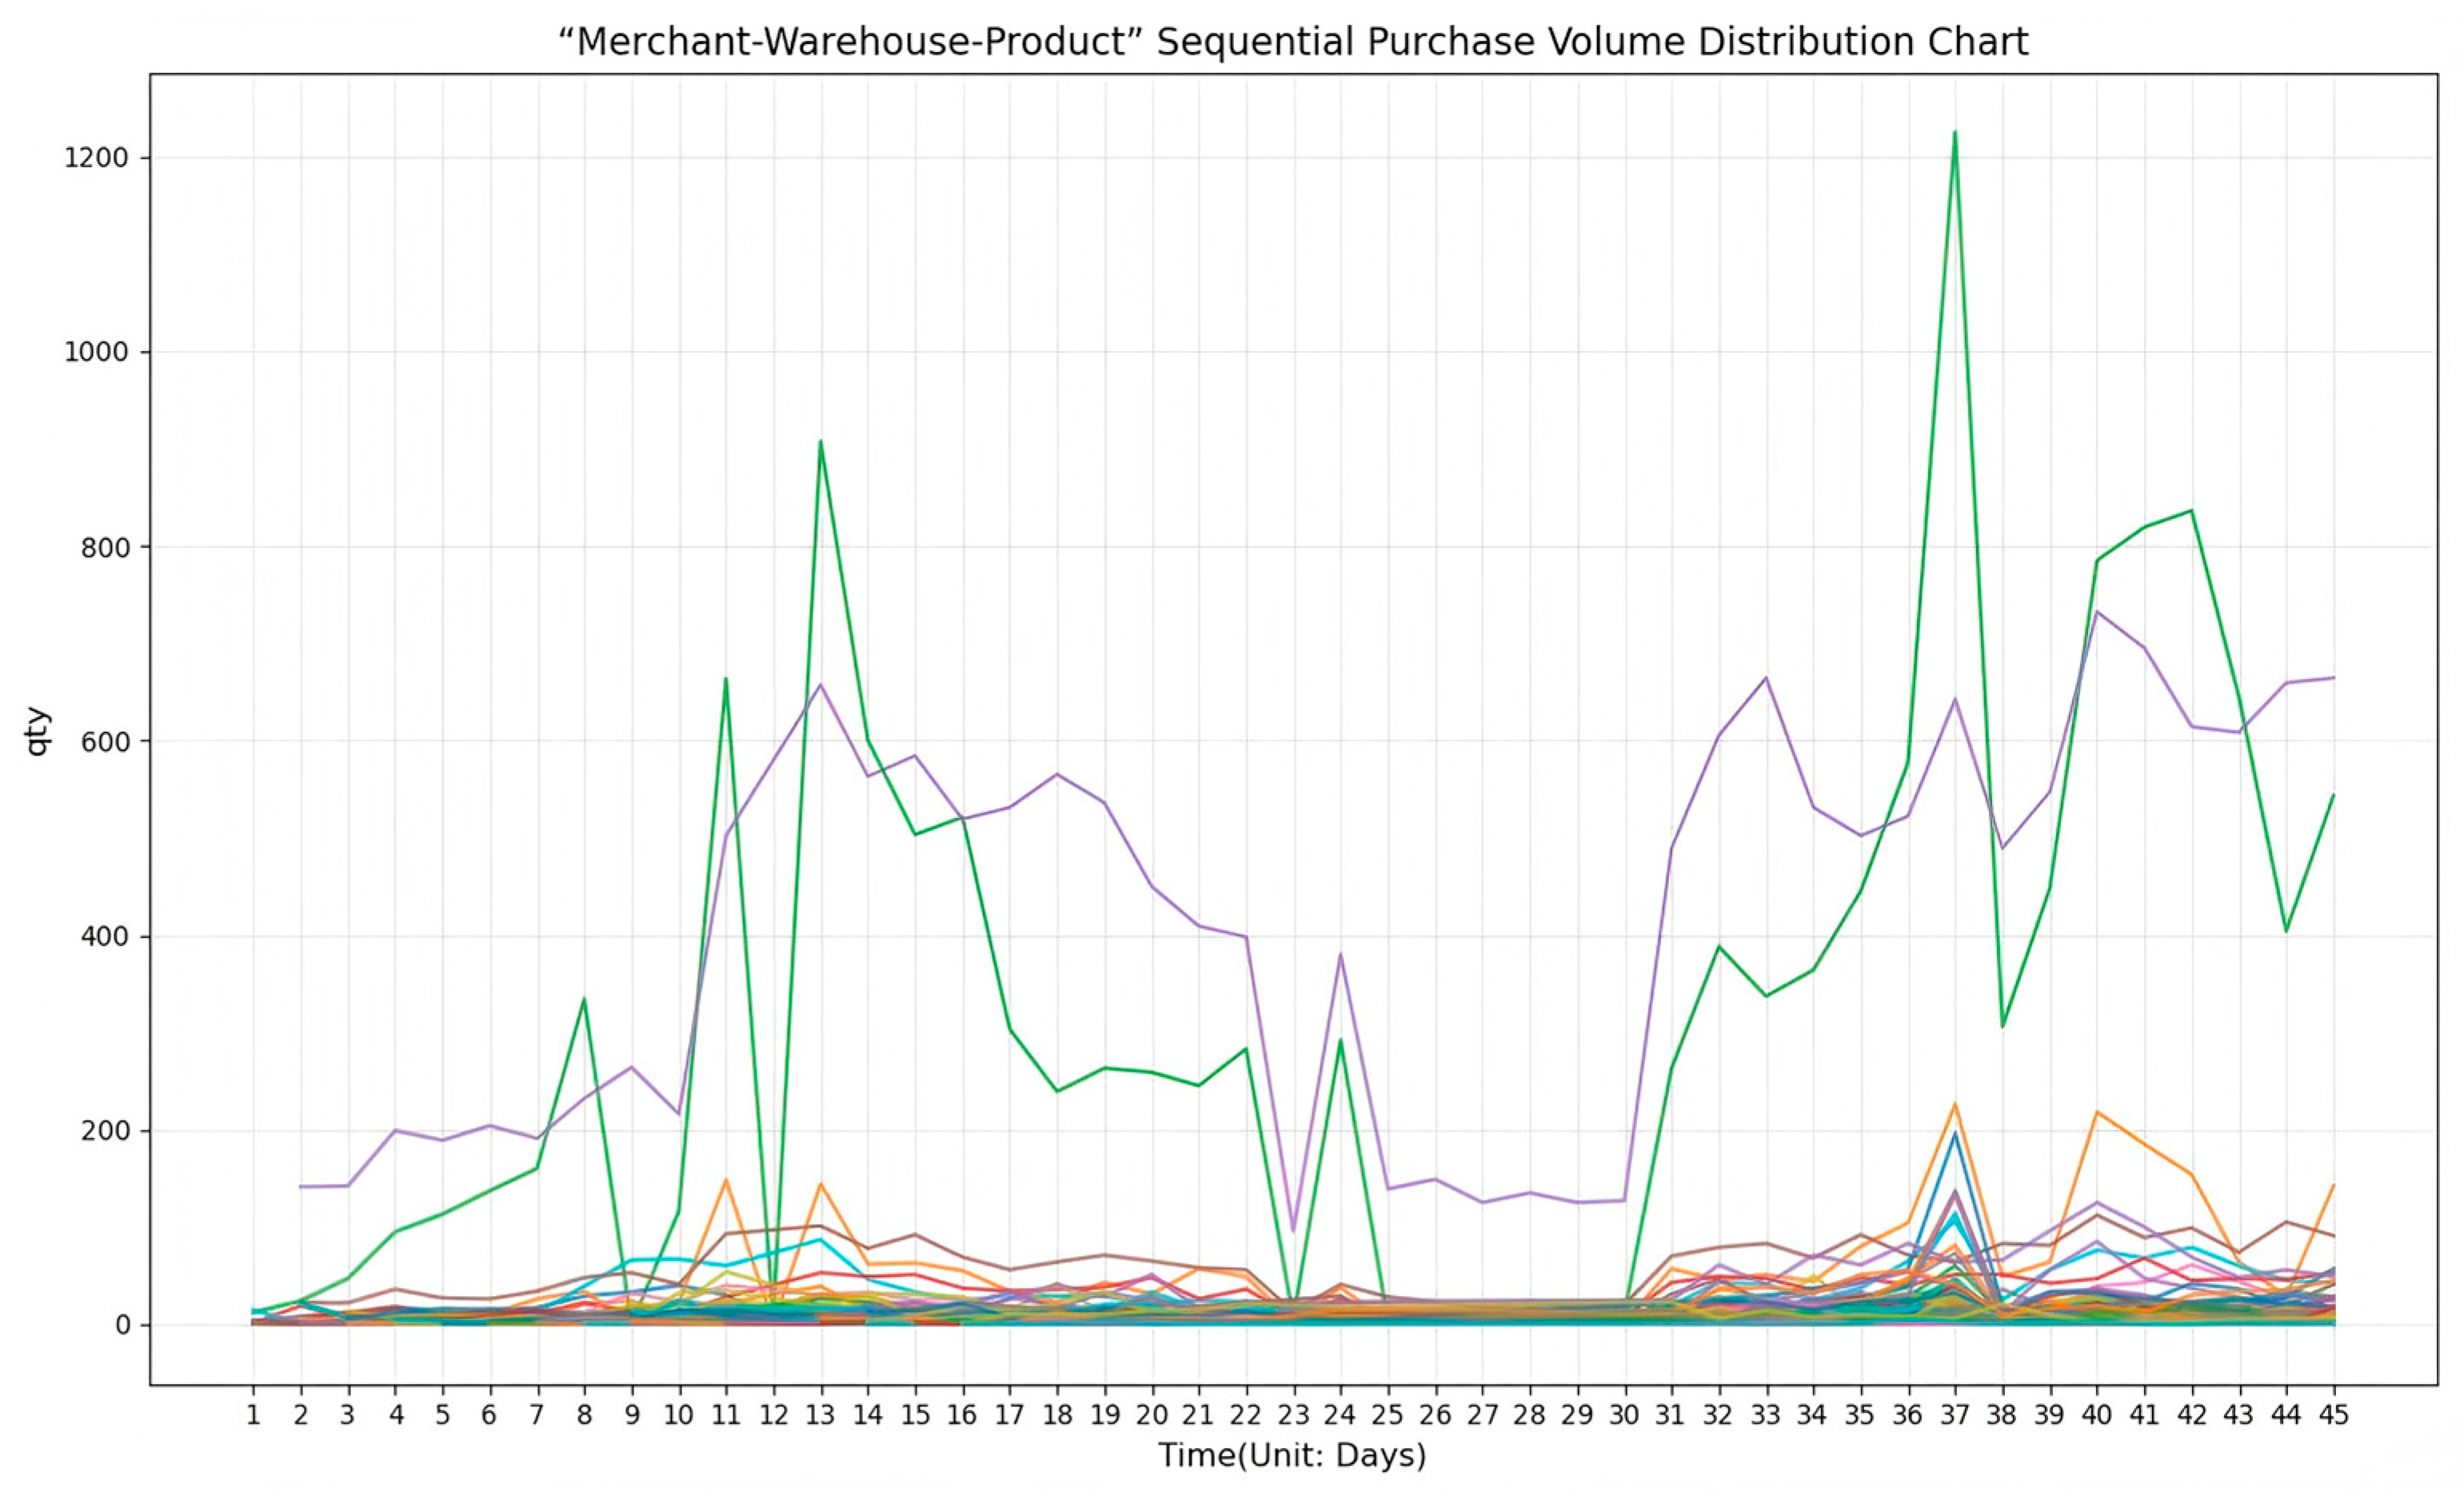
For each merchant-warehouse-product combination, daily data were analyzed. The investigation revealed the emergence of new product types within specific merchant-warehouse pairs. The visualized demand trends over time are presented in
Figure 6, where each curve represents a unique warehouse-product sequence. Notably, the sequences exhibit convergent trend patterns.
To validate the model’s demand forecasting performance for replenishment quantities under seasonal influences against actual observations, the demand forecasts and actual values were treated as two separate sequences. The inner product of these sequences was computed using Equation (4), and their similarity was quantified via cosine similarity (Equation (5)). Sequences exhibiting redundant relationships within the dataset were eliminated prior to this analysis.
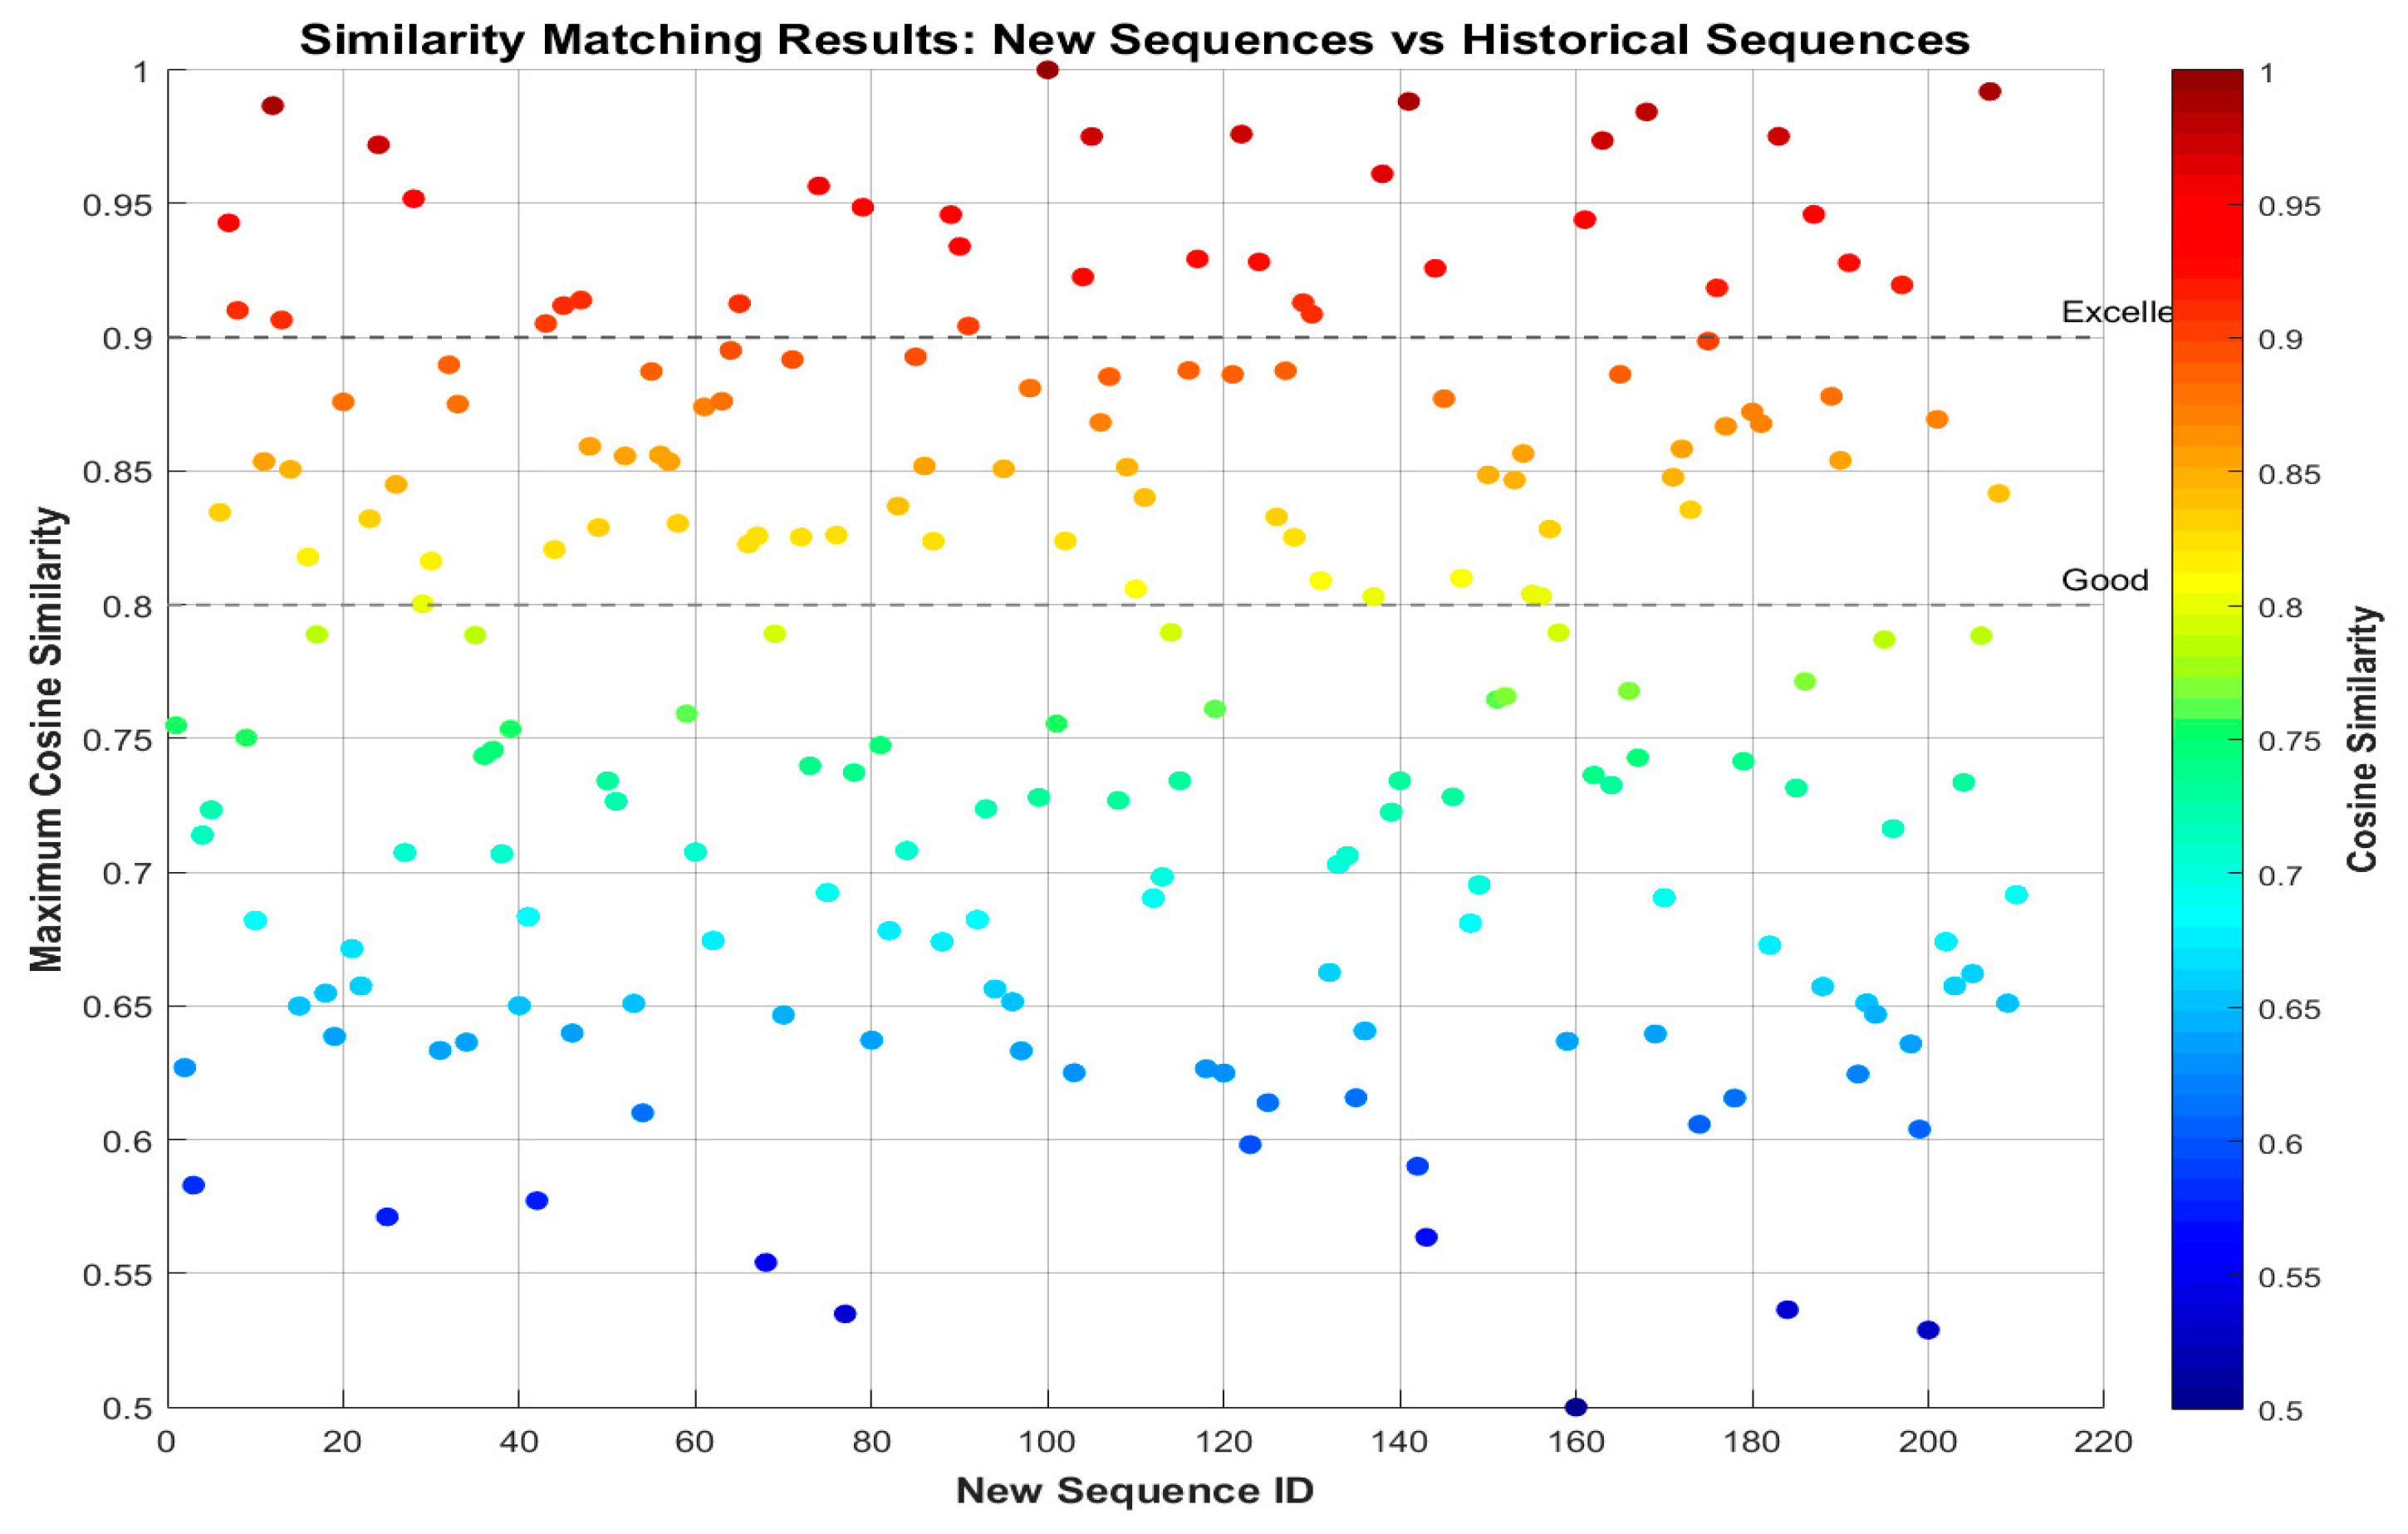
The experimental results indicate that by calculating the cosine similarity between the forecasted and actual sequence vectors, the historical sequence with the highest similarity to the forecast period can be identified. A scatter plot of these similarity matching results is shown in
Figure 7. The plot clearly demonstrates that the cosine similarity values approach 1, indicating strong alignment between the sequences. For optimal matching, historical sequences temporally proximate to the forecast period were prioritized, showing consistent demand patterns. After removing redundant sequences, the feature vectors retained displayed a highly concentrated distribution of similarity scores, further corroborating the effectiveness of the proposed model in capturing seasonal variations.
Furthermore, the sequence indices were mapped back to their actual values. The corresponding cosine similarity metrics for selected sequences are listed in
Table 7. The forecasting results for 210 merchant-warehouse-product sequences indicate synchronous demand trends across sequences, with a mean cosine similarity of 0.986 (range: [0.958, 1.00]). This high level of similarity validates the model’s stability in replicating seasonal characteristics.
4.3. Model Validation
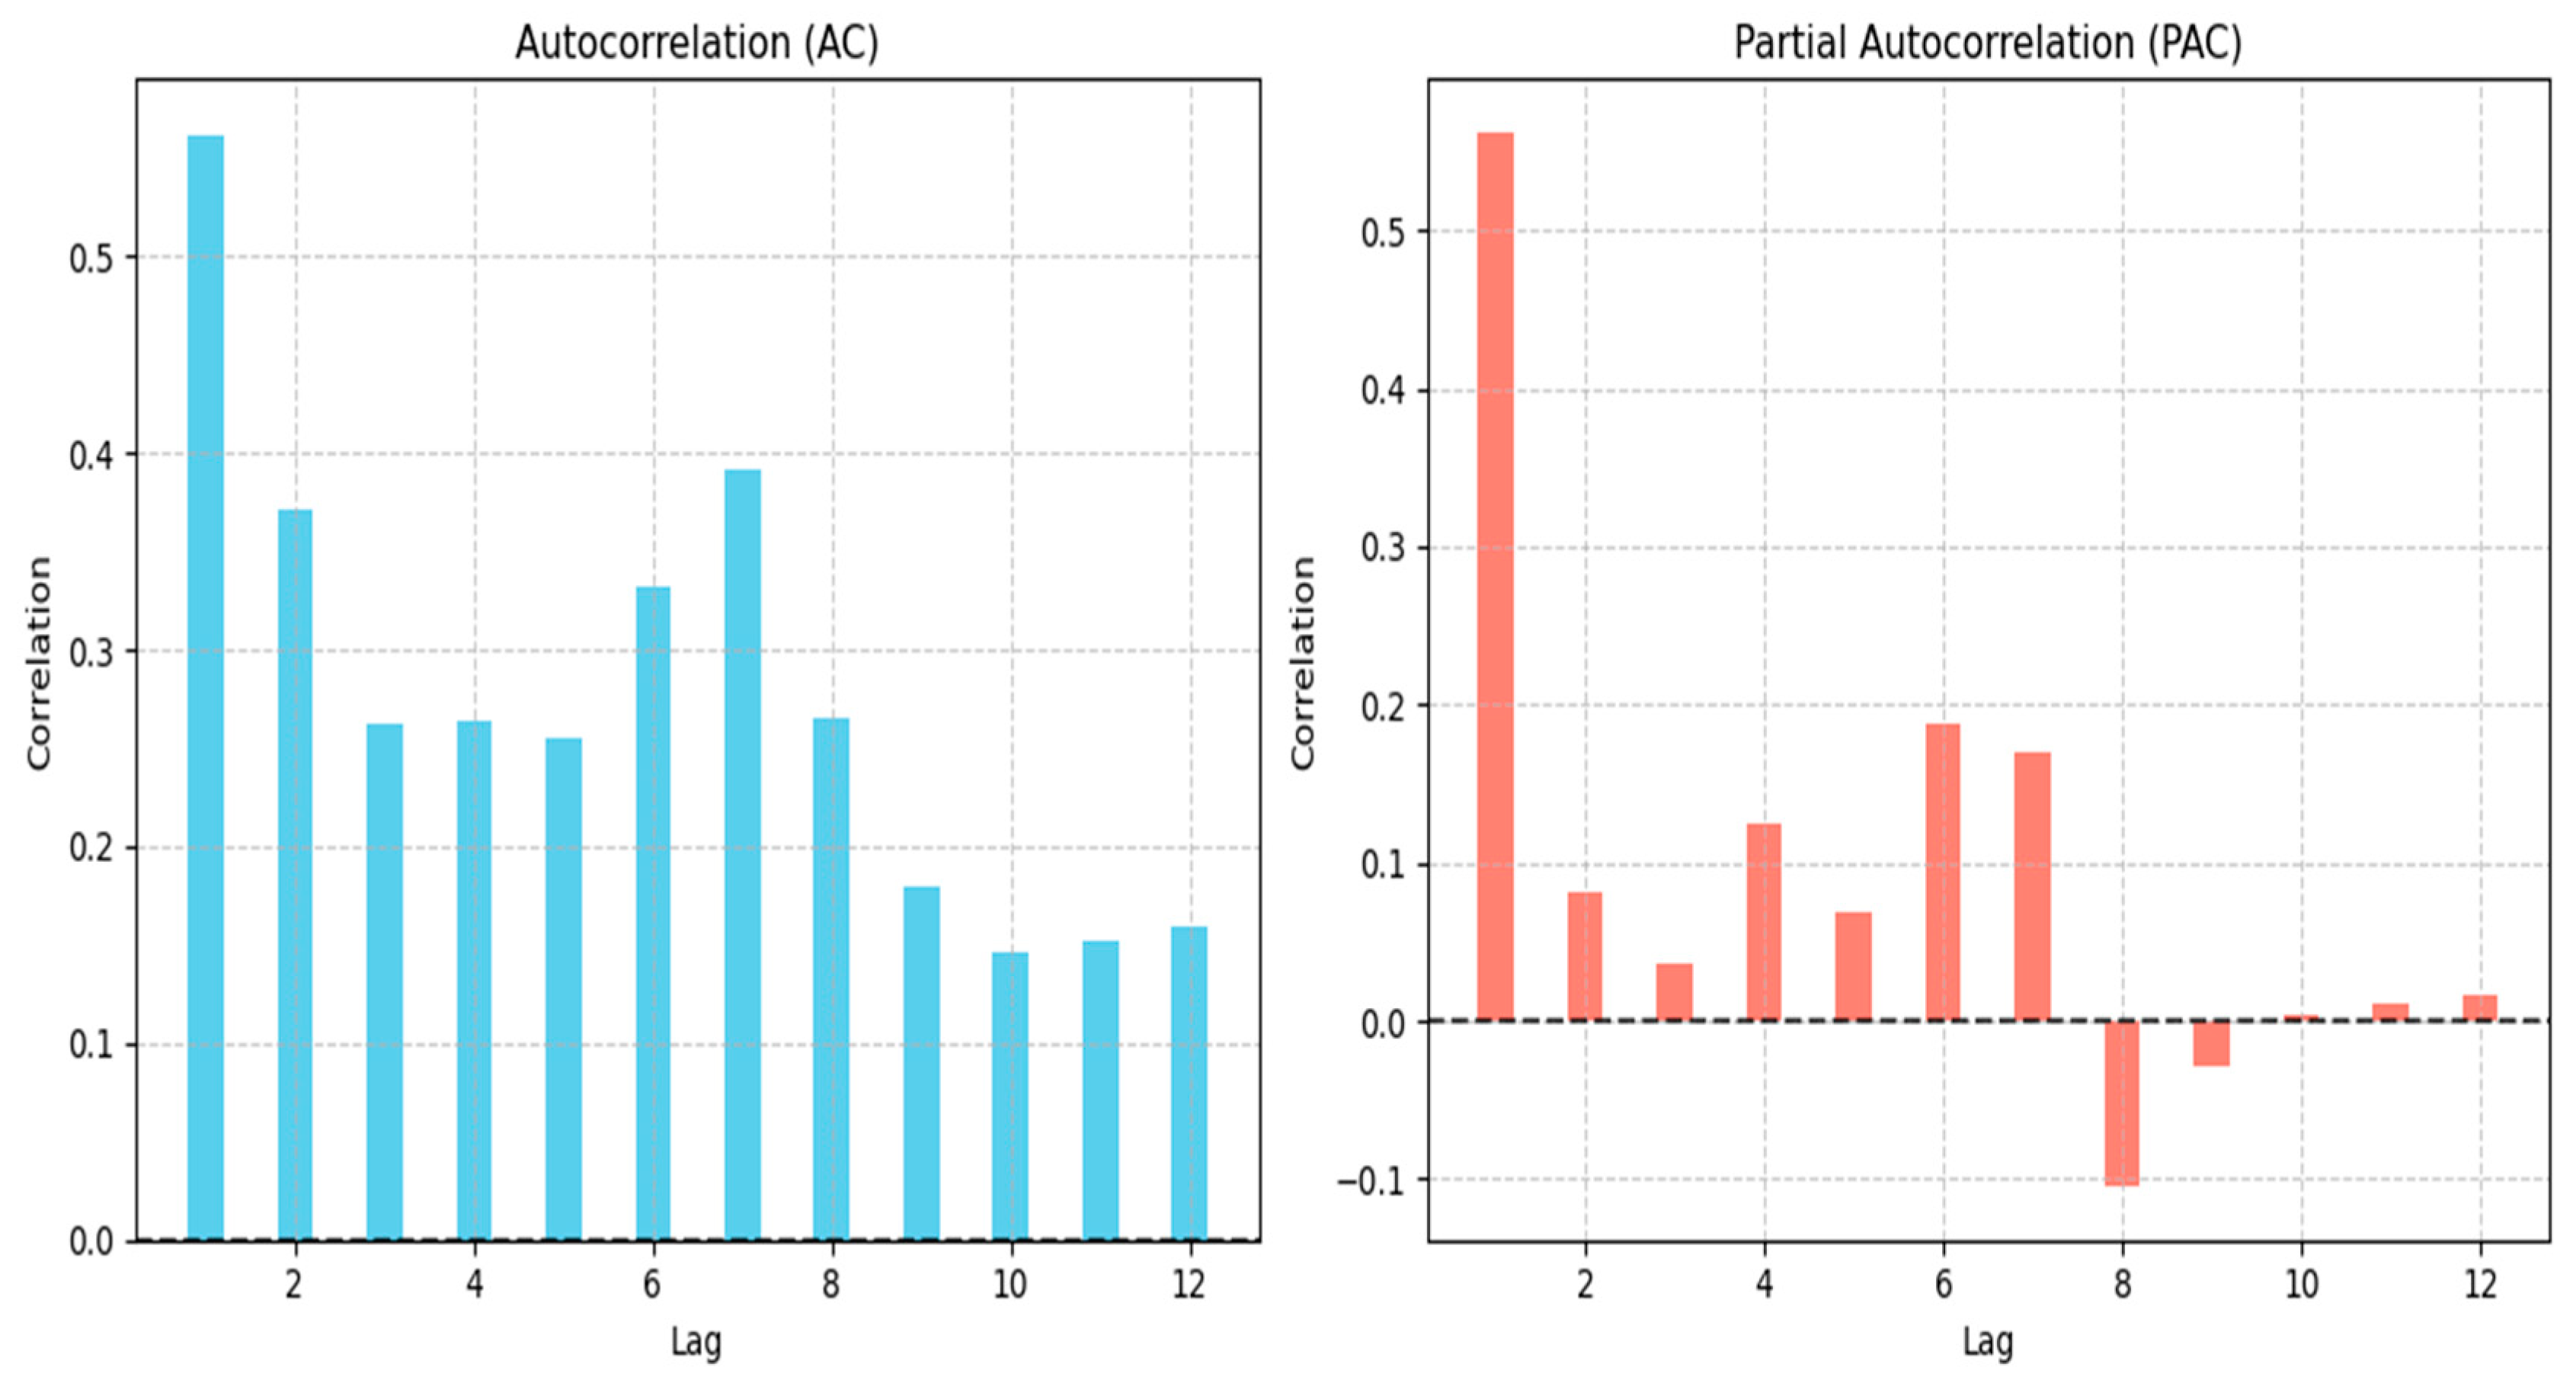
Given the extensive volume of data, this section presents the validation results for a representative case: Product 430 in Warehouse 23 belonging to Merchant 19. The autocorrelation function (AC) and partial autocorrelation function (PAC) plots against the lag order are shown in
Figure 8 and
Table 8, respectively.
A systematic analysis of the AC plot (
Table 8) for this specific case reveals a significant autocorrelation of 0.562 at lag 1. The AC gradually decreases from lag 2 to lag 5, indicating strong short-term temporal dependencies. Secondary peaks observed at lags 6 and 7 (AC = 0.332 and 0.391, respectively) suggest the presence of seasonal patterns. Meanwhile, the PAC decays rapidly after lag 2 and even exhibits negative values, implying weak independent influences from higher-order lags. These characteristics collectively indicate stationarity in the time series for this merchant-warehouse-product combination.
The stationarity is further confirmed by the ARIMA diagnostic test (α= 0.01) results depicted in
Figure 8. The autocorrelation coefficients decline gradually starting from lag 1 but do not truncate abruptly to zero, exhibiting a “trailing off “pattern. While some coefficients at specific lags fall outside the confidence bounds, the overall behavior confirms that the series meets the prerequisites for SARIMA modeling.
As indicated in
Table 9, employing a SARIMA (2,1,2) model for forecasting yields a practical outcome: a recommended replenishment quantity of 5 units for Product 3 (S1) in Warehouse WH5. This result underscores the practical utility of the proposed model in addressing seasonal demand forecasting within supply chain management.
5. Discussion
This study successfully developed and validated a Stacking-based fusion model integrated with seasonal decomposition for dynamic e-commerce demand forecasting. A key finding is that the proposed ensemble framework consistently outperforms several strong baseline models—XGBoost, LightGBm, and CatBoost—across a comprehensive set of evaluation metrics. The higher R
2 values and lower RMSE indicate improved variance explanation and superior predictive accuracy. This performance gain can be attributed to the Stacking architecture’s ability to leverage the complementary strengths of multiple base learners, thereby capturing diverse patterns within the high-dimensional and complex feature space typical of e-commerce data [
2,
5]. By synthesizing these predictions through a meta-learner, the model effectively reduces individual biases and variances of base estimators, yielding more robust and generalizable forecasts.
Another important result is the model’s demonstrated capacity to identify and represent seasonal fluctuations. The high mean cosine similarity (0.986) between forecasted and actual demand sequences strongly suggests that the integrated SARIMA component successfully captured recurring seasonal trends. This was further corroborated by AC/PAC analyses, which revealed both short-term dependencies and weekly seasonal effects, formally incorporated via the SARIMA (p,d,q) (P,D,Q,m) formulation. These findings resonate with existing literature on the critical role of seasonality in retail forecasting [
4,
11], while extending prior work through the seamless integration of a classical time series model within a modern machine learning ensemble. The practical value of this hybrid approach is illustrated through SKU-level replenishment guidance, as exemplified by the case of Product P448 in Warehouse WH30, translating statistical gains into actionable inventory decisions—a crucial advantage in supply chain operations.
Nevertheless, several limitations warrant attention. First, model validation was conducted on data from a single platform over a limited period. Generalizability to other e-commerce contexts—such as those with differing product lifecycles or business models—and long-term stability under volatile conditions remain to be examined. Second, although the model incorporates a range of influential features, it omits certain external factors such as macroeconomic indicators, competitor actions, or granular marketing campaign data, which may enhance predictive realism. Third, while sensitivity analysis using 5-fold time-series cross-validation ensured evaluation consistency (
Section 3.4), a more rigorous assessment of model robustness—such as repeated cross-validation with varying fold numbers (e.g., 10 or 15) or testing under noisy or adversarial conditions [
26,
27]—has not been conducted and represents an important area for future validation.
Looking forward, subsequent research could focus on integrating the aforementioned external variables and exploring advanced deep learning architectures (e.g., Temporal Fusion Transformers or LSTMs) to capture more intricate temporal dependencies. Additionally, developing adaptive mechanisms to handle concept drift in fast-evolving e-commerce settings would further enhance the model’s applicability. Systematic data perturbation tests—injecting noise into features or target variables—along with repeated SHAP analysis over multiple runs to ensure consistent feature attribution, will be essential to verify operational reliability prior to deployment.
It should also be noted that the proposed fusion architecture entails certain inherent constraints. The end-to-end complexity, arising from the cascade of a Stacking ensemble and a SARIMA model, introduces non-trivial computational overhead, potentially hindering deployment in high-frequency or near real-time forecasting scenarios. Moreover, interpretability is partially compromised. Despite the strong predictive performance of the Stacking ensemble, its black-box nature complicates traceability of specific prediction drivers. This issue is exacerbated when SARIMA corrects the ensemble’s residuals, further complicating output attribution. Such limited interpretability could restrict the model’s use in high-stakes or transparency-sensitive decision contexts. Finally, the framework’s adaptability to sudden market shifts—such as breaks in historical seasonal patterns—has not been thoroughly evaluated and remains an open question.
In conclusion, this study introduces an accurate and robust framework for e-commerce demand forecasting. The synergistic combination of a Stacking ensemble and a seasonal time series model yields clear improvements over conventional forecasting techniques. By delivering precise, SKU-level forecasts that account for seasonal behavior, this model lays a solid foundation for enhancing inventory allocation, reducing holding costs, and strengthening end-to-end supply chain agility.
6. Conclusions
To effectively support inventory cost control and goods allocation in e-commerce warehousing, this study developed a sophisticated demand forecasting framework based on a Stacking ensemble that integrates XGBoost, LightGBM, and CatBoost. Hyperparameters were systematically optimized using cross-validation, and experimental evaluations confirmed that the proposed model outperforms individual base learners, achieving accurate demand predictions at the merchant-warehouse-product level.
To explicitly capture seasonal fluctuations in the time series, a SARIMA component was incorporated into the modeling architecture. Validation results verify the model’s capability to handle short-term forecasts under seasonal influences. Moreover, its consistent performance across repeated cross-validation runs offers a positive indication of robustness.
While these outcomes are encouraging, further improvements are possible—particularly in enhancing the model’s generalizability and adaptability to more complex business environments. Future work will investigate advanced frameworks such as deep temporal neural networks, with the aim of delivering more robust and precise decision support for intelligent warehouse management in dynamic e-commerce settings.
Author Contributions
Conceptualization, L.N.; Data curation, Z.H.; Investigation, L.N.; Methodology, N.F.; Project administration, N.F.; Resources, Z.H.; Validation, Z.H.; writing—original draft, L.N. and Z.H.; writing—review & editing, L.N. and Z.H. All authors have read and agreed to the published version of the manuscript.
Funding
This work was supported in part by the Tianfu Jiangxi Laboratory Achievement Transformation Funding Project “Cloud Edge Collaborative Multi Protocol Gateway AI Intelligent IoT Industrial Equipment Data Collection Platform” under Grant 24090210.
Data Availability Statement
The raw data supporting the conclusions of this article will be made available by the authors on request.
Acknowledgments
The authors would like to acknowledge Guang’an Institute of Technology and Tianfu Jiangxi Laboratory for the financial support in carrying out this research.
Conflicts of Interest
The authors declare that they have no competing interests.
References
- Xie, W. Cross-Border E-Commerce Sales Forecasting Based on Machine Learning. Master’s Thesis, Jilin University, Changchun, China, 2024. [Google Scholar] [CrossRef]
- Jain, A.; Karthikeyan, V. Demand Forecasting for E-Commerce Platforms. In Proceedings of the 2020 IEEE International Conference for Innovation in Technology (INOCON), Bangluru, India, 6–8 November 2020; pp. 1–4. [Google Scholar] [CrossRef]
- Li, X.L.; Xiao, J.L.; Liu, M.J. Ship traffic flow prediction based on SARIMA model. J. Wuhan Univ. Technol. Transp. Sci. Eng. 2017, 41, 329–332+337. [Google Scholar]
- Xiao, G.D.; Chen, X.S.; Luo, Y.J. Establishment and preliminary application of a prediction model for tuberculosis case data in a hospital in Tibet based on SARIMA and LSTM. J. Army Med. Univ. 2025. [Google Scholar] [CrossRef]
- Miao, F.S.; Li, Y.; Gao, C.; Wang, M.J.; Li, D.M. Diabetes prediction method based on CatBoost algorithm. Comput. Syst. Appl. 2019, 28, 215–218. [Google Scholar] [CrossRef]
- Li, X.; Wu, Y.Q.; Wang, J.W.; Yang, W.C.; Zhan, T.Y. Real-time prediction of urban water consumption based on SVM-SARIMA-LSTM model. Water Resour. Power 2025, 43, 36–39. [Google Scholar] [CrossRef]
- Qian, M.J.; Li, M.L.; Huang, X. Railway freight volume forecasting method based on SARIMA-SVR model. Railw. Transp. Econ. 2024, 46, 83–94. [Google Scholar] [CrossRef]
- Wang, Y.; Guo, Y.K. Application of improved XGBoost model in stock prediction. Comput. Eng. Appl. 2019, 55, 202–207. [Google Scholar]
- Yuan, S.Y. Research on agricultural product price index prediction method based on hybrid XGBoost model. Price Theory Pract. 2025. [Google Scholar] [CrossRef]
- Xie, Y.; Xiang, W.; Ji, M.Z. Application analysis of housing rent prediction based on XGBoost and LightGBM algorithms. Comput. Appl. Softw. 2019, 36, 151–155+191. [Google Scholar]
- Sun, J.Y.; Wei, C. Gold futures price prediction based on text sentiment analysis and LightGBM-LSTM model. J. Nanjing Univ. Inf. Sci. Technol. 2025. [Google Scholar] [CrossRef]
- Lu, P.; Nian, S.Q.; Zou, G.L.; Wang, Z.H.; Zheng, Z.S. Research on wave height prediction method based on deep learning and CatBoost. Trans. Oceanol. Limnol. 2024. [Google Scholar] [CrossRef]
- Raizada, S.; Saini, J.R. Comparative analysis of supervised machine learning techniques for sales forecasting. Int. J. Adv. Comput. Sci. Appl. 2021, 12, 11. [Google Scholar] [CrossRef]
- Wang, B.X. Bank Credit Card Customer Churn Prediction Based on Stacking Model Fusion. Master’s Thesis, Lanzhou University, Lanzhou, China, 2022. [Google Scholar] [CrossRef]
- Lin, J.Y.; Xia, Y.F.; Zhang, H.L.; Chen, K.L.; Fang, S.T. An urban rent prediction model based on Stacking ensemble machine learning. J. Sichuan Univ. Nat. Sci. Ed. 2025, 62, 1264–1269. [Google Scholar]
- Mohammed, A.S.; Asteris, P.G.; Koopialipoor, M.; Alexakis, D.E.; Lemonis, M.E.; Armaghani, D.J. Stacking ensemble tree models to predict energy performance in residential buildings. Sustainability 2021, 13, 8298. [Google Scholar] [CrossRef]
- Shi, J.Q.; Zhang, J.H. Load forecasting method based on multi-model fusion Stacking ensemble learning. Proc. CSEE 2019, 39, 4032–4042. [Google Scholar] [CrossRef]
- Feng, L.B.; Huang, D.S.; Zheng, Y.H. Volatility forecasting in China’s precious metals futures market—A fusion study based on gradient boosting tree models and interpretability tools. J. Econom. 2025, 5, 584–614. [Google Scholar]
- Chen, X.L.; Zhang, C.; Huang, X.Y. Prediction of grain yield based on Bayesian-LightGBM model. J. Chin. Agric. Mech. 2024, 45, 163–169. [Google Scholar]
- Wang, C.Z.; Bai, X.M.; Tang, W.Y.; Chen, S. House price prediction model based on evolutionary CatBoost algorithm. Comput. Sci. 2024, 51. [Google Scholar]
- Zhong, X.; Sun, X.E. Research on naive Bayes ensemble method based on K-means++ clustering. Comput. Sci. 2019, 46, 439–441+451. [Google Scholar]
- Huang, Y.W.; Wang, G.S.; Mao, Z.; Liu, S. Apple leaf disease recognition method based on fusion of K-means++ and attention mechanism. Jiangsu Agric. Sci. 2024, 52, 190–198. [Google Scholar] [CrossRef]
- Cui, P.; Yang, H.F.; Cai, J.H.; Wang, Y.P. K-means-DETR object detection method based on multi-scale local clustering. Mini-Micro Syst. 2024, 45, 1136–1142. [Google Scholar] [CrossRef]
- He, J.T.; Chen, X.Y.; Tao, T.; Dai, X.D.; Huang, Y.L.; Ouyang, Z.Z.; Lv, Z.; Zhan, X.L. Research on forecasting method of furniture order demand based on SARIMA-BP combination model. Furnit. Inter. Des. 2024, 31, 26–30. [Google Scholar] [CrossRef]
- Wang, H.; Li, C.G. Commodity characteristic representation and customer preference prediction based on machine learning. Comput. Appl. Softw. 2022, 39, 158–166. [Google Scholar]
- Bihri, H.; Charaf, L.A.; Azzouzi, S.; Charaf, M.E.H. A Robust Stacking-Based Ensemble Model for Predicting Cardiovascular Diseases. AI 2025, 6, 160. [Google Scholar] [CrossRef]
- Ahmed, M.; Alasad, Q.; Yuan, J.-S.; Alawad, M. Re-Evaluating Deep Learning Attacks and Defenses in Cybersecurity Systems. Big Data Cogn. Comput. J. 2024, 8, 191. [Google Scholar] [CrossRef]
| Disclaimer/Publisher’s Note: The statements, opinions and data contained in all publications are solely those of the individual author(s) and contributor(s) and not of MDPI and/or the editor(s). MDPI and/or the editor(s) disclaim responsibility for any injury to people or property resulting from any ideas, methods, instructions or products referred to in the content. |
© 2025 by the authors. Licensee MDPI, Basel, Switzerland. This article is an open access article distributed under the terms and conditions of the Creative Commons Attribution (CC BY) license (https://creativecommons.org/licenses/by/4.0/).
