Article

De Novo Single-Cell Biological Analysis of Drug Resistance in Human Melanoma Through a Novel Deep Learning-Powered Approach

1
Department of Computer Science, King Abdulaziz University, Jeddah 21589, Saudi Arabia
2
Department of Computer Science, Albaha University, Albaha 65799, Saudi Arabia
3
Department of Physics, Chuo University, Tokyo 112-8551, Japan
*
Authors to whom correspondence should be addressed.
Mathematics 2025, 13(20), 3334; https://doi.org/10.3390/math13203334
Submission received: 13 August 2025 / Revised: 10 October 2025 / Accepted: 14 October 2025 / Published: 20 October 2025
(This article belongs to the Special Issue Computational Intelligence for Bioinformatics)

Abstract

Elucidating drug response mechanisms in human melanoma is crucial for improving treatment outcomes. Moreover, the existing tools intended to provide deeper insight into melanoma drug resistance have notable limitations. Therefore, we propose a deep learning (DL)-based approach that works as follows. First, we processed two single-cell datasets related to human melanoma from the GEO (GSE108383_A375 and GSE108383_451Lu) database and trained a fully connected neural network with five adapted methods (L1-Regularization, DeepLIFT, SHAP, IG, and LRP). We then identified 100 genes by ranking all genes from the highest to the lowest based on the sum of absolute values for corresponding weights across all neurons in the first hidden layer. From a biological perspective, compared to existing bioinformatics tools, the presented DL-based methods identified a higher number of expressed genes in four well-established melanoma cell lines: MALME-3M, MDA-MB435, SK-MEL-28, and SK-MEL-5. Furthermore, we identified FDA-approved melanoma drugs (e.g., Vemurafenib and Dabrafenib), critical genes such as ARAF, SOX10, DCT, and AXL, and key TFs including MITF and TFAP2A. From a classification perspective, we utilized five-fold cross-validation and provided gene sets using all the abovementioned methods to three randomly selected machine learning algorithms, namely, support vector machines, random forests, and neural networks with different hyperparameters. The results demonstrate that the integrated gradients (IG) method adapted in our DL approach contributed to 2.2% and 0.5% overall performance improvements over the best-performing baselines when using A375 and 451Lu cell line datasets. Additional comparison against no gene selection demonstrated that IG is the only method to generate statistically significant results, with 14.4% and 11.7% overall performance improvements.

1. Introduction

Elucidating drug response mechanisms in human melanoma can contribute to identifying effective treatments, thereby advancing drug discovery. This knowledge contributes to narrowing the search for candidate drugs in clinical trials and identifying potential drug targets [1]. Single-cell technologies, such as scRNA-seq, offer a powerful approach to provide a high-resolution view of cellular heterogeneity within tumors [2]. Recent research has utilized scRNA-seq to explore essential aspects of melanoma biology, with a focus on drug responses and treatment resistance, aiming to reveal various molecular mechanisms. Ho et al. [3] proposed SAKE, a method specifically designed for analyzing scRNA-seq data, to tackle the analytical challenges posed by high dropout rates and complex population substructures. They employed SAKE to investigate melanoma cells resistant to BRAF inhibitors, analyzing data from the Fluidigm C1 and 10x Genomics platforms. The study discovered and recognized resistance markers, such as DCT, AXL, and NRG1, which were experimentally validated. Their analysis demonstrates that resistant cells can emerge from rare populations already present before drug application, highlighting the effectiveness of scRNA-seq in uncovering drug resistance mechanisms in melanoma. However, the study mainly focused on previously published resistance markers for BRAF inhibitors, potentially limiting new discoveries. Schmidt et al. [4] utilized scRNA-seq to investigate the heterogeneity of BRAF V600E-mutant melanoma cells treated with BRAF and MEK inhibitors. The study employed pseudotime trajectory and RNA velocity analyses to explore the dynamic transcriptional states associated with both treatment sensitivity and resistance. Seven distinct cellular states were identified, with KDM5B highlighted as a pivotal marker of resistance. However, the study’s focus on a single cell line may limit the broader applicability of its findings.
Zhang et al. [5] applied single-cell RNA sequencing to analyze cells from Acral Melanoma (AM) and cutaneous melanoma (CM) samples. They identified five functional cell clusters associated with key pathways, including TGF-β, Type I interferon, Wnt signaling, cell cycle, and cholesterol efflux. AM exhibited a more immunosuppressive microenvironment, with reduced cytotoxic CD8+ T cell numbers and elevated expression of exhaustion markers PD-1 and TIM-3. While the study provides valuable insights into immune heterogeneity, its limited patient sample size and subtype-specific focus may constrain broader applicability. Egan et al. [6] developed a regulon-based approach to analyze immune cell states in melanoma utilizing scRNA-seq data. The researchers employed clustering and differential expression analysis with other computational techniques to identify four predominant immune cell states: exhausted T cells, monocyte lineage cells, memory T cells, and B cells. These identified states were subsequently validated using bulk RNA-seq data and were found to be associated with differential responses to immune checkpoint inhibitors (ICIs). The study further elucidated an interaction between monocyte lineage cells and T cell exhaustion, suggesting that monocyte lineage cells may drive T cells into a state of terminal exhaustion through mechanisms involving antigen presentation and chronic inflammation pathways. This regulon-based analysis offers a robust approach for predicting responses to ICIs; however, it is important to note the limitations associated with the small sample size of 19 and potential information loss resulting from data reduction.
Li et al. [7] characterized the immune landscape of AM, a rare subtype of melanoma, utilizing scRNA-seq data. The analysis encompassed clustering, differential expression analysis, and cell–cell interaction analysis, followed by a comparative examination with non-acral melanoma. The study revealed a suppressed immune environment in AM, characterized by a reduced presence of immune cells, including CD8+ T cells and natural killer (NK) cells, in contrast to non-acral melanoma. Furthermore, the research suggested several immune checkpoints, including PD-1, LAG-3, VISTA, and TIGIT, as targets for immunotherapy. However, despite providing valuable insights, the limited sample size and the primary focus on the comparison between AM and non-acral melanoma constrain the generalizability of the findings. Zhang et al. [8] aimed to investigate CD3ζ as a predictive biomarker for resistance to PD-1 inhibitors in melanoma. They conducted an analysis of scRNA-seq data and identified CD3ζ as a key marker. Low expression levels of CD3ζ demonstrated a strong correlation with poor prognosis, diminished immune cell infiltration, and resistance to PD-1 inhibitors. In melanoma, the augmentation of CD3ζ expression was associated with enhanced efficacy of the PD-1 inhibitor nivolumab, indicating that CD3ζ may serve as a therapeutic target to counteract resistance. However, the study’s narrow focus on CD3ζ may have overlooked other pertinent factors contributing to resistance.
Other studies have been conducted that have employed both scRNA-seq and bulk RNA-seq to investigate drug responses in melanoma. Bakr et al. [9] investigated the role of nicotinic acetylcholine receptors (CHRNs) in melanoma metastasis by first utilizing publicly available bulk RNA-seq data to conduct differential expression, correlation, and survival analyses. The results indicated that CHRNA1 is significantly expressed in metastatic melanoma and is associated with metastasis via pathways such as ZEB1 and Rho/ROCK. Further analyses demonstrated that CHRNA1 is connected to key prognosis-related genes, including DES, FLNC, CDK1, and CDC20. These findings were then validated using scRNA-seq data, confirming CHRNA1’s role as a potential prognostic marker for metastatic melanoma. However, focusing only on CHRNA1 might oversimplify the complex nature of metastasis. Wang et al. [10] examined the role of Aurora kinase B (AURKB) in suppressing the immune response against melanoma by initially conducting differential expression, immune infiltration, and survival analyses using bulk RNA-seq data. Their findings suggested that AURKB inhibits immune activity by modulating signaling between tumor cells and lymphocytes. The researchers further validated these results using scRNA-seq data, confirming that inhibition of AURKB through Tozasertib reduced tumor growth by decreasing the regulatory T cell population and activating CD8+ T cells. Despite these promising results, variability in patient responses to Tozasertib highlights the need for further research to optimize its therapeutic application.
In addition to traditional bioinformatics tools, recent studies have applied artificial intelligence (AI), including machine learning, to enhance the analysis of scRNA-seq in melanoma. Chen et al. [11] identified three key prognostic genes (SLC25A38, EDNRB, LURAP1) associated with Uveal Melanoma (UM) metastasis by applying machine learning to single-cell and bulk RNA-seq data. Prognostic genes were identified using the log-rank test and univariate Cox regression, and prognostic models were developed using LASSO and multivariate Cox regression analyses. Single-cell analysis revealed that high-risk patients had increased infiltration of CD8+ T cells, and the cells that did infiltrate were largely exhausted and dysfunctional. The study also highlighted altered cell–cell communication, especially through the CD99 and MHC-I pathways, as a potential contributor to metastasis. Pinhasi and Yizhak [12] developed a machine learning approach, PRECISE, to predict immunotherapy response in melanoma using single-cell RNA-seq data from tumor-infiltrating immune cells. Their approach combined XGBoost with Boruta feature selection and SHAP analysis to identify an 11-gene signature (including GAPDH, STAT1, and CD38) predictive of immune checkpoint inhibitor response. They also used reinforcement learning to quantify each cell’s contribution to prediction, achieving an AUC of 0.89 and validating their model across multiple cancer datasets. Table 1 provides a summary of the related works included in this study.
While bioinformatics approaches are currently central to understanding melanoma drug mechanisms, they often rely on existing tools and do not exploit the potential of artificial intelligence. Furthermore, existing AI-driven approaches have yet to fully explore the potential of combining deep learning (DL) with single-cell analysis and therefore are far from perfect. This study presents a novel AI-driven computational approach that integrates adapted DL-based methods followed by enrichment analysis, specifically designed to enhance the analysis of single-cell data in order to uncover deeper biological insights. Our approach aims to facilitate the practical application of AI in clinical settings and enable the proactive identification of therapeutic targets associated with effective treatment responses in melanoma. The key innovations of this work include
  • DL-powered computational approach: We introduce a DL-based approach for gene selection with enrichment analysis to analyze single-cell gene expression data, unveiling the mechanisms underlying melanoma drug response, critical genes, drugs, therapeutic targets, and other critical factors such as key pathways and regulators associated with melanoma treatment outcomes.
  • Model training: We downloaded and processed single-cell gene expression datasets related to melanoma treatment response from the GEO database under accession numbers GSE108383_A375 and GSE108383_451Lu, corresponding to the A375 and 451Lu cell lines, respectively. Then, a fully connected deep neural network was trained to learn complex non-linear relationships in the single-cell gene expression data and implicitly reduce dimensionality, enabling more accurate identification of crucial genes for predicting drug response.
  • Gene ranking and selection: Adapting DL-based gene selection methods—including L1-Regularization, DeepLIFT, SHAP, Integrated Gradients (IG), and Layer-wise Relevance Propagation (LRP)—to rank genes based on their importance to the model predictions. Subsequently, we selected the top-ranked genes determined by each method for further enrichment analysis, including using Enrichr and Metascape to uncover the underlying biological pathways and processes associated with drug response and resistance in melanoma.
  • Results from a biological perspective: Our developed DL-based approach demonstrated superior performance when compared to baseline methods across the two datasets. Notably, DeepLIFT and IG produced the highest performance on the first dataset, whereas both DeepLIFT and IG were most effective for the second, with higher numbers of expressed genes in established cell lines (i.e., MALME-3M, MDA-MB435, SKMEL28, and SKMEL5). Additionally, our methods successfully identified several drugs, including FDA-approved melanoma treatments like Vemurafenib and Dabrafenib, significant genes (e.g., ARAF, SOX10, SLC7A5, DCT, and AXL), and TFs (such as MITF, RELA, E2F1, and TFAP2A).
  • Results from a classification perspective: Providing the gene sets delivered by our DL-based methods and existing baseline methods to three machine learning algorithms, we evaluated using the average balanced accuracy (BAC) and F1. Compared to the best-performing baseline (LIMMA) in the A375 cell line dataset, IG coupled with machine learning algorithms had performance improvements of 2.2% and 2.0% in F1 and BAC, respectively. For the 451Lu cell line dataset, IG coupled with machine learning algorithms resulted in 0.5% and 0.3% performance improvements when employing F1 and BAC performance measures, respectively, over the best-performing baseline (t-test). Further experimental work against no gene selection demonstrated that IG was the only method to generate statistically significant results, with 14.4% and 11.7% overall performance improvements. These results demonstrate the predictive potential of genes produced via IG in our approach.
The rest of this paper is organized as follows. In Section 2, we describe the datasets and our presented computational approach. In Section 3, we report experimental results from biological and classification perspectives. Then, we discuss the results in Section 4 before concluding and suggesting future work in Section 5.

2. Materials and Methods

2.1. Single-Cell Gene Expression Profiles

In this study, we utilized two scRNA-seq datasets, GSE108383_A375 and GSE108383_451Lu, obtained from the Gene Expression Omnibus (GEO) under accession number GSE108383 [3]. These datasets are derived from the A375 and 451Lu melanoma cell lines, which both carry the BRAF V600E mutation, a prevalent driver mutation in melanoma [13]. We refer to GSE108383_A375 and GSE108383_451Lu as the A375 cell line and 451Lu cell line, respectively. Analysis of these datasets in the presence of sophisticated computational methods enabled us to identify various mechanisms leading to drug resistance in melanoma patients by providing a detailed view of transcriptional heterogeneity at the single-cell level.
As mentioned, all datasets consist of single-cell gene expression data, where each sample x i   ϵ   R n is composed of the expression of n genes and y i ϵ   0,1 is the binary label indicating the cell state (0 for parental and 1 for resistant). Table 2 provides an overview of these two datasets. The GSE108383 datasets with the A375 and 451Lu cell lines were slightly imbalanced; the first had 79:51 (parental/resistant) and the latter had 113:84 (resistant/parental). Both are ≪2:1. It is worth mentioning that we first tried to balance these class distributions and obtained almost identical results. Hence, we proceeded with no change to the class distribution, as shown in Table 2.

2.2. Computational Approach

The proposed approach involves data preparation and gene selection using DL-based methods, including L1 Regularization, DeepLIFT, SHAP, IG, and LRP. These methods were adapted to single-cell gene expression data to identify the genes most important for distinguishing between parental and resistant cell states. The selected top genes were then subjected to enrichment analysis using Enrichr and Metascape to uncover the underlying biological pathways and processes associated with drug response and resistance in melanoma (Figure 1).

2.2.1. Data Preparation

As part of the data preparing step, biopsy samples were obtained from melanoma patients. Then, collected samples were prepared and underwent single-cell assessment, measuring the gene expression levels at single-cell resolution. The data were then annotated according to their respective cell states, with labels assigned as 0 for parental and 1 for resistant [14].

2.2.2. Deep Learning-Based Gene Selection

Neural Network Model
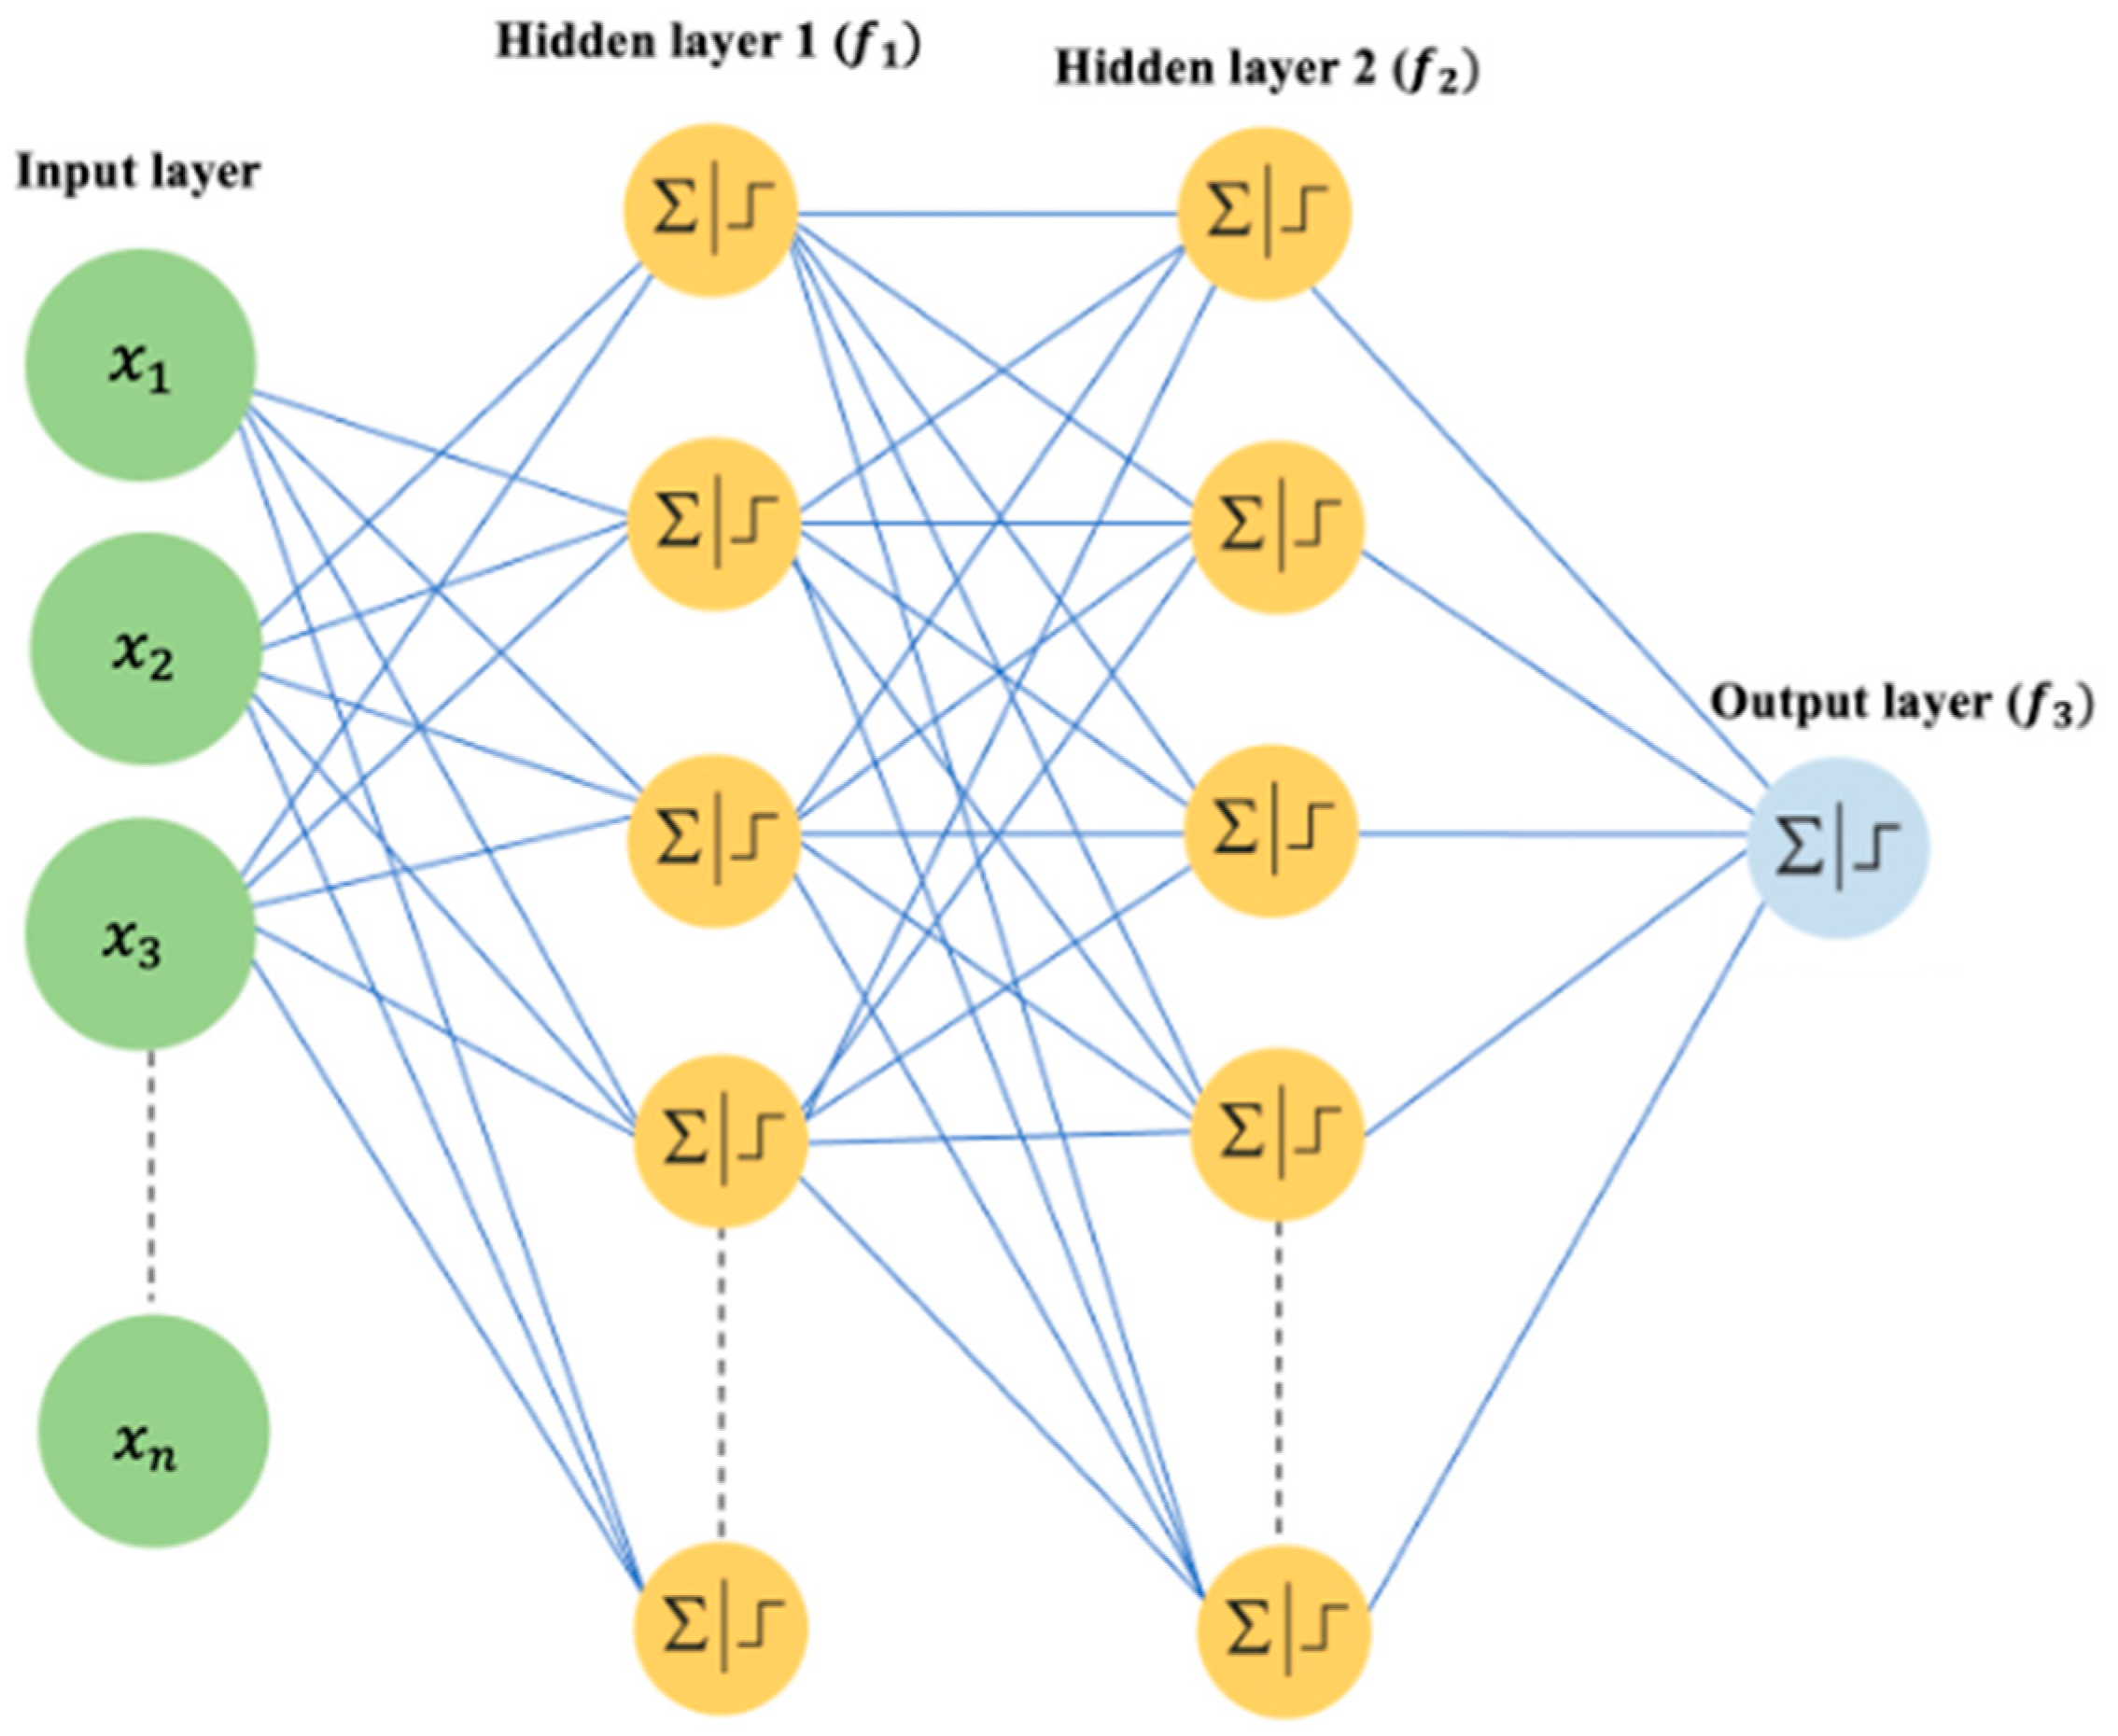
A fully connected feedforward neural network [15] was trained on the single-cell data. Before the training, we performed min–max scaling to normalize the expression levels of each gene to the range [0, 1], ensuring that all genes are comparable. Subsequently, the datasets were split into training and testing sets, ensuring a balanced representation of both cell states in each subset. The data were then fed to the fully connected feedforward neural network consisting of two hidden layers with a ReLU activation function [16] and a dropout layer [17] to prevent overfitting. The first hidden layer transforms the input data using a weight matrix w 1   ϵ   R p × n and a bias vector b 1   ϵ   R p , where n is the number of input genes and p is the number of neurons in the hidden layer (p = 128). This transformation is followed by a ReLU activation function and a dropout layer with a rate of 0.5. The second hidden layer applies a similar transformation, and the final output layer uses a sigmoid activation function to predict the probability that a given sample belongs to one of the two classes (see Figure 2).
f 1 x = { d 1 1 ,   d 1   2 ,   , d 1 p } w h e r e       d 1 i = m a x w 1 , i   x + b 1 , i   , 0 , f 2 d 1 = { d 2 1 ,   d 2 2 ,   ,   d 2 p } w h e r e       d 2 i = m a x w 2 , i   d 1 + b 2 , i   , 0 , f 3 d 2 = y w h e r e         y = 1 1 + e ( w 3,1 d 2 + b 3,1 )   .  
The overall model is defined as a composition of these transformations as
y = f * x = f 3 f 2 f 1 x
The model was trained using binary cross-entropy (BCE) loss, defined as
L B C E = 1 m i = 1 m y i log y i + 1 y i log 1 y i
In Figure 2, it can be seen that we have three weight matrices, described as follows. First, we have a weight matrix between input layer and the first hidden layer, followed by another weight matrix between the first and second hidden layers. Finally, there is a third weight matrix between the last hidden and output layers. All the weights in the network were estimated through backpropagation during the training process.
L1-Regularization for Gene Selection
L1-regularization was used during training to encourage sparsity in the learned weights and prevent overfitting. This technique adds a penalty term to the loss function reflecting the magnitude of the model’s weights. This encourages the model to learn a sparse representation, effectively driving the weights of less informative genes toward zero [15,18]. For gene selection, we focused on the weights of the first hidden layer, which directly connects the input genes to the neurons of that layer. The L1-regularization term is defined as
L 1     = L B C E + λ l j k w     j , k l   L 1   = 1 m i = 1 m y i log y i + 1 y i log 1 y i + λ l j k w     j , k l  
where λ is the regularization strength and w j , k l is the weight within the weight matrix in the lth hidden layer. We ranked the genes by summation of the absolute values of their corresponding weights across all neurons in the first layer and then selected the top 100 genes.
Deep Learning Important Features (DeepLIFT)
DeepLIFT is a method that explains predictions of complex deep neural networks by decomposing them into contributions of individual neurons through backpropagation. For a particular prediction, it generates local explanations by calculating the difference between the actual output and a reference output, relative to the differences between actual and reference inputs [19]. Formally, let o represent some target output neuron of interest and x 1 ,   x 2 ,   ,   x n represent neurons in the input layer. Let f x and f x correspond to the activation of a particular neuron and the reference activation, respectively. DeepLIFT calculates contributions scores satisfying the summation-to-delta property as follows:
Δ o = f x f x = i n C Δ x i Δ o
where   C Δ x i Δ o denotes the contribution score in each neuron x i . Let o and o 0 correspond to target output and its reference activation, respectively. Then, the difference-from-reference is computed as Δ o = o o 0 [19].
To quantify this contribution, DeepLIFT defines a multiplier as follows:
m Δ x i Δ o = C Δ x i Δ o Δ x i
These multipliers are propagated recursively through the network layers by applying a chain rule:
m Δ x i Δ o = j m Δ x i Δ h j · m Δ h j Δ o
where h j represents neurons in intermediate (hidden) layers. After computing the contributions for each input across all samples using DeepLIFT, we summed their absolute values to obtain a global importance score. We then ranked the genes by these scores and selected the top 100 genes for further analysis.
SHapley Additive exPlanations (SHAP)
SHAP is a method derived from game theory that is used to explain the output of machine learning models. It is built on the concept of the Shapley value, which is a solution in coalitional game theory used to fairly distribute payouts among players in a coalition. SHAP adapts this idea to machine learning by attributing the contribution of each gene to a model’s prediction [20]. The SHAP value ϕ j for a given gene j in a prediction q can be defined mathematically as
ϕ j q = S N / j S ! n S 1 ! n ! q S j q S
where n is the total number of genes, S N / j represents all possible subsets of genes excluding j ,   ( q ( S   j     q ( S ) ) is the marginal contribution of gene j , i.e., the difference in predictions when the gene j included versus excluded, and S ! n S 1 ! n ! is the weighting factor for the marginal contributions, ensuring fairness by considering all possible gene subsets.
After calculating the SHAP value for each gene, genes were ranked based on the sum of their absolute SHAP values across all samples, and the top 100 were selected as the most influential genes obtained from the model.
Integrated Gradients (IG)
IG is a gradient-based explainability method that helps uncover the relative importance of input genes in predictions by a model. It compares the output of a model for a given input to its output for a baseline value. This baseline represents a neutral state, serving as a starting point for the explanation [21]. The method calculates gene contributions by integrating the gradients of the model’s output along a straight path from the baseline input to the actual input. Mathematically, this is represented as
x j x j × δ = 0 1 f x + δ × x x x j d δ
where f denotes the trained neural network model, x j is the input gene, x is the baseline, δ is a scalar interpolating between them, and the integral accumulates the gradients along the path.
We computed the absolute IG scores for each gene and summed them across all samples. The top 100 genes were then selected as the key contributors to the model’s predictions.
Layer-Wise Relevance Propagation (LRP)
LRP is an explainability method designed to trace the contribution of input genes to the final prediction of the model by redistributing the output relevance backwards through the network layers. This redistribution follows predefined propagation rules that ensure the total relevance remains conserved across layers, matching the output of the model at the final layer [22]. One of the fundamental rules in LRP is the simple rule (LRP-0), which proportionally redistributes the relevance R j l + 1 from layer l + 1 to layer l , based on each contribution of the input. The rule is defined as
R i j l , l + 1 = j z i w i , j 0 ,     k z k w k , j R j l + 1
Here, R i j l , l + 1 denotes the relevance passed from neuron j in layer l + 1 to neuron i in layer l ; z i is the activation of neuron i ; w i , j is the weight connecting neuron i in layer l to neuron j in layer l + 1 ; and R j l + 1 is the relevance of neuron j in layer l + 1 . After computing the relevance scores for each input gene, we summed their absolute values across all samples. The top 100 genes were then selected as the most significant contributors to the model’s predictions.

2.2.3. Enrichment Analysis

To obtain results from a biological perspective, we first provided whole datasets to the aforementioned DL-based methods, producing 100 genes after ranking the genes from the highest to the lowest based on the sum of the absolute values of their corresponding weights across all neurons in the first hidden layer. These selected genes were then provided to enrichment analysis tools, as explained in this section. For the enrichment analysis, we uploaded the top significant genes in the A375 and 451Lu cell lines as the input to Enrichr and Metascape [23,24]. These genes were ranked based on their importance, as determined by each method. Subsequently, we analyzed the results to interpret and identify biologically meaningful terms, such as key expressed genes, drugs, therapeutic targets, transcription factors, and other relevant categories. The findings from this analysis are presented in the next section.

3. Experiments and Results

3.1. Experimental Methodology

We compared our DL-based approach against the following baseline methods (LIMMA [25], SAM, and the t-test [26,27]). The input to these methods is the labeled gene expression from both datasets. For the LIMMA, SAM, and t-test baseline methods, genes were selected based on statistically significant adjusted p-values < 0.01.
To perform enrichment analysis and evaluate the results from a biological perspective, we uploaded the genes obtained from each method to Enrichr (https://maayanlab.cloud/Enrichr/, accessed on 3 February 2025) and Metascape (https://metascape.org/gp/index.html, accessed on 15 March 2025). When the retrieved terms are related to melanoma, a method associated with terms covering more genes is considered superior. Furthermore, we assessed the performance from a classification perspective, reporting balanced accuracy (BAC) and F1 as our performance measures.
In this study, we utilized Python 3.12.12 to run experiments involving our DL-based gene selection methods [28]. Specifically, for our DL-based approach, we utilized PyTorch 2.8.0, a widely used library for developing and training neural networks [29]. To identify important genes, DeepLIFT, IG, and LRP were implemented using the Captum library [30]. Additionally, SHAP was separately installed and imported as a standalone Python package, and SHAP’s Gradient Explainer was specifically utilized to interpret the model [31]. Moreover, we incorporated L1-Regularization, implemented directly within PyTorch, to encourage sparsity in the model’s weights and facilitate gene selection by identifying the most important input genes. All DL-based experiments pertaining to our approach were implemented on Google Colab with Python using Intel Xeon CPU @2.20 GH and 12 GB RAM.
For the bioinformatics tools, we used R 4.4.1 on Apple Silicon Mac. Specifically, we employed the LIMMA package in R [32], utilizing the lmFit and eBayes functions [25] for differential expression analysis, and the siggenes package [33] to run SAM. For the t-test, we employed the t-test function within the stats package [27]. To compute adjusted p-values for the LIMMA, SAM, and t-test methods, we employed the p.adjust function with the BH correction.

3.2. Biological Results

3.2.1. A375 Cell Line

Table 3 shows the number of expressed genes associated with the retrieved terms (i.e., melanoma cell lines) from Enrichr within the NCI-60 cancer cell lines category. A higher number of expressed genes indicates superior performance of the computational method. Among all methods used, DeepLIFT performed the best, obtaining a total of 34 expressed genes within the retrieved melanoma cell lines. Specifically, seven genes (ARPC1B; HEXA; HMG20B; SOX10; ATP6V0C; LY6E; GAS7) were expressed within MALME-3M, fourteen genes (SLC35A2; PYGB; ACOT7; GPAA1; TWF2; IMP4; SOX10; RRP7A; SEC61A1; BIN3; SLCO4A1; ST3GAL4; HMG20B; RALY) were expressed within MDA-MB435, seven genes (SLC35A2; MIA; HEXA; ST3GAL4; HMG20B; SOX10; HLA-DQB1) were expressed within SKMEL28, and six genes (PYGB; BIN3; ENTPD6; HMG20B; SOX10; LY6E) were expressed within SKMEL5. The second-best method was IG, obtaining a total of 32 expressed genes within the retrieved melanoma cell lines; seven genes (ARPC1B; HEXA; HMG20B; SOX10; ATP6V0C; LY6E; GAS7) were expressed in MALME-3M, fourteen genes (SLC35A2; PYGB; ACOT7; GPAA1; GPS1; PRKCD; IMP4; SOX10; RRP7A; SEC61A1; BIN3; ST3GAL4; HMG20B; RALY) were expressed in MDA-MB435, five genes (SLC35A2; MIA; ST3GAL4; HMG20B; SOX10) were expressed in SKMEL28, and six genes (SDCBP; PYGB; BIN3; HMG20B; SOX10; LY6E) were expressed in SKMEL5. Both SAM and the t-test identified 30 expressed genes; SHAP, LRP, and LIMMA each identified 29 expressed genes; and L1-Regularization identified 22 expressed genes. In Supplementary DataSheet S1_A, we include all genes produced via each computational method provided to Enrichr and Metascape. Moreover, Supplementary Table S1_A lists all enrichment analysis results for NCI-60 cancer cell lines obtained from Enrichr.
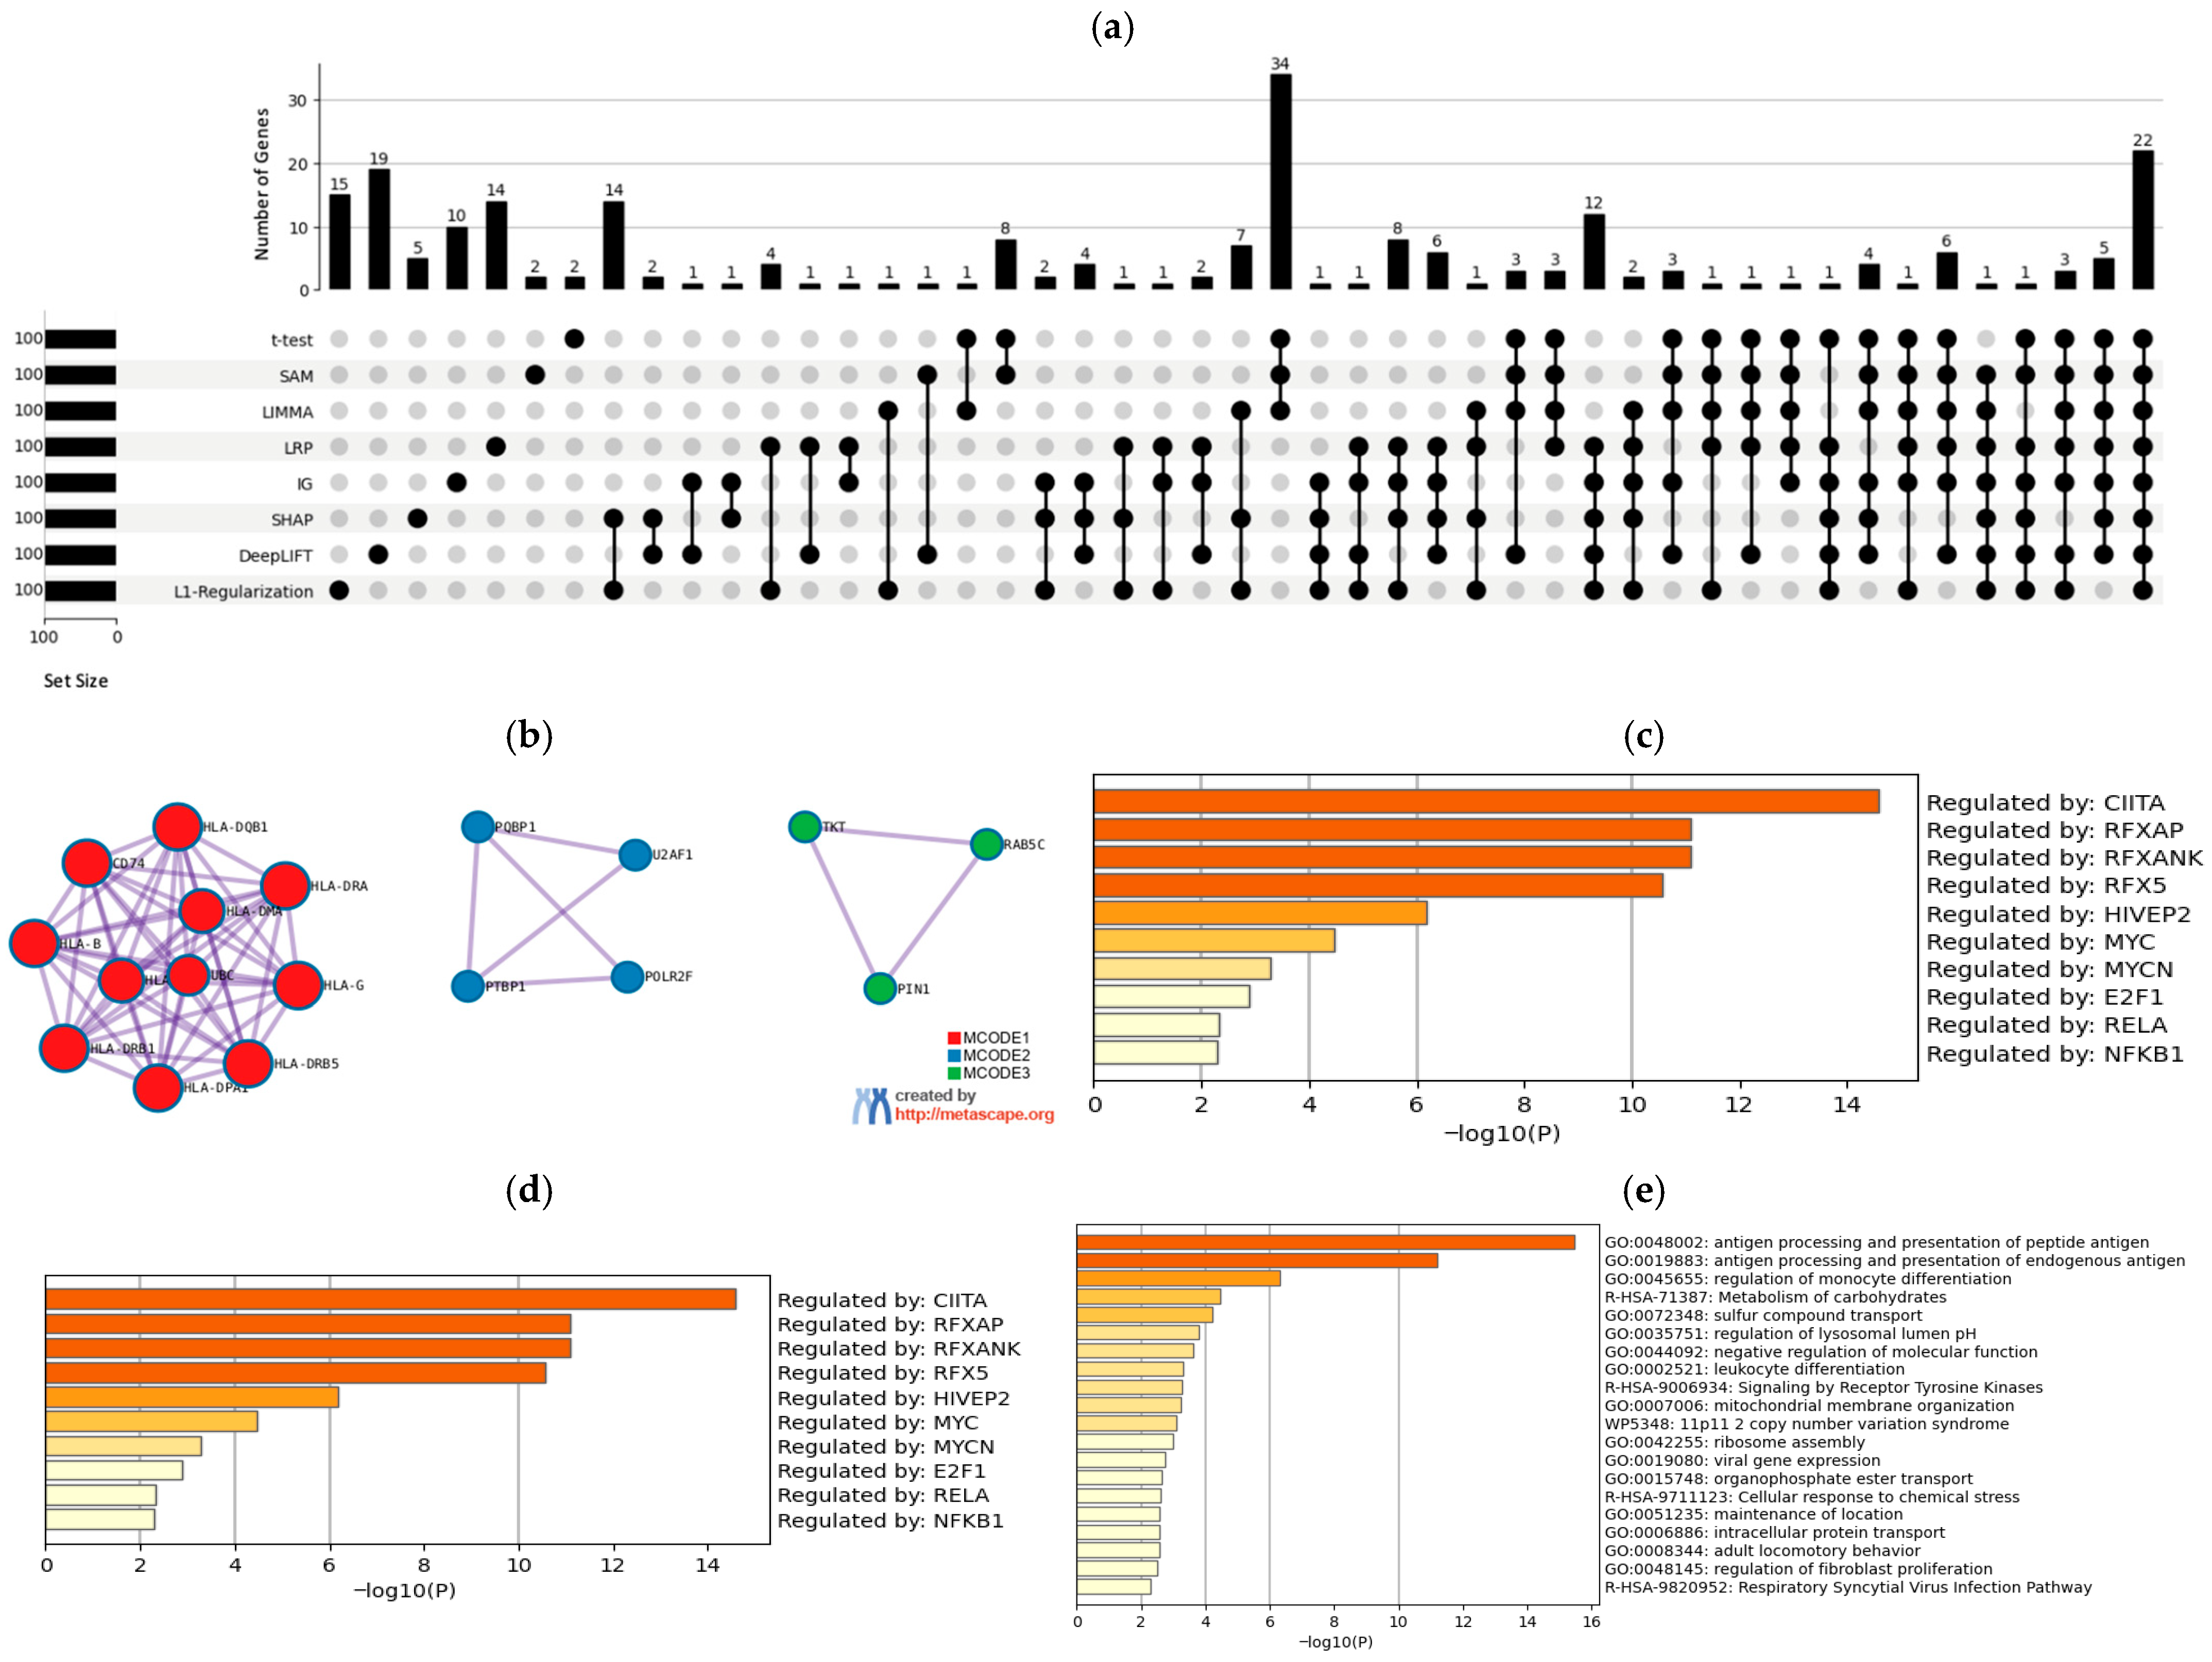
Figure 3a presents a visualization pertaining to the intersected gene sets from each computational method within our approach, as well as from traditional bioinformatics tools. A total number of 19 and 10 unique genes were attributed to DeepLIFT and IG, respectively. In contrast, traditional statistical methods such as SAM and the t-test demonstrated more conservative results, both identifying only two unique genes, while LIMMA identified no unique genes. It can also be seen that the number of common genes is upper bounded by 34 (intersection of the t-test, SAM, and LIMMA) and lower bounded by 1. These results demonstrate that our computational methods produced different gene sets when compared to existing tools. In Supplementary DataSheet S1_B, we provide the genes based on the UpSet plot shown in Figure 3a.
Since DeepLIFT outperformed the other methods, we provided the top 100 genes identified by DeepLIFT to Metascape for additional enrichment analysis. Figure 3b shows the three clusters identified in the PPI. The following 18 genes were obtained from the PPI network: HLA-B, CD74, HLA-G, HLA-DQB1, HLA-DMA, HLA-DRB5, HLA-C, HLA-DRA, UBC, HLA-DPA1, HLA-DRB1, PQBP1, PTBP1, POLR2F, U2AF1, RAB5C, TKT, and PIN1. Figure 3c presents 10 transcription factors (TFs): CIITA, RFXANK, RFXAP, RFX5, HIVEP2, MYC, MYCN, E2F1, RELA, NFKB1. CIITA plays a role as a transcriptional coactivator in melanoma, in particular by regulating immune-related genes (like MHC II) and influencing tumor immunogenicity [34]. MYC has been reported as a key oncogenic transcription factor in melanoma, promoting tumor growth and therapy resistance [35,36]. E2F1 is a transcription factor that regulates genes involved in melanoma cell proliferation, survival, and apoptosis [37]. Finally, RELA and NFKB1 play important roles in melanoma progression, inflammation, and therapy resistance [38,39]. These TFs represent potential biomarkers and therapeutic targets that could improve the understanding, diagnosis, and treatment of melanoma. Figure 3d presents the results of the transcription factor targets from the enrichment analysis, identifying several target genes with known relevance to melanoma, including SOX10 target genes and GCCATNTTG YY1 Q6 (YY1). SOX10 is critical for melanocyte development and melanoma identity. It has been implicated in melanoma cell state transitions and phenotype switching [40]. YY1 contributes to human melanoma cell growth through modulating the p53 signaling pathway [41]. In Figure 3e, we retrieved various biological processes and pathways involved in melanoma progression. The top-enriched term is antigen processing and presentation of peptide antigens, particularly through MHC class I and II molecules. Multiple studies have shown that the antigen processing and presentation pathway is critical for melanoma immunogenicity and can influence both immune evasion and the therapeutic response [42,43]. Leukocyte differentiation is frequently identified as one of the top-enriched processes in transcriptomic studies of melanoma, particularly in relation to the immune response and tumor progression [44,45]. The Reactome pathway Signaling by Receptor Tyrosine Kinases contributes to melanoma progression and resistance to BRAF-targeted therapy through activation of EGFR, MET, PDGFR, and downstream MAPK and PI3K-AKT signaling [46]. We provide the enrichment analysis results from Metascape based on DeepLIFT in Supplementary Metascape_Enrich 1.
In Table 4, we report terms (i.e., drugs) and genes (i.e., drug targets) within IDG Drug Targets 2022. Vemurafenib and Dabrafenib are FDA-approved BRAF inhibitors that target the MAPK pathway in BRAF-mutant melanoma [47,48,49]. Sorafenib also targets RAF kinases, including ARAF, and has been investigated in melanoma clinical trials [50]. The method also identified drugs such as Phenylalanine, a LAT1 (SLC7A5) inhibitor, and Metformin, a mitochondrial complex I (NDUFA11) inhibitor, both associated with metabolic pathways implicated in melanoma [51,52]. In Supplementary Table S1_B, we list the enrichment analysis results for IDG Drug Targets 2022.

3.2.2. 451Lu Cell Line

Table 5 reports the expressed genes in melanoma cell lines, identified from the 60 human cancer cell lines (NCI-60), based on the genes provided by all of the computational methods. Supplementary DataSheet S2_A includes all genes generated by all of the computational methods, provided to Enrichr and Metascape. Among all evaluated methods, DeepLIFT and IG demonstrated superior performance compared to the others. Both methods identified a total of 31 expressed genes within the retrieved melanoma cell lines. In the MALME-3M cell line, both methods identified the same set of genes (DCT, S100A1, SLC16A6, APOD, CAPG, FXYD5, and RHOQ), with IG detecting an additional gene, L1CAM. In the MDA-MB-435 cell line, both methods identified a shared subset of genes (PLP1, CAPN3, and MAGEA3), with DeepLIFT uniquely detecting QDPR, COX7B, RPS6KA2, and TRMT12, and IG exclusively identifying GPR143. In the SK-MEL-28 cell line, both methods identified a common set of genes (RCN3, SLC17A9, SLC16A6, LSAMP, APOD, CAPG, and RHOQ), with DeepLIFT uniquely detecting BFSP1, and IG additionally identifying APP and DUSP10. In the SK-MEL-5 cell line, both methods identified a shared set of genes (DCT, S100A1, OR7E156P, SLC16A6, PLP1, CAPN3, and DHCR7), with DeepLIFT uniquely detecting SULT1C2 and TRMT12, and IG additionally identifying GPR143, DUSP10, and L1CAM. Out of the 31 expressed genes identified across all cancer cell lines, 24 genes were shared by both DeepLIFT and IG, while DeepLIFT uniquely identified 6 genes (QDPR, COX7B, RPS6KA2, TRMT12, BFSP1, SULT1C2) and IG exclusively detected 4 genes (L1CAM, GPR143, APP, DUSP10). The worst-performing method was LIMMA, which identified 24 expressed genes in the MALME-3M, MDA-MB435, SKMEL28, and SKMEL5 melanoma cell lines. Supplementary Table S2_A includes enrichment analysis results for NCI-60 cancer cell lines, obtained from Enrichr.
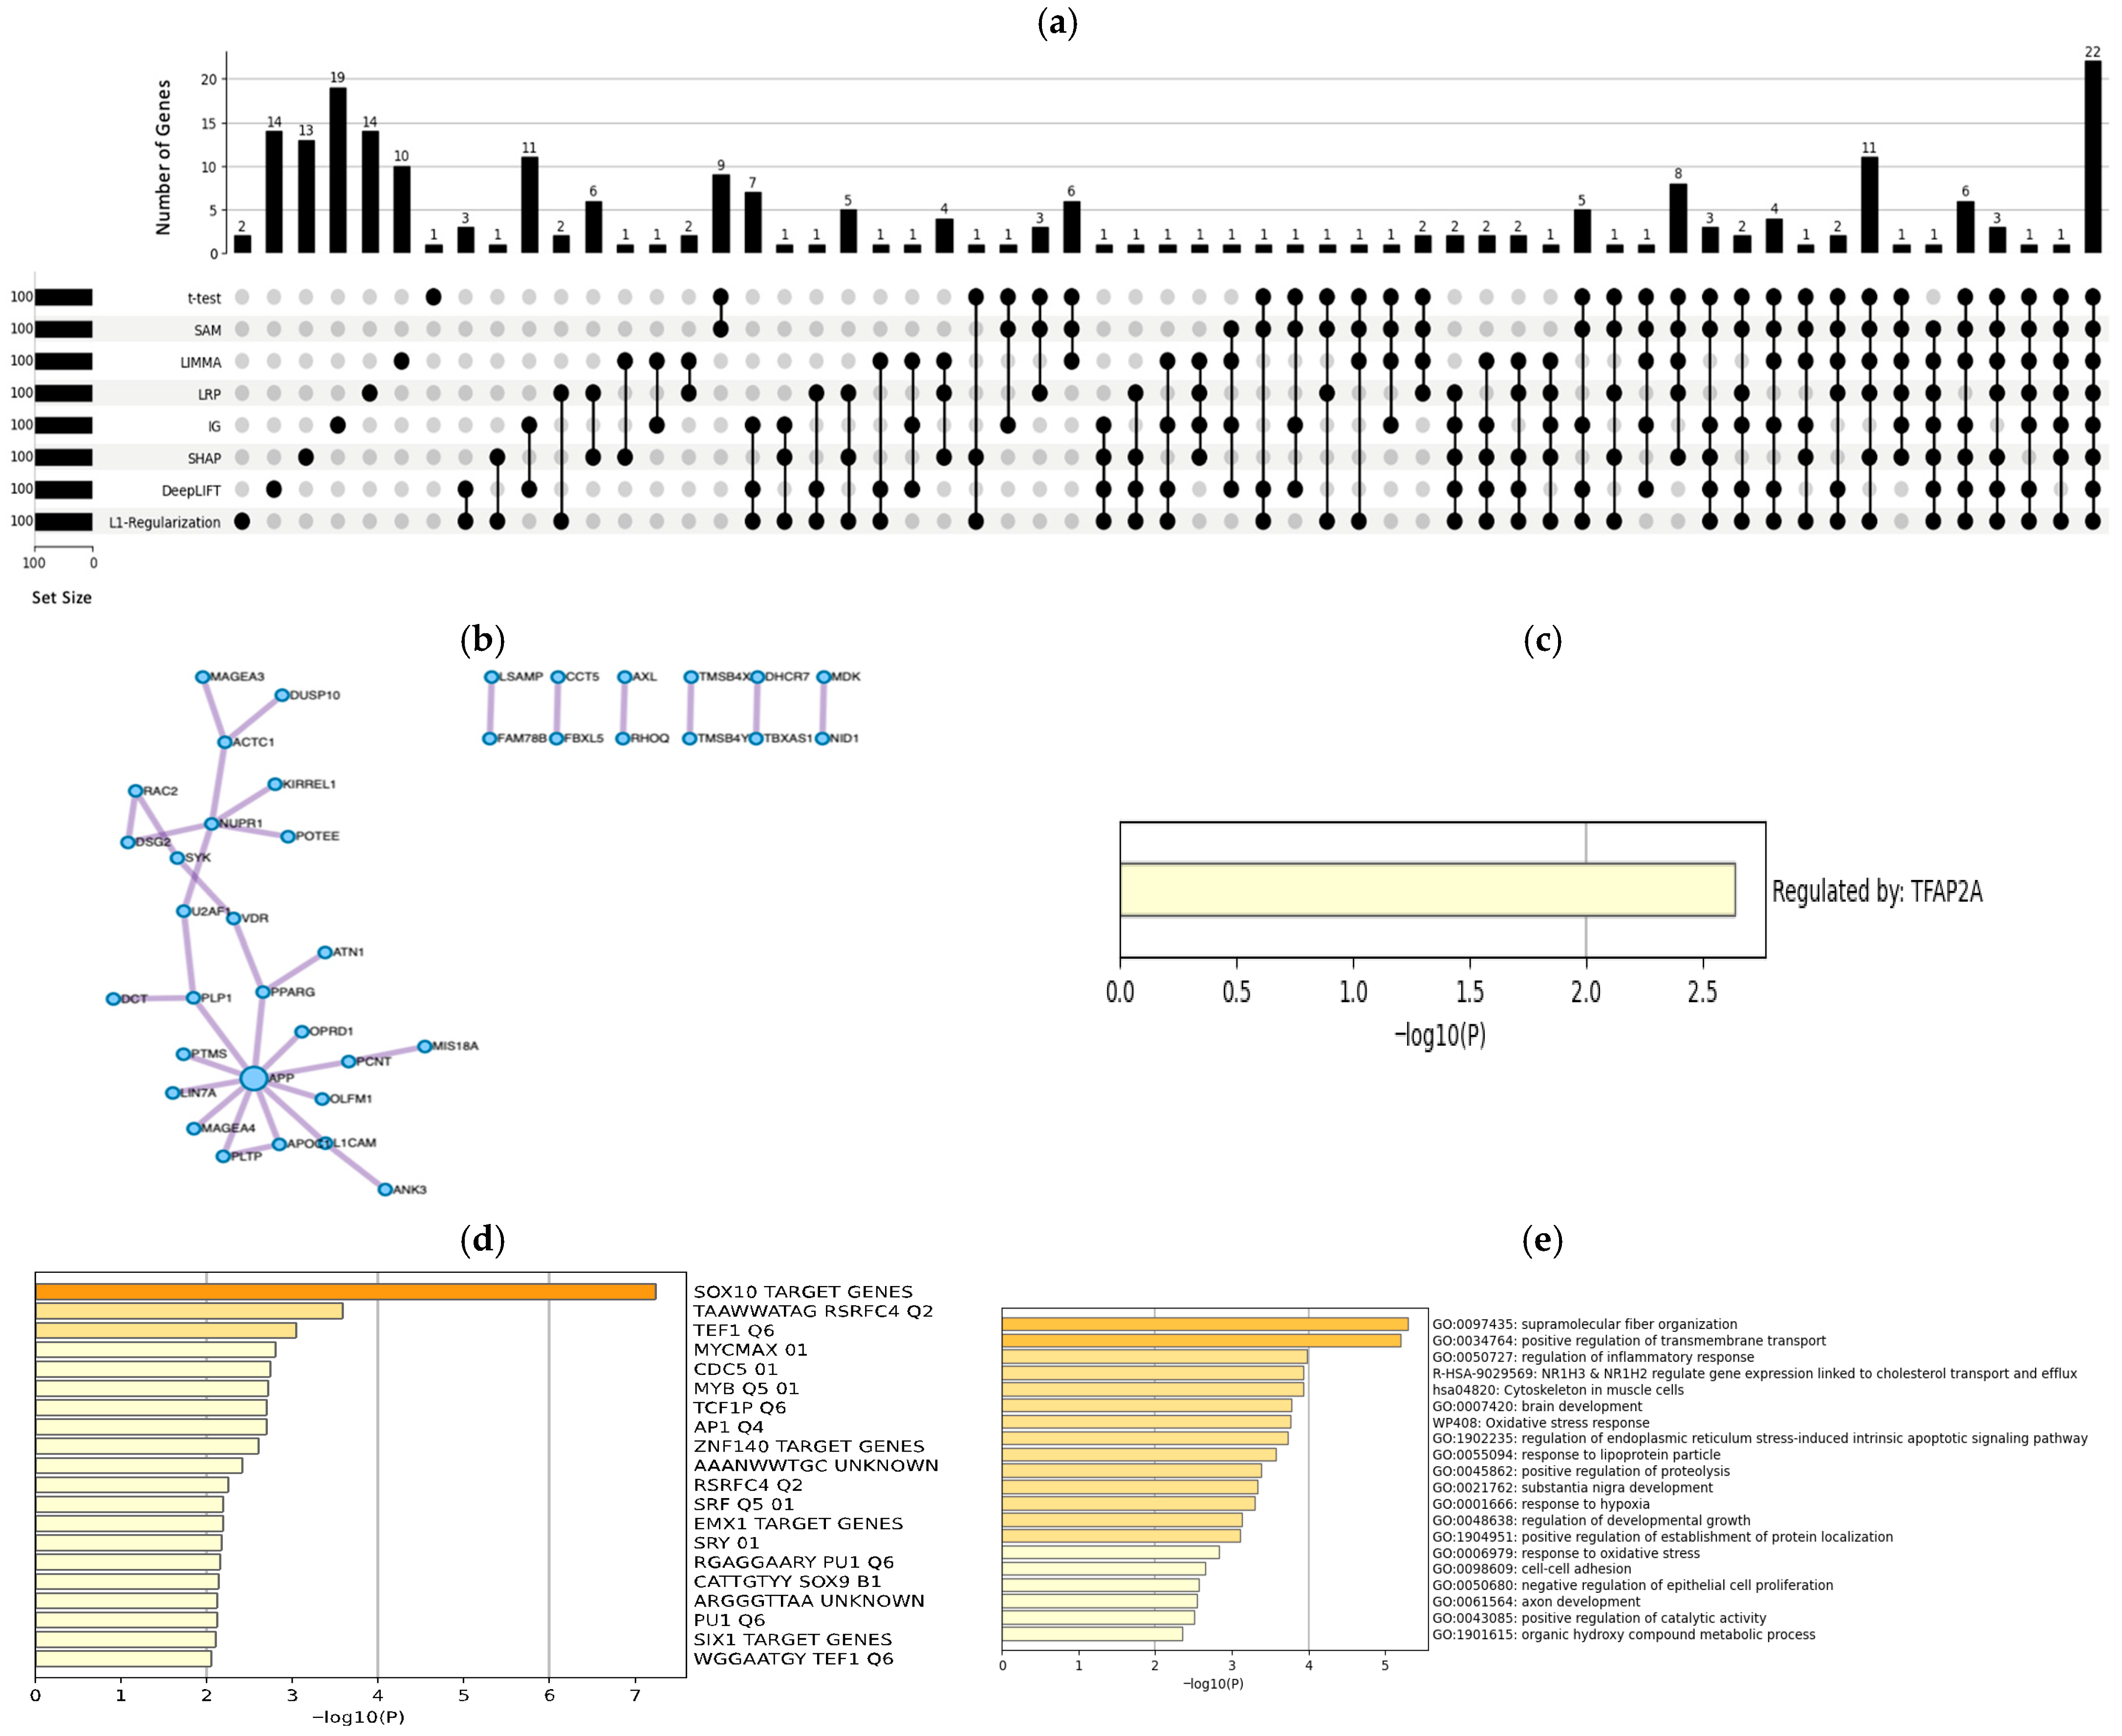
Figure 4a displays an UpSet plot illustrating the intersection of gene sets identified by all computational methods. Methods integrated within our approach identified a notable number of unique genes, ranging from 19 to 13, with the exception of L1-Regularization, which identified only two unique genes. In contrast, traditional bioinformatic approaches identified fewer unique genes—only one for the t-test, none for SAM, and 10 for LIMMA. This highlights a key advantage of our DL-based approach, which not only recovers established biological signals but also identifies additional, potentially novel genes often missed by conventional approaches. In Supplementary DataSheet S2_B, we included the UpSet plot of gene lists provided by DeepLIFT and IG with bioinformatics tools for the 451Lu cell line.
While both DeepLIFT and IG performed well, the IG-unique gene set demonstrated a stronger association with melanoma biology, as evidenced by the presence of L1CAM, GPR143, and DUSP10, genes with known or suspected roles in melanoma. Therefore, to reveal biological insights within melanoma drug responses, we focused on the IG-derived gene set provided to Metascape enrichment analysis. Figure 4b displays the following 39 genes obtained from protein–protein interaction (PPI): POTEE, FAM78B, KIRREL1, MIS18A, NUPR1, FBXL5, RHOQ, CCT5, DUSP10, OLFM1, TMSB4Y, LIN7A, VDR, U2AF1, TMSB4X, TBXAS1, SYK, RAC2, PTMS, PPARG, PLTP, PLP1, PCNT, OPRD1, NID1, MDK, MAGEA4, MAGEA3, LSAMP, L1CAM, DSG2, ATN1, DHCR7, DCT, AXL, APP, APOC1, ANK3, and ACTC1.
Figure 4c reports 1 TF: TFAP2A, as it plays a role as a transcriptional coactivator in melanoma, particularly by regulating immune-related genes (like MHC II) and influencing tumor immunogenicity [53]. Figure 4d presents the enrichment analysis results for transcription factor targets, identifying several targets with known relevance to melanoma, including SOX10 target genes and MYCMAX 01. As mentioned, SOX10 is essential for melanocyte development and maintaining melanoma identity. It controls important melanocytic genes like MITF, TYR, and DCT and plays a role in melanoma cell state changes and phenotype switching [40]. The c-Myc/MAX complex promotes melanoma growth and spread by binding to the E-box motif (CACGTG) and activating genes that drive cell proliferation. This binding is also common in drug-tolerant melanoma cells that resist BRAF/MEK inhibitors, highlighting its role in therapy resistance [35]. Genes provided by IG are related to various biological processes and pathways in melanoma progression, as illustrated in Figure 4e. The analysis shows that the regulation of the inflammatory response is the biological processes most closely associated with melanoma. Disruption or abnormal regulation of supramolecular fiber organization has been associated with increased melanoma aggressiveness, enhanced metastatic potential, and resistance to therapy [54]. In addition, the regulation of inflammatory response is also reported, and it is relevant and actively studied in the context of melanoma development, progression, and treatment, especially due to its implications in immunotherapy [55]. We include enrichment analysis results from Metascape based on DeepLIFT in Supplementary Metascape_Enrich 2.
Table 6 shows the drugs and associated genes identified within the IDG Drug Targets 2022 database, focusing on their relevance in melanoma treatment and resistance. Nelfinavir, an HIV protease inhibitor, has demonstrated preclinical and early clinical activity against melanoma and is currently being investigated for use in drug-resistant cases [56]. Imatinib, which targets c-KIT mutations commonly found in specific melanoma subtypes such as AM, is an FDA-approved drug for c-KIT-mutant melanoma [57,58]. In addition, the analysis identified several multi-kinase inhibitors, including Cabozantinib, Crizotinib, Gefitinib, Axitinib, and Dasatinib, which target receptor tyrosine kinases (RTKs) such as AXL, VEGFRs, MET, and Src kinases. These RTKs play critical roles in melanoma progression and therapy resistance, highlighting the potential of these drugs for therapeutic intervention in advanced or resistant melanoma cases [59,60,61,62,63]. In Supplementary Table S2_B, we list the enrichment analysis results for IDG Drug Targets 2022.

3.3. Classification Results

In this section, we assess the performance from a classification perspective, comparing those gene sets derived from methods using our DL-based approach with baseline methods. Each gene set was used in the gene expression dataset to train three machine learning models: support vector machine (SVM), random forest (RF), and a neural network (NN). We utilized five-fold cross-validation to report predictive performance incorporating F1 and balanced accuracy (BAC) performance metrics.
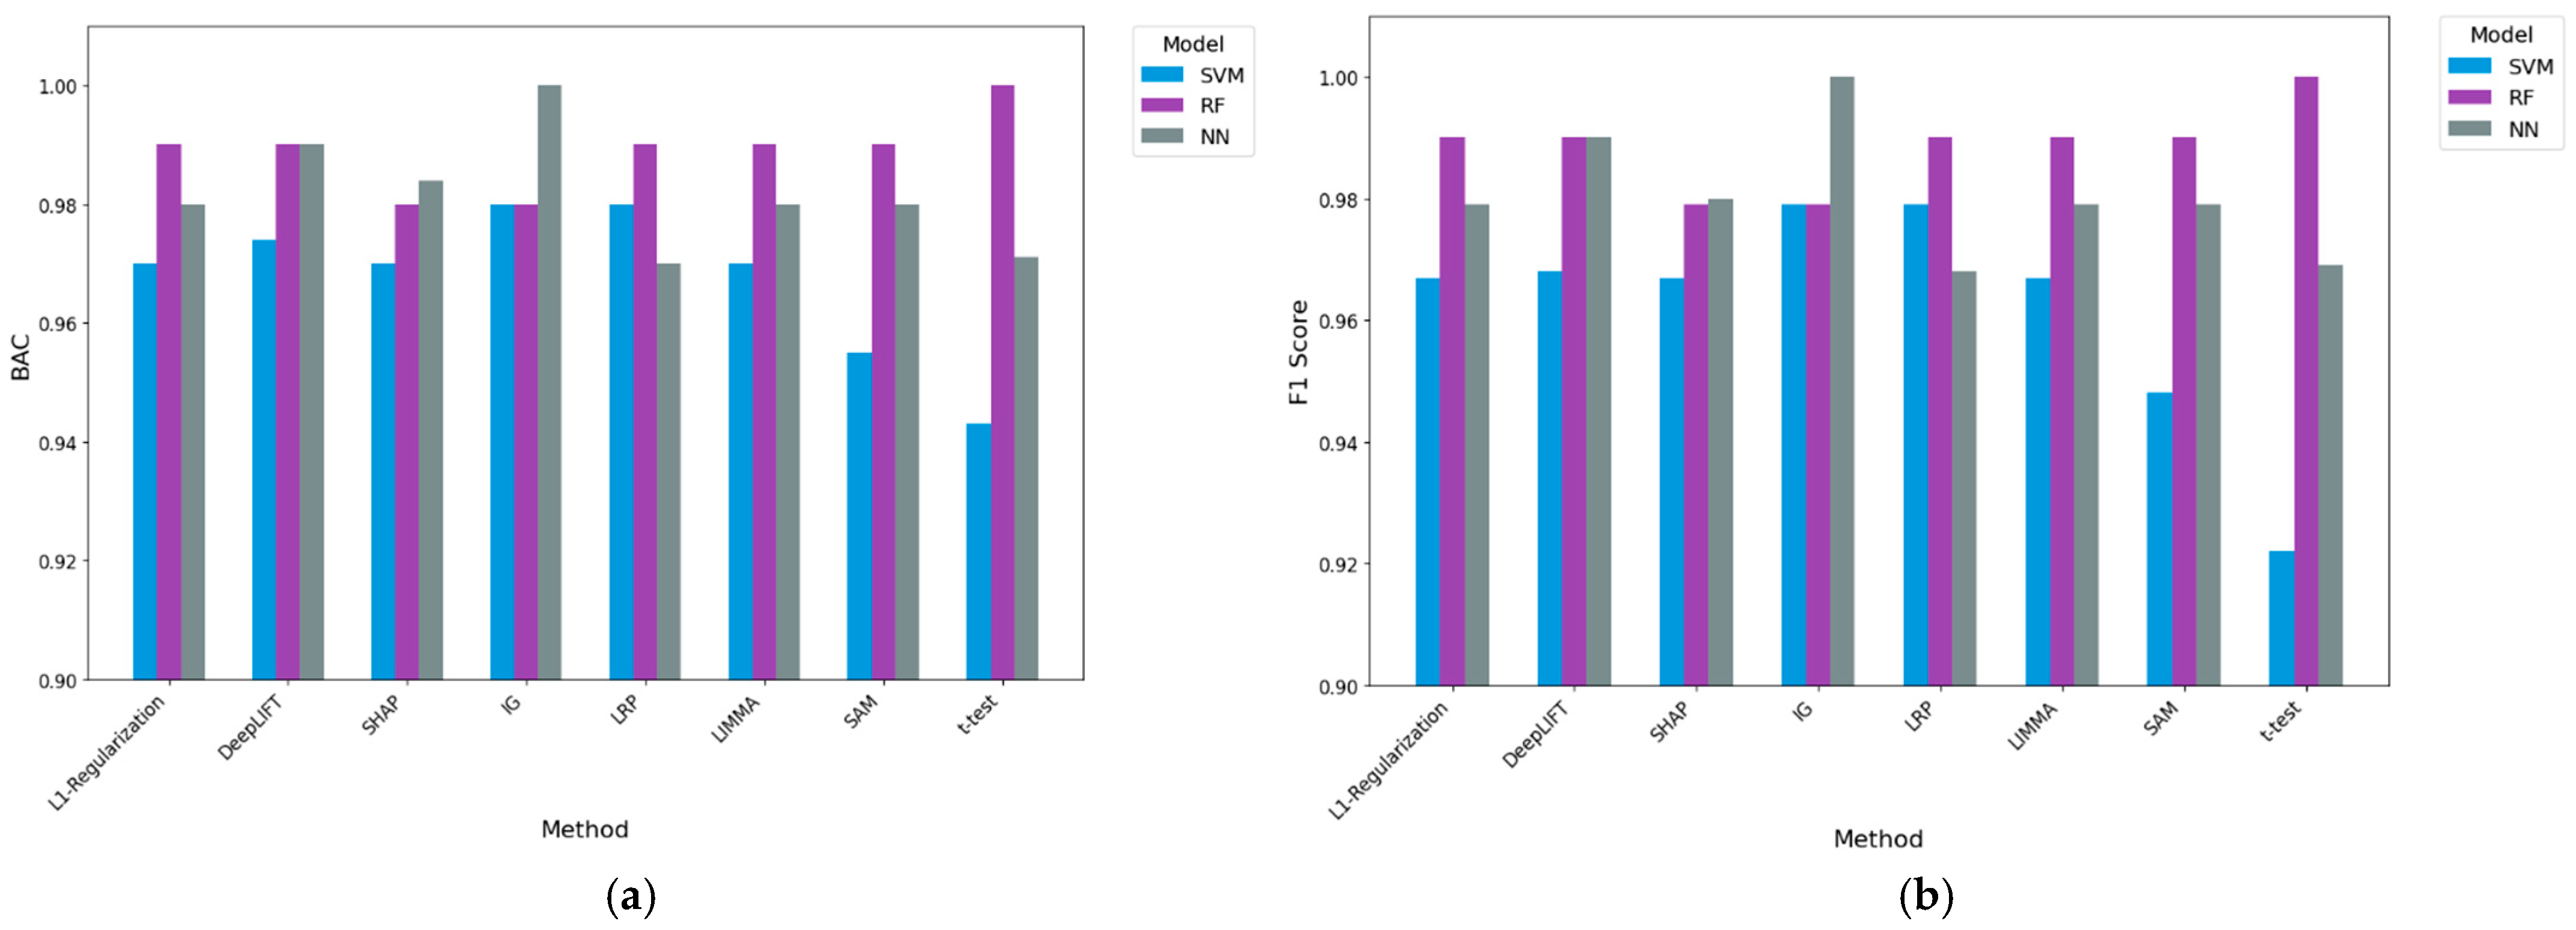
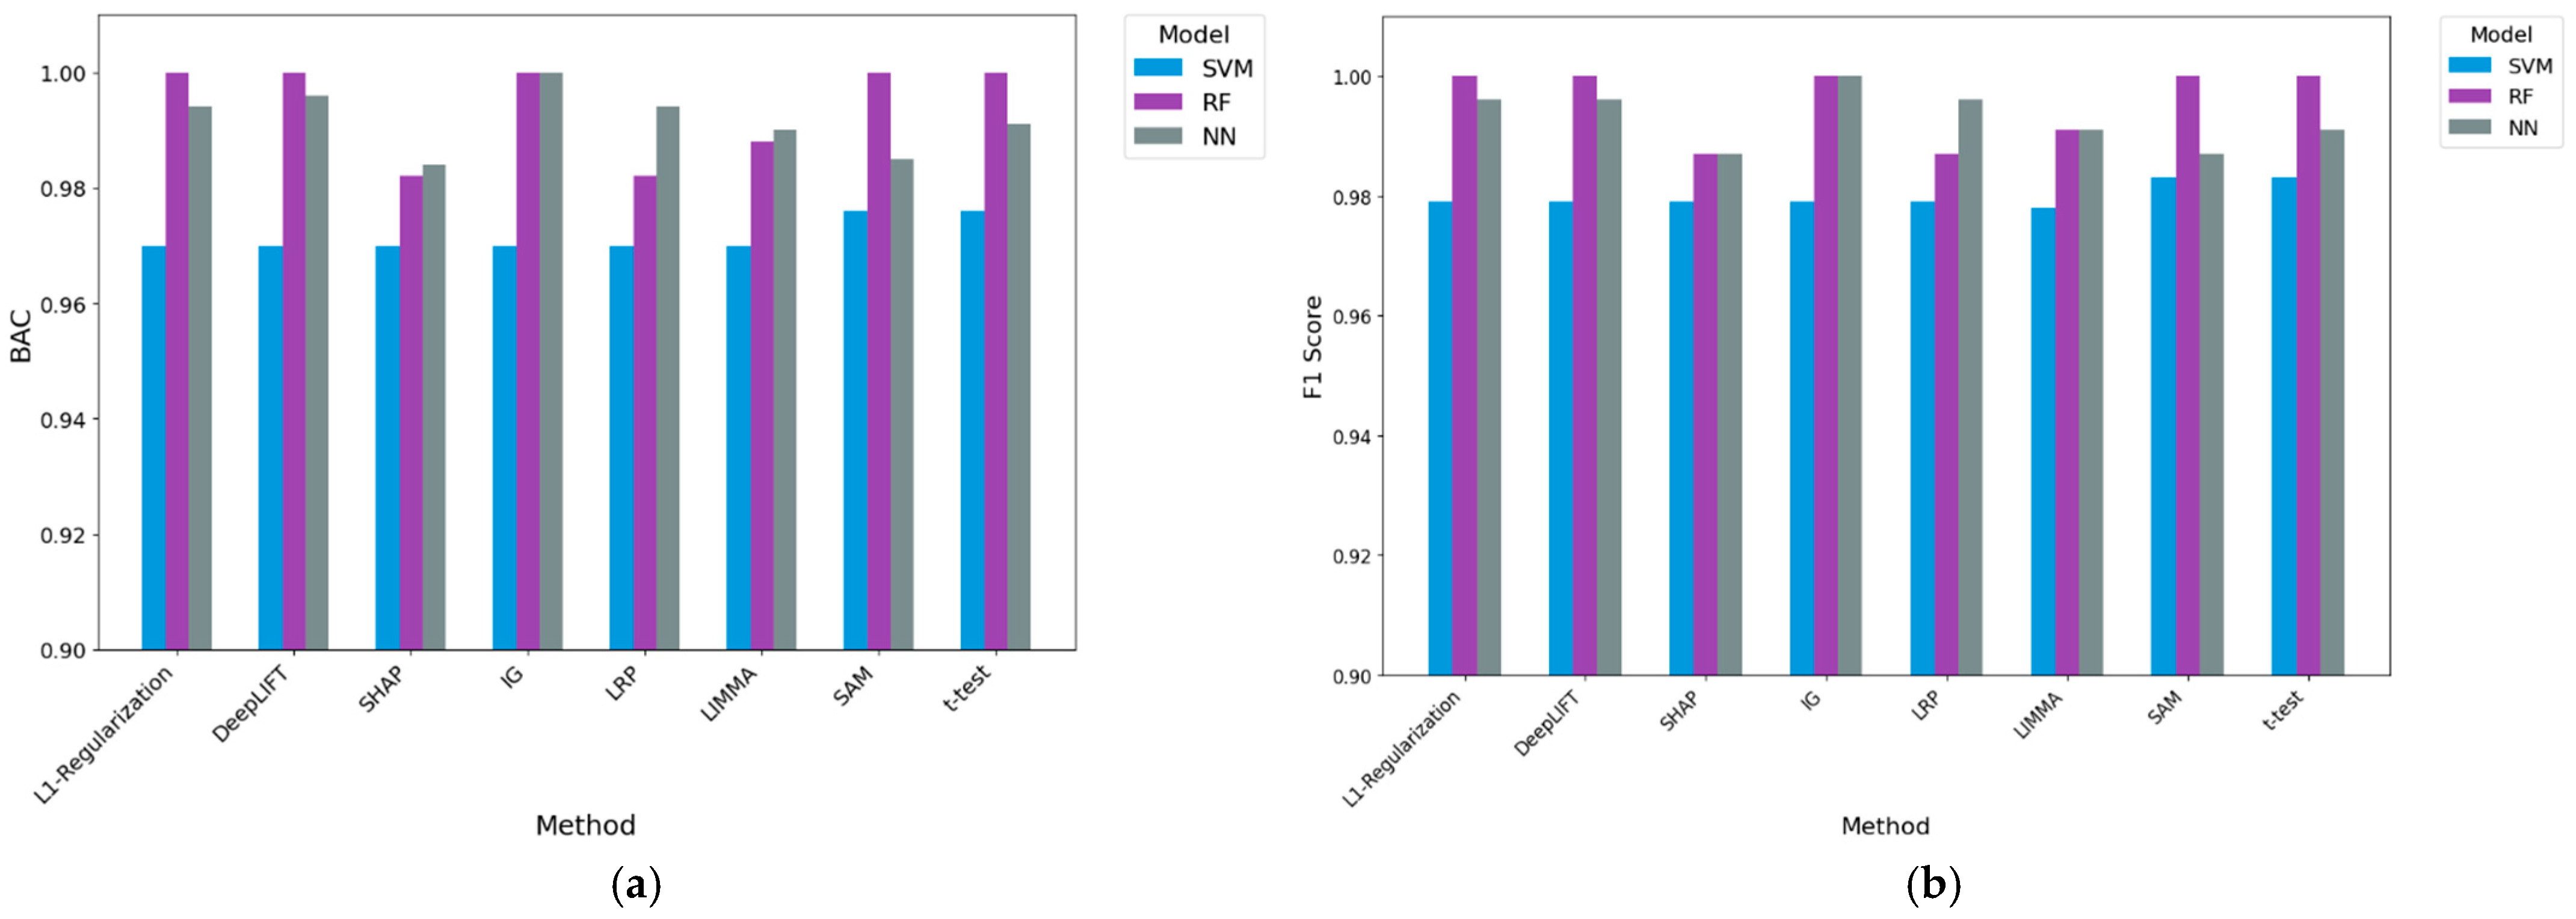
For the GSE108383 dataset and the A375 cell line, Figure 5a shows that the IG method in our approach coupled with SVM and NN obtained the highest BAC values of 0.980 (tie with our method LRP) and 1.00, respectively, while the t-test coupled with RF obtained the highest BAC of 1.00. In terms of the BAC performance measure, the overall loss for models when utilizing our best method IG is (1 − 0.98) + (1 − 0.98) + (1 − 1) = 4%. The second-best method is DeepLIFT, in which the total loss for employed models is (1 − 0.974) + (1 − 0.99) + (1 − 0.99) = 4.6%. The overall loss for models when utilizing the best bioinformatics-based tool (LIMMA) is (1 − 0.97) + (1 − 0.99) + (1 − 0.98) = 6%. The worst performance result is associated with the t-test, in which the total loss is (1 − 0.943) + (1 − 1) + (1 − 0.971) = 8.6%. These results reveal 2% and 1.4% BAC performance improvements for IG and DeepLIFT, respectively, over the existing tool, LIMMA. For the F1 performance metric (see Figure 5b), our IG method, when utilized in all three models, contributed to a (1 − 0.979) + (1 − 0.979) + (1 − 1) = 4.2% total loss. The second-best method in our approach is DeepLIFT, in which the total loss is (1 − 0.968) + (1 − 0.99) + (1 − 0.99) = 5.2%. LIMMA, the best method among the existing tools, had a total loss of (1 − 0.967) + (1 − 0.99) + (1 − 0.979) = 6.4%. These results demonstrate 2.2% and 1.2% performance improvements over LIMMA in terms of F1. Tables S1 and S2 in the Supplementary Additional File report these performance results in tabular format.
When utilizing the BAC performance measure and the 451Lu cell line dataset (see Figure 6a), the gene set produced via the IG method in our approach achieved the highest BAC of 1.00 when employing RF and NN. The second-best method is the t-test, yielding the highest BAC of 0.976 (tie with SAM) when coupled with SVM, while having the same score as IG when RF is utilized. Specifically, when coupled with all the models, the IG method in our approach had a total loss of (1 − 0.97) + (1 − 1) + (1 − 1) = 3%. The second-best method is related to the t-test in the baseline approach, resulting in a total loss of (1 − 0.976) + (1 − 1) + (1 − 0.991) = 3.3%. These results demonstrate a BAC performance improvement of 0.3% over the existing approach utilizing the t-test method. The worst-performing method when used in our approach is SHAP, which produced a total loss of (1 − 0.97) + (1 − 0.982) + (1 − 0.984) = 6.4%. For the F1 performance metric, Figure 6b shows that the IG method in our approach had the highest F1 of 1 when RF and NN were utilized. On the other hand, the t-test method had the highest F1 values of 0.983 and 1 when coupled with SVM (tie with SAM) and RF (tie with IG in our approach), respectively. It can be seen from Figure 6b that IG in our approach had the lowest loss of (1 − 0.979) + (1 − 1) + (1 − 1) = 2.1%, while t-test had a higher loss of (1 − 0.983) + (1 − 1) + (1 − 0.991) = 2.6%. In other words, we have a 0.5% F1 performance improvement over the existing baseline t-test method. These findings highlight the advantage of our approach using IG over both DL-based and traditional bioinformatics methods. Tables S3 and S4 in the Supplementary Additional File include the performance results pertaining to the 451Lu cell line.

4. Discussion

To understand the mechanisms underlying drug resistance in melanoma and thereby improve treatment outcomes and survival rates, we present a DL-based approach that works as follows. First, we downloaded scRNA-seq gene expression data pertaining to two melanoma cell lines from the GEO repository; each was provided to a fully connected neural network with five adapted methods (L1-Regularization, DeepLIFT, SHAP, IG and LRP)) to discriminate between BRAFi-resistant and parental cell lines. It is worth mentioning that we trained the neural network via the Adam optimizer, using 8 for the batch size, 0.00005 for the learning rate, and 10 for the number of epochs. Then, we selected the 100 genes with the highest weights, as described in Section 2.2.2. We used the top 100 genes derived from our approach, as well as those from baseline methods, for enrichment analysis. Our results demonstrated that the methods used in our approach identified a higher number of expressed genes in four well-established melanoma cell lines. Additionally, using these methods in our approach identified (1) FDA-approved drugs for melanoma and (2) drug targets, transcription factors, biological processes, and pathways. From a classification perspective, our results demonstrated that the gene sets derived from the adapted methods in our approach, when coupled with machine learning algorithms, improved the prediction performance; these results indicate that the genes produced via our approach are discriminative.
The results in Section 3.2. show that DeepLIFT and IG, the best-performing methods in our approach, identified genes such as SOX10, ARAF, SLC7A5, DCT, and AXL, which are known to play critical roles in melanoma progression, phenotype switching, and drug resistance. SOX10 has been implicated in melanoma cell state transitions and therapy resistance. Similarly, ARAF and AXL are associated with resistance to BRAF/MEK inhibitors, while SLC7A5 (LAT1) has been linked to metabolic reprogramming in melanoma. In addition to identifying critical genes, our enrichment analysis revealed key pathways such as antigen processing and presentation, leukocyte differentiation, and signaling by receptor tyrosine kinases (RTKs). These pathways are well-documented in melanoma research, particularly in the context of immune evasion, tumor progression, and therapy resistance. For example, the antigen processing and presentation pathway is crucial for melanoma immunogenicity and influences therapeutic responses to inhibitors. The identification of these pathways demonstrates the biological relevance and robustness of our approach.
Our DL-based approach demonstrated clear advantages over traditional bioinformatics tools such as LIMMA, SAM and the t-test. These traditional methods rely on linear assumptions and have limited capacity to capture complex interactions within high-dimensional data. In contrast, the adapted methods in our DL-based approach capture non-linear relationships, enabling the identification of a broader set of genes with strong biological relevance. For instance, in the A375 cell line dataset, IG identified 32 expressed genes in the four well-established melanoma cell lines, while LIMMA identified 29 expressed genes. In terms of the 451Lu cell line dataset, using IG in our approach identified 31 expressed genes in the four well-established cell lines, while the t-test identified 27 expressed genes. Moreover, our analysis highlighted FDA-approved drugs and potential therapeutic candidates for melanoma. Notably, our DL-based approach reduced the search space, identifying promising FDA-approved drugs such as Vemurafenib and Dabrafenib, which are both BRAF inhibitors used to treat BRAF-mutant melanoma. The Integrative OncoGenomics knowledge base (https://www.intogen.org/, accessed on 3 August 2025) shows that BRAF is ranked as the top cancer-driving gene by mutational frequency, being detected in 425 out of 929 samples. In other words, BRAF mutation was detected in 45.75% of samples. Additionally, Sorafenib, which targets RAF kinases, and Nelfinavir, an HIV protease inhibitor with emerging anti-melanoma properties, were identified as potential therapeutic options. These findings align with current clinical practices and highlight the potential of our DL-based approach to aid in drug repurposing for melanoma. Transcription factors such as MITF, RELA, E2F1, and TFAP2A were identified as critical regulators of melanoma progression and drug resistance. These TFs not only serve as biomarkers but also represent potential targets for therapeutic intervention. For instance, MITF regulates melanocyte lineage survival, while E2F1 is involved in melanoma cell proliferation and apoptosis. RELA and NFKB1 are central to inflammatory signaling and therapy resistance, providing avenues for targeted therapies.
Quantifying the importance of each gene in DL-based methods is not trivial, a limitation attributed to the weight matrix (not a vector) between the input layer and first hidden layer (i.e., each gene is associated with a vector of values, not a single value). Because of this, we have three weight matrices in our study. Moreover, when evaluating the performance from a classification perspective, we employed five-fold cross-validation, selecting subsets of genes according to each method as follows. In the first run, samples in the first fold are assigned for testing, and samples in remaining folds are used to train randomly selected machine learning algorithms, generating models that are then applied independently to test examples. Then, performance results are recorded. This process is repeated four times, recording performance results each time. The average of these performance results represents the five-fold cross-validation. The machine learning algorithms (i.e., SVM, RF, and NN) were not used in the feature selection, and the five-fold cross-validation results were reported for the five testing folds, corresponding to unseen examples not used during the training process. It is worth noting that the NN in the classification is not like the NN in our approach, which has different numbers of neurons in the hidden layers and thereby different hyperparameters, leading to different models. Our results demonstrated that genes produced using IG represent a gene signature with predictive potential.
From a classification perspective, the gene sets selected by IG within our approach coupled with machine learning algorithms demonstrated superior predictive performance compared to the best-performing existing methods. According to performance metrics, in the A375 cell line dataset, IG had a total loss of 4.2% (F1) or 4% (BAC), while LIMMA had a total loss of 6.4% (F1) or 6% (BAC). For the 451Lu cell line dataset, IG resulted in a total loss of 2.1% (F1) or 3% (BAC), while the t-test had a total loss of 2.6% (F1) or 3.3% (BAC). We had 14.4% and 11.7% performance improvements (see Tables S2 and S4 in Supplementary Additional File) when IG is compared to only applying learning algorithms to the a375 and 451Lu datasets without gene selection (hereafter referred to as ALL). We assessed the statistical significance of the prediction performance when coupled with each method. Notably, prediction performance score was significantly better in IG compared to ALL ( p = 4.67 × 10 2 from the t-test). On the other hand, prediction performance was not significantly better in LIMMA when compared to ALL ( p = 1.02 × 10 1 from the t-test). The same holds for all other methods, where there was no statistical performance difference when compared to ALL using the A375 dataset. For the 451Lu dataset, prediction performance was significantly better in IG compared to ALL ( p = 3.97 × 10 4 from the t-test). Similarly, prediction performance was significantly better when compared to ALL ( p = 3.87 × 10 4 from the t-test). These results demonstrate the superiority and consistency of the IG method in both datasets. Statistical significance results are shown Tables S5 and S6 within the Supplementary Additional File.
Predicting drug sensitivity is of great importance in clinical settings. Hence, improving prediction performance is an ongoing endeavor. Classification performance was assessed by using five-fold cross-validation to measure the predictive power of the produced genes; we randomly applied three machine learning algorithms—SVM, RF, and NN—with different hyperparameters from the network used in our DL-based approach. For evaluation fairness, all methods were provided with the same scRNA gene expression data and produced 100 genes that were input into enrichment analysis tools such as Enrichr and Metascape. In terms of classification assessment, genes in each dataset were selected based on the genes produced via each method, followed by running five-fold cross-validation using three randomly selected machine learning algorithms that were not used when conducting biological analysis.
This study uses the LIMMA, SAM, and t-test methods for differential expression (DE) analysis. The other methods—L1-Regularization, DeepLIFT, SHAP, IG, and the LR— are adapted for use in gene selection. Regardless of their computational behavior, each fairness method was treated as a backbox and assessed from both biological and classification perspectives. The former is used to inspect the method in terms of number of expressed genes and various molecular mechanisms. The latter is used to identify the method producing gene signatures with predictive potential. Unlike the feature selection methods used in machine learning, when compared with bioinformatics-based tools in which identifying the importance of each gene is straightforward and heavily validated, quantifying the importance of each gene in DL is not trivial; this is attributed to a weight matrix (not a vector) between the input layer and first hidden layer (i.e., each gene is associated with a vector of values not a single value). Our results demonstrated the feasibility of DL, as well as identifying the best-performing adapted DL-based feature selection method. Although training is time-consuming in our DL-based approach, where we have three weight matrices that need to be updated through the training process, experimental results demonstrated the feasibility of deep learning as a tool for assisting clinicians in identifying effective drugs during clinical trials. In particular, the fact that we identified two FDA-approved drugs (out of many) that target the most cancer-driving gene in melanoma is akin to finding a needle in a haystack.

5. Conclusions and Future Work

This study presents a novel DL-based computational approach to elucidate critical genes, pathways, drugs, and therapeutic targets associated with drug resistance in melanoma. Compared to existing tools, our approach more effectively identifies biologically and clinically relevant genes, as demonstrated by its superiority from both biological and classification perspectives. Biological assessment using two melanoma cell line datasets from the GEO repository demonstrated that the methods in our approach identified a higher number of expressed genes in four widely studied melanoma cell lines: MALME-3M, MDA-MB435, SK-MEL-28, and SK-MEL-5. Key biological findings included the identification of critical genes such as SOX10, ARAF, SLC7A5, and AXL, as well as transcription factors like MITF and RELA, which are linked to melanoma progression and drug resistance. Our DL-based approach also identified FDA-approved drugs, including Vemurafenib and Dabrafenib, as well as potential therapeutic candidates like Sorafenib and Nelfinavir, demonstrating its potential for increasing the speed of the drug discovery process. Assessment from a classification perspective demonstrates that adapting integrated gradients (IG) into our approach resulted in 2.2% and 0.5% overall performance improvements when compared to the best-performing baselines, based on A375 and 451Lu cell line datasets. Additionally, 14.4% and 11.7% performance improvements were obtained when compared to only applying learning algorithms to the a375 and 451Lu datasets without selecting any genes. These results demonstrate the ability of our DL-based approach to (1) reduce the search space pertaining to drugs, therapeutic targets, biomarker genes, biological processes, and pathways in melanoma, and (2) identify discriminant gene sets that can guide in predicting melanoma drug response. Moreover, clinicians can benefit from employing the presented DL-based approach as it reduces the search space for drugs, drug targets, transcription factors, and related pathways and processes to melanoma drug resistance, thereby accelerating the drug discovery process.
Future work will include (1) using our DL-based approach to reveal shared molecular mechanisms pertaining to melanoma and other cancer types; (2) identifying gene signatures for melanoma patients treated with multiple targeted inhibitors; (3) incorporating agentic AI with our DL-based approach to improve the outcomes for different cancer types from both biological and classification perspectives; (4) adapting the presented approach to identify significantly mutated genes; and (5) formulating melanoma drug resistance as a ranking problem, followed by adapting the DL-based approach to rank the genes from the most mutational cancer-driving genes to the least mutational cancer-driving genes.

Supplementary Materials

The following supporting information can be downloaded at: https://www.mdpi.com/article/10.3390/math13203334/s1.

Author Contributions

S.A.: methodology, software, visualization, investigation, writing—original draft preparation. T.T.: conceptualization, methodology, data curation, supervision, writing—reviewing and editing. Y.-h.T.: validation, writing—reviewing and editing. All authors have read and agreed to the published version of the manuscript.

Funding

The project was funded by KAU Endowment (WAQF) at king Abdulaziz University, Jeddah, Saudi Arabia. The authors, therefore, acknowledge with thanks WAQF and the Deanship of Scientific Research (DSR) for technical and financial support.

Data Availability Statement

Data are contained within the article.

Conflicts of Interest

The authors declare no conflicts of interest.

References

  1. Tawbi, H.; Nimmagadda, N. Targeted therapy in melanoma. Biol. Targets Ther. 2009, 3, 475–484. [Google Scholar] [CrossRef]
  2. Su, Y.; Wei, W.; Robert, L.; Xue, M.; Tsoi, J.; Garcia-Diaz, A.; Moreno, B.H.; Kim, J.; Ng, R.H.; Lee, J.W.; et al. Single-cell analysis resolves the cell state transition and signaling dynamics associated with melanoma drug-induced resistance. Proc. Natl. Acad. Sci. USA 2017, 114, 13679–13684. [Google Scholar] [CrossRef]
  3. Ho, Y.-J.; Anaparthy, N.; Molik, D.; Mathew, G.; Aicher, T.; Patel, A.; Hicks, J.; Hammell, M.G. Single-cell RNA-seq analysis identifies markers of resistance to targeted BRAF inhibitors in melanoma cell populations. Genome Res. 2018, 28, 1353–1363. [Google Scholar] [CrossRef]
  4. Schmidt, M.; Mortensen, L.S.; Loeffler-Wirth, H.; Kosnopfel, C.; Krohn, K.; Binder, H.; Kunz, M. Single-cell trajectories of melanoma cell resistance to targeted treatment. Cancer Biol. Med. 2022, 19, 56. [Google Scholar] [CrossRef]
  5. Zhang, C.; Shen, H.; Yang, T.; Li, T.; Liu, X.; Wang, J.; Liao, Z.; Wei, J.; Lu, J.; Liu, H.; et al. A single-cell analysis reveals tumor heterogeneity and immune environment of acral melanoma. Nat. Commun. 2022, 13, 7250. [Google Scholar] [CrossRef]
  6. Egan, D.; Kreileder, M.; Nabhan, M.; Iglesias-Martinez, L.F.; Dovedi, S.J.; Valge-Archer, V.; Grover, A.; Wilkinson, R.J.; Slidel, T.; Bendtsen, C.; et al. Small gene networks can delineate immune cell states and characterize immunotherapy response in melanoma. bioRxiv 2022, 11, 1125–1136. [Google Scholar] [CrossRef]
  7. Li, J.; Smalley, I.; Chen, Z.; Wu, J.-Y.; Phadke, M.S.; Teer, J.K.; Nguyen, T.; Karreth, F.A.; Koomen, J.M.; Sarnaik, A.A.; et al. Single-cell Characterization of the Cellular Landscape of Acral Melanoma Identifies Novel Targets for Immunotherapy. Clin. Cancer Res. 2022, 28, 2131–2146. [Google Scholar] [CrossRef] [PubMed]
  8. Zhang, Z.; Zhang, D.; Wang, F.; Liu, J.; Jiang, X.; Anuchapreeda, S.; Tima, S.; Xiao, Z.; Duangmano, S. CD3ζ as a novel predictive biomarker of PD-1 inhibitor resistance in melanoma. Mol. Cell. Probes 2023, 72, 101925. [Google Scholar] [CrossRef] [PubMed]
  9. Bakr, M.N.; Takahashi, H.; Kikuchi, Y. CHRNA1 and its correlated-myogenesis/cell cycle genes are prognosis-related markers of metastatic melanoma. Biochem. Biophys. Rep. 2023, 33, 101425. [Google Scholar] [CrossRef]
  10. Wang, Q.; Liu, W.; Zhou, H.; Lai, W.; Hu, C.; Dai, Y.; Li, G.; Zhang, R.; Zhao, Y. Tozasertib activates anti-tumor immunity through decreasing regulatory T cells in melanoma. Neoplasia 2024, 48, 100966. [Google Scholar] [CrossRef]
  11. Chen, S.; Tang, Z.; Wan, Q.; Huang, W.; Li, X.; Huang, X.; Zheng, S.; Lu, C.; Wu, J.; Li, Z.; et al. Machine learning and single-cell RNA sequencing reveal relationship between intratumor CD8+ T cells and uveal melanoma metastasis. Cancer Cell Int. 2024, 24, 359. [Google Scholar] [CrossRef]
  12. Pinhasi, A.; Yizhak, K. Uncovering gene and cellular signatures of immune checkpoint response via machine learning and single-cell RNA-seq. NPJ Precis. Oncol. 2025, 9, 95. [Google Scholar] [CrossRef]
  13. Barrett, T.; Wilhite, S.E.; Ledoux, P.; Evangelista, C.; Kim, I.F.; Tomashevsky, M.; Marshall, K.A.; Phillippy, K.H.; Sherman, P.M.; Holko, M.; et al. NCBI GEO: Archive for functional genomics data sets—Update. Nucleic Acids Res. 2012, 41, D991–D995. [Google Scholar] [CrossRef]
  14. National Center for Biotechnology Information. GEO Accession Viewer: SAKE (Single-Cell RNA-Seq Analysis and Klustering Evaluation) Identifies Markers of Resistance to Targeted BRAF Inhibitors in Melanoma Cell Populations [Fluidigm scRNA-Seq]. National Library of Medicine. 2018. Available online: https://www.ncbi.nlm.nih.gov/geo/query/acc.cgi?acc=GSE108383 (accessed on 10 September 2024).
  15. Goodfellow, I.; Bengio, Y.; Courville, A. Deep Learning; MIT Press: Cambridge, MA, USA, 2016. [Google Scholar]
  16. Glorot, X.; Bordes, A.; Bengio, Y. Deep sparse rectifier neural networks. In Proceedings of the Fourteenth International Conference on Artificial Intelligence and Statistics, Fort Lauderdale, FL, USA, 11–13 April 2011; JMLR Workshop and Conference Proceedings. pp. 315–323. [Google Scholar]
  17. Srivastava, N.; Hinton, G.; Krizhevsky, A.; Sutskever, I.; Salakhutdinov, R. Dropout: A simple way to prevent neural networks from overfitting. J. Mach. Learn. Res. 2014, 15, 1929–1958. [Google Scholar]
  18. Tibshirani, R. Regression shrinkage and selection via the lasso. J. R. Stat. Soc. Ser. B Stat. Methodol. 1996, 58, 267–288. [Google Scholar] [CrossRef]
  19. Shajalal, M.; Boden, A.; Stevens, G. ForecastExplainer: Explainable household energy demand forecasting by approximating shapley values using DeepLIFT. Technol. Forecast. Soc. Change 2024, 206, 123588. [Google Scholar] [CrossRef]
  20. Rynazal, R.; Fujisawa, K.; Shiroma, H.; Salim, F.; Mizutani, S.; Shiba, S.; Yachida, S.; Yamada, T. Leveraging explainable AI for gut microbiome-based colorectal cancer classification. Genome Biol. 2023, 24, 21. [Google Scholar] [CrossRef]
  21. Sundararajan, M.; Taly, A.; Yan, Q. Axiomatic attribution for deep networks. In Proceedings of the International Conference on Machine Learning, Sydney, Australia, 6–11 August 2017; pp. 3319–3328. [Google Scholar]
  22. Bach, S.; Binder, A.; Montavon, G.; Klauschen, F.; Müller, K.R.; Samek, W. On pixel-wise explanations for non-linear classifier decisions by layer-wise relevance propagation. PLoS ONE 2015, 10, e0130140. [Google Scholar] [CrossRef] [PubMed]
  23. Kuleshov, M.V.; Jones, M.R.; Rouillard, A.D.; Fernandez, N.F.; Duan, Q.; Wang, Z.; Koplev, S.; Jenkins, S.L.; Jagodnik, K.M.; Lachmann, A. Enrichr: A comprehensive gene set enrichment analysis web server 2016 update. Nucleic Acids Res. 2016, 44, W90–W97. [Google Scholar] [CrossRef] [PubMed]
  24. Zhou, Y.; Zhou, B.; Pache, L.; Chang, M.; Khodabakhshi, A.H.; Tanaseichuk, O.; Benner, C.; Chanda, S.K. Metascape provides a biologist-oriented resource for the analysis of systems-level datasets. Nat. Commun. 2019, 10, 1523. [Google Scholar] [CrossRef] [PubMed]
  25. Ritchie, M.E.; Phipson, B.; Wu, D.; Hu, Y.; Law, C.W.; Shi, W.; Smyth, G.K. limma powers differential expression analyses for RNA-sequencing and microarray studies. Nucleic Acids Res. 2015, 43, e47. [Google Scholar] [CrossRef]
  26. Tusher, V.G.; Tibshirani, R.; Chu, G. Significance analysis of microarrays applied to the ionizing radiation response. Proc. Natl. Acad. Sci. USA 2001, 98, 5116–5121. [Google Scholar] [CrossRef]
  27. Team, R. C.; Team, M. R. C; Suggests, M.A.S.S.; Matrix, S. Package Stats. The R Stats Package. 2018, pp. 1–3. Available online: https://stat.ethz.ch/R-manual/R-devel/library/stats/html/00Index.html (accessed on 10 October 2024).
  28. Python Software Foundation. Python Language Reference, Version 3.x. 2023. Available online: https://www.python.org. (accessed on 5 October 2024).
  29. Paszke, A.; Gross, S.; Massa, F.; Lerer, A.; Bradbury, J.; Chanan, G.; Killeen, T.; Lin, Z.; Gimelshein, N.; Antiga, L.; et al. PyTorch: An imperative style, high-performance deep learning library. Adv. Neural Inf. Process. Syst. 2019, 32, 8026–8037. [Google Scholar]
  30. Kokhlikyan, N.; Miglani, V.; Martin, M.; Wang, E.; Alsallakh, B.; Reynolds, J.; Melnikov, A.; Kliushkina, N.; Araya, C.; Yan, S.; et al. Captum: A unified and generic model interpretability library for PyTorch. arXiv 2020, arXiv:2009.07896. [Google Scholar] [CrossRef]
  31. Lundberg, S.M.; Contributors. SHAP (SHapley Additive exPlanations) [Python Library]. GitHub. 2017. Available online: https://github.com/slundberg/shap (accessed on 10 October 2024).
  32. R Core Team. R: A Language and Environment for Statistical Computing; R Core Team: Vienna, Austria, 2008; Volume 25. [Google Scholar]
  33. Schwender, H. Siggenes: Multiple Testing Using SAM and Efron’s Empirical Bayes Approaches; R Package Version 1; R Core Team: Vienna, Austria, 2012; pp. 1–70. [Google Scholar]
  34. Martins, I.; Deshayes, F.; Baton, F.; Forget, A.; Ciechomska, I.; Sylla, K.; Aoudjit, F.; Charron, D.; Al-Daccak, R.; Alcaide-Loridan, C. Pathologic expression of MHC class II is driven by mitogen-activated protein kinases. Eur. J. Immunol. 2007, 37, 788–797. [Google Scholar] [CrossRef] [PubMed]
  35. Singleton, K.R.; Crawford, L.; Tsui, E.; Manchester, H.E.; Maertens, O.; Liu, X.; Liberti, M.V.; Magpusao, A.N.; Stein, E.M.; Tingley, J.P.; et al. Melanoma therapeutic strategies that select against resistance by exploiting MYC-driven evolutionary convergence. Cell Rep. 2017, 21, 2796–2812. [Google Scholar] [CrossRef] [PubMed]
  36. Bucci, B.; D’AGnano, I.; Amendola, D.; Citti, A.; Raza, G.H.; Miceli, R.; De Paula, U.; Marchese, R.; Albini, S.; Felsani, A.; et al. Myc down-regulation sensitizes melanoma cells to radiotherapy by inhibiting MLH1 and MSH2 mismatch repair proteins. Clin. Cancer Res. 2005, 11, 2756–2767. [Google Scholar] [CrossRef] [PubMed]
  37. Liu, Y.; Luo, D.; Lu, Y.; Tan, L. E2F transcription factor 1 as a potential prognostic biomarker and promotes tumor proliferation in skin cutaneous melanoma. Pathol. Res. Pract. 2025, 269, 155875. [Google Scholar] [CrossRef]
  38. Sheen, Y.; Syu, Y.; Chang, Y.; Hsieh, P.; Liao, Y.; Lin, M.; Chen, C.; Chu, C. Insulin-like growth factor 2 mRNA—binding protein 3 enhanced melanoma migration through regulation of AKT1 and RELA expression. Exp. Dermatol. 2024, 33, e15015. [Google Scholar] [CrossRef]
  39. Ueda, Y.; Richmond, A. NF-κB activation in melanoma. Pigment. Cell Res. 2006, 19, 112–124. [Google Scholar] [CrossRef]
  40. Capparelli, C.; Purwin, T.J.; Glasheen, M.; Caksa, S.; Tiago, M.; Wilski, N.; Pomante, D.; Rosenbaum, S.; Nguyen, M.Q.; Cai, W.; et al. Targeting SOX10-deficient cells to reduce the dormant-invasive phenotype state in melanoma. Nat. Commun. 2022, 13, 1381. [Google Scholar] [CrossRef]
  41. Zhou, S.; Li, P.; Qin, L.; Huang, S.; Dang, N. Transcription factor YY1 contributes to human melanoma cell growth through modulating the p53 signalling pathway. Exp. Dermatol. 2022, 31, 1563–1578. [Google Scholar] [CrossRef] [PubMed]
  42. Dhatchinamoorthy, K.; Colbert, J.D.; Rock, K.L. Cancer immune evasion through loss of MHC class I antigen presentation. Front. Immunol. 2021, 12, 636568. [Google Scholar] [CrossRef] [PubMed]
  43. Qian, Z.; Chang, T.; Zhang, T.; Gu, H.; Wang, J. Genomic analyses identify signaling pathways and biological processes in small and large melanoma. Res. Sq. Prepr. 2022. [Google Scholar] [CrossRef]
  44. Oliver, J.; Onieva, J.L.; Garrido-Barros, M.; Berciano-Guerrero, M.; Sánchez-Muñoz, A.; Lozano, M.J.; Farngren, A.; Álvarez, M.; Martínez-Gálvez, B.; Pérez-Ruiz, E.; et al. Association of circular RNA and long non-coding RNA dysregulation with the clinical response to immune checkpoint blockade in cutaneous metastatic melanoma. Biomedicines 2022, 10, 2419. [Google Scholar] [CrossRef]
  45. Wolf, J.; Boneva, S.; Rosmus, D.-D.; Agostini, H.; Schlunck, G.; Wieghofer, P.; Schlecht, A.; Lange, C. Deciphering the molecular signature of human hyalocytes in relation to other innate immune cell populations. Investig. Ophthalmol. Vis. Sci. 2022, 63, 9. [Google Scholar] [CrossRef]
  46. Nazarian, R.; Shi, H.; Wang, Q.; Kong, X.; Koya, R.C.; Lee, H.; Chen, Z.; Lee, M.-K.; Attar, N.; Sazegar, H.; et al. Melanomas acquire resistance to B-RAF (V600E) inhibition by RTK or N-RAS upregulation. Nature 2010, 468, 973–977. [Google Scholar] [CrossRef] [PubMed]
  47. Kim, A.; Cohen, M.S. The discovery of vemurafenib for the treatment of BRAF-mutated metastatic melanoma. Expert Opin. Drug Discov. 2016, 11, 907–916. [Google Scholar] [CrossRef]
  48. Kim, G.; McKee, A.E.; Ning, Y.-M.; Hazarika, M.; Theoret, M.; Johnson, J.R.; Xu, Q.C.; Tang, S.; Sridhara, R.; Jiang, X.; et al. DA approval summary: Vemurafenib for treatment of unresectable or metastatic melanoma with the BRAFV600E mutation. Clin. Cancer Res. 2014, 20, 4994–5000. [Google Scholar] [CrossRef]
  49. Robert, C.; Grob, J.J.; Stroyakovskiy, D.; Karaszewska, B.; Hauschild, A.; Levchenko, E.; Chiarion Sileni, V.; Schachter, J.; Garbe, C.; Bondarenko, I.; et al. Five-year outcomes with dabrafenib plus trametinib in metastatic melanoma. N. Engl. J. Med. 2019, 381, 626–636. [Google Scholar] [CrossRef]
  50. Liu, L.; Cao, Y.; Chen, C.; Zhang, X.; McNabola, A.; Wilkie, D.; Wilhelm, S.; Lynch, M.; Carter, C. Sorafenib blocks the RAF/MEK/ERK pathway, inhibits tumor angiogenesis, and induces tumor cell apoptosis in hepatocellular carcinoma model PLC/PRF/5. Cancer Res. 2006, 66, 11851–11858. [Google Scholar] [CrossRef]
  51. Shi, Z.; Kaneda-Nakashima, K.; Ohgaki, R.; Xu, M.; Okanishi, H.; Endou, H.; Nagamori, S.; Kanai, Y. Inhibition of cancer-type amino acid transporter LAT1 suppresses B16-F10 melanoma metastasis in mouse models. Sci. Rep. 2023, 13, 13943. [Google Scholar] [CrossRef]
  52. Augustin, R.C.; Huang, Z.; Ding, F.; Zhai, S.; McArdle, J.; Santisi, A.; Davis, M.; Sander, C.; Davar, D.; Kirkwood, J.M.; et al. Metformin is associated with improved clinical outcomes in patients with melanoma: A retrospective, multi-institutional study. Front. Oncol. 2023, 13, 1075823. [Google Scholar] [CrossRef] [PubMed]
  53. Seberg, H.E.; Van Otterloo, E.; Cornell, R.A. Beyond MITF: Multiple transcription factors directly regulate the cellular phenotype in melanocytes and melanoma. Pigment. Cell Melanoma Res. 2017, 30, 454–466. [Google Scholar] [CrossRef] [PubMed]
  54. Liao, L.; Han, W.; Shen, Y.; Shen, G. Comprehensive analysis of aberrantly methylated differentially expressed genes and validation of CDC6 in melanoma. J. Cancer Res. Clin. Oncol. 2024, 150, 362. [Google Scholar] [CrossRef] [PubMed]
  55. Rajasekaran, S.; Cheng, S.; Gajendran, N.; Shekoohi, S.; Chesnokova, L.; Yu, X.; Witt, S.N. Transcriptomic analysis of melanoma cells reveals an association of α-synuclein with regulation of the inflammatory response. Sci. Rep. 2024, 14, 27140. [Google Scholar] [CrossRef]
  56. Goff, P.H.; Baker, K.K.; Lee, S.M.; Tykodi, S.S.; Bhatia, S.; Zeng, J.; Redman, M.; Rengan, R. 610 ImmunoRad: A stratified phase II trial of image guided hypofractionated radiotherapy with concurrent nelfinavir & PD-1 inhibition in advanced melanoma, lung cancer & renal cell carcinoma. J. Immunother. Cancer 2023, 11. [Google Scholar] [CrossRef]
  57. Kim, K.B.; Eton, O.; Davis, D.W.; Frazier, M.L.; McConkey, D.J.; Diwan, A.H.; Papadopoulos, N.E.; Bedikian, A.Y.; Camacho, L.H.; Ross, M.I.; et al. Phase II trial of imatinib mesylate in patients with metastatic melanoma. Br. J. Cancer 2008, 99, 734–740. [Google Scholar] [CrossRef]
  58. Carvajal, R.D.; Antonescu, C.R.; Wolchok, J.D.; Chapman, P.B.; Roman, R.A.; Teitcher, J.; Panageas, K.S.; Busam, K.J.; Chmielowski, B.; Lutzky, J.; et al. KIT as a therapeutic target in metastatic melanoma. JAMA 2011, 305, 2327–2334. [Google Scholar] [CrossRef]
  59. Daud, A.; Kluger, H.M.; Kurzrock, R.; Schimmoller, F.; Weitzman, A.L.; Samuel, T.A.; Moussa, A.H.; Gordon, M.S.; Shapiro, G.I. Phase II randomised discontinuation trial of the MET/VEGF receptor inhibitor cabozantinib in metastatic melanoma. Br. J. Cancer 2017, 116, 432–440. [Google Scholar] [CrossRef]
  60. Moro-Sibilot, D.; Cozic, N.; Pérol, M.; Mazières, J.; Otto, J.; Souquet, P.; Bahleda, R.; Wislez, M.; Zalcman, G.; Guibert, S.; et al. Crizotinib in c-MET-or ROS1-positive NSCLC: Results of the AcSé phase II trial. Ann. Oncol. 2019, 30, 1985–1991. [Google Scholar] [CrossRef] [PubMed]
  61. Wan, X.; Zhu, Y.; Zhang, L.; Hou, W. Gefitinib inhibits malignant melanoma cells through the VEGF/AKT signaling pathway. Mol. Med. Rep. 2018, 17, 7351–7355. [Google Scholar] [CrossRef] [PubMed]
  62. ZZhang, X.; Fang, X.; Gao, Z.; Chen, W.; Tao, F.; Cai, P.; Yuan, H.; Shu, Y.; Xu, Q.; Sun, Y.; et al. Axitinib, a selective inhibitor of vascular endothelial growth factor receptor, exerts an anticancer effect in melanoma through promoting antitumor immunity. Anti-Cancer Drugs 2014, 25, 204–211. [Google Scholar] [CrossRef]
  63. Skoko, J.; Rožanc, J.; Charles, E.M.; Alexopoulos, L.G.; Rehm, M. Post-treatment de-phosphorylation of p53 correlates with dasatinib responsiveness in malignant melanoma. BMC Cell Biol. 2018, 19, 28. [Google Scholar] [CrossRef] [PubMed]
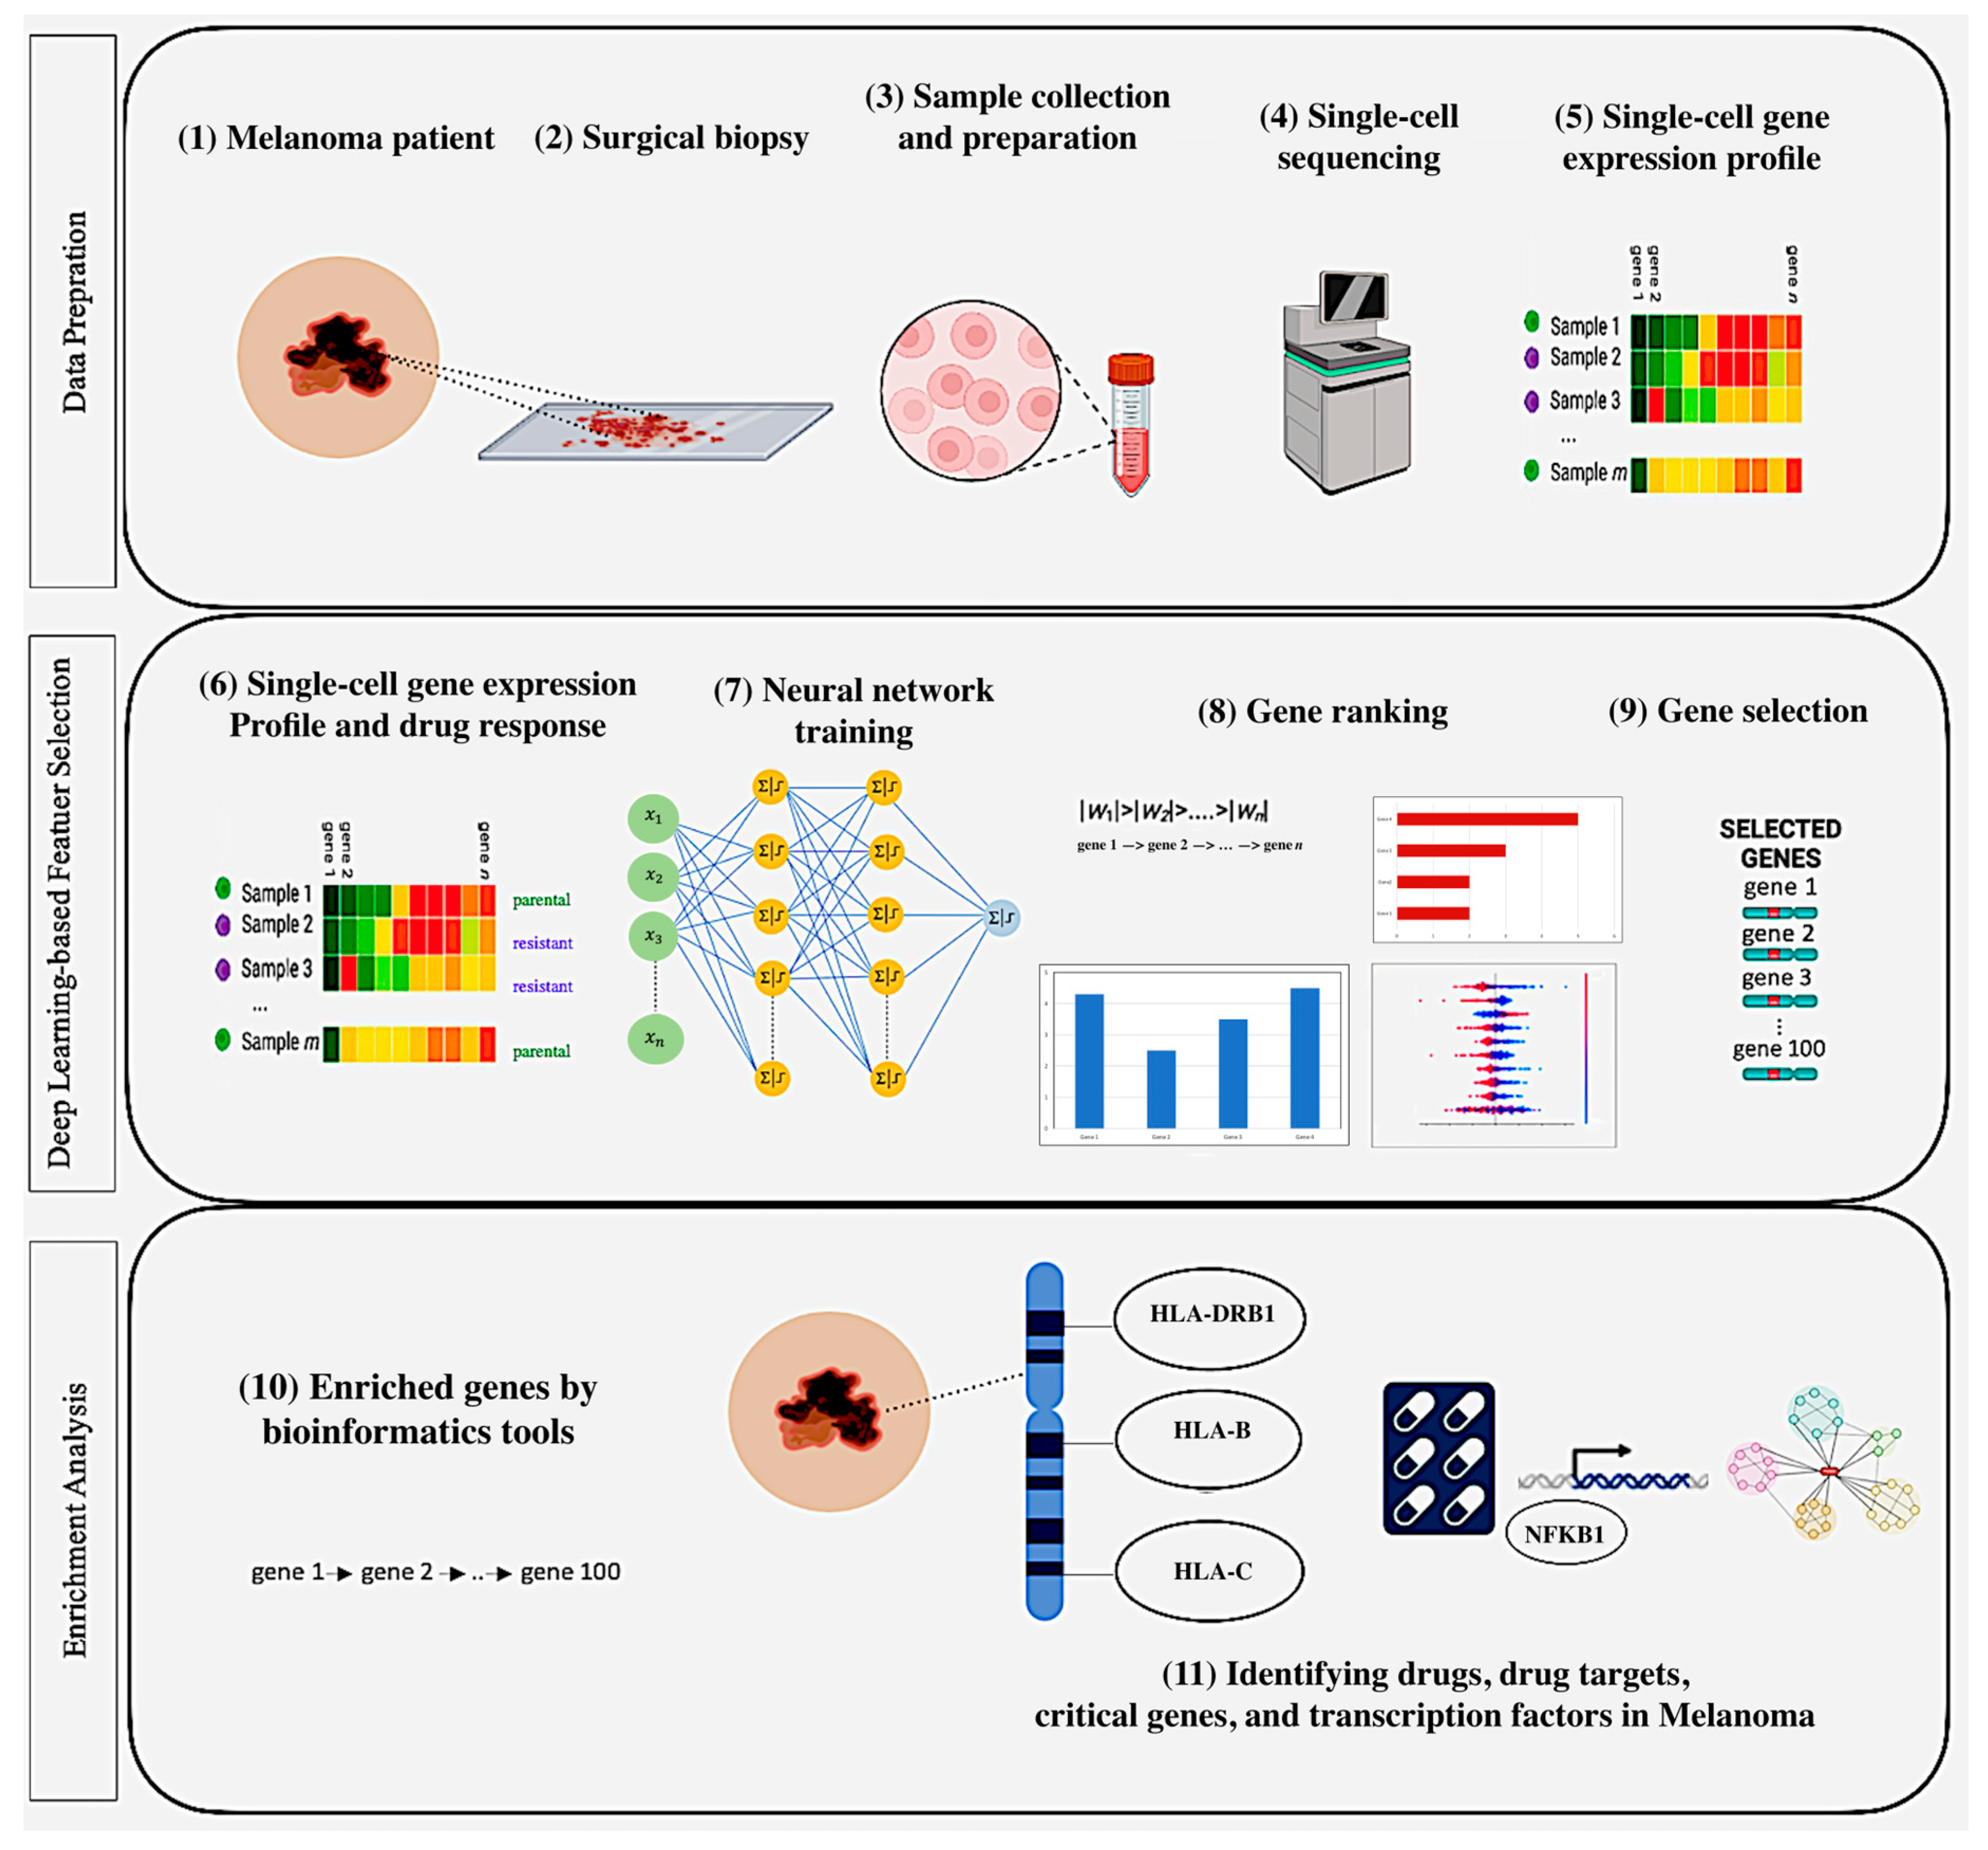
Figure 1. Flowchart of the DL-powered computational approach identifying drugs, drug targets, critical genes, and transcription factors in melanoma. Data preparation: acquiring scRNA gene expression data pertaining to resistant and parental states in A375 and 451Lu cell lines from the GEO NCBI database. Deep learning-based gene selection: Providing scRNA gene expression data to neural network to identify 100 genes by ranking the genes from the highest to the lowest based on the sum of absolute values for corresponding weights across all neurons in the first hidden layer. Figure created with BioRender.com. Enrichment analysis: Uploading 100 genes to Enrichr and Metscape for biological analysis, identifying genes expressed in well-established melanoma cell lines, drugs, drug target, transcription factors, and biological processes and pathways.
Mathematics 13 03334 g001
Figure 2. Architecture of the fully connected feedforward neural network in the proposed approach.
Mathematics 13 03334 g002
Figure 3. (a) UpSet plot of gene lists provided by all the computational methods when using the A375 cell line. (b) Three clusters identified in PPI network pertaining to the A375 cell line. (c) Ten transcription factors (from Metascape) obtained when coupled with genes from DeepLIFT. (d) Enrichment analysis pertaining to twenty transcription factor targets. (e) Process and pathway enrichment analysis provided by Metascape according to genes produced via DeepLIFT when using the A375 cell line.
Mathematics 13 03334 g003
Figure 4. (a) UpSet plot of gene lists provided by all the computational methods when using the 451Lu cell line. (b) Two clusters identified in PPI network pertaining to the 451Lu cell line. (c) A retrieved transcription factor based on genes from DeepLIFT when provided to Metascape. (d) Enrichment analysis pertaining to twenty transcription factor targets for studied in the 451Lu cell line. (e) Process and pathway enrichment analysis provided by Metascape according to the 100 genes identified by DeepLIFT using the 451Lu cell line.
Mathematics 13 03334 g004
Figure 5. (a) BAC of each model during five-fold cross-validation when coupled with gene sets from each method according to the A375 cell line. (b) F1 results of each model during five-fold cross-validation when coupled with gene sets produced via each method when using the A375 cell line.
Mathematics 13 03334 g005
Figure 6. (a) The BAC of each model during five-fold cross-validation via the gene sets of each method using the 451Lu cell line. (b) F1 results of each model during five-fold cross-validation when coupled with gene sets produced via each method when using the 451Lu cell line.
Mathematics 13 03334 g006
Table 1. Summary of the related works pertaining to melanoma when compared against our proposed work.
Ref.YearObjectiveData SourceMain Findings
[3]2018Identifying resistance markers to BRAF inhibitors in melanoma.scRNA-seqKnown markers (DCT, AXL, NRG1).
[4]2022Analyzing resistance in BRAF V600E melanoma cells.scRNA-seqKDM5B as marker; distinct sensitivity/resistance states.
[5]2022Investigate tumor heterogeneity and immune environment in AM and CM.scRNA-seqFive cell clusters (e.g., TGF-β, cell cycle) associated with good melanoma prognosis.
[6]2022Characterizing immune cell states and predicting responses to ICIs.scRNA-seqFour immune states; patients clustering into response groups.
[7]2022Characterizing the cellular and immune landscape in AM.scRNA-seqAM has fewer immune cells; immune checkpoints (PD-1) as therapeutic targets.
[8]2023Identifying biomarkers predicting resistance to PD-1 inhibitors.scRNA-seqCD3ζ predicts PD-1 resistance.
[9]2023Investigating CHRNA1’s role in melanoma metastasis.scRNA-seq/
bulk
CHRNA1 is highly expressed in metastasis.
[10]2024Assessing the impact of AURKB inhibition on melanoma immune response.scRNA-seq/
bulk
AURKB inhibition enhances anti-tumor immunity; Tozasertib reduces tumor growth.
[11]2024Identifying prognostic genes for UM metastasis using ML.scRNA-seq/
bulk
Three prognostic genes identified (SLC25A38, EDNRB, LURAP1).
[12]2025Enhancing the prediction of treatment outcomes in melanoma using ML.scRNA-seqEleven-gene signature (e.g., GAPDH, STAT1);
Proposed2025Unveiling various molecular mechanisms underlying melanoma drug resistance; performance validation from classification and biological perspectives against baseline methods.scRNA-seq-Adapting five DL-based methods:
L1-Regularization, DeepLIFT, SHAP, IG, LRP.
-Biological Perspective: More expressed genes, approved FDA drugs (Vemurafenib and Dabrafenib), TFs such as MITF and TFAP2A.
-Classification Results: 2.2% and 0.5% performance improvements over baseline methods
Table 2. Overview of scRNA-seq datasets downloaded from the Gene Expression Omnibus (GEO) database.
DatasetCell LineGenesSamples ParentalResistantPlatformOrganismExperiment Type
GSE108383A37527,0011307951GPL18573Homo sapiensExpression profiling via
high-throughput sequencing
GSE108383451Lu27,00119784113GPL18573Homo sapiensExpression profiling via
high-throughput sequencing
Table 3. NCI-60 cancer cell lines via Enrichr according to the genes produced by each method when using the A375 cell line.
MethodRankTermOverlapp-ValueAdjusted p-Value
L1-Regularization6MALME-3M5/3663.67 × 10−24.90 × 10⁻¹
3MDA-MB4358/6211.26 × 10−23.37 × 10⁻¹
31SKMEL283/4363.73 × 10−18.96 × 10⁻¹
2SKMEL56/3548.73 × 10−33.37 × 10⁻¹
DeepLIFT4MALME-3M7/3662.42 × 10−33.68 × 10⁻²
1MDA-MB43514/6212.53 × 10−61.67 × 10⁻⁴
7SKMEL287/4366.28 × 10−35.92 × 10⁻²
9SKMEL56/3548.73 × 10−36.40 × 10⁻²
SHAP5MALME-3M6/3661.02 × 10−21.55 × 10⁻¹
1MDA-MB43511/6212.74 × 10−42.09 × 10⁻²
7SKMEL286/4362.22 × 10−22.00 × 10⁻¹
4SKMEL56/3548.73 × 10−31.55 × 10⁻¹
IG4MALME-3M7/3662.42 × 10−33.91 × 10⁻²
1MDA-MB43514/6212.53 × 10−61.77 × 10⁻⁴
9SKMEL285/4366.77 × 10−24.32 × 10⁻¹
6SKMEL56/3548.73 × 10−31.02 × 10⁻¹
LRP3MALME-3M7/3662.42 × 10−35.25 × 10⁻²
1MDA-MB43513/6211.31 × 10−58.54 × 10⁻⁴
13SKMEL284/4361.75 × 10−17.90 × 10⁻¹
6SKMEL55/3543.25 × 10−23.52 × 10⁻¹
LIMMA7MALME-3M6/3661.02 × 10−29.17 × 10⁻²
2MDA-MB43512/6216.28 × 10−51.98 × 10⁻³
16SKMEL284/4361.75 × 10−16.87 × 10⁻¹
4SKMEL57/3542.00 × 10−33.16 × 10⁻²
SAM8MALME-3M6/3661.02 × 10−27.00 × 10⁻²
1MDA-MB43513/6211.31 × 10−57.22 × 10⁻⁴
14SKMEL284/4361.75 × 10−16.86 × 10⁻¹
5SKMEL57/3542.00 × 10−32.21 × 10⁻²
t-test8MALME-3M6/3661.02 × 10−27.13 × 10⁻²
1MDA-MB43513/6211.31 × 10−57.36 × 10⁻⁴
14SKMEL284/4361.75 × 10−16.98 × 10⁻¹
4SKMEL57/3542.01 × 10−32.81 × 10⁻²
Table 4. Enriched terms from IDG Drug Targets 2022 via Enrichr were retrieved according to uploaded genes from DeepLIFT using the A375 cell line. Genes (column: genes) associated with drugs (column: term) are shown. The rank column shows the order of terms upon retrieval.
RankTermClassGenesApproval Status/Study PhaseReferences
5VemurafenibBRAF/MEK Pathway InhibitorARAFFDA-Approved[47]
8DabrafenibBRAF/MEK Pathway InhibitorARAFFDA-Approved[48,49]
15SorafenibVEGFR, BRAF, and c-KITARAFClinical Trial[50]
1PhenylalanineLAT1 InhibitionSLC7A5Preclinical Studies[51]
14MetforminMitochondrial Complex I InhibitionNDUFA11Clinical Trials[52]
Table 5. NCI-60 cancer cell lines via Enrichr according to the genes produced by each method when using the 451Lu cell line.
MethodRankTermOverlap p-ValueAdjusted p-Value
L1-Regularization3MALME-3M7/3662.42 × 10−36.30 × 10⁻²
23MDA-MB4355/6211.99 × 10−16.78 × 10⁻¹
7SKMEL286/4362.22 × 10−22.48 × 10⁻¹
1SKMEL59/3547.11 × 10−55.55 × 10⁻³
DeepLIFT6MALME-3M7/3662.42 × 10−33.07 × 10⁻²
10MDA-MB4357/6213.62 × 10−22.74 × 10⁻¹
5SKMEL288/4361.55 × 10−32.35 × 10⁻²
1SKMEL59/3547.11 × 10−55.41 × 10⁻³
SHAP3MALME-3M7/3662.42 × 10−35.97 × 10⁻²
32MDA-MB4354/6213.77 × 10−18.59 × 10⁻¹
5SKMEL287/4366.28 × 10−39.29 × 10⁻²
2SKMEL57/3542.01 × 10−35.97 × 10⁻²
IG4MALME-3M8/3665.02 × 10−48.78 × 10⁻³
35MDA-MB4354/6213.77 × 10−18.18 × 10⁻¹
3SKMEL289/4363.38 × 10−48.56 × 10⁻³
1SKMEL510/3541.12 × 10−58.52 × 10⁻⁴
LRP6MALME-3M6/3661.02 × 10−21.19 × 10⁻¹
13MDA-MB4356/6219.11 × 10−24.91 × 10⁻¹
1SKMEL288/4361.55 × 10−31.08 × 10⁻¹
4SKMEL56/3548.73 × 10−31.19 × 10⁻¹
LIMMA5MALME-3M6/3669.26 × 10−31.37 × 10⁻¹
13MDA-MB4355/6211.89 × 10−17.00 × 10⁻¹
2SKMEL288/4361.36 × 10−35.03 × 10⁻²
7SKMEL55/3543.01 × 10−23.02 × 10⁻¹
SAM3MALME-3M8/3664.08 × 10−48.96 × 10⁻³
9MDA-MB4356/6218.14 × 10−26.60 × 10⁻¹
6SKMEL287/4365.32 × 10−36.47 × 10⁻²
2SKMEL58/3544.02 × 10−41.05 × 10⁻²
t-test4MALME-3M7/3662.03 × 10−33.71 × 10⁻²
10MDA-MB4356/6218.14 × 10−25.66 × 10⁻¹
7SKMEL286/4361.94 × 10−21.91 × 10⁻¹
2SKMEL58/3543.27 × 10−41.19 × 10⁻²
Table 6. Enriched terms from IDG Drug Targets 2022 via Enrichr were retrieved according to uploaded genes from DeepLIFT using the 451Lu cell line. Genes (column: genes) associated with drugs (column: term) are shown. The rank column shows the order of terms upon retrieval.
RankTermClassGenesApproval Status/Study PhaseReferences
11NelfinavirER stress/PI3K-Akt inhibitionOPRD1; TBXAS1Clinical trials[56]
54ImatinibKIT (c-KIT)SYK; TBXAS1Clinical trials[57,58]
69CabozantinibAXL, MET, VEGFR2AXLClinical trials[59]
100CrizotinibALK, MET, AXL, RONSYK; AXLClinical trials[60]
112GefitinibEGFRAXLClinical trials[61]
114AxitinibVEGFR1–3AXLClinical trials[62]
120DasatinibBCR-ABL/Src (SYK modulator)SYKClinical trials[63]
Disclaimer/Publisher’s Note: The statements, opinions and data contained in all publications are solely those of the individual author(s) and contributor(s) and not of MDPI and/or the editor(s). MDPI and/or the editor(s) disclaim responsibility for any injury to people or property resulting from any ideas, methods, instructions or products referred to in the content.