Abstract
The structural diversity of microbial communities plays a pivotal role in microbiological research and applications. However, the study of microbial transitions has remained challenging due to a lack of effective methods, limiting our understanding of microbial dynamics and their underlying mechanisms. To address this gap, we introduce MT-tracker (microbiome transition tracker), a novel algorithm designed to capture the transitional trajectories of microbial communities. Grounded in diversity and phylogenetic principles, MT-tracker reconstructs the virtual common ancestors of microbiomes at the community level. By calculating distances between microbiomes and their ancestors, MT-tracker deduces their transitional directions and probabilities, achieving a substantial speed advantage over conventional approaches. The accuracy and robustness of MT-tracker were first validated by a phylosymbiosis analysis using samples from 28 mammals and 24 nonmammal animals, describing the co-evolutionary pattern between hosts and their associated microbiomes. We then expanded the usage of MT-tracker to 456,702 microbiomes sampled world-wide, uncovering the global transitional directions among 21 ecosystems for the first time. This effort provides new insights into the macro-scale dynamic patterns of microbial communities. Additionally, MT-tracker revealed intricate longitudinal transition trends in human microbiomes over a sampling period exceeding 400 days, capturing temporal dynamics often overlooked by normal diversity analyses. In summary, MT-tracker offers robust support for the qualitative and quantitative analysis of microbial community diversity, offering significant potential for studying and utilizing the macrobiome variation.
MSC:
92C70
1. Introduction
The structure and dynamics of microbial communities hold a central role in ecology and microbiology [1]. Both deterministic processes (traditional niche-based theoretical assumptions) and stochastic processes (neutral theory) contribute to shaping microbial communities [2,3,4,5]. Vellend et al. proposed a conceptual framework unifying these perspectives, which identifies four fundamental ecological processes: selection, dispersal, drift, and diversification [6]. These processes operate across various temporal and spatial scales, collectively driving the dynamics and structure of microbial communities.
Various methods have been developed to investigate microbial community dynamics. Statistical models such as generalized Lotka–Volterra equations and stochastic neutral models simulate ecological interactions and random drift. Machine learning approaches like decision trees and random forests help predict microbial shifts in response to environmental changes, capturing nonlinear relationships and environmental thresholds [7,8]. DEICODE applies robust Aitchison PCA to address data compositionality and sparsity, improving beta-diversity analysis [9]. Topological data analysis methods, including Mapper and persistent homology, reveal high-dimensional data structures and microbial community trajectories across environmental gradients [10,11] (see Supplementary Table S1). Despite significant progress, understanding the regulation of microbial community variation presents unique challenges compared to the study of larger organisms [12]. A primary difficulty lies in capturing the long-term transitions of microorganisms, as they are rarely observable in short-term experiments or observations. Furthermore, existing phylogenetic methods primarily rely on the rate of genetic or molecular changes, which are effective for studying single species or homologous genes but inadequate for analyzing complex microbial communities composed of diverse taxa. While studies involving techniques like microbiome transition networks [13] have explored structural similarity and linkages across microbiomes, they lack the tools for systematically and quantitatively characterizing transitions between microbial communities.
Vellend’s framework also explicitly highlights the significance of transitional processes, particularly diversification, in shaping microbiome structure [14,15]. Over the past decade, the advent of sequencing and bioinformatics has revolutionized microbial research, providing new opportunities to study community structure and diversity [16,17]. Building these advancement, we propose a novel method to qualitatively and quantitatively assess the microbiome transitions by integrating diversification and phylogeny [17]. This approach is especially well-suited for uncultured microbial communities, which are defined by their high complexity and diversity, and thus provides a versatile framework for advancing the study of microbial community dynamics.
2. Methods
Hypothesis
Phylogenetic diversity (PD) quantifies microbial community transitions across two dimensions: i. cumulative evolutionary history, reflected by branch lengths, and ii. the structural distribution of species relationships, captured by topological organization [18]. According to molecular clock theory, genetic and protein changes occur at relatively constant rates over time [19]. Thus, branch lengths in a phylogeny tree represent the cumulative duration of genetic divergence, while the topological structure reveals the degree of aggregation or divergence in evolutionary relationships.
Existing theories suggest that speciation processes are strongly influenced by evolutionary history and that phylogenetic structure can effectively predict ecological transitions [20,21,22]. Transitions that involve the recruitment of more distantly related species tend to increase PD by broadening evolutionary and functional diversity. Consequently, microbial community transitions, including their directional tendencies, are shaped by these two key aspects of PD.
Low PD communities exhibit the following characteristics:
- a.
- Short branch lengths, indicating minimal cumulative genetic variation.
- b.
- A compact topological structure, suggesting high kinship overlap.
High PD communities exhibit the following characteristics:
- a.
- Long branch lengths, reflecting extensive cumulative genetic variation.
- b.
- A divergent topological structure, indicating low kinship overlap.
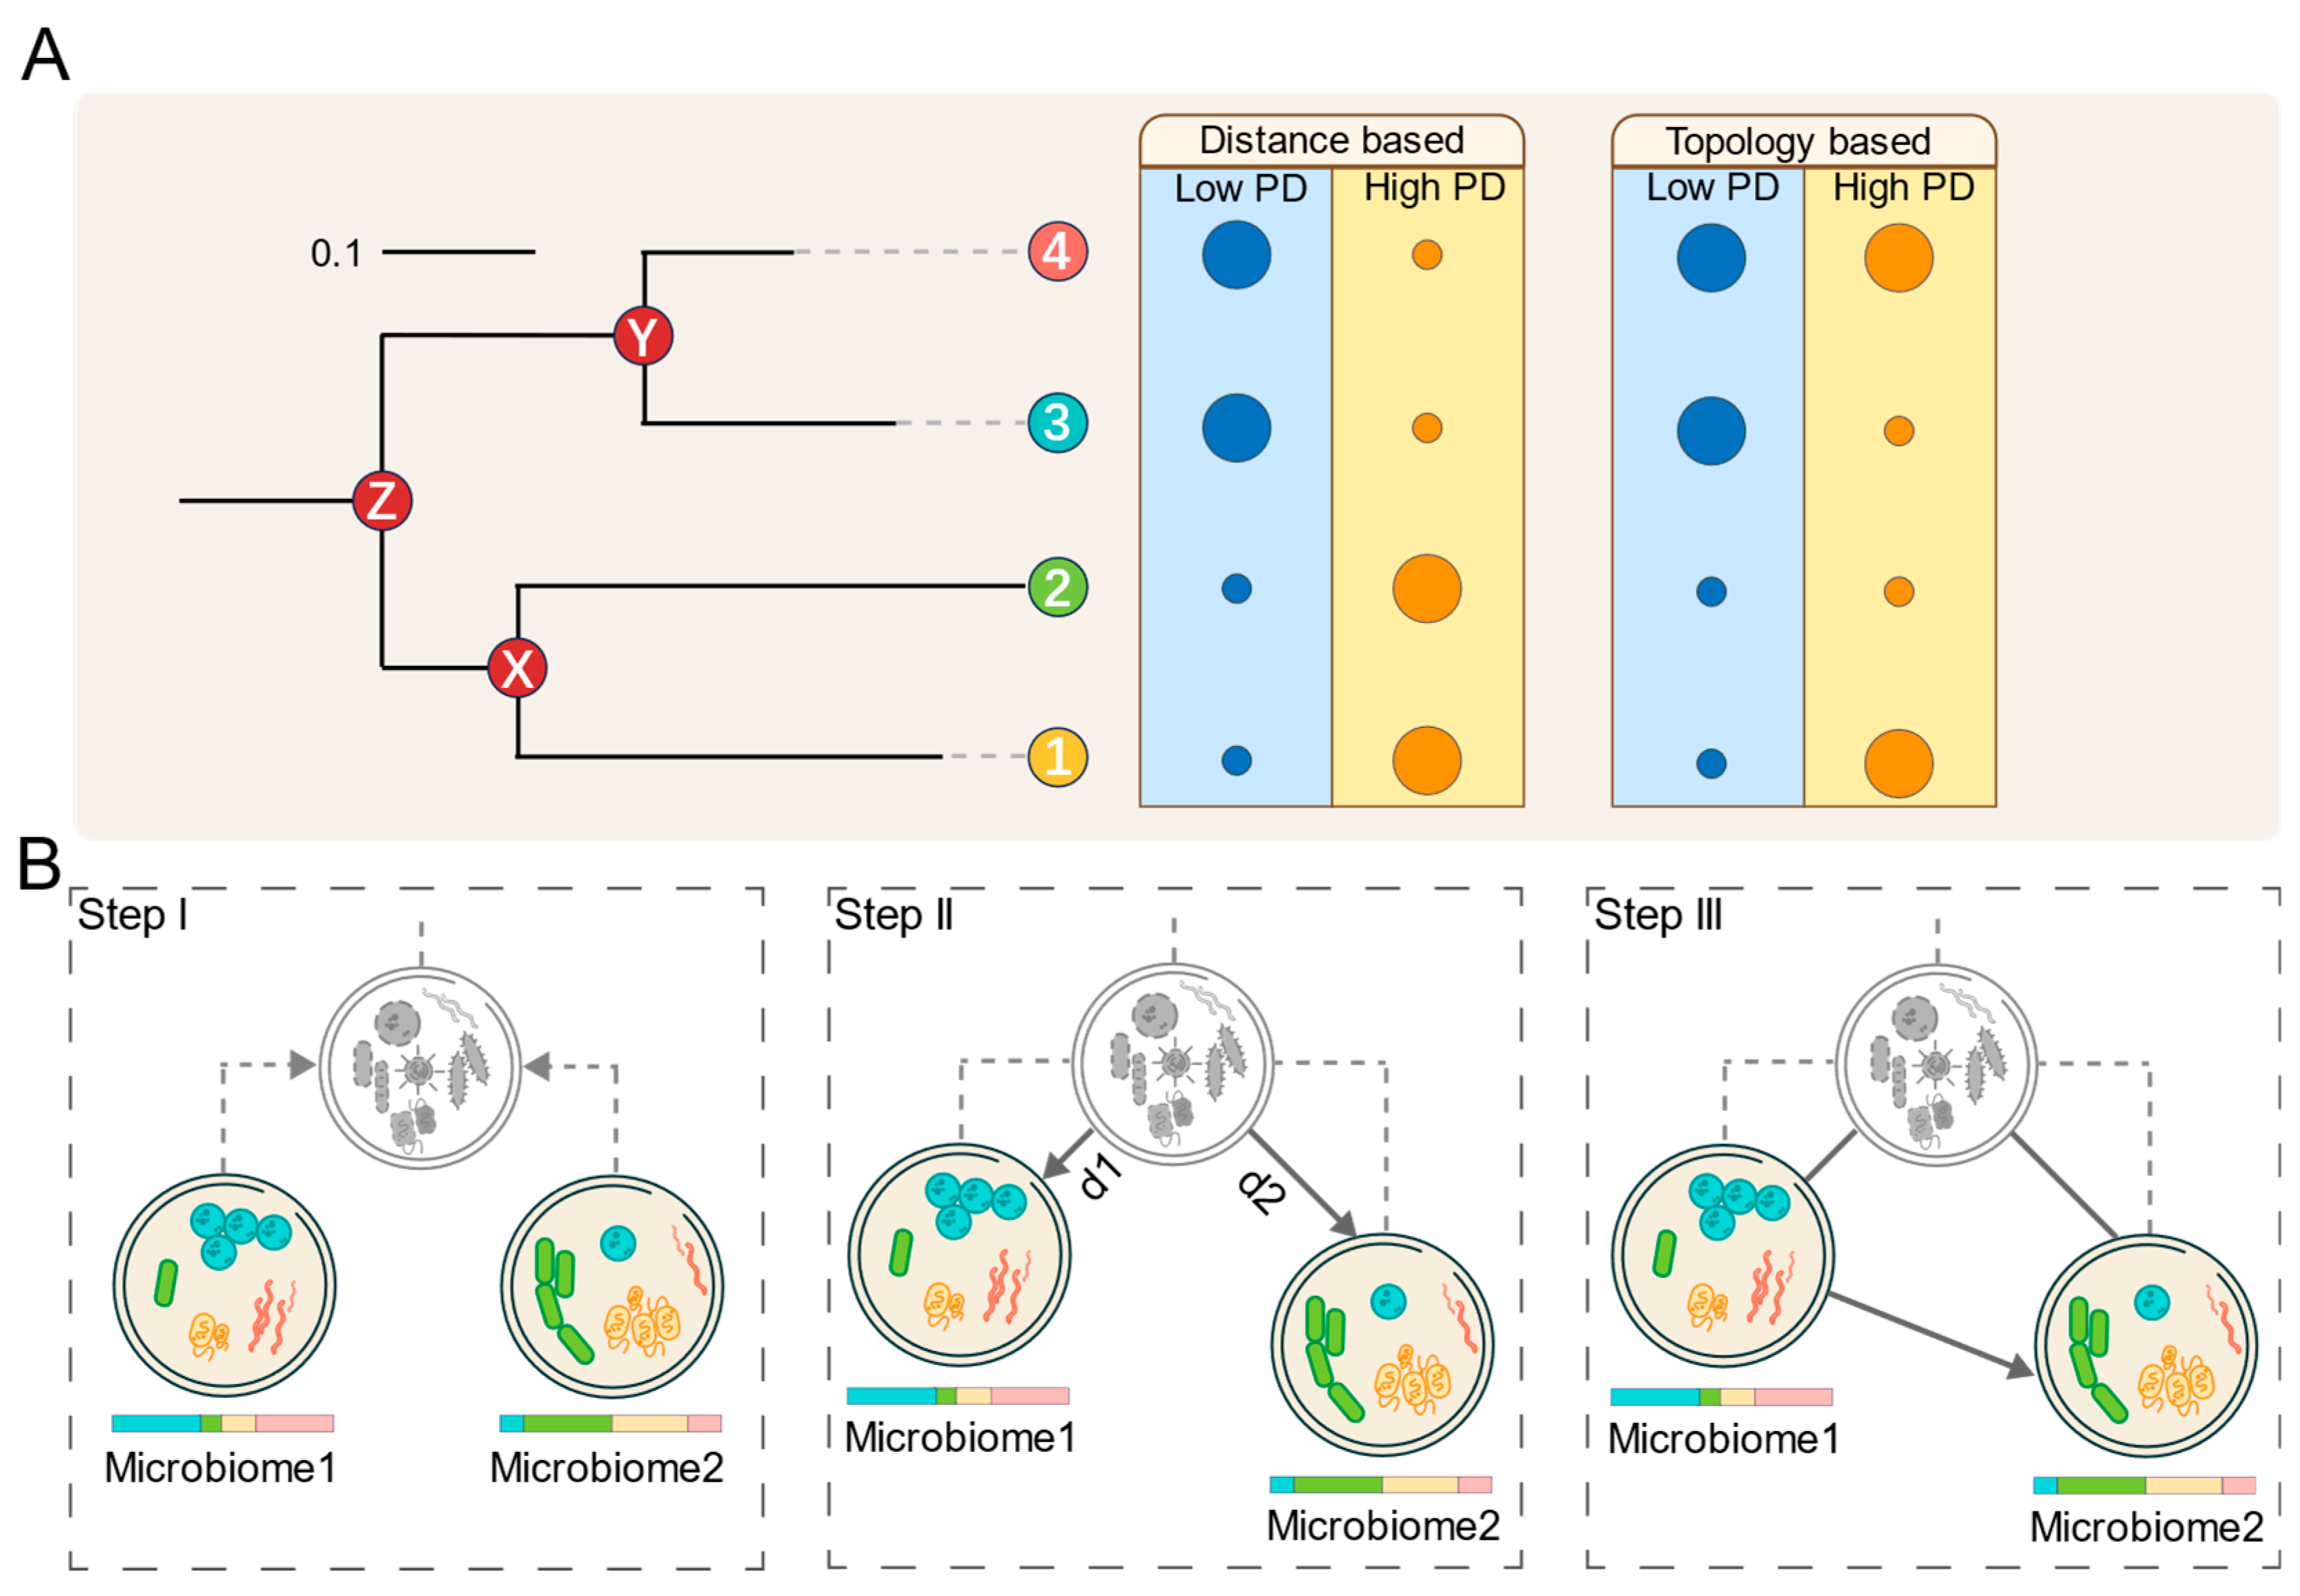
Based on these observations, we hypothesize that microbial communities with low PD tend to transition toward those with higher PD. As illustrated in Figure 1A, the two dimensions of phylogenetic diversity, namely branch length and topological structure, can be used to distinguish between high- and low-PD communities, depending on their composition.
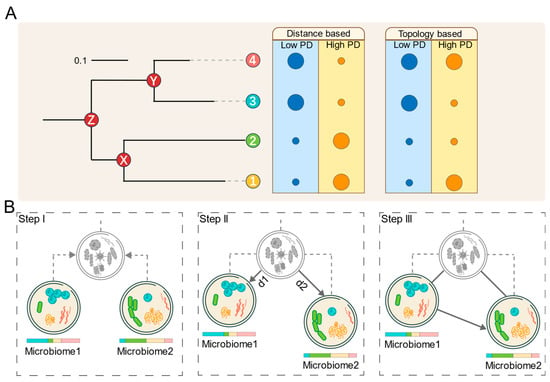
Figure 1.
Conceptual framework and workflow of MT-tracker. (A) Two key dimensions of phylogenetic diversity (PD): branch length and topological structure. Phylogenetic tree represents relationships among bacterial taxa. Circle sizes indicate species abundances. (B) Overview of MT-tracker algorithm: First, a virtual common ancestor microbiome is reconstructed from two given microbiomes. Next, the Meta-Storms distance between each microbiome and the common ancestor is computed. Finally, the transition direction and probability are determined based on the relative distances between the microbiomes and their ancestor.
Building on this hypothesis, we propose MT-tracker, a novel approach that integrates microbial distributions with phylogeny trees to reconstruct a virtual common ancestor for two microbiomes. As shown in Figure 1B, by computing phylogeny-based beta-diversity distances [23] from this ancestor to each microbiome, we quantify the PD differences between communities, enabling the assessment of microbial transitions through two complementary approaches:
i. Qualitative assessment: The transition direction sees movement from the microbiome with a shorter distance to the one with a longer distance.
ii. Quantitative evaluation: The transition probability is determined by the magnitude of the difference between the two distances.
3. Algorithm
3.1. Microbiome Virtual Ancestor
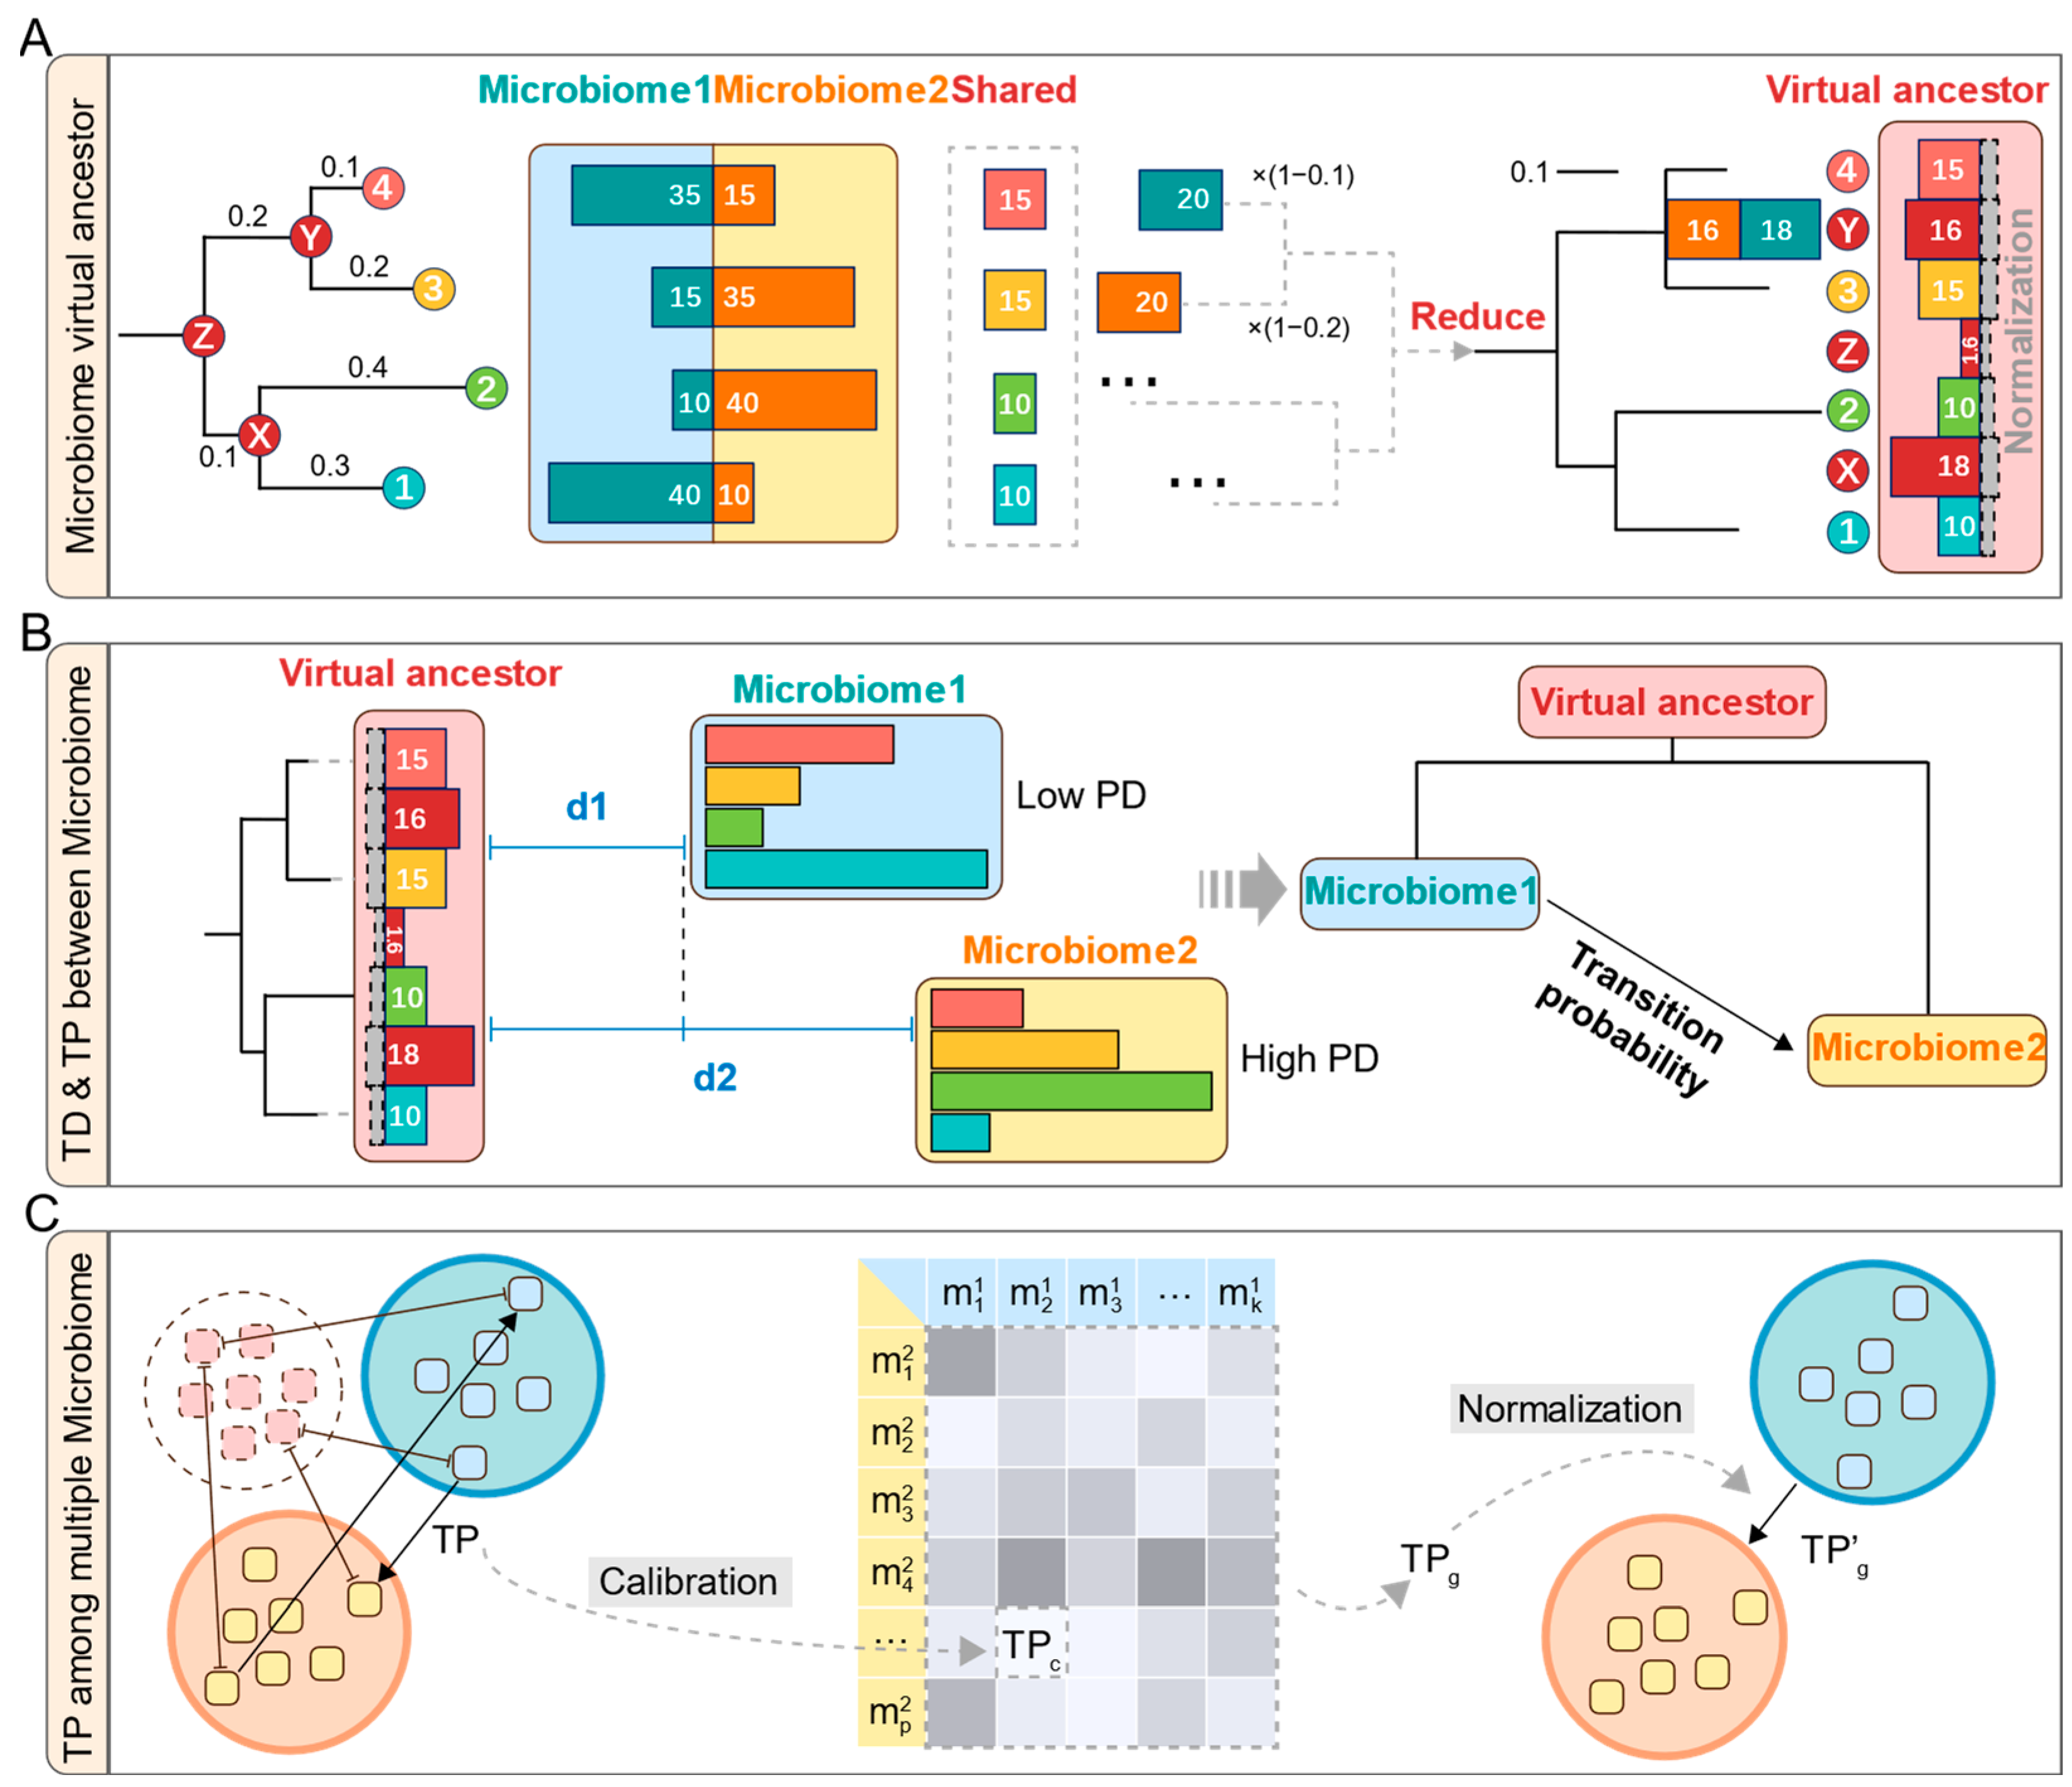
For two microbiomes, MT-tracker reconstructs their virtual common ancestor by mapping their community members onto a shared phylogeny tree. The virtual ancestor microbiome comprises two components: shared microbes (i.e., tip nodes in the phylogeny tree) and virtual microbes (i.e., internal nodes). Initially, the ancestor microbiome is empty. For each shared microbe (e.g., microbe 4 in Figure 2A), the common component is extracted by taking the minimum relative abundance (i.e., the proportion of each microbe’s abundance relative to the total abundance within a microbiome) between the two microbiomes. This value is added to the ancestor microbiome. The remaining abundance of this microbe is then reduced to its ancestor internal node (e.g., node Y in Figure 2A), weighted by 1-distp (the evolutional distance to the ancestor internal node in the phylogeny tree). Using a post-order traversal of the phylogeny tree, all nodes are processed recursively to construct the virtual ancestor microbiome. This approach ensures that the richness of each community member is accurately parsed and normalized, resulting in a comprehensive representation of the ancestor microbiome. Biologically, the virtual common ancestor microbiome represents an inferred community that approximates the minimal common origin of two communities. By calculating the phylogenetic distances of both microbiomes to this reconstructed ancestor, we can infer the likely direction of transition between the two communities.
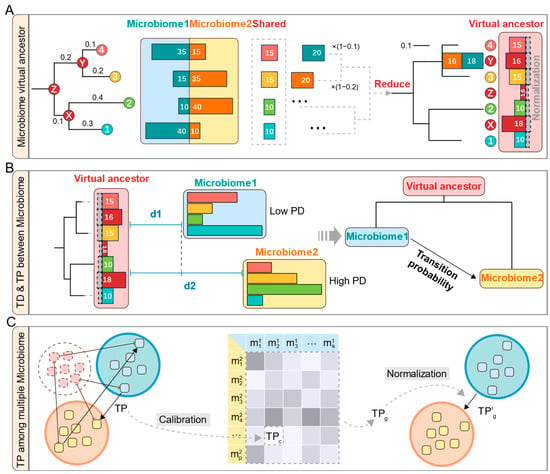
Figure 2.
A diagram of the MT-tracker algorithm. (A) The specific process of the algorithm, the red dots are ancestor internal nodes, and the bar chart represents the microbial abundance. (B) Transition direction and probability between two microbiomes. (C) Calibration and normalization of transition probabilities among multiple microbiomes.
The detailed steps of this reconstruction are presented in Algorithm 1. It begins with two microbiome abundance profiles (ABD1, ABD2) and a phylogeny tree with evolutionary distances (distp). The VA[node] and residual abundances (REM1[node], REM2[node]) are initialized to zero. Through post-order traversal, tip nodes are assigned minimum shared abundances. Remaining abundances propagate recursively upward, where ancestor internal node abundances (ANC1, ANC2) are computed by weighting each child node’s remaining abundance with 1 − distp. Each internal node’s shared abundance (minimum of ANC1, ANC2) is added to VA, and the remaining values continue propagating until the root node is reached.
| Algorithm 1. Reconstructing the microbiome virtual ancestor | ||
| Input: Output: | Relative abundance of 2 microbiomes: ABD 1 and ABD 2 Phylogeny tree with evolutionary distances: distp (child_node, ancestor_internal_node) Relative abundance of the virtual ancestor VA | |
| 1 2 3 4 5 6 7 8 9 10 11 12 13 14 15 16 17 18 19 20 21 22 23 | VA [node] ← 0 REM 1 [node], REM 2 [node] ← 0 #Initialization of the remaining abundance all nodes Function PostOrderTraversal (node): if node is tip node then Shared ← min (ABD 1 [node], ABD 2 [node]) VA [node] ← Shared REM 1 [node] ← ABD 1 [node]—Shared REM 2 [node] ← ABD 2 [node]—Shared end if if node is ancestor internal node then ANC 1, ANC 2 ← 0 #Initialize the abundance assigned to the ancestor internal node for child_node in node.children do PostOrderTraversal (child_node) ANC 1 ←ANC 1 + REM 1 [child_node] · (1—distp (child_node, node)) ANC 2 ←ANC 2 + REM 2 [child_node] · (1—distp (child_node, node)) end for Shared ← min (ANC 1, ANC 2) VA [node] ← Shared REM 1 [node] ←ANC 1—Shared REM 2 [node] ←ANC 1—Shared end if return VA | |
3.2. Transition Direction and Probability Between Two Microbiomes
For microbiomes m1 and m2, we compute the weighted Meta-Storms [23] distances to their virtual ancestor mv.a.(m1, m2), respectively, denoted as d1 = distMeta-Storms(mv.a., m1) and d2 = distMeta-Storms (mv.a., m2), with both ranging from 0 to 1. Thus, the transition direction (TD) can be determined by comparing the distances, as shown in Equation (1).
The probability of this transition (TP) can be inferred by the absolute difference in the two distances, as shown in Equation (2) (Figure 2B).
When constructing virtual ancestors, MT-tracker integrates two key factors of PD, branch length and topological structure, and characterizes the PD level through the beta-diversity distance between the virtual ancestor and the microbiomes.
i. Branch length dimension: Each node’s branch length is defined as the total path distance from that tip node to the root node. When the sum of the phylogenetic branch lengths of species in the microbiome is small (indicating low PD), the virtual ancestor is closer to the original microbiome in terms of evolutionary distance, resulting in a shorter beta-diversity distance between them.
ii. Topological structure dimension: The species composition of the virtual ancestor is very similar to that of the microbiome with a compact topological structure (indicating low PD). As a result, the beta-diversity distance to such microbiomes is shorter, reflecting a lower PD level (Supplementary Figure S1).
3.3. Calibration of Transition Probability Among Multiple Microbiomes
Despite the Meta-Storms algorithm comprehensively measuring the microbiome distances, it can also introduce bias into the transition probability when studying multiple microbiomes. For example, when using distances of (0.1, 0.099) versus (0.002, 0.001), although the absolute differences are the same (both are 0.001), their biological implications differ significantly since the latter one shares more components and produces shorter distances to their virtual ancestor. Hence, here we also developed a calibration for transition probability in MT-tracker as Equation (3) to avoid the bias among multiple microbiomes.
Building on this, we define the group-wise transition probability, which summarizes the calibrated transition probabilities across all microbiome pairs between two groups. Assume group 1 contains k microbiomes , and group 2 contains p microbiomes (Figure 2C). The group-wise transition probability TPg is calculated as the mean of all calibrated transition probabilities between microbiome pairs, given by Equation (4).
To make TPg more intuitive and interpretable, it is first normalized to the range (0, 1), and then a logarithmic transformation is applied to further adjust the value. A higher value indicates a greater probability of transition between groups. The final normalized and transformed transition probability TP′g as Equation (5).
4. Results
4.1. Evaluating Computational Efficiency of MT-Tracker and Phylogeny Tree-Based Approach
Currently, the analysis of microbial community transitions is hindered by the lack of efficient computational tools. Previous studies have employed phylogeny tree-based approaches, using pairwise distance matrices to infer the transitional direction [24], but these methods face significant computational bottlenecks. As the sample size grows, calculating phylogenetic distances for all sample combinations results in an exponential increase in computational complexity. To systematically assess the computational efficiency of MT-tracker compared to conventional phylogeny tree-based approaches constructed using the Neighbor-Joining available in Phylip software (version 3.698) [25] (refer to Section 6 for details), we conducted benchmark tests using randomly selected sample sets of varying sizes from the MSE database [26] (Table 1 and Table 2).

Table 1.
Overview of datasets used in this study.

Table 2.
Habitat distribution of samples in MSE database.
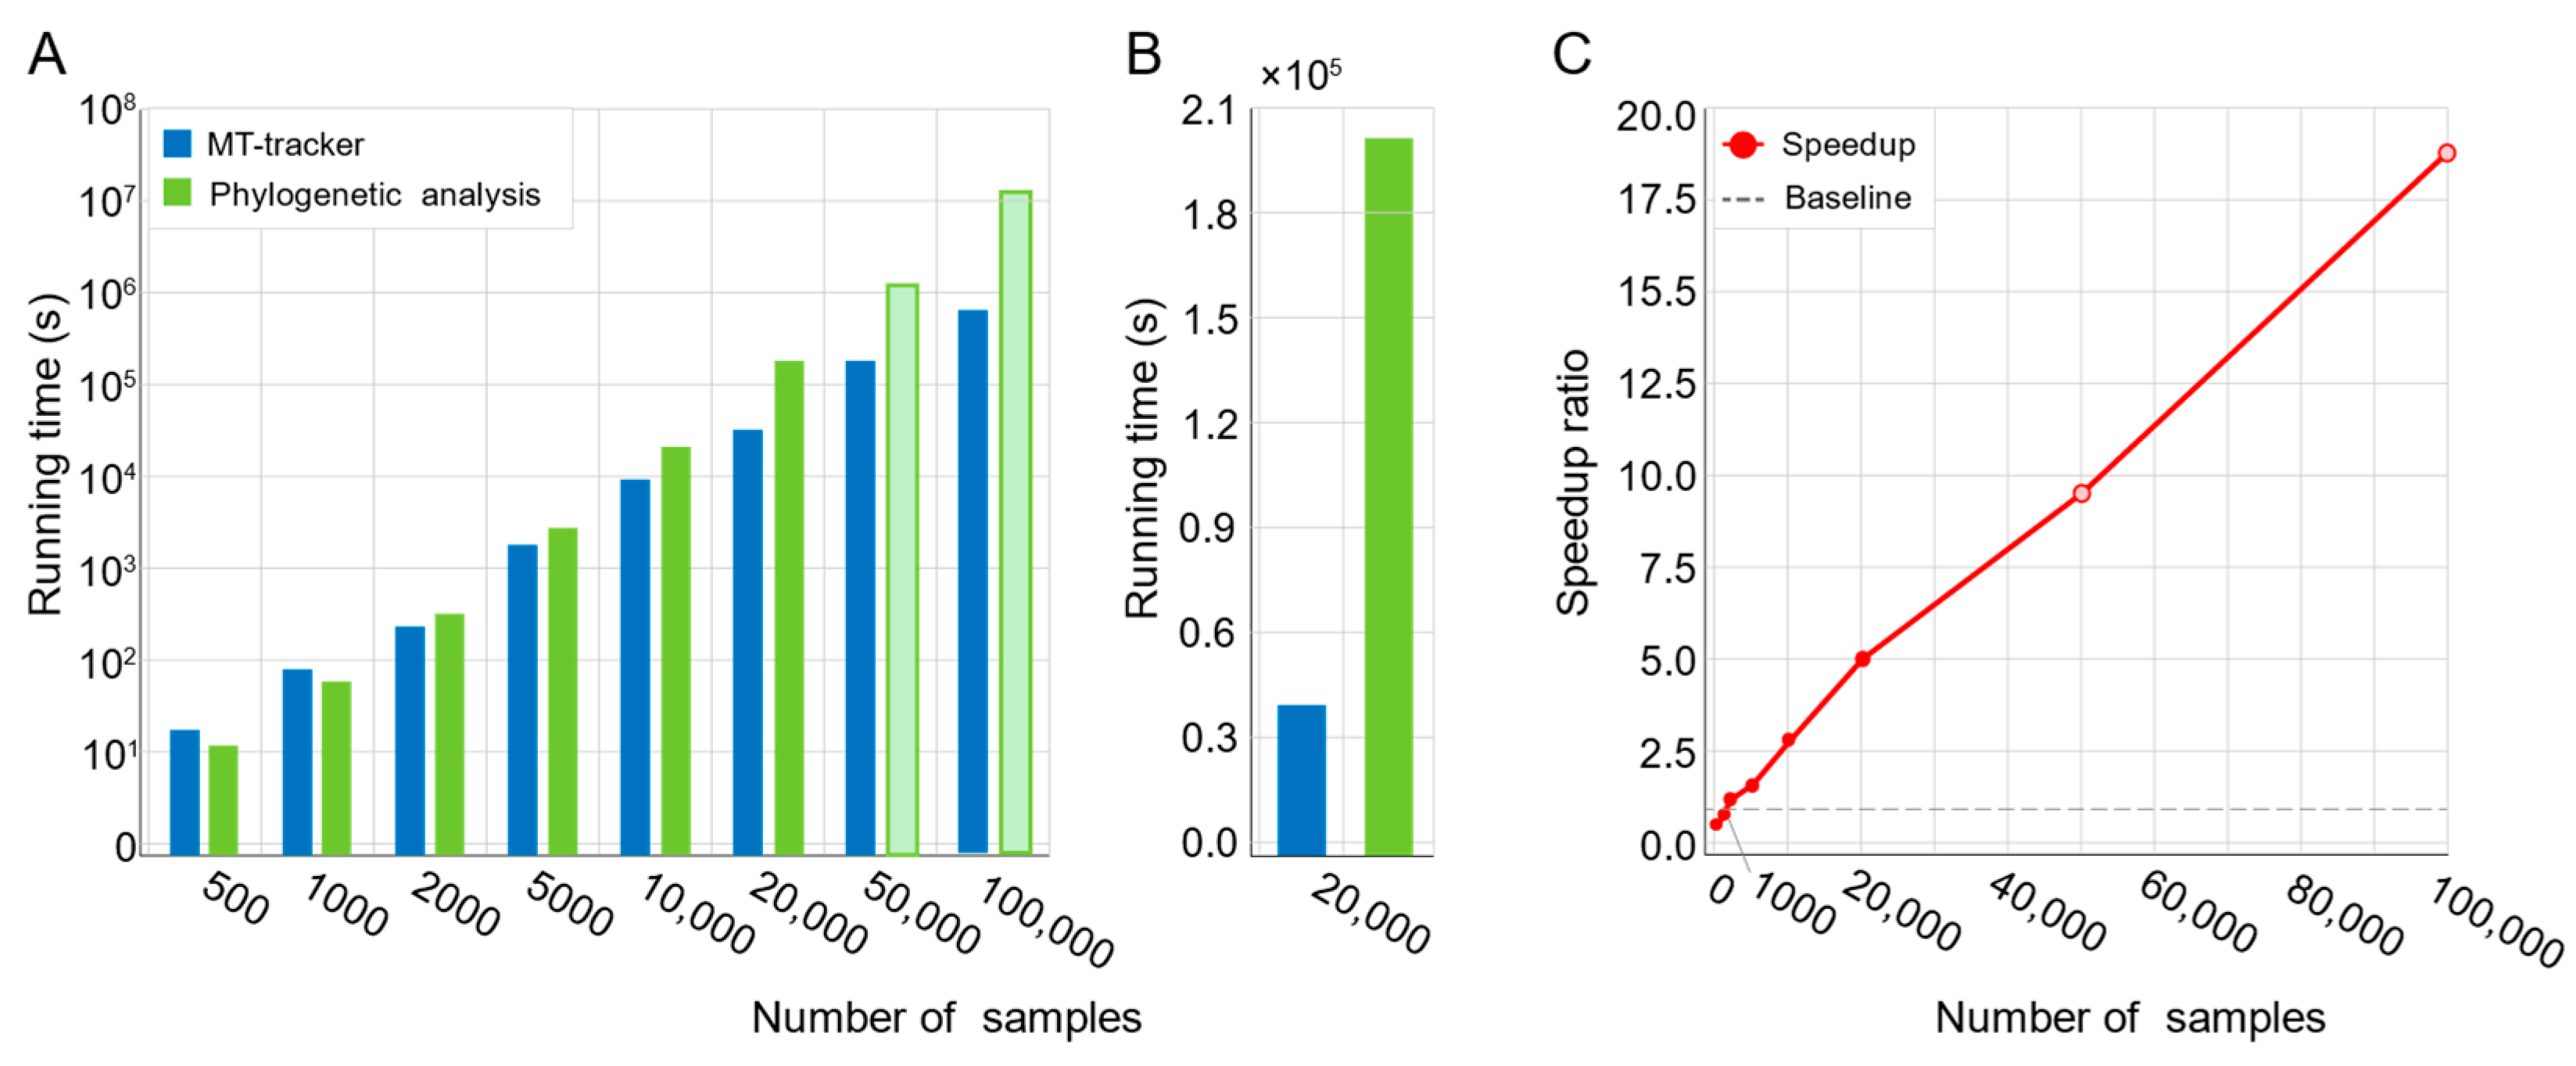
While conventional methods performed efficiently for small datasets (e.g., fewer than 2000 samples), their processing time increased dramatically with larger datasets (Figure 3A; Supplementary Table S2). For instance, processing 20,000 microbiomes required 57 h (Figure 3B), and extrapolations estimated that analyzing 100,000 samples would take up to 178 days. In contrast, MT-tracker processed 20,000 samples in just 11 h (Figure 3B), achieving a fivefold speed improvement. As the dataset size increased to 100,000 samples, MT-tracker demonstrated a 17.5-fold acceleration, substantially enhancing computational efficiency and enabling large-scale microbiome data analysis (Figure 3C).
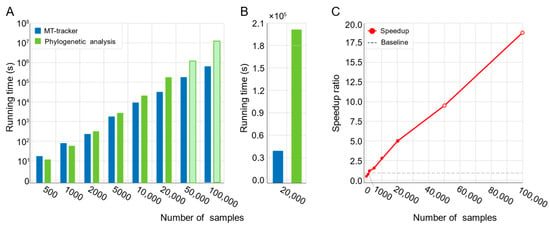
Figure 3.
Computational efficiency comparison between MT-tracker and phylogeny tree-based method. (A) Running time of both methods across sample sets of varying sizes. Hollow bars indicate estimated values due to excessively long computation times. (B) Direct comparison of running time for dataset containing 20,000 samples. (C) Speedup ratio of MT-tracker relative to phylogeny tree-based method across different sample sizes. Hollow dots represent estimated values due to extended computation times.
4.2. Validation of MT-Tracker by a Phylosymbiosis Analysis of Animal-Associated Habitat Microbiomes
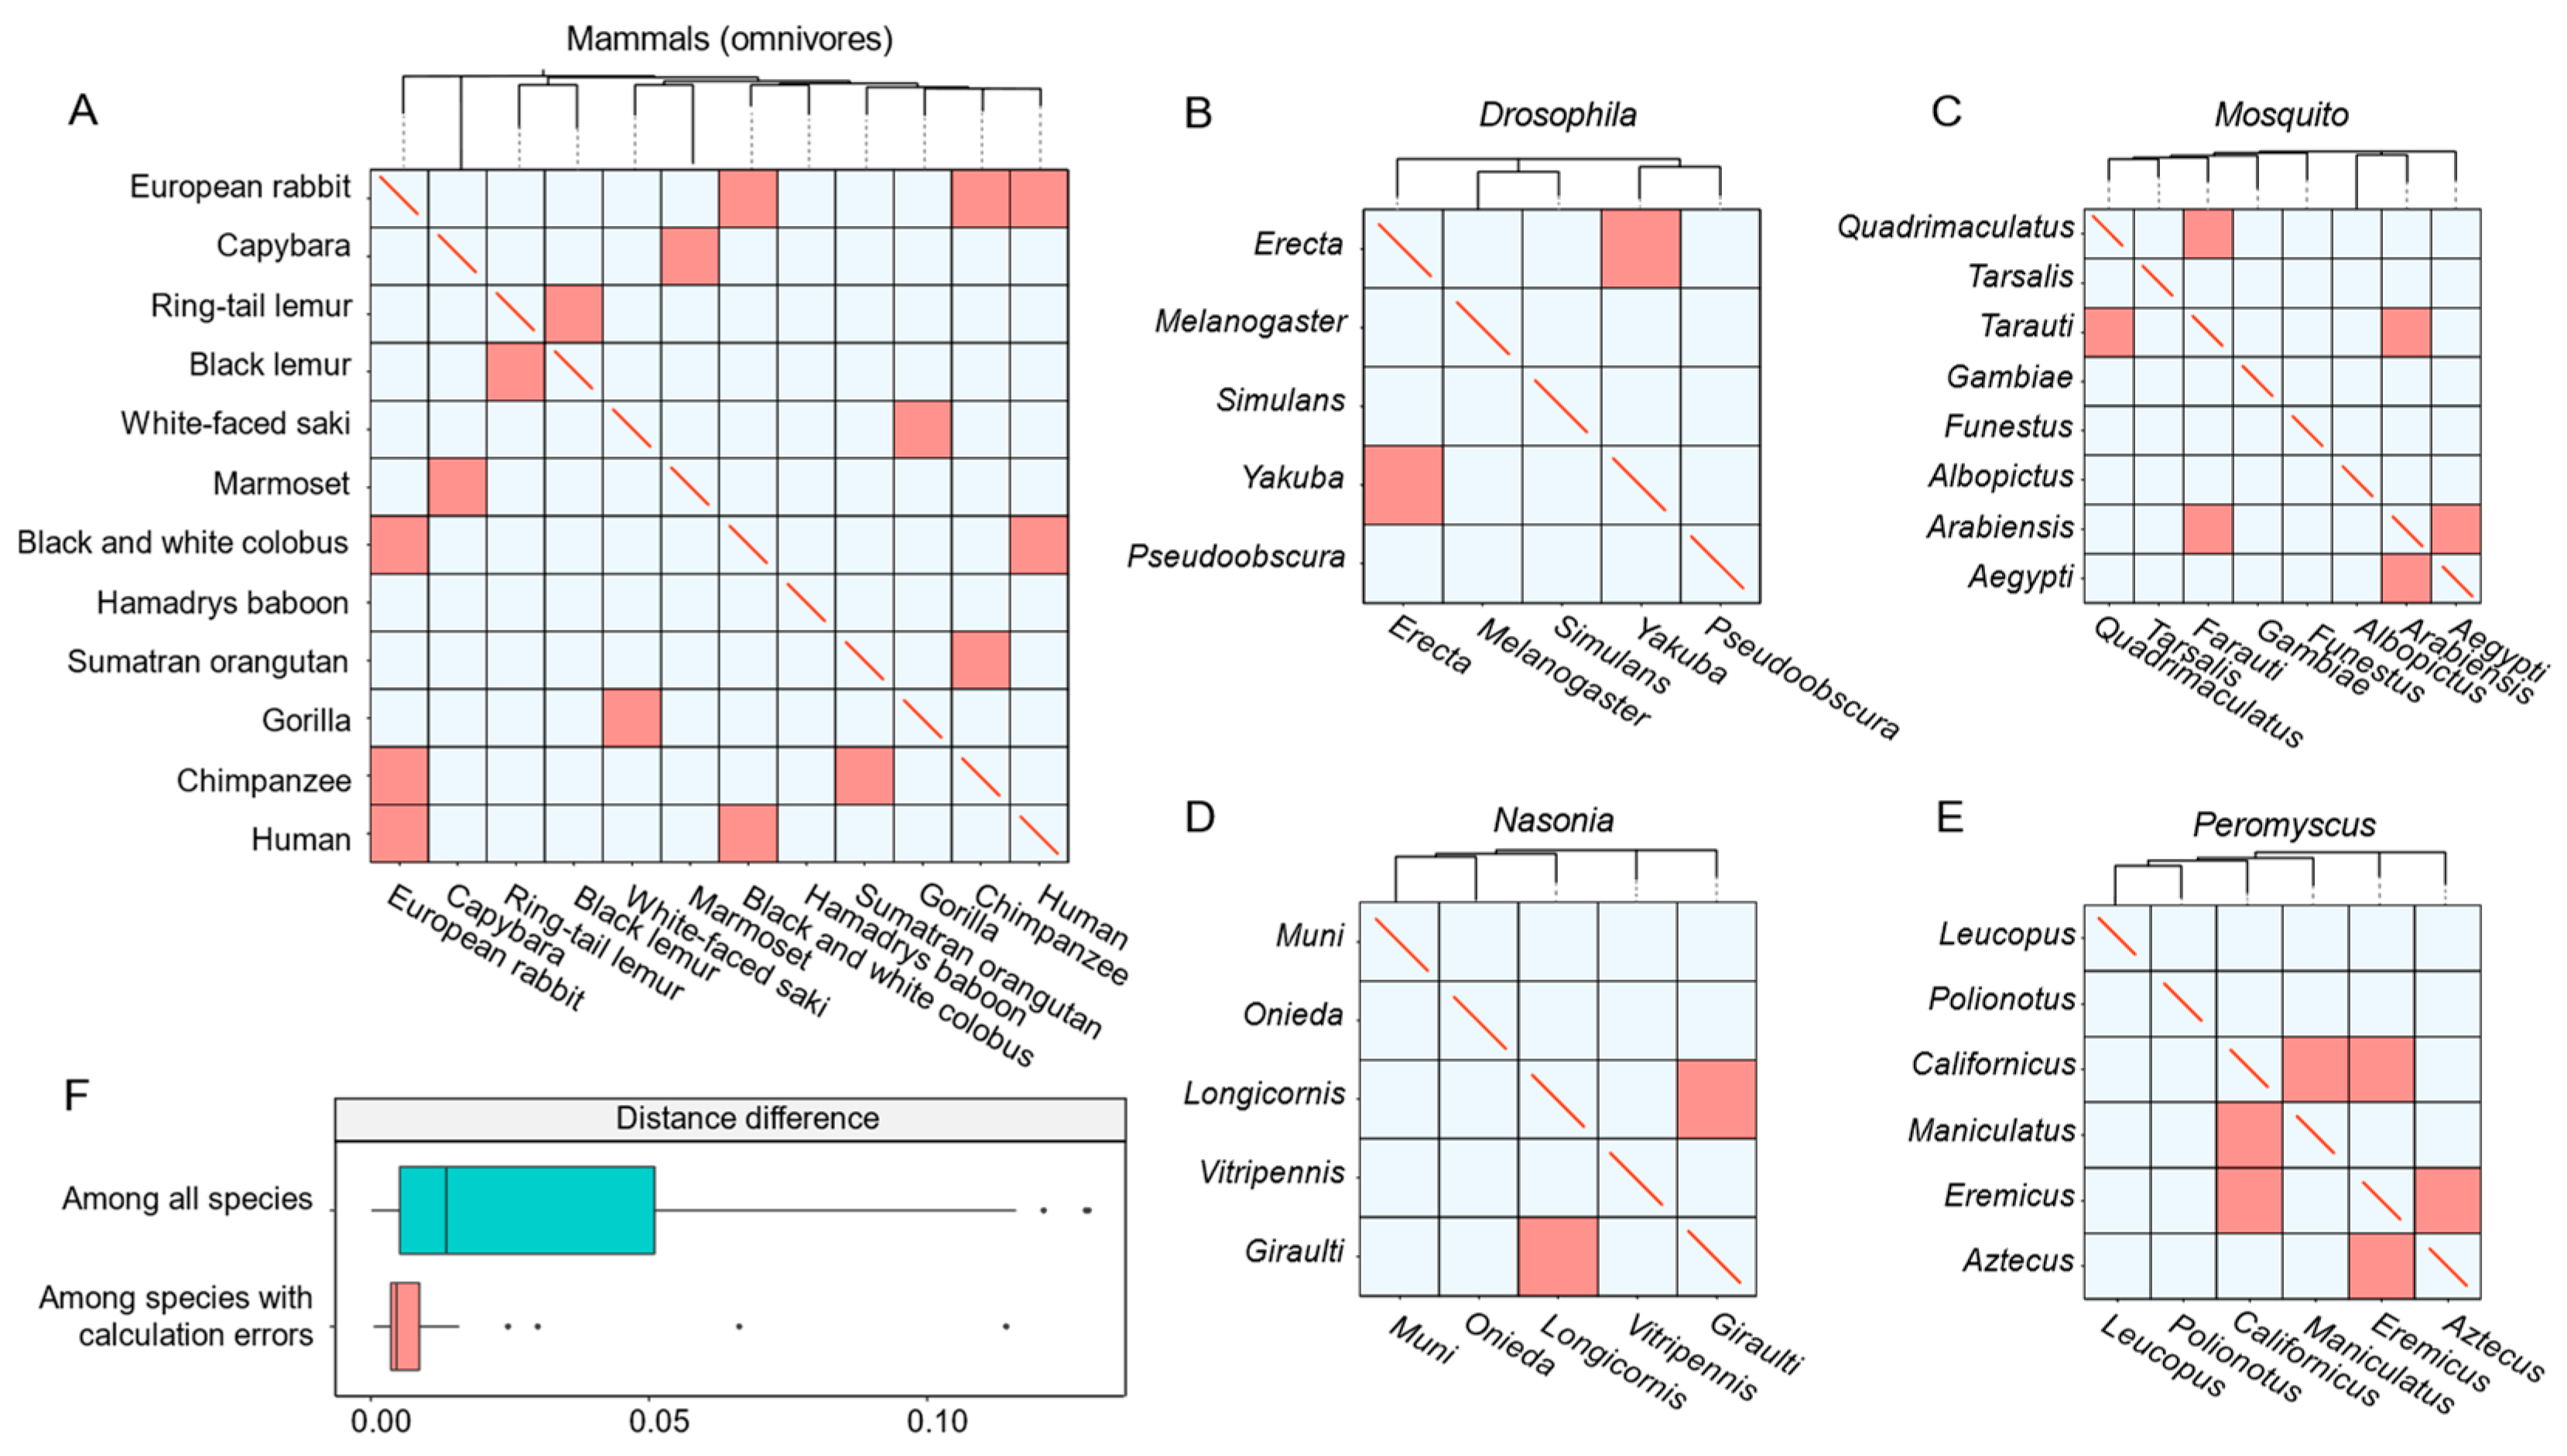
To validate the MT-tracker, we performed phylosymbiosis analysis using two datasets of animal intestinal microbiomes. The first dataset, MAG, comprises 280 microbiomes sampled from 28 mammalian species, while the second dataset, SAG, includes 319 microbiomes sampled from 24 nonmammalian species (Table 1). Studies have shown that the diversity of animal-associated microbiomes correlates strongly with the evolutionary relationships of their hosts [29]. Using the MAG dataset, we grouped the mammals based on their diets, and constructed a phylogeny tree using the Neighbor-Joining method [30] based on Meta-Storms distances. The transitional directions were then derived by identifying ancestral nodes in the tree and applying our hypothesized framework (see Section 6). The MT-tracker demonstrated an average consistency of 87.1% between the inferred transitional directions and the phylogeny tree-based relationships of the groups (Figure 4A).
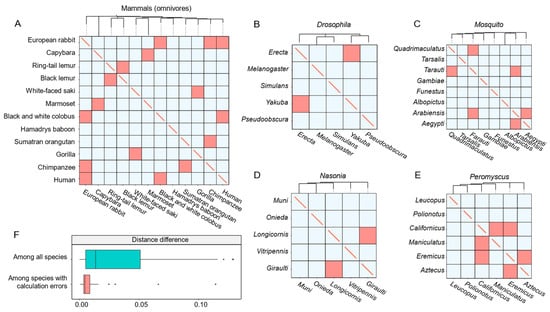
Figure 4.
The validation of the MT-tracker using two datasets. (A) The transitional direction of the phylogeny tree constructed from the gut microbiome of omnivorous mammals compared with the direction calculated by the algorithm. Blue indicates that the algorithm correctly calculated the transitional direction, and red indicates that the algorithm incorrectly calculated the transitional direction. (B–E) The transitional direction of the gut microbiome of 24 small animals compared with the direction calculated by the algorithm. (F) The box plot shows the phylogenetic distance difference among all species and the distance difference among incorrectly calculated species.
For further validation, we applied the MT-tracker to the SAG dataset, which included intestinal microbiomes from 24 small animals, encompassing 5 species of the genus Nasonia, 6 species of the genus Peromyscus, 5 species of the genus Drosophila, and 8 species from the family Mosquito. The MT-tracker achieved a high average accuracy of 87.3% in reflecting the phylogenetic relationships across these groups (Figure 4B–E).
We also observed some inconsistencies between the transitional directions obtained via phylogeny and those inferred by the MT-tracker. These discrepancies primarily occurred among host species with extremely close evolutionary relationships. For example, the phylogenetic distance between the black lemur and the ring-tailed lemur was only 0.002, and that between Drosophila erecta and Drosophila yakuba was 0.007, with both being significantly smaller than the average phylogenetic distance among all species (Figure 4F). In conclusion, these results highlight the wide applicability of the MT-tracker and its robust accuracy in capturing the transitional patterns of intestinal microbiomes, even across diverse host species.
4.3. A Transitional Perspective on the Global Microbiome Network
Understanding the dynamics of microbial diversity provides critical insights into the ecological processes that shape community structure and function. Ecosystem community structure and species diversity are driven by various ecological processes, often considered the combined effects of selection, dispersal, drift, and diversification. Previous studies used the Microbiome Search Engine (MSE) [26] to construct a scale-free microbiome network, effectively characterizing microbial diversity and distribution across global habitats. This revealed intrinsic homologies among microbiomes worldwide [13]. However, these studies could not infer the directionality of microbial transitions within the network, posing a significant challenge for investigating microbial origins and transmission across ecosystems. Conventional phylogeny tree-based methods, such as Neighbor-Joining or Maximum Likelihood, are limited when handling the vast number of microbiomes sampled globally (Figure 3A). They also fail to incorporate diversification processes into network analyses, necessitating new methodologies for a more comprehensive understanding.
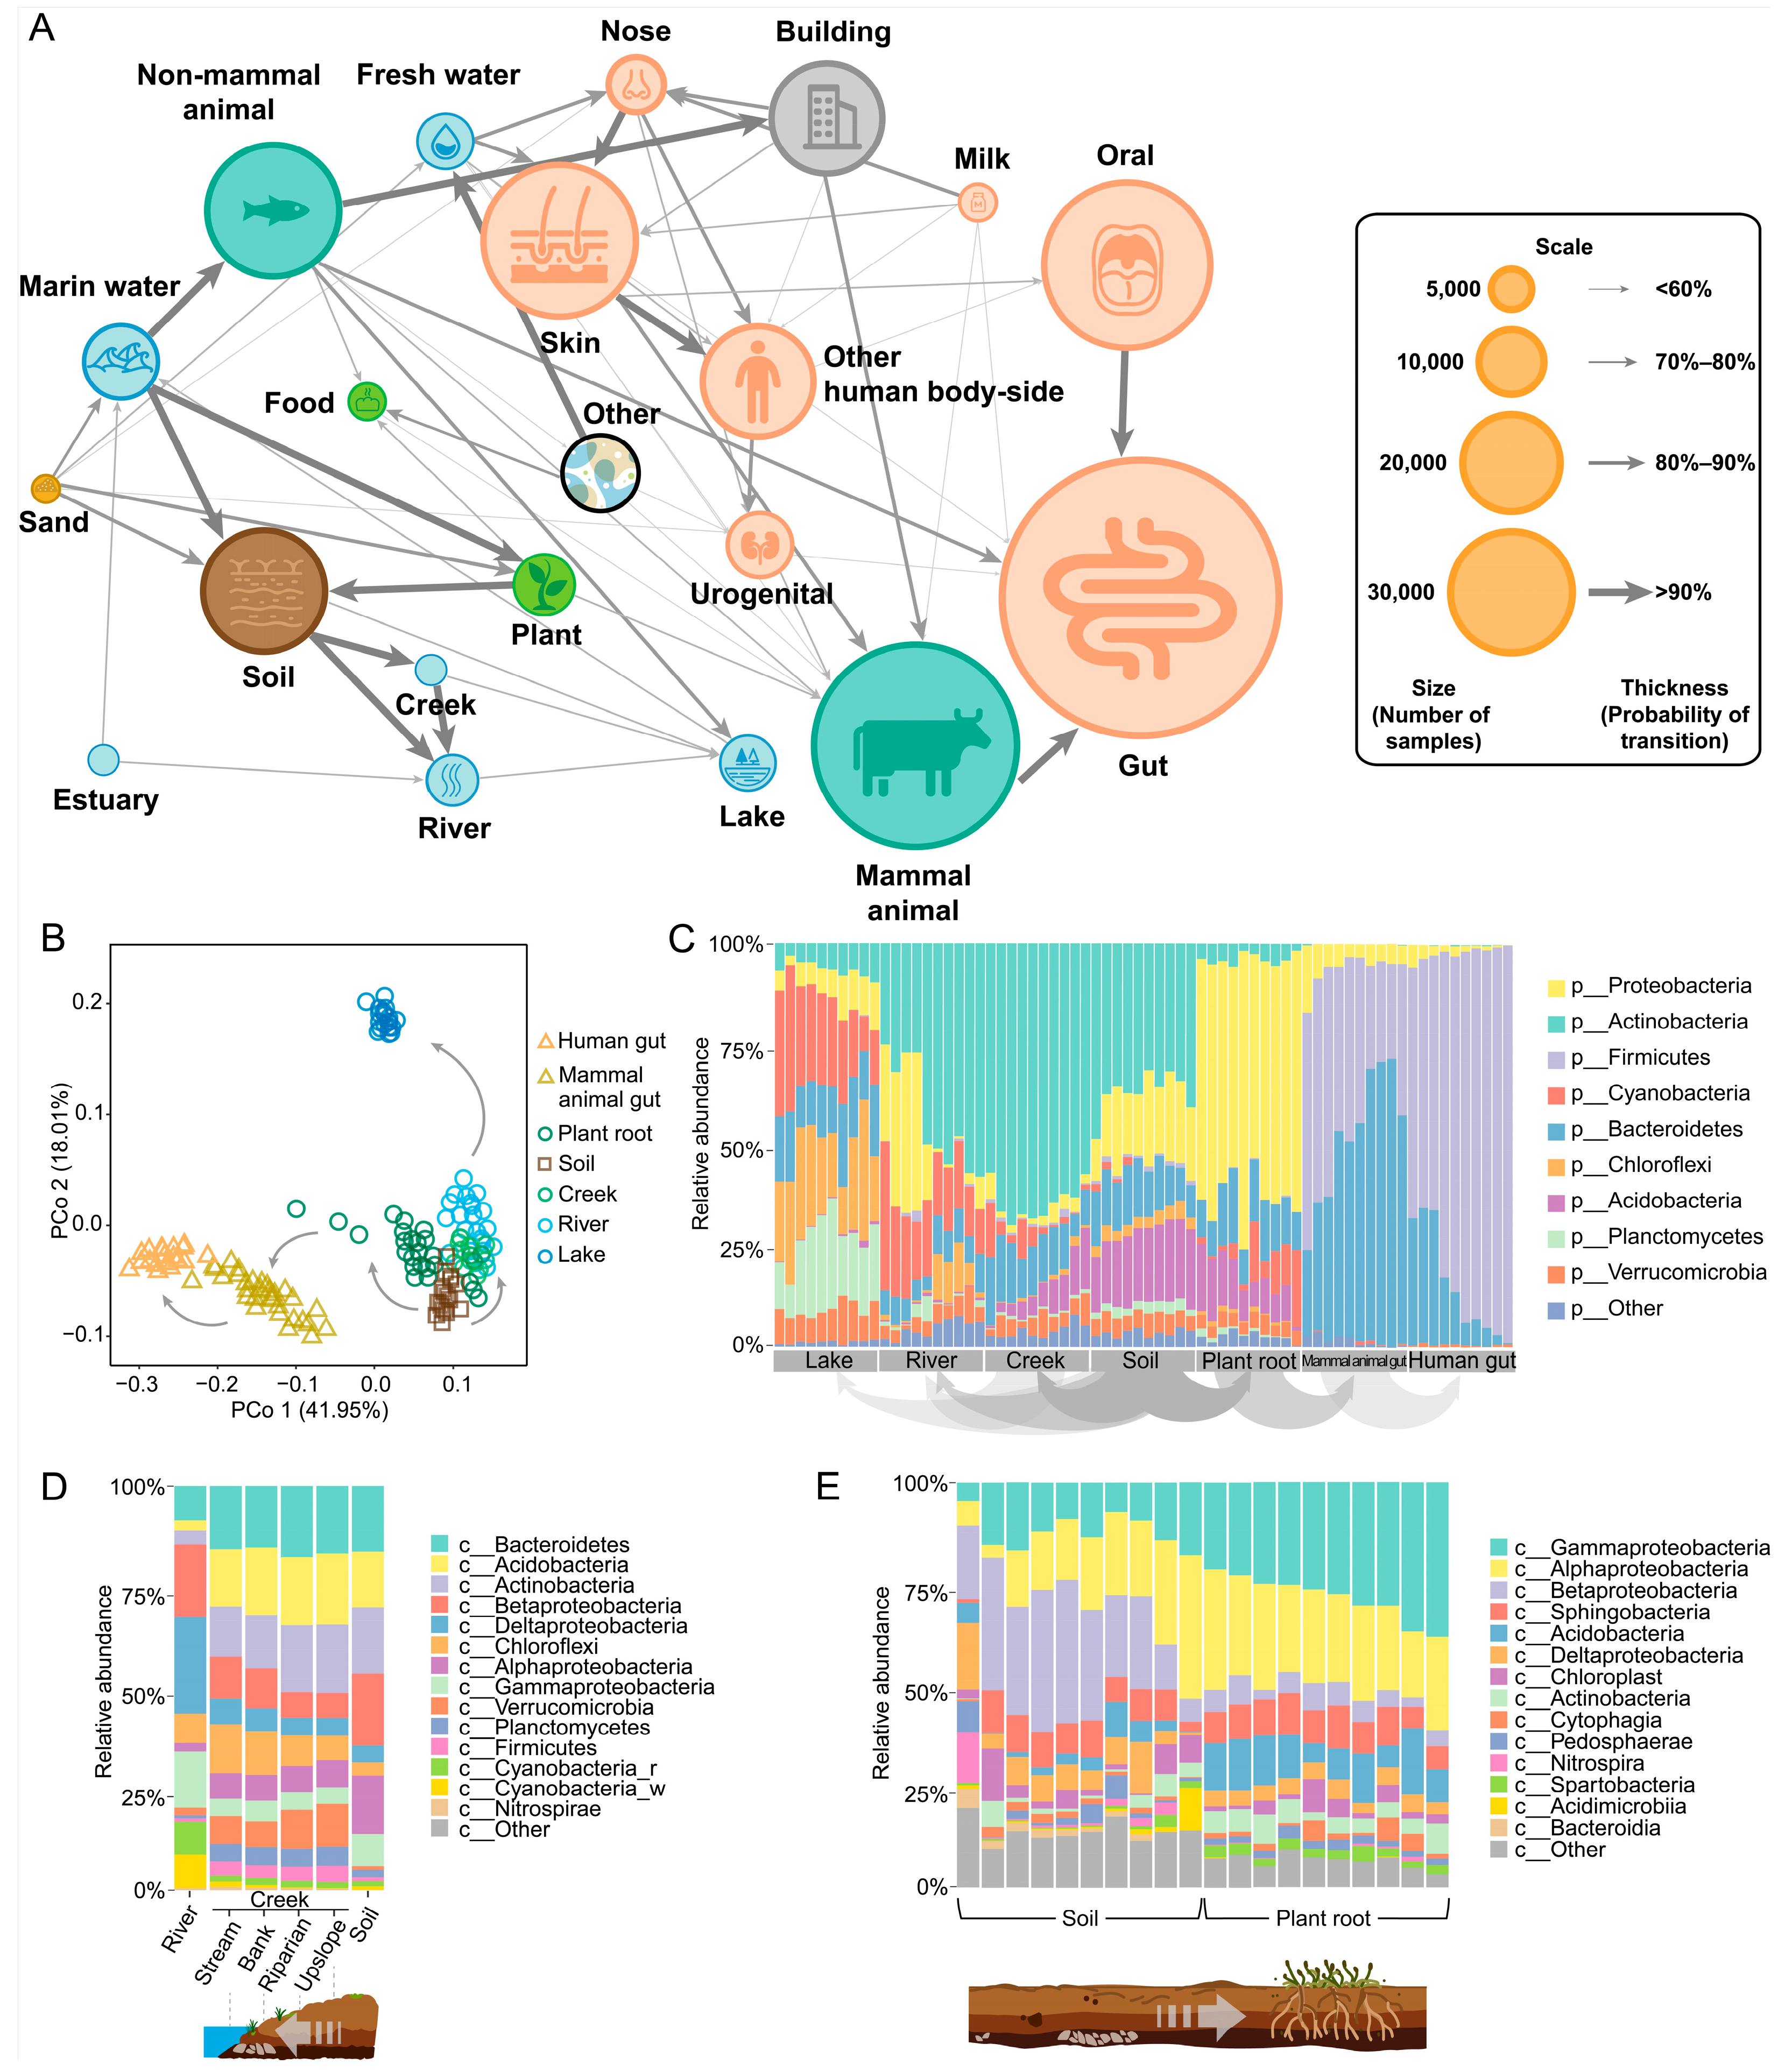
To address these challenges, we integrated MT-tracker into the topological framework of the scale-free microbiome network (see Section 6). By performing large-scale computations on 456,702 samples from the updated MSE database (Table 2), we quantitatively assessed the transitional direction and probabilities of microbial communities across diverse global habitats (Figure 5A). This approach provides a quantitative foundation for studying the mechanisms driving microbial transitions. Remarkably, the inferred transitional directions align with findings from independent studies. For example, previous works based on phylogenetic reconstruction suggested that Planctomycetes in soil evolved toward aquatic environments [31]. Similarly, studies on the origins of Cyanobacteria, Actinobacteria, and Firmicutes traced their earliest branching to terrestrial habitats [32]. Other work demonstrated that soil serves as a transitional source for gut microbiomes, as soil-derived bacteria, such as Firmicutes, colonize the intestines of nonmammals like C. elegans worms and bean worms [33,34]. In mammals, most gut-related Elusimicrobia trace back to soil-dwelling ancestors [35]. Soil, in contact with plant roots, facilitates microbial entry into animal intestines via plant intermediaries [36].
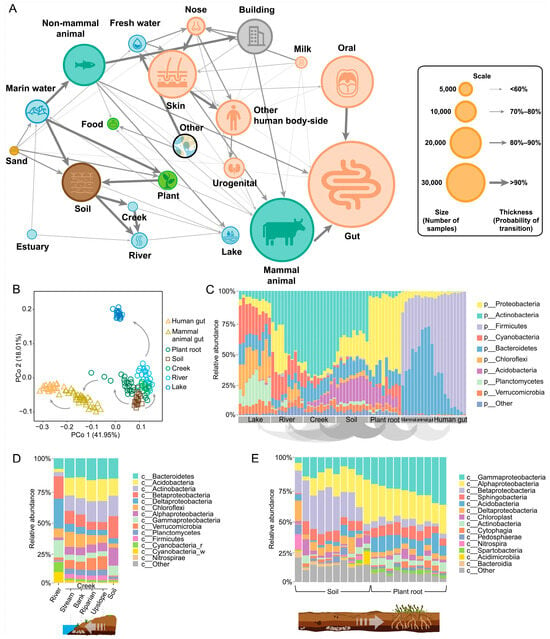
Figure 5.
The transitional direction of global microbiomes across ecosystems. (A) Nodes represent microbial communities in different habitats. The size of each node represents the number of samples from the corresponding habitat, while the thickness of the directional arrows indicates the probability of transition between habitats. (B) The principal coordinate analysis (PCoA) diagram was constructed using 140 microbial groups from seven habitats. The arrows indicate the direction of transition. (C) The transition of microbial groups from lakes to human intestinal habitats at the phylum level. (D) The transition of microbial groups between rivers, streams, and soil habitats at the class level. The stream habitat includes four locations: stream, bank, riparian, and upslope. (E) The transition of soil microorganisms and plant root microorganisms at the class level.
Our results indicate that soil is a major source of microbes in river and lake water bodies and animal intestines. Treating soil as a central node, we examined its transitional relationships with neighboring habitats, including river and lake environments and animal microbiomes. We validated the network topology through a principal coordinate analysis (PCoA) of 140 randomly selected samples, confirming the isomorphic pattern visible among nodes (Figure 5B). Additionally, MT-tracker detailed the compositional changes in microbial communities at the phylum level, elucidating the transition processes (Figure 5C).
We further explored the transition route within the plant–soil–river–lake system, which plays a critical role in understanding microbial community dynamics. Along the soil–river–lake continuum, precipitation and water flow drive the migration of terrestrial microbes, such as Alphaproteobacteria and Actinobacteria, into aquatic systems (Figure 5D). In-stream processes refine these microbial communities, adapting them to planktonic habitats in larger rivers, lakes, and reservoirs [37,38]. Concurrently, plant–soil interactions shape microbial diversity, as plants selectively enrich microbial subgroups like Gammaproteobacteria and Alphaproteobacteria through root exudates, fostering niche differentiation in the rhizosphere and increasing beta-diversity [39] (Figure 5E).
Our analyses also uncovered previously underexplored inter-habitat transitions, such as between rivers and seawater. By incorporating estuary samples, we observed that estuary microbes transition toward both riverine and marine ecosystems (Figure 5A). These transition zones, where ecological processes converge, show that microbial community structures are influenced by environmental changes [40]. Thus, MT-tracker not only accurately determines transitional directions within microbial networks but also uncovers novel inter-habitat transitions. These findings offer a new lens for studying community dynamics in complex habitats, including transitional ecosystems like estuaries and thus significantly advancing our understanding of microbial ecology.
4.4. Uncovering Subtle Dynamic Trends in Short-Term Longitudinal Surveys
The composition of the human microbiome undergoes continuous changes over time. These shifts occur not only during transitions between health and disease but also in healthy individuals, driven by factors such as diet, lifestyle, and environmental conditions. Longitudinal studies are thus essential for capturing these dynamic trends. However, since microbial transitions among ecosystems typically span thousands to millions of years [41], discerning subtle, day-to-day changes in short-term human microbiome studies presents a significant challenge.
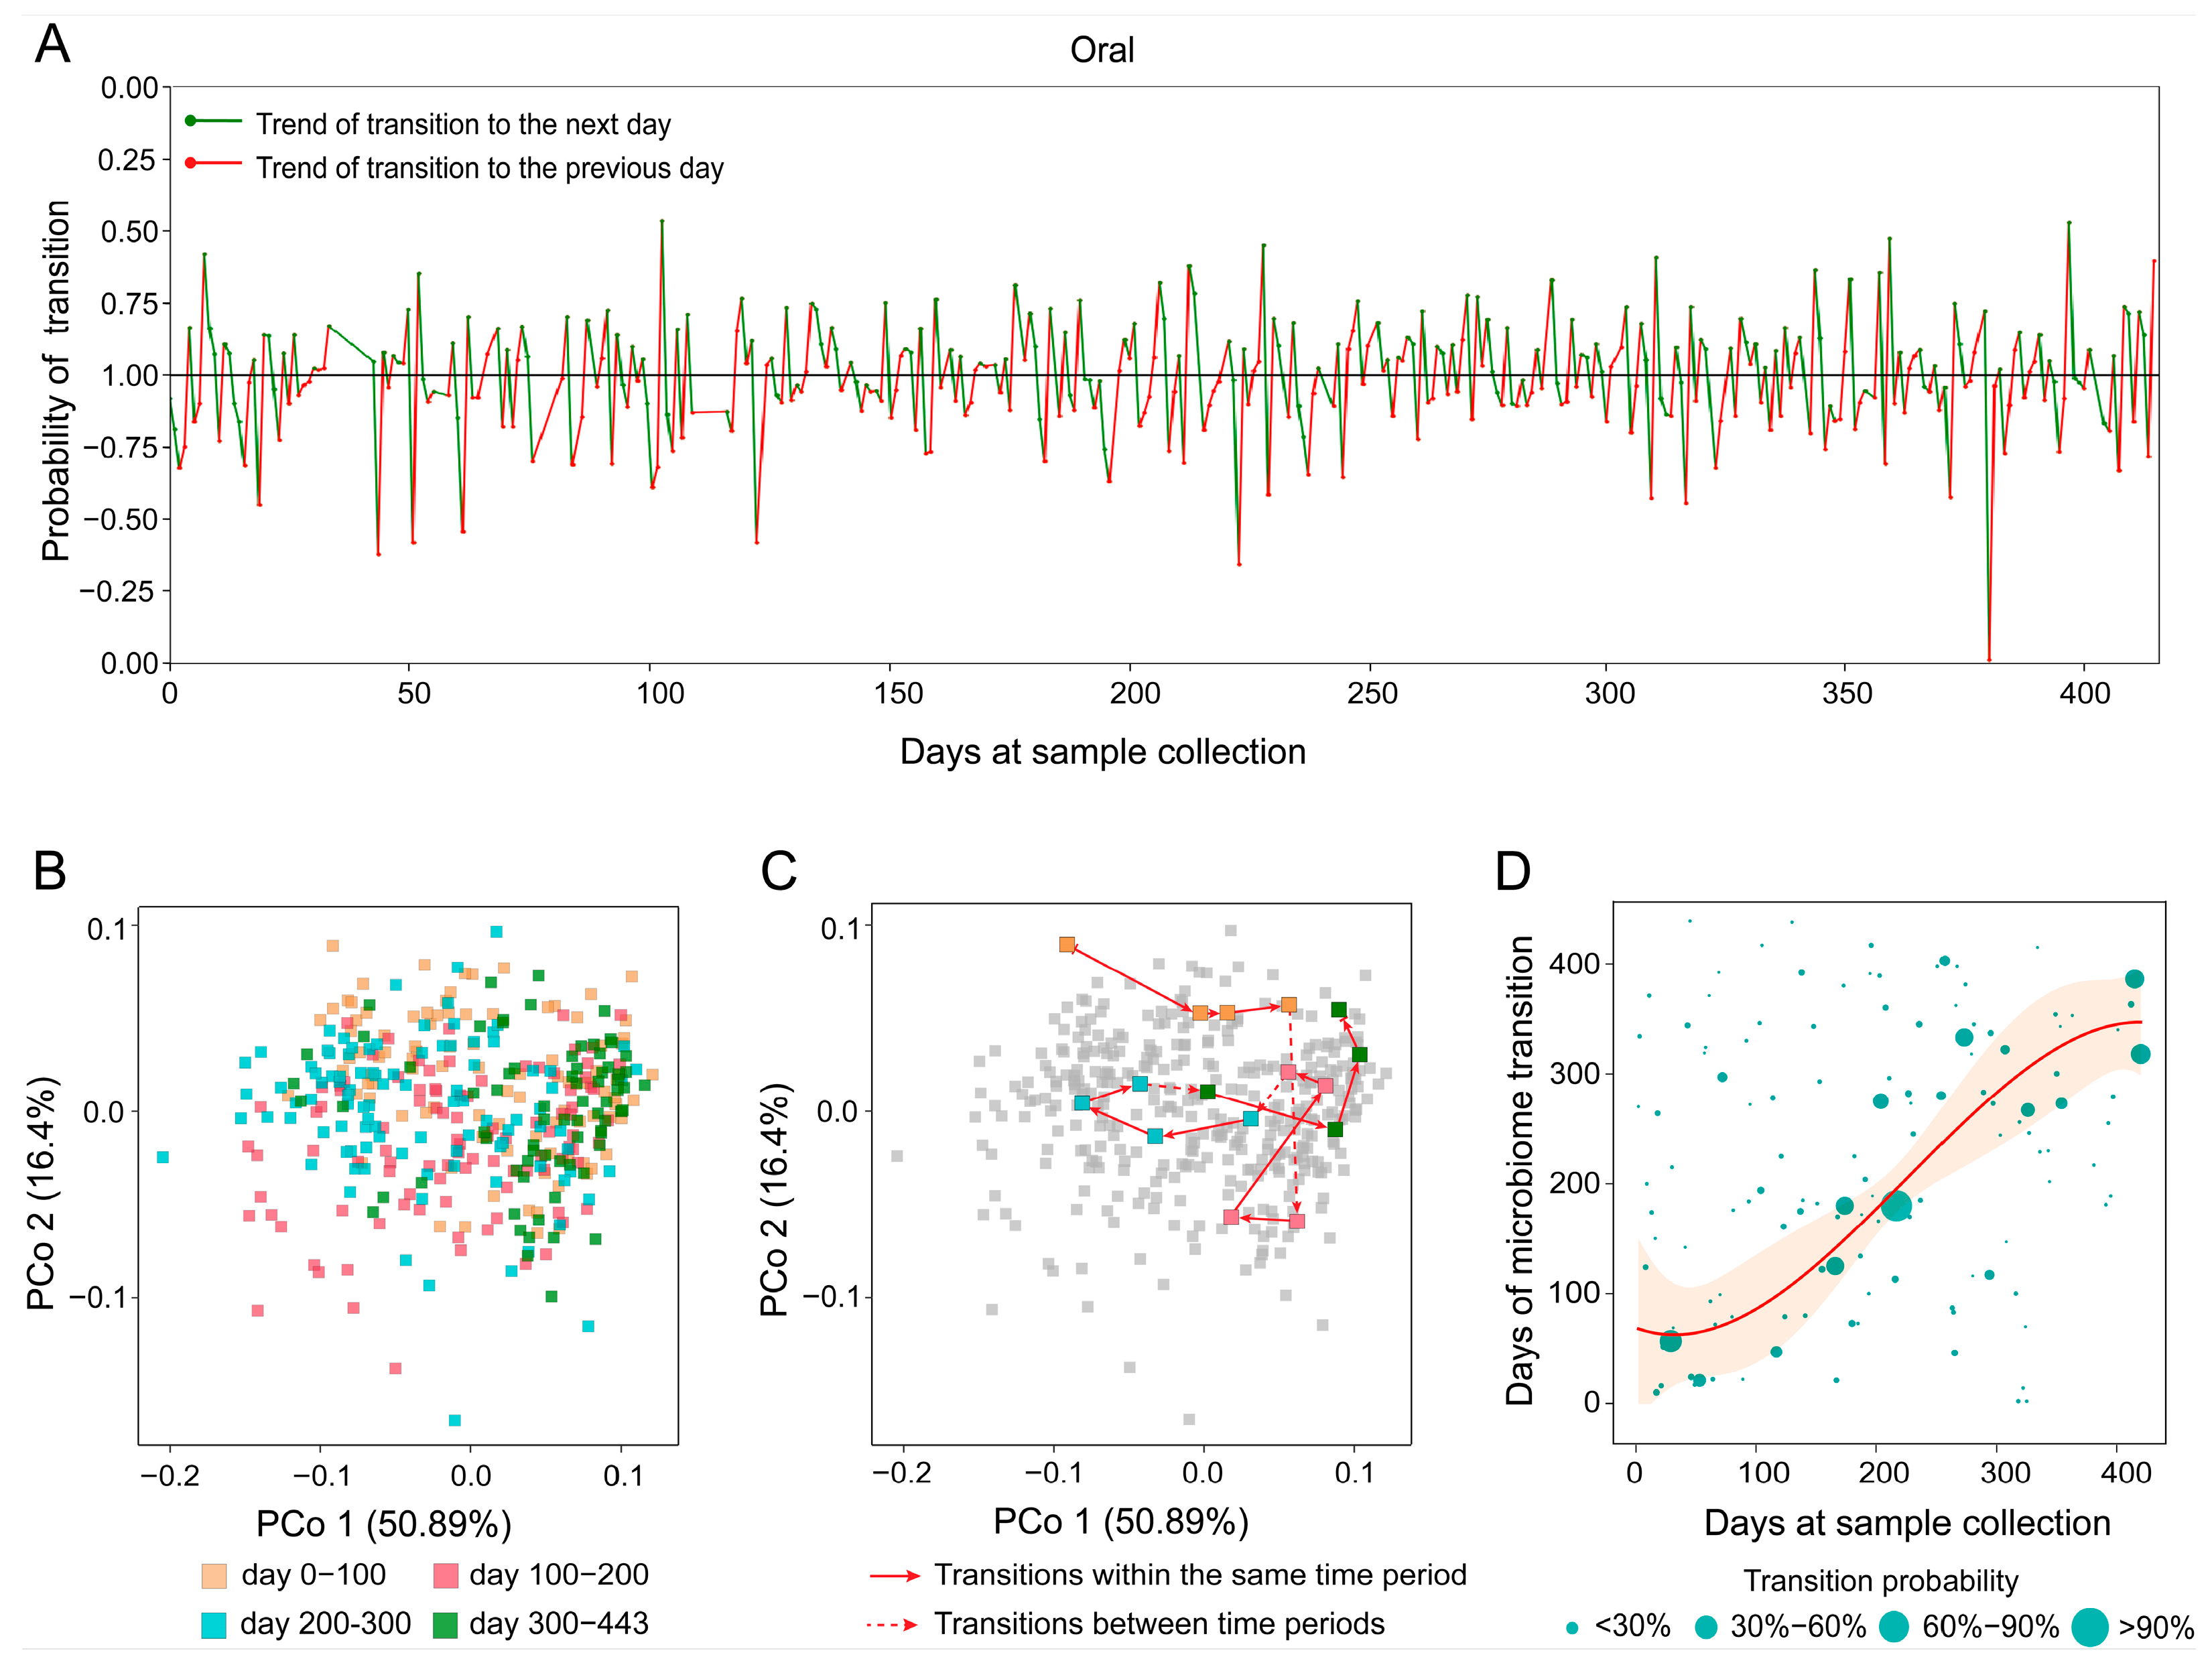
We applied MT-tracker to the TS dataset (Table 1), which includes 373 samples collected from oral cavity over a 400-day period [28]. When analyzed on a day-to-day basis, the transitional directions appeared irregular, lacking discernible patterns (Figure 6A). Principal coordinate analysis (PCoA) visualized the samples’ trajectories in two-dimensional space, revealing chaotic and distorted patterns, as expected given the complexity of daily variations (Figure 6B). Moreover, PCoA coordinates failed to reveal specific transitional directions within microbial communities (Figure 6C).
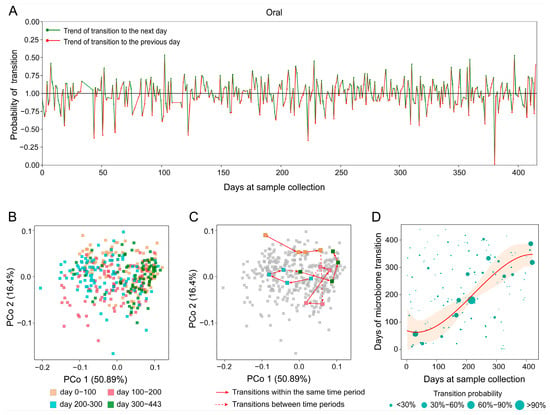
Figure 6.
The transition trend of oral microbiome in subjects over time. (A) The short-term transition trend shows the red and green dashed lines representing the daily transition, with the positive and negative on the vertical axis indicating the direction of transition. (B) A PCoA diagram of oral sample microorganisms. (C) Illustrates the transformation path by connecting sample points according to sampling time. (D) The trend of oral microbiome transition over time. The horizontal axis represents sample collection time, while the vertical axis indicates the target time point for microbiome transition. The size of each data point reflects the probability of transition, with larger points indicating higher probabilities.
In contrast, by transforming static community composition data (snapshot measurements that only capture the state of a sample at one time point, analogous to “scalar” information) into dynamic trends with directionality (“vector” information), MT-tracker overcomes the limitations of conventional approaches. When we expanded the observation unit from daily to a broader temporal resolution for example, using monthly aggregation, patterns of microbial change became more apparent (Figure 6D). For the oral microbiome, while daily sampling revealed varying transitional directions, monthly analysis showed that the probability points of microbial transitions were predominantly concentrated near the diagonal. This suggests a relatively stable transition pattern, reflecting gradual and continuous changes over time rather than abrupt shifts.
Additionally, we observed that the number of probability points above the diagonal exceeded that below it, indicating a tendency for the oral microbiome to transition “toward the future” (a shift from earlier community states toward later states, rather than a reversion to past compositions). In other words, the microbiome composition exhibits a forward-moving trend, signifying progressive changes over short periods. In general, these insights establish a foundation for predicting and evaluating the health status of individuals based on the dynamics of the oral microbiome. Through high-resolution short-term longitudinal studies, MT-tracker successfully unveiled the subtle transitional trends of oral microbial communities. These findings illustrate the underlying dynamics of microbial community structure and provide a novel perspective for predicting long-term microbial dynamics across different regions of the human body.
5. Conclusions and Discussion
Microbiomes have co-evolved with and profoundly influenced life on Earth. Yet, understanding their origins and transitions on a global scale remains challenging due to the absence of microbial fossil records and limitations in integrating and analyzing large-scale, high-complexity data [42,43]. Over the past century, biodiversity studies have examined spatial, temporal, and ecological gradients from taxonomic, phylogenetic, and functional perspectives. While fundamental biodiversity patterns have been observed, the mechanisms driving these patterns remain unclear [12].
In this study, we quantified the role of diversification in shaping microbial community structures through a novel virtual common ancestor-based microbial community transition algorithm. This approach enabled us to describe transitions in microbial communities across diverse habitats and geographic locations. While our test set primarily included animal gut microbiota, the algorithm is broadly applicable to microbial communities from various environments, including soil, water, and plant rhizospheres. By constructing phylogeny trees and predicting transitional directions, this algorithm provides a versatile tool for exploring ecological processes and microbial transitions. This work offers valuable insights into the mechanisms underlying microbial transitions and their ecological roles.
Additionally, our findings align with conclusions from relevant studies and highlight the algorithm’s scalability in disease prediction, offering novel insights into microbial community transition under disease states. For instance, in fecal microbiota transplantation (FMT), our research provides valuable reference data. The application of MT-tracker to samples collected prior to and following transplantation enables the quantification of the recipient microbiome’s directional shift toward the donor community, thereby providing objective metrics for the evaluation of FMT outcomes. FMT has shown great promise in treating diseases such as Clostridium difficile infections and inflammatory bowel disease. Although it is considered safe, with no reported short-term complications directly attributed to treatment, more comprehensive safety data and an improved understanding of FMT’s mechanisms of action are essential. Advancements in biocomputational tools for analyzing large, high-dimensional datasets will further enhance the development of transplantable microbial communities tailored to specific diseases [44]. By calculating the transitional direction of intestinal communities’ post-transplantation, this approach offers a reliable framework for improving transplantation success rates and therapeutic efficacy, particularly for conditions characterized by dysbiosis.
However, while the observed pattern generally reflects overall diversification, microbial communities can also undergo simplification under certain conditions, such as antibiotics exposure or disease progression. Since MT-tracker operates under the assumption of increasing phylogenetic diversity, it is currently limited in terms of detecting such reverse transitions. In future work, we aim to extend the algorithm to better accommodate and characterize simplification dynamics. Furthermore, integrating MT-tracker with multi-omics data may help elucidate the mechanisms underlying FMT responses and enhance their predictive power.
6. Materials and Methods
6.1. Microbiome Sample Collection
We used all microbiome samples in the Microbiome Search Engine database (http://mse.ac.cn, accessed on 3 September 2024). The samples came from 1668 studies/projects, covering 21 different habitats (Table 2). To ensure a high-quality reference dataset, the minimum number of sequences for each sample was set to 1000, and the variation in 16S rRNA gene copy number was normalized based on the IMG/M database [45]. Moreover, each sample was required to have at least 500 raw reads and a minimum 80% alignment rate to the 16S rRNA reference database. Finally, 456,702 samples passed quality control and management.
6.2. Microbiome Profiling
For each microbiome, the Parallel-Meta Suite software (version 3.7.2) [46] was used to annotate operational taxonomic units (OTUs). Specifically, the division of OTUs was based on 97% sequence similarity, and sequences with high similarity were clustered into the same OTU. After clustering, the Greengenes database (version 13-8) [47] was used to annotate OTUs to give each OTU clear classification information.
6.3. Construction of Phylogeny Tree for Microbiomes
With the profiles of all microbiomes, we calculated their pairwise distance matrix using the Meta-Storms algorithm. Then, a phylogeny can be constructed by Phylip software (version 3.698) [25] using the Neighbor-Joining method. In the phylogeny tree, each tip node represents a microbiome sample.
6.4. Inferring Transitional Direction Using Phylogeny Tree
To infer transitional direction based on the microbiome phylogeny tree, we identified the ancestral node corresponding to each leaf node. A transition was deemed to have occurred if the number of layers from the leaf node to its ancestral node exceeded a threshold of 5 layers. Here, the term “layers” refers to the number of edges (or branching levels) between the leaf node and its ancestral node in the tree topology. The length of the phylogenetic distance was then utilized to determine the direction of transition. According to our hypothesis, the transition direction is inferred as moving from the microbiome with a shorter distance to the one with a longer distance. This phylogeny-based inference serves as a benchmark to evaluate the consistency and accuracy of the directional transitions predicted by the MT-tracker.
6.5. Transition Network of the Global Microbiome
First, the pairwise similarity of samples in the Microbiome Search Engine (MSE) database was calculated using the Meta-Storms algorithm in the Parallel-Meta Suite software package. We first selected all sample pairs with statistically significant similarity (two-tailed permutation test, p < 0.01), and then examined the distribution of those significant similarity scores and set 99% (corresponding to a similarity score of 0.868) as the cutoff to define direct transitions. Based on this threshold, a transformation network is constructed with samples as nodes by searching for similar neighbors in the database. Traversing all nodes and using the transitive closure algorithm [48], all interconnected subsets were identified and merged to form a main closure covering 98.31% of the samples. Finally, the Kruskal algorithm [49] was used to extract the minimum spanning tree from the main closure, revealing the shortest route for the spread of microbiomes from different habitats and constructing a transition network of the global microbiome.
6.6. The Transition Trend of Oral Microbiome Transition over Time
Using MT-tracker, the transitionary probabilities among oral microbes in the TS dataset (Table 1) were calculated for each day. The target time points with the highest daily transitionary probabilities were then selected. Subsequently, the selected data were curve-fitted using the nonlinear least squares fitting function from the SciPy library [50]. Combining this with covariance matrix estimation, where standard errors (SEMs) were derived from the diagonal of the covariance matrix, dynamic confidence intervals were calculated at a 95% confidence level.
Supplementary Materials
The following supporting information can be downloaded at: https://www.mdpi.com/article/10.3390/math13121982/s1, Supplementary Figure S1. Microbiome transition when two microbiomes are exactly the same phylogenetic distance. Supplementary Table S1: Functional comparison of MT-tracker and major microbiome dynamics modeling methods. Supplementary Table S2. Run time of MT-tracker and phylogenetic analysis.
Author Contributions
Methodology, W.Z. and Y.S.; Software, W.Z.; Validation, W.L.; Formal analysis, W.Z.; Investigation, H.G.; Resources, Y.S. and G.H.; Data curation, G.H.; Writing—original draft, W.Z.; Writing—review & editing, X.S.; Supervision, X.S.; Project administration, H.G.; Funding acquisition, X.S. All authors have read and agreed to the published version of the manuscript.
Funding
X.S. acknowledges support of grant 2021YFF0704500 from National Key Research and Development Program of China, grant 32070086 from National Natural Science Foundation of China, Shandong Province Youth Entrepreneurial Talent Introduction and Training Program, and Shandong Province Taishan Scholars Youth Experts Program.
Data Availability Statement
The public datasets used in this study can be accessed using the information provided in Table 1 or on the project home page. The MSE database is freely accessible, requiring users to cite original studies and adhere to ethical guidelines for anonymized human-associated data under the Creative Commons Attribution 4.0 license. Project name: MT-tracker. Project home page: https://github.com/qdu-bioinfo/MT-tracker (accessed on 9 September 2024). Operating system(s): Linux. Programming language: C++. Other requirements: C++ 14 or higher, GCC 9.4.0 or higher. License: GPL-3.0 license.
Acknowledgments
All authors thank Yi Zhao from Qingdao University for the support of computing resources.
Conflicts of Interest
The authors declare no conflicts of interest.
References
- Zhou, J.; Kang, S.; Schadt, C.W.; Garten, C.T., Jr. Spatial scaling of functional gene diversity across various microbial taxa. Proc. Natl. Acad. Sci. USA 2008, 105, 7768–7773. [Google Scholar] [CrossRef] [PubMed]
- Chase, J.M.; Myers, J.A. Disentangling the importance of ecological niches from stochastic processes across scales. Philos. Trans. R. Soc. Lond. B Biol. Sci. 2011, 366, 2351–2363. [Google Scholar] [CrossRef] [PubMed]
- Chase, J.M. Stochastic community assembly causes higher biodiversity in more productive environments. Science 2010, 328, 1388–1391. [Google Scholar] [CrossRef] [PubMed]
- Ofiţeru, I.D.; Lunn, M.; Curtis, T.P.; Wells, G.F.; Criddle, C.S.; Francis, C.A.; Sloan, W.T. Combined niche and neutral effects in a microbial wastewater treatment community. Proc. Natl. Acad. Sci. USA 2010, 107, 15345–15350. [Google Scholar] [CrossRef]
- Stegen, J.C.; Fredrickson, J.K.; Wilkins, M.J.; Konopka, A.E.; Nelson, W.C.; Arntzen, E.V.; Chrisler, W.B.; Chu, R.K.; Danczak, R.E.; Fansler, S.J. Groundwater–surface water mixing shifts ecological assembly processes and stimulates organic carbon turnover. Nat. Commun. 2016, 7, 11237. [Google Scholar] [CrossRef]
- Vellend, M. Conceptual synthesis in community ecology. Q. Rev. Biol. 2010, 85, 183–206. [Google Scholar] [CrossRef]
- Faust, K.; Raes, J. Microbial interactions: From networks to models. Nat. Rev. Microbiol. 2012, 10, 538–550. [Google Scholar] [CrossRef]
- Sloan, W.T.; Lunn, M.; Woodcock, S.; Head, I.M.; Nee, S.; Curtis, T.P. Quantifying the roles of immigration and chance in shaping prokaryote community structure. Environ. Microbiol. 2006, 8, 732–740. [Google Scholar] [CrossRef]
- Martino, C.; Morton, J.T.; Marotz, C.A.; Thompson, L.R.; Tripathi, A.; Knight, R.; Zengler, K. A novel sparse compositional technique reveals microbial perturbations. mSystems 2019, 4, e00016-19. [Google Scholar] [CrossRef]
- Rizvi, A.H.; Camara, P.G.; Kandror, E.K.; Roberts, T.J.; Schieren, I.; Maniatis, T.; Rabadan, R. Single-cell topological RNA-seq analysis reveals insights into cellular differentiation and development. Nat. Biotechnol. 2017, 35, 551–560. [Google Scholar] [CrossRef]
- Lum, P.Y.; Singh, G.; Lehman, A.; Ishkanov, T.; Vejdemo-Johansson, M.; Alagappan, M.; Carlsson, J.; Carlsson, G. Extracting insights from the shape of complex data using topology. Sci. Rep. 2013, 3, 1236. [Google Scholar] [CrossRef] [PubMed]
- Zhou, J.; Deng, Y.; Zhang, P.; Xue, K.; Liang, Y.; Van Nostrand, J.D.; Yang, Y.; He, Z.; Wu, L.; Stahl, D.A.; et al. Stochasticity, succession, and environmental perturbations in a fluidic ecosystem. Proc. Natl. Acad. Sci. USA 2014, 111, E836–E845. [Google Scholar] [CrossRef]
- Jing, G.; Zhang, Y.; Liu, L.; Wang, Z.; Sun, Z.; Knight, R.; Su, X.; Xu, J. A Scale-Free, Fully Connected Global Transition Network Underlies Known Microbiome Diversity. mSystems 2021, 6, e0039421. [Google Scholar] [CrossRef] [PubMed]
- Nemergut, D.R.; Schmidt, S.K.; Fukami, T.; O’Neill, S.P.; Bilinski, T.M.; Stanish, L.F.; Knelman, J.E.; Darcy, J.L.; Lynch, R.C.; Wickey, P.; et al. Patterns and processes of microbial community assembly. Microbiol. Mol. Biol. Rev. 2013, 77, 342–356. [Google Scholar] [CrossRef] [PubMed]
- Hanson, C.A.; Fuhrman, J.A.; Horner-Devine, M.C.; Martiny, J.B. Beyond biogeographic patterns: Processes shaping the microbial landscape. Nat. Rev. Microbiol. 2012, 10, 497–506. [Google Scholar] [CrossRef]
- Zhou, J.; He, Z.; Yang, Y.; Deng, Y.; Tringe, S.G.; Alvarez-Cohen, L. High-throughput metagenomic technologies for complex microbial community analysis: Open and closed formats. mBio 2015, 6, 02288-14. [Google Scholar] [CrossRef]
- Jeraldo, P.; Sipos, M.; Chia, N.; Brulc, J.M.; Dhillon, A.S.; Konkel, M.E.; Larson, C.L.; Nelson, K.E.; Qu, A.; Schook, L.B.; et al. Quantification of the relative roles of niche and neutral processes in structuring gastrointestinal microbiomes. Proc. Natl. Acad. Sci. USA 2012, 109, 9692–9698. [Google Scholar] [CrossRef]
- Schweiger, O.; Klotz, S.; Durka, W.; Kühn, I. A comparative test of phylogenetic diversity indices. Oecologia 2008, 157, 485–495. [Google Scholar] [CrossRef]
- Dickerson, R.E. The structure of cytochrome c and the rates of molecular evolution. J. Mol. Evol. 1971, 1, 26–45. [Google Scholar] [CrossRef]
- Guénard, G.; Legendre, P.; Peres-Neto, P. Phylogenetic eigenvector maps: A framework to model and predict species traits. Methods Ecol. Evol. 2013, 4, 1120–1131. [Google Scholar] [CrossRef]
- Cadotte, M.; Albert, C.H.; Walker, S.C. The ecology of differences: Assessing community assembly with trait and evolutionary distances. Ecol. Lett. 2013, 16, 1234–1244. [Google Scholar] [CrossRef]
- Tucker, C.M.; Davies, T.J.; Cadotte, M.W.; Pearse, W.D. On the relationship between phylogenetic diversity and trait diversity. Ecology 2018, 99, 1473–1479. [Google Scholar] [CrossRef] [PubMed]
- Su, X.; Xu, J.; Ning, K. Meta-Storms: Efficient search for similar microbial communities based on a novel indexing scheme and similarity score for metagenomic data. Bioinformatics 2012, 28, 2493–2501. [Google Scholar] [CrossRef] [PubMed]
- Groussin, M.; Mazel, F.; Sanders, J.G.; Smillie, C.S.; Lavergne, S.; Thuiller, W.; Alm, E.J. Unraveling the processes shaping mammalian gut microbiomes over evolutionary time. Nat. Commun. 2017, 8, 14319. [Google Scholar] [CrossRef]
- Revell, L.J.; Chamberlain, S.A. Rphylip: An R interface for PHYLIP. Methods Ecol. Evol. 2014, 5, 976–981. [Google Scholar] [CrossRef]
- Jing, G.; Liu, L.; Wang, Z.; Zhang, Y.; Qian, L.; Gao, C.; Zhang, M.; Li, M.; Zhang, Z.; Liu, X.; et al. Microbiome Search Engine 2: A Platform for Taxonomic and Functional Search of Global Microbiomes on the Whole-Microbiome Level. mSystems 2021, 6, 00943-20. [Google Scholar] [CrossRef]
- Brooks, A.W.; Kohl, K.D.; Brucker, R.M.; van Opstal, E.J.; Bordenstein, S.R. Phylosymbiosis: Relationships and Functional Effects of Microbial Communities across Host Evolutionary History. PLoS Biol. 2016, 14, e2000225. [Google Scholar] [CrossRef] [PubMed]
- Caporaso, J.G.; Lauber, C.L.; Costello, E.K.; Berg-Lyons, D.; Gonzalez, A.; Stombaugh, J.; Knights, D.; Gajer, P.; Ravel, J.; Fierer, N.; et al. Moving pictures of the human microbiome. Genome Biol. 2011, 12, R50. [Google Scholar] [CrossRef]
- Youngblut, N.D.; Reischer, G.H.; Walters, W.; Schuster, N.; Walzer, C.; Stalder, G.; Ley, R.E.; Farnleitner, A.H. Host diet and evolutionary history explain different aspects of gut microbiome diversity among vertebrate clades. Nat. Commun. 2019, 10, 2200. [Google Scholar] [CrossRef]
- Saitou, N.; Nei, M. The neighbor-joining method: A new method for reconstructing phylogenetic trees. Mol. Biol. Evol. 1987, 4, 406–425. [Google Scholar] [CrossRef]
- Andrei, A.S.; Salcher, M.M.; Mehrshad, M.; Rychtecky, P.; Znachor, P.; Ghai, R. Niche-directed evolution modulates genome architecture in freshwater Planctomycetes. ISME J. 2019, 13, 1056–1071. [Google Scholar] [CrossRef] [PubMed]
- Battistuzzi, F.U.; Hedges, S.B. A major clade of prokaryotes with ancient adaptations to life on land. Mol. Biol. Evol. 2009, 26, 335–343. [Google Scholar] [CrossRef]
- Engel, P.; Moran, N.A. The gut microbiota of insects–diversity in structure and function. FEMS Microbiol. Rev. 2013, 37, 699–735. [Google Scholar] [CrossRef] [PubMed]
- Kikuchi, Y.; Hayatsu, M.; Hosokawa, T.; Nagayama, A.; Tago, K.; Fukatsu, T. Symbiont-mediated insecticide resistance. Proc. Natl. Acad. Sci. USA 2012, 109, 8618–8622. [Google Scholar] [CrossRef]
- Méheust, R.; Castelle, C.J.; Matheus Carnevali, P.B.; Farag, I.F.; He, C.; Chen, L.-X.; Amano, Y.; Hug, L.A.; Banfield, J.F. Groundwater Elusimicrobia are metabolically diverse compared to gut microbiome Elusimicrobia and some have a novel nitrogenase paralog. ISME J. 2020, 14, 2907–2922. [Google Scholar] [CrossRef]
- Banerjee, S.; van der Heijden, M.G.A. Soil microbiomes and one health. Nat. Rev. Microbiol. 2023, 21, 6–20. [Google Scholar] [CrossRef]
- Dodds, W.K.; Zeglin, L.H.; Ramos, R.J.; Platt, T.G.; Pandey, A.; Michaels, T.; Masigol, M.; Klompen, A.M.; Kelly, M.C.; Jumpponen, A. Connections and feedback: Aquatic, plant, and soil microbiomes in heterogeneous and changing environments. BioScience 2020, 70, 548–562. [Google Scholar] [CrossRef]
- Veach, A.M.; Dodds, W.K.; Jumpponen, A. Woody plant encroachment, and its removal, impact bacterial and fungal communities across stream and terrestrial habitats in a tallgrass prairie ecosystem. FEMS Microbiol. Ecol. 2015, 91, fiv109. [Google Scholar] [CrossRef] [PubMed]
- Ruiz-González, C.; Niño-García, J.P.; Del Giorgio, P.A. Terrestrial origin of bacterial communities in complex boreal freshwater networks. Ecol. Lett. 2015, 18, 1198–1206. [Google Scholar] [CrossRef]
- Lv, H.; Yang, M.; Cheng, Y.; Li, K.; Ji, G.; Huang, T.; Wen, G. Disentangling the assembly patterns and drivers of microbial communities during thermal stratification and mixed periods in a deep-water reservoir. Sci. Total Environ. 2024, 946, 174398. [Google Scholar] [CrossRef]
- Morlon, H. Phylogenetic approaches for studying diversification. Ecol. Lett. 2014, 17, 508–525. [Google Scholar] [CrossRef] [PubMed]
- Kyrpides, N.C.; Eloe-Fadrosh, E.A.; Ivanova, N.N. Microbiome data science: Understanding our microbial planet. Trends Microbiol. 2016, 24, 425–427. [Google Scholar] [CrossRef] [PubMed]
- Guo, X.; Wu, Z.; Zhang, S.; Zhao, J. Cov-trans: An efficient algorithm for discontinuous transcript assembly in coronaviruses. BMC Genom. 2024, 25, 1257. [Google Scholar] [CrossRef] [PubMed]
- Kelly, C.R.; Kahn, S.; Kashyap, P.; Laine, L.; Rubin, D.; Atreja, A.; Moore, T.; Wu, G. Update on Fecal Microbiota Transplantation 2015: Indications, Methodologies, Mechanisms, and Outlook. Gastroenterology 2015, 149, 223–237. [Google Scholar] [CrossRef] [PubMed]
- Markowitz, V.M.; Ivanova, N.N.; Szeto, E.; Palaniappan, K.; Chu, K.; Dalevi, D.; Chen, I.M.; Grechkin, Y.; Dubchak, I.; Anderson, I.; et al. IMG/M: A data management and analysis system for metagenomes. Nucleic Acids Res. 2008, 36, D534–D538. [Google Scholar] [CrossRef]
- Chen, Y.; Li, J.; Zhang, Y.; Zhang, M.; Sun, Z.; Jing, G.; Huang, S.; Su, X. Parallel-Meta Suite: Interactive and rapid microbiome data analysis on multiple platforms. IMeta 2022, 1, e1. [Google Scholar] [CrossRef]
- McDonald, D.; Price, M.N.; Goodrich, J.; Nawrocki, E.P.; DeSantis, T.Z.; Probst, A.; Andersen, G.L.; Knight, R.; Hugenholtz, P. An improved Greengenes taxonomy with explicit ranks for ecological and evolutionary analyses of bacteria and archaea. ISME J. 2012, 6, 610–618. [Google Scholar] [CrossRef]
- Warshall, S. A theorem on boolean matrices. J. ACM 1962, 9, 11–12. [Google Scholar] [CrossRef]
- Kruskal, J.B. On the shortest spanning subtree of a graph and the traveling salesman problem. Proc. Am. Math. Soc. 1956, 7, 48–50. [Google Scholar] [CrossRef]
- Virtanen, P.; Gommers, R.; Oliphant, T.E.; Haberland, M.; Reddy, T.; Cournapeau, D.; Burovski, E.; Peterson, P.; Weckesser, W.; Bright, J. SciPy 1.0: Fundamental algorithms for scientific computing in Python. Nat. Methods 2020, 17, 261–272. [Google Scholar] [CrossRef]
Disclaimer/Publisher’s Note: The statements, opinions and data contained in all publications are solely those of the individual author(s) and contributor(s) and not of MDPI and/or the editor(s). MDPI and/or the editor(s) disclaim responsibility for any injury to people or property resulting from any ideas, methods, instructions or products referred to in the content. |
© 2025 by the authors. Licensee MDPI, Basel, Switzerland. This article is an open access article distributed under the terms and conditions of the Creative Commons Attribution (CC BY) license (https://creativecommons.org/licenses/by/4.0/).

