Article

New Multiscale Approach of Complex Modelling Chordae Tendineae Considering Strain-Dependent Modulus of Elasticity

by
Alicia Menéndez Hurtado
,
Sergejus Borodinas
,
Olga Chabarova
,
Jelena Selivonec
* and
Eugeniuš Stupak
Department of Applied Mechanics, Vilnius Gediminas Technical University, Saulėtekio al. 11, LT-10223 Vilnius, Lithuania
*
Author to whom correspondence should be addressed.
Mathematics 2025, 13(20), 3331; https://doi.org/10.3390/math13203331
Submission received: 3 July 2025 / Revised: 11 September 2025 / Accepted: 14 October 2025 / Published: 19 October 2025

Abstract

Understanding the nonlinear mechanical behaviour of mitral valve chordae tendineae is critical for accurate biomechanical modelling in cardiac simulations. This study integrates high-resolution 3D finite element analysis with experimentally derived Cauchy stress–Green–Lagrange strain data to capture both material and geometric nonlinearities. A one-dimensional formulation incorporating strain-dependent elasticity and large deformation kinematics was developed and validated against 3D simulations in COMSOL Multiphysics. Calibrated using experimental stress–strain data and validated against high-fidelity 3D finite element simulations in COMSOL, it reveals that neglecting transverse deformation overestimates axial force by 7%. Cross-sectional area reduction during stretch remained consistently around 12%, underscoring the importance of Poisson effects. A polynomial fit to the strain-dependent modulus of elasticity enables efficient force prediction with excellent agreement to experimental data. These results advance the mathematical modelling of biological tissues with nonlinear hyperelastic behaviour, providing a foundation for patient-specific simulations and real-time predictive tools in cardiovascular engineering.

1. Introduction

In recent decades, numerical simulations have become essential tools across different scientific and engineering fields, enabling the analysis of parameters beyond the experimental reach. This has spurred growing interest in biomechanical modelling of biological structures. Integrating engineering principles with medical insights offers a powerful framework for assessing pathological states. Key bioengineering elements, such as soft tissue mechanics and constitutive modelling of cardiovascular dynamics, are central to planning and executing cardiac surgery.
The heart functions schematically as a four-valve system that ensures unidirectional blood flow through its four chambers. The mitral valve (MV), located between the left atrium and the left ventricle, consists of leaflets, annulus, papillary muscles, and chordae tendineae (CT) [1,2]. A schematic illustration of the MV and its chordae is shown in Figure 1. Modelling the MV presents significant challenges due to its inherently multiscale nature, which spans from cellular components to full-organ dynamics [3,4].
Recent efforts emphasize integrating medical imaging with computational models to create patient-specific simulations that enhance surgical planning and outcome prediction [4,5]. These simulations rely on accurate anatomical geometries and calibrated material properties derived from experimental data. To this end, parameter identification is frequently carried out via inverse methods or nonlinear least squares fitting to engineering stress–strain measurements. The mechanical behaviour of the MV is governed by fluid–structure interaction (FSI), where blood flow and tissue deformation are mutually dependent [6,7]. Solving such coupled systems requires advanced numerical techniques, notably finite element methods (FEM), which have been widely used in cardiac modelling [8,9]. In this context, geometric and material nonlinearities must be simultaneously addressed to realistically capture large deformation dynamics.
In FEM, MV leaflets are typically represented using 3D continuum elements, while chordae tendineae are often modelled using 1D truss or spring elements [10,11]. However, recent studies [12,13] have advanced toward anatomically detailed 3D representations of chordae, incorporating tetrahedral continuum meshes and anisotropic fibre-reinforced models to more faithfully replicate physiological mechanics. These works are directly relevant to the central aims of our paper. For instance, Mangine et al. [12] introduced a method to generate synthetic 3D chordae geometries with realistic branching patterns, demonstrating their influence on leaflet coaptation mechanics via FE bio simulations. Similarly, Crispino et al. [13] integrated a complete subvalvular apparatus into dynamic image-based computational fluid dynamics (CFD) models, enabling detailed assessment of local flow disturbances and stress distributions.
Chordae tendineae play a critical role in maintaining valvular competence by preventing leaflet prolapse during systole [2,14]. Their mechanical behaviour is highly nonlinear and viscoelastic, often modelled using hyperelastic constitutive laws such as the Ogden model [15,16]. Experimental calibration through uniaxial tensile testing provides essential stress–strain data for these models [2,17]. Despite progress, many current models assume homogeneity and isotropy, thus neglecting the complex collagenous microstructure and history-dependent behaviour of chordae [2,18]. This introduces limitations in predictive fidelity, particularly in cases involving patient-specific remodelling. This study revisits the nonlinear mechanical behaviour of chordae tendineae by integrating high-resolution 3D finite element simulations with experimentally derived stress–strain data, as reported in [2]. Our framework accounts for both material and geometric nonlinearities and captures anisotropic and hyperelastic responses with enhanced fidelity. Validation against experimental data yielded low fitting residuals, reinforcing the accuracy of the parameterized model. While Gun et al. [19] offer empirical regression-based estimates for chordal length reconstruction, our study extends this work by modelling the full nonlinear mechanical response under physiological loading conditions, offering a more mechanistically grounded alternative for biomechanical simulation.
While FEM is widely used to model mitral valve chordae, full 3D simulations are computationally intensive. We introduce a streamlined 1D nonlinear formulation that embeds strain-dependent elasticity and geometric nonlinearity, matching experimental data and 3D FE benchmarks. Unlike classical hyperelastic models (Neo-Hookean, Mooney–Rivlin, Ogden, Yeoh, etc.) that require multi-parameter fitting, our approach uses a directly regressed modulus E(ε) to yield closed-form, efficient, and easy-to-calibrate relations—well suited for real-time and patient-specific applications.

2. Materials and Methods

2.1. Three-Dimensional Formulation

The strategy for modelling chordae of hyperelastic material to investigate its nonlinear behaviour includes the following steps: creating a finite element 3D chorda model, taking into account not only longitudinal, but also transverse strain to obtain a tensile chorda force and mechanical properties of the material; comparison of the results of calculations of the created model with experimental data (physical). The simulation is carried out in the COMSOL Multiphysics 6.3 programme and analytically.
The analytical derivations (Section 2.1 and Section 2.2) provide simplified 1D and 3D formulations of chordal mechanics, which allow explicit tracking of material and geometric nonlinearities. These formulations were then validated against high-fidelity FE simulations (Section 2.3) in COMSOL Multiphysics 6.3. Thus, the analytical approach serves as a reduced-order model, while the FE simulations provide a full 3D benchmark reference for complex loading changing over time.
An offset of a specific value is added to the free end of the chordae to determine the critical force. The opposite end of the chordae is rigidly fixed.
Because of the large diversity of biomaterial properties, the creation of biomaterial models is difficult. The difference existent from the constitutive model defined from general continuum theory requires careful examination. Different models with different calibrations may produce different deviations from reality [16,20].
Throughout this study, we express the constitutive model in the reference configuration, using Green–Lagrange strain together with the second Piola–Kirchhoff stress as the work-conjugate pair. The material response is defined through a strain–energy function of Green strain [21]. For plotting and comparison with experiments, stresses are mapped to the current configuration, and results are reported as Cauchy stress versus Green strain to match [2]. In the limit of infinitesimal strain, this formulation reduces to the classical small-strain relations.
δ W = V σ x , y , z : δ ε x , y , z d V
Here, ‘:’ denotes the double contraction between stress and strain tensors, yielding a scalar work term. In the one-dimensional case, this reduces to the scalar product σ·δε.
The constitutive equation in the linear case is described by σ:
σ x , y , z = E δ ε x , y , z
So, substituting Equation (2) into Equation (1), the expression looks like
δ W = V Ε ε T δ ε x , y , z d V
Ultimately, the virtual work expression can be presented as follows:
δ W x , y , z , t = W x , y , z , t ε x , y , z , t δ ε x , y , z , t
The expression for W can be written as
W = σ T x , y , z , t ε x , y , z , t
Ultimately, the virtual work expression for the nonlinear model can be presented in its general form as follows:
δ W x , y , z , t = σ x , y , z , t ε x , y , z , t δ ε x , y , z , t

2.2. One-Dimensional Formulation

2.2.1. Material Nonlinearity

By assuming that the cross-section does not change during the deformation of the chordae, the dependencies in y and z disappear and
σ x , y , z , t = σ x , t
ε x , y , z , t = ε x , t
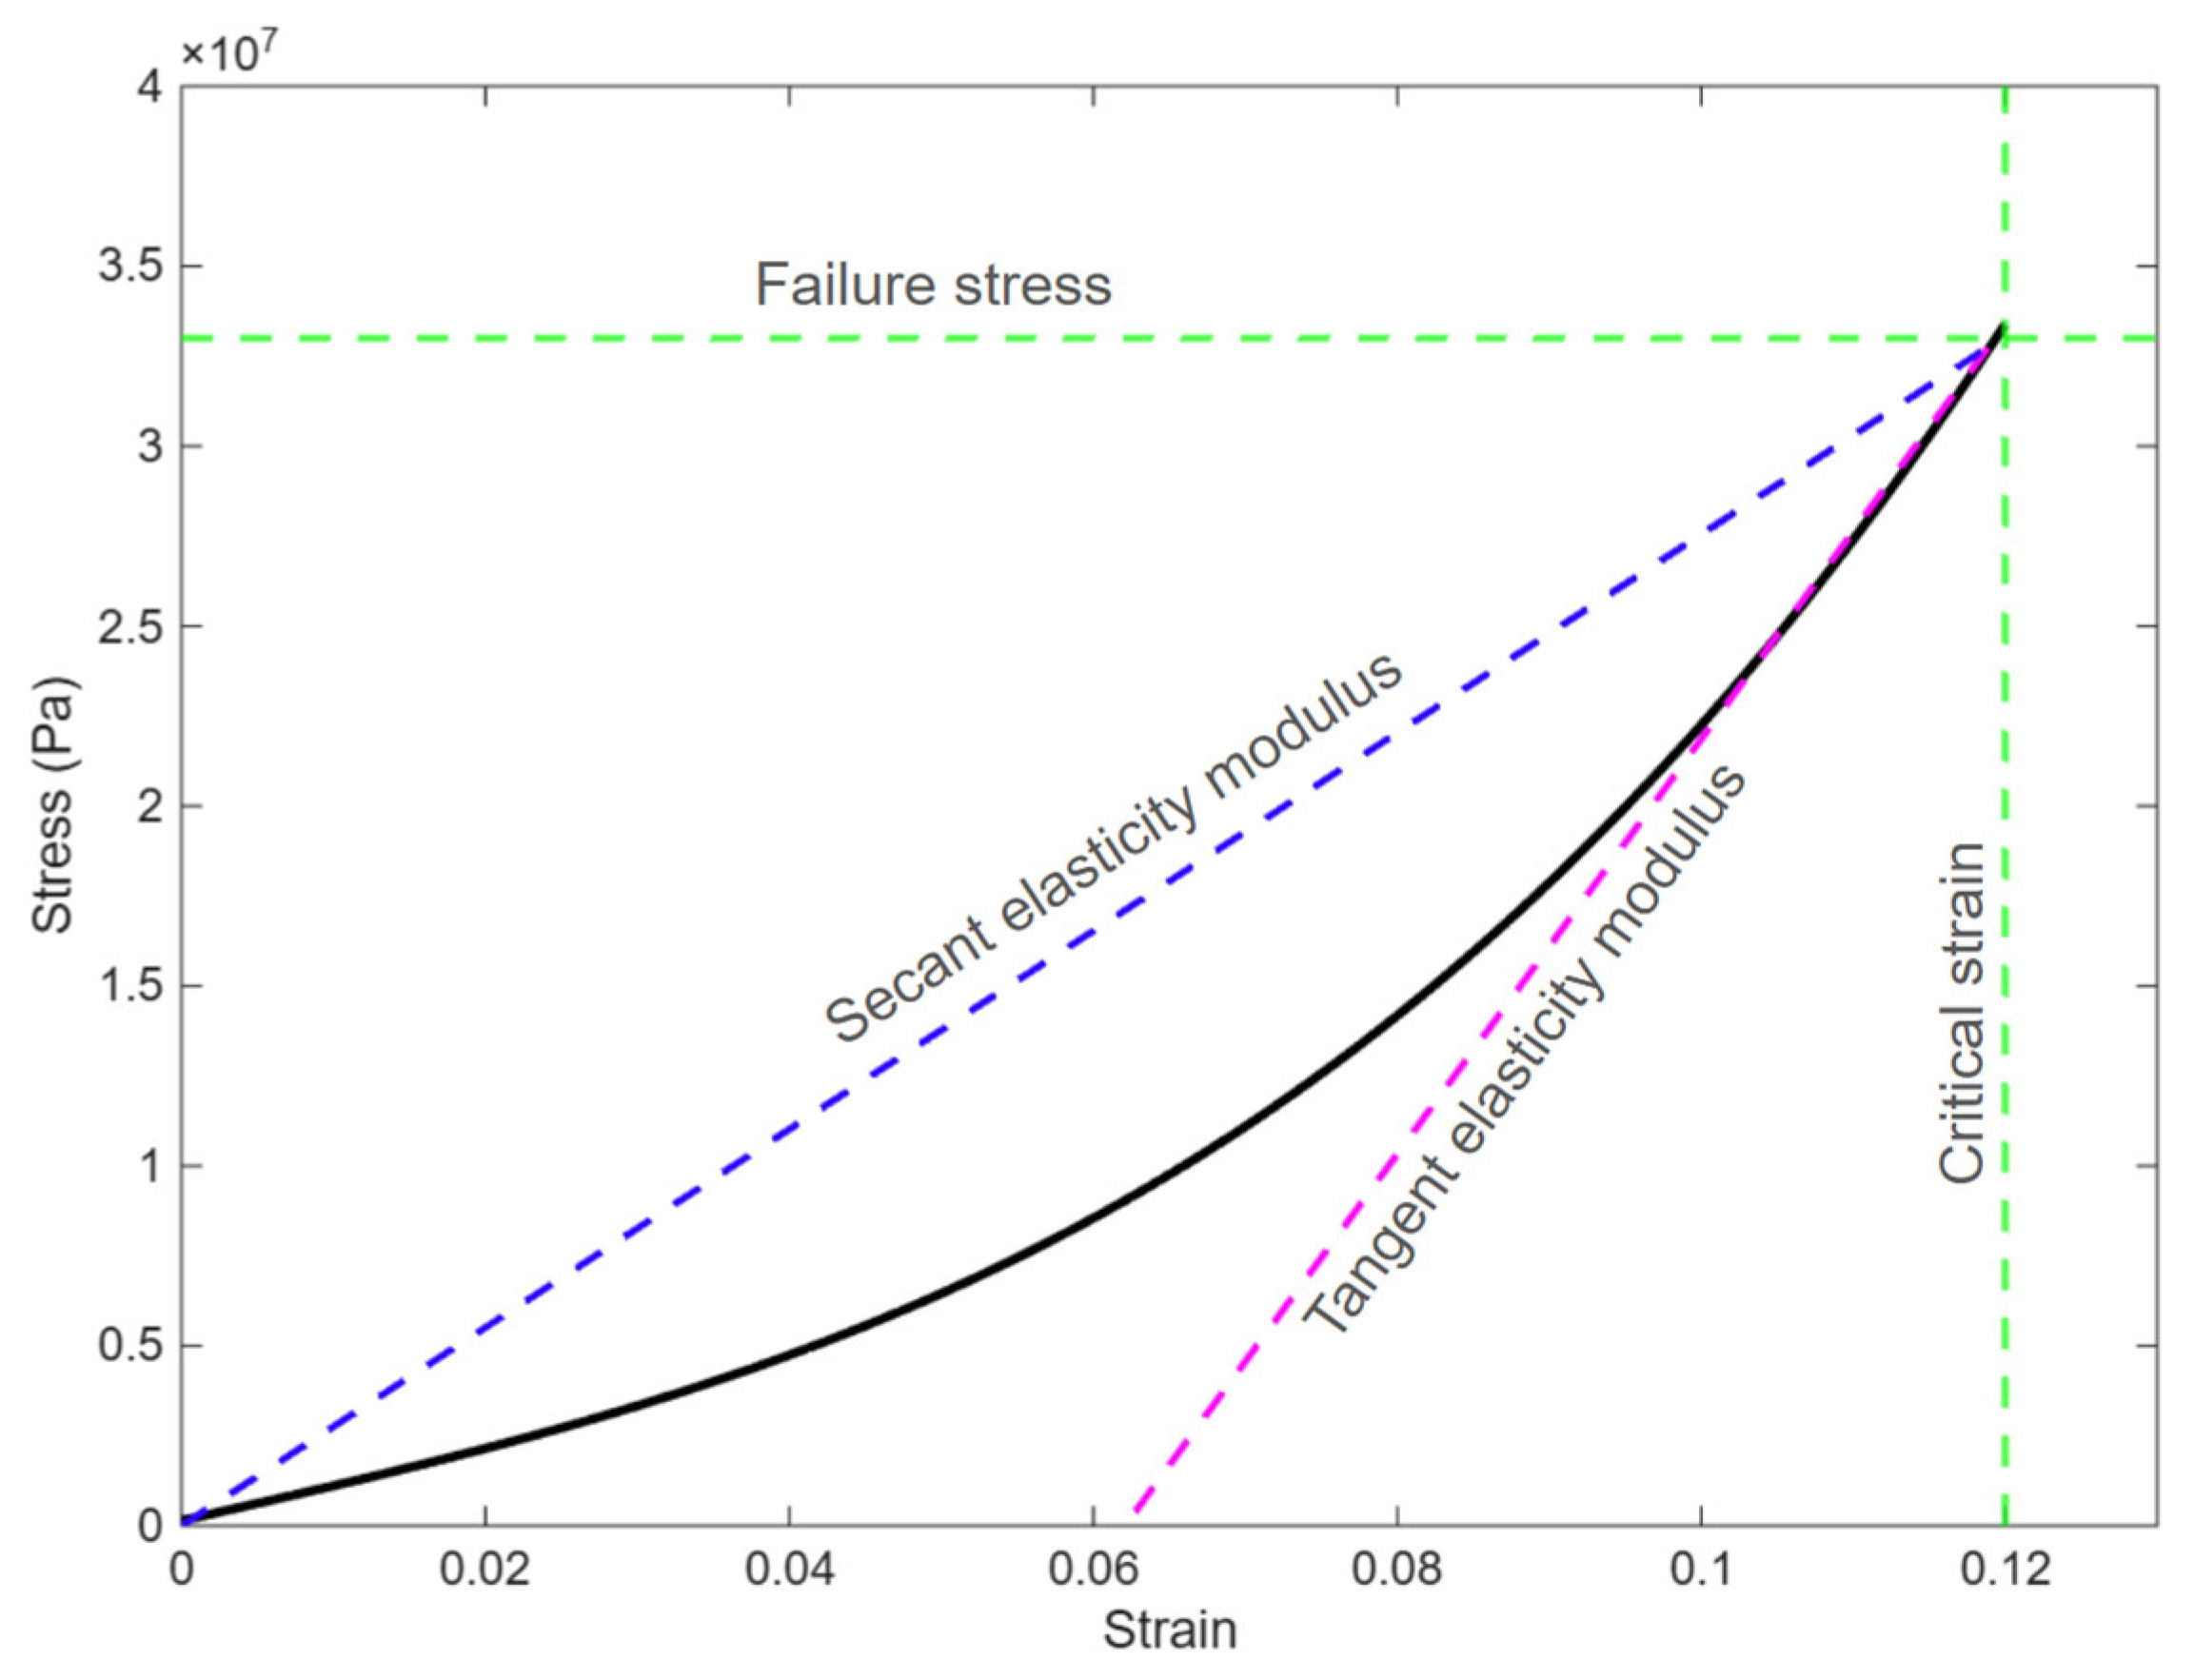
The main mechanical parameters of interest can be extracted from the stress–strain curve, and are the elasticity moduli, which can be separated into two different values: a minimum value of E, indicated as the secant modulus, and a maximum value is indicated as the tangential modulus. The investigation starts from the analysis of the material properties defined as a stress–strain curve. This curve is shown in Figure 2, and presented in terms of stress and strain.
To establish a baseline, a constant Young’s modulus E = c o n s t is adopted (linear elasticity). The formulation is then extended to a strain-dependent modulus E(ε) obtained by polynomial regression of the experimental data, ensuring consistency with the nonlinear response in the human test dataset ([2], Figure 6a). In this setting, E(ε) denotes the tangent stiffness extracted directly from the stress–strain curve. The piecewise coefficients around the transition point are regression parameters that reproduce the data rather than independent hyperelastic material constants. This representation simplifies calibration, is computationally efficient, and—as shown in Section 3—closely matches both the experimental curve and the 3D FE benchmark within the physiological strain range.
Generally, this data can be approximated to a 5th order polynomial, as shown in Equation (15), so the constitutive equation would have the following form:
σ x , t = a 1 ε 5 x , t + a 2 ε 4 x , t + a 3 ε 3 x , t + a 4 ε 2 x , t + a 5 ε x , t + a 6
where ai are constants extracted from the experimental data regression. And to insert this back into Equation (4), the derivative
σ x , t = 5 a 1 ε 4 x , t + 4 a 2 ε 3 x , t + 3 a 3 ε 2 x , t + 2 a 4 ε x , t + a 5
Assuming again that ε (x, t) measures the variation along the central axis of the rod and it does not change in the cross-section, so we have ε (x, t) and its variation δε (x, t) as
ε x , t = u x , t x
δ ε x , t = δ u x , t x
Substituting Equation (6) back into Equation (5),
d W x , t = 5 a 1 u x , t T x 4 + 4 a 2 u x , t T x 3 + 3 a 3 u x , t T x 2 + 2 a 4 u x , t T x + a 5 δ u x , t x
The continuous displacement field is then discretized in the following manner:
u x = N 1 x 2 u D 2 x 1
u x = 1 x l x l u 1 u 2
where u denotes the continuous displacements field and uD represents its discretized counterpart. The derivative of u is then expressed as
u x x = 1 l 1 l u 1 u 2 = 1 l 1 1 u 1 u 2
And for the virtual displacement,
u x x = N 1 x 2 x δ u D 2 x 1
u x x = 1 l 1 l δ u 1 δ u 2 = 1 l 1 1 δ u 1 δ u 2
We aim to obtain a result that is comparable to the linear case, expressed in the form
δ W = u x T x L δ u x T x
Rearranging the expression yields
d W x , t = u x , t T x 5 a 1 u x , t T x 3 + 4 a 2 u x , t T x 2 + 3 a 3 u x , t T x + 2 a 4 + a 5 u x , t T x δ u x , t x
The term {L}, representing the contribution due to material nonlinearity, is given by
L = 5 a 1 u x , t T x 3 + 4 a 2 u x , t T x 2 + 3 a 3 u x , t T x + 2 a 4 + a 5 u x , t T x
Returning to Equation (7), where
B = 1 l 1 1 δ u 1 δ u 2
for clarity, then
L = 5 a 1 B T 3 + 4 a 2 B T 2 + 3 a 3 B T + 2 a 4 + a 5 B T
and if
B T = 1 l u 1 u 2 1 1
Calculating and simplifying the above expression {L} yields
L = 5 a 1 l 3 u 1 u 2 3 + 4 a 2 l 2 u 1 u 2 2 3 a 3 l u 1 u 2 + 2 a 4 l a 5 u 1 u 2
By comparing Equation (8) with the stiffness matrix {K}, the force vector incorporating the material nonlinearity {F}Mnl is derived as
F M n l = L K u
F M n l = 5 a 1 l 3 u 1 u 2 3 + 4 a 2 l 2 u 1 u 2 2 3 a 3 l u 1 u 2 + 2 a 4 l a 5 u 1 u 2 K u 1 u 2
The formulations derived in this chapter provide the foundation for modelling material nonlinearity in the structural behaviour of chordae tendineae, with the final expressions summarized in the equations above.
The constant area A = c o n s t assumption in Section 2.2.1 is used only for the closed-form derivation of material nonlinearity. In Section 3 and in the 3D FE model, we explicitly include transverse contraction (Poisson effect), which relaxes this assumption and yields the diameter/area reductions.

2.2.2. Geometrically Nonlinear Model

The approach follows the same formulation as Equations (1)–(3), consistent with the linear case.
Although the cross-section is assumed constant, the strain ε (x, y, z, t) now depends on displacement gradients in a nonlinear manner, leading to geometric nonlinearity under large deformations.
ε x , y , z , t = ε x , t
Substituting into the virtual work expression, Equation (3), yields the following form:
δ W = V Ε ε x , t T δ ε x , t d V
In the context of geometric nonlinearity, the use of the Green strain tensor εij becomes essential. By definition, this tensor excludes any effects of rigid body rotation, isolating the contribution of pure stretch to the overall deformation.
ε i j = 1 2 u i X j + u j X i + u k X i u k X j
and the strain tensor
ε = ε x x ε x y ε x z ε y x ε y y ε y z ε z x ε z y ε z z
Under the assumptions of constant cross-section and deformation occurring only along the x-axis, the only non-zero term in the Green strain tensor reduces to
ε x x x , t = u x , t x + 1 2 u x , t x 2 + v y , t x 2 + w z , t x 2
In this expression, the first term represents the linear contribution, while the second term accounts for the nonlinear effects. In the nonlinear term, only the first derivative remains, as displacements in the v and w directions are assumed to be absent. The final simplified expression is therefore
ε x x x , t = u x , t x + 1 2 u x , t x 2
Substituting the simplified strain expression, Equation (9) becomes
δ W = V E u x , t x + 1 2 u x , t x 2 T δ u x , t x + 1 2 δ u x , t x 2 d V
δ W = V E u x , t x T + 1 2 u x , t x 2 T δ u x , t x + 1 2 δ u x , t x 2 d V
By performing the multiplication, the expression becomes
δ W = V E u x , t x T δ u x , t x + 1 2 u x , t x T δ u x , t x 2 + 1 2 u x , t x 2 T δ u x , t x + 1 4 u x , t x 2 T δ u x , t x 2 d V
After eliminating the last term, the expression becomes
δ W = V E u x , t x T δ u x , t x + 1 2 u x , t x T δ u x , t x 2 + 1 2 u x , t x 2 T δ u x , t x d V
We now rearrange Equation (10) to bring it into the following form:
δ W = u x , t x T J δ u x , t x
Extracting the relevant terms
δ W = u x , t x T V E 1 + 1 2 δ u x , t x + 1 2 δ u x , t x T d V δ u x , t x
The expression can be simplified further, as the variation in δu(x, t) can be considered the same as the variation in u(x, t), and as the transpose of a scalar is equal to the scalar, the equation is left as
δ W = u x , t x T V E 1 + δ u x , t x T d V δ u x , t x
The matrix {J} from Equation (11) is
J = V E 1 + δ u x , t x T d V
The displacement field is now discretized using finite elements, such that
u x = N 1 x 2 u D 2 x 1
u x = 1 x l x l u 1 u 2
where u is the continuous displacement and uD is the discretized displacement. Then, the derivative of u
u x , t x = 1 l 1 l u 1 t u 2 t = 1 l 1 1 u 1 t u 2 t
And for the virtual displacement,
δ u x x = N 1 x 2 x δ u D 2 x 1
δ u x , t x = 1 l 1 l δ u 1 t δ u 2 t = 1 l 1 1 δ u 1 t δ u 2 t
Inserting this results in Equation (12):
δ W = u 1 t u 2 t T V E 1 l 1 1 T 1 + 1 l 1 1 u 1 t u 2 t T 1 l 1 1 d V δ u 1 t δ u 2 t
δ W = u 1 t u 2 t V E l 2 1 1 1 + 1 l u 1 t u 2 t 1 1 1 1 d V δ u 1 t δ u 2 t
Then the matrix {J}
J = V E l 2 1 1 1 + 1 l u 1 t u 2 t 1 1 1 1 d V
Integrating
J = E A l 2 L 1 + 1 l u 1 t u 2 t 1 1 d x 1 1 1 1
J = E A l 1 + 1 l u 1 t u 2 t 1 1 1 1 1 1
We can compare this expression with matrix {K} from the linear case:
K = E A l 1 1 1 1
The matrix {J} is similar to {K}, but with an added multiplication of two terms that correspond to the nonlinearity considered in the formulation.
As in Section 2.2.1, the constant cross-section is assumed here only to expose geometric nonlinearity in a compact form. The full model and FE analysis incorporate transverse contraction, and the results section makes this transition explicit.
N L = 1 + 1 l u 1 t u 2 t 1 1
Now we return to the physical properties, which are described as
E l o n g a t i o n = u 2 u 1
R i g i d   b o d y   m o t i o n = u 1 + u 2
Therefore, the matrix {J} is defined as
J = E A l 1 + 1 l u 2 t u 1 t u 1 t + u 2 t 1 1 1 1 1 1
J = E A l 1 + 1 l u 2 t + u 1 t + u 1 t + u 2 t 1 1 1 1
J = E A l 1 + 2 u 1 t l 1 1 1 1
Now this can be compared with {K}, where we can see that the difference rests in the term
N L = 1 + 2 u 1 t l
such as
J = K 1 + 2 u 1 t l
This can now be used to derive the relationship between force and displacement for this case:
J u = F
K 1 + 2 u 1 t l u 1 u 2 = F
E A l 1 1 1 1 1 + 2 u 1 t l u 1 u 2 = F
E A l 1 1 1 1 1 + 2 u 1 t l u 2 u 1 u 1 + u 2 = F
E A l 1 1 1 1 u 2 u 1 + 2 u 1 u 2 2 u 1 2 l u 1 + u 2 + 2 u 1 2 + 2 u 1 u 2 l = F
E A l 2 u 1 4 u 1 2 l 2 u 1 4 u 1 2 l = F 1 F 2
E A l 2 u 1 4 u 1 2 l = F 1
E A l 2 4 u 1 l u 1 = F 1
E A l 2 u 1 4 u 1 2 l = F 2
E A l 2 4 u 1 l u 1 = F 2
Equations (13) and (14) complete the derivation and furnish closed-form force–displacement relations for the 1D chorda element; they depend on the specimen geometry (E, A, l) and are used to impose the prescribed displacement and recover the end reactions. For geometry-independent comparison, we convert Δl to Green–Lagrange strain and the reactions to Cauchy stress—accounting for Poisson-driven area change via Equations (17)–(19). Accordingly, all cross-model and experimental results are reported in Section 3 as Cauchy stress versus Green strain, while Equations (13) and (14) remain the working relations that close the 1D boundary-value problem. The constant cross-section assumption is used solely to isolate and present material nonlinearity in closed form. In subsequent sections and the 3D FE model, we incorporate transverse contraction (Poisson effect), which modifies the cross-section during stretch.

2.3. Finite Element Model

2.3.1. Development of 3D Finite Element Model

The data for this study were obtained from scientific literature by researchers modelling the human heart’s mitral valve. The chordae tendineae are considered a key structural component, together with the mitral annulus (MA), leaflets, and papillary muscles (PMs) [8,22,23,24,25]. The geometric model of the chordae was developed based on existing studies in the field. The following section describes the spatial configuration used in the FE analysis, as illustrated in Figure 3.
In the mathematical model, the following symbols are used: l0—initial length of chordae; l—current length; ll0—elongation; d0—initial diameter, d—final diameter.
The chordae in our model were modelled with a length of 18 mm, and a diameter of 1.0 mm, 0.714 mm, and 1.21 mm, as a basal, marginal, and strut chordae, respectively. The diameter and length of a chorda depend on its type, such as presented in [26].
The strain-dependent modulus E(ε) is a material law calibrated from tensile data and, in principle, is independent of the specific 3D geometric representation. Moving to specimen-accurate chordal geometries (e.g., reconstructed from [2]) will change local strain/stress distributions and boundary effects but does not, by itself, alter the calibrated E(ε). If type-specific microstructural differences are present or if anisotropy is introduced, separate fits or a fibre-reinforced constitutive model would be appropriate. From our point of view, it could be inspiration trends for future research works.

2.3.2. FE Methodology

It is well established from uniaxial stretching experiments that the stress–strain behaviour of chordae tendineae is nonlinear [17,18,22,23,24,25,27,28], and thus cannot be described by a single elastic modulus. To capture this nonlinear elasticity in the model, a stress–strain curve from [2] was implemented using the built-in piecewise cubic interpolation function in the commercial FE software COMSOL Multiphysics 6.3.
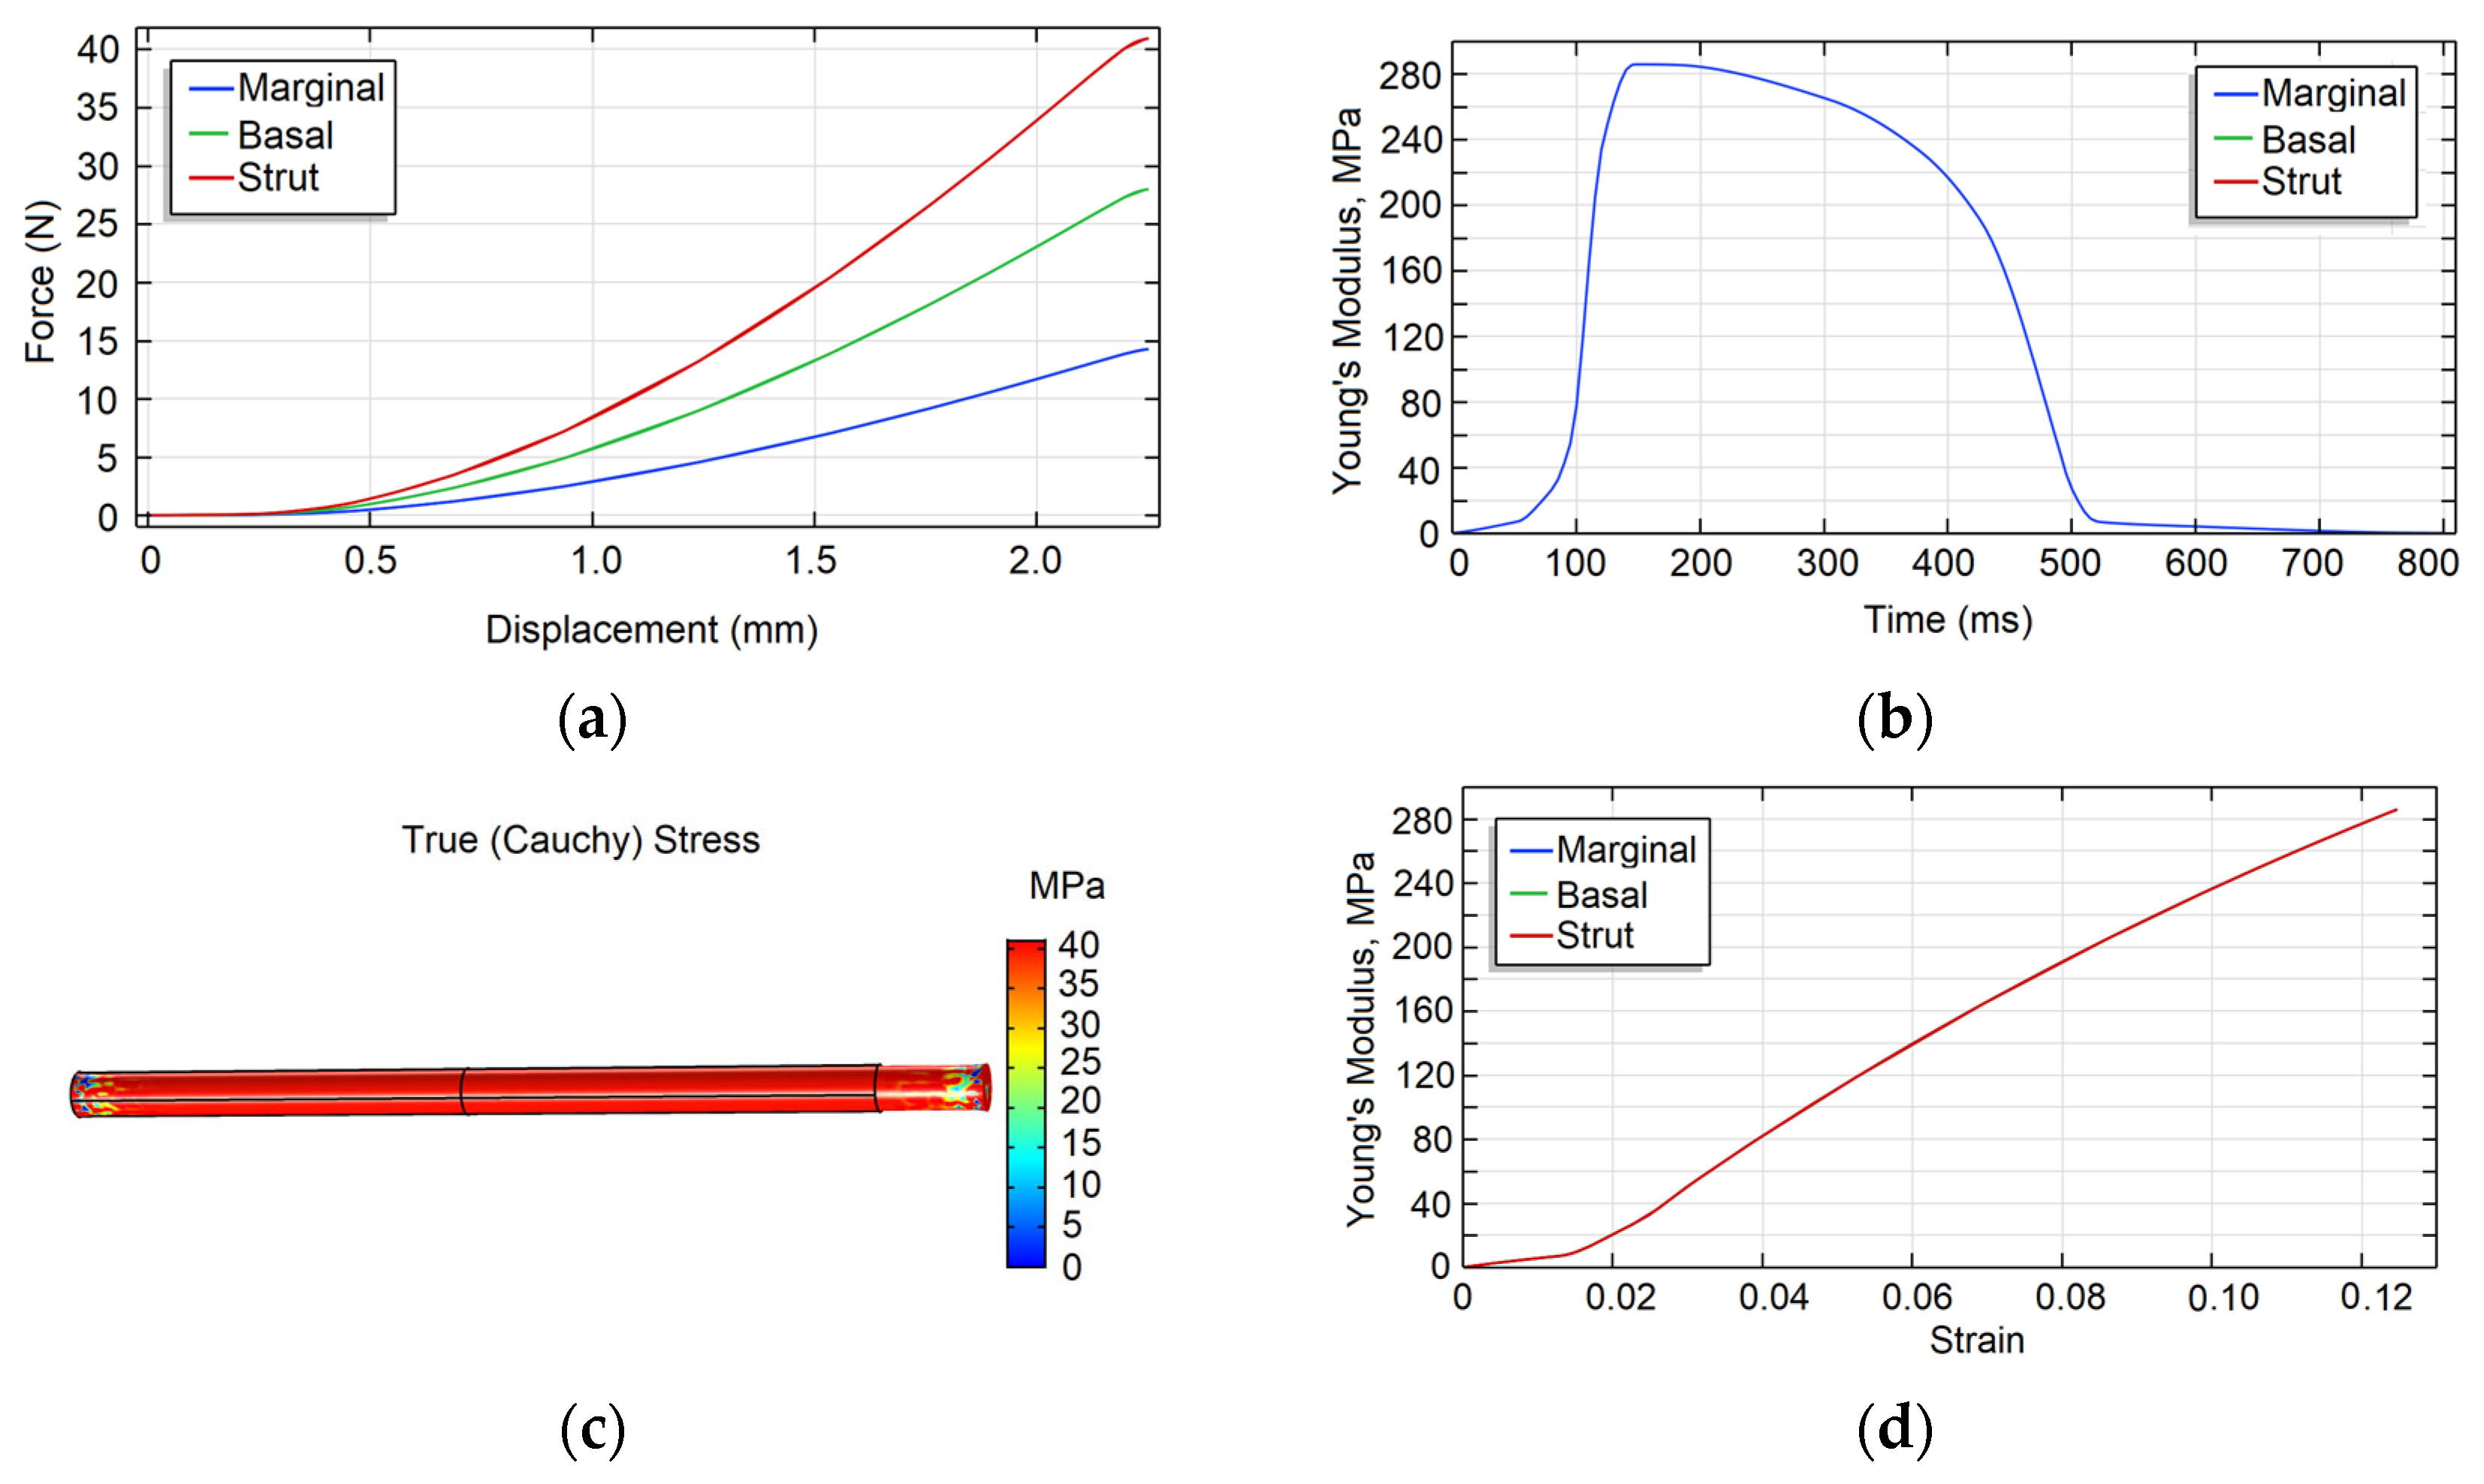
The chordae were modelled as isotropic, homogeneous 3D continua in the form of cylindrical elements. One end of the cylinder was fixed, while the free end was subjected to longitudinal displacement. As presented in Figure 3a, a linear loading profile was applied for simplicity, with a total displacement of 2.25 mm over 148 ms—values derived from a representative human pressure profile [29,30], scaled to peak systolic pressure (as presented in Figure 4a) and converted into corresponding stretch values (Figure 4b).
The FE statistics of the model were taken from COMSOL Multiphysics 6.3: Nodes—1084, quadratic tetrahedral elements—3931, edge elements—260, vertex elements—12. We employed quadratic tetrahedral elements to robustly capture the slender curved geometry with minimal meshing overhead. A nearly incompressible formulation (in this paper the value of Poisson’s ratio ν = 0.499) was used to avoid volumetric locking. A mesh-refinement check (element count × 2) altered the peak force by <2%, indicating adequate resolution for the reported results. The above-mentioned software allows for the description of material properties to investigate the behaviour of hyperelastic biological tissues, using the piecewise cubic fitting function, where the stress–strain curve from [2] is input.

3. Results and Discussion

This section aims to compare the mechanical response of chordae modelled with different material properties against widely used models in the literature. A three-dimensional FE approach is employed, and the results are obtained by solving a representative chordae sample. The FE solutions are compared with the analytical models introduced earlier.
The computational results are presented in terms of axial force versus longitudinal displacement, as shown in Figure 5a. The simulations were performed using COMSOL Multiphysics 6.3, incorporating hyperelastic material behaviour, the previously defined geometry, initial conditions, and boundary constraints. A time-dependent iterative solver with automatic time stepping was used to capture the dynamic response under prescribed loading conditions. All results presented here are convergent.
Figure 5 demonstrates that applying time-dependent systolic pressure to the simple chorda model yields Young’s modulus as a function of time (Figure 5b). It shows the tangent modulus E(t) = / obtained by differentiating the FE-predicted σ(ε); markers indicate values from the analytic E(ε) in Equation (20) evaluated at ε(t). Figure 5d shows Young’s modulus as a function of strain. The three E(ε) curves are identical because the same constitutive law was applied to basal, marginal, and strut chordae. Differences among types are represented through geometry (diameter and length), which affects the force response but not the underlying stress–strain relation. Additionally, Figure 5c presents the Cauchy stress values at 148 ms. The objective at this stage was to determine how the elastic modulus (Young’s modulus) changes with the relationship between chordal tension force and stretch. To achieve this, the stress–strain curve obtained from our model (Figure 5d) was approximated using two polynomial functions. A fifth-degree polynomial was used to describe Young’s modulus at small strains—specifically, for engineering strains below 0.02, which corresponds to the region before the transition point in the following curve:
y = a 5 x 5 + a 4 x 4 + a 3 x 3 + a 2 x 2 + a 1 x + a
while the values of the coefficients a, a1, a2, a3, a4, a5 are presented in Table 1.
The coefficients ai are derived from experimental regression. Thus, E is no longer a fixed constant but a function of strain, superseding the earlier assumption.
A second-degree polynomial was used to model Young’s modulus in the finite strain regime, which begins at engineering strains greater than 0.02—beyond the transition point where the force increases more rapidly:
y = a 2 x 2 + a 1 x + a
There exists a relationship between the axial force and the normal stress. Under centrally applied axial loading, the normal stresses remain uniform across any cross-section of the element. When evaluating transverse deformations, this behaviour is described by the following expression:
F = A σ x d A = σ x A 0 1 + η 2 = σ x A 0 1 + 2 η + η 2 = σ x A 0 + 2 σ x A 0 η + σ x A 0 η 2
where η = ν ε x —transversal strain (along the z and y axis are the same); ε x —longitudinal strain (along the x axis); ν—Poisson’s ratio; A 0 = π d 0 2 4 —the initial cross-sectional area of chordae; Fx or F—chordae stretching force. Stress and strain are interdependent:
σ x = E ε x ε x
where E ε x —the strain-dependent Young’s modulus, capturing material nonlinearity, ε x = u l 0 + 1 2 · u l 0 2 —the Green strain, where u = l l 0 —elongation of chordae.
Substituting into Equation (18), we obtain a nonlinear expression for the force that depends on the function of the elasticity modulus:
F = E ε x A 0 ε x 2 E ε x A 0 ν ε x 2 + ν 2 E ε x A 0 ε x 3
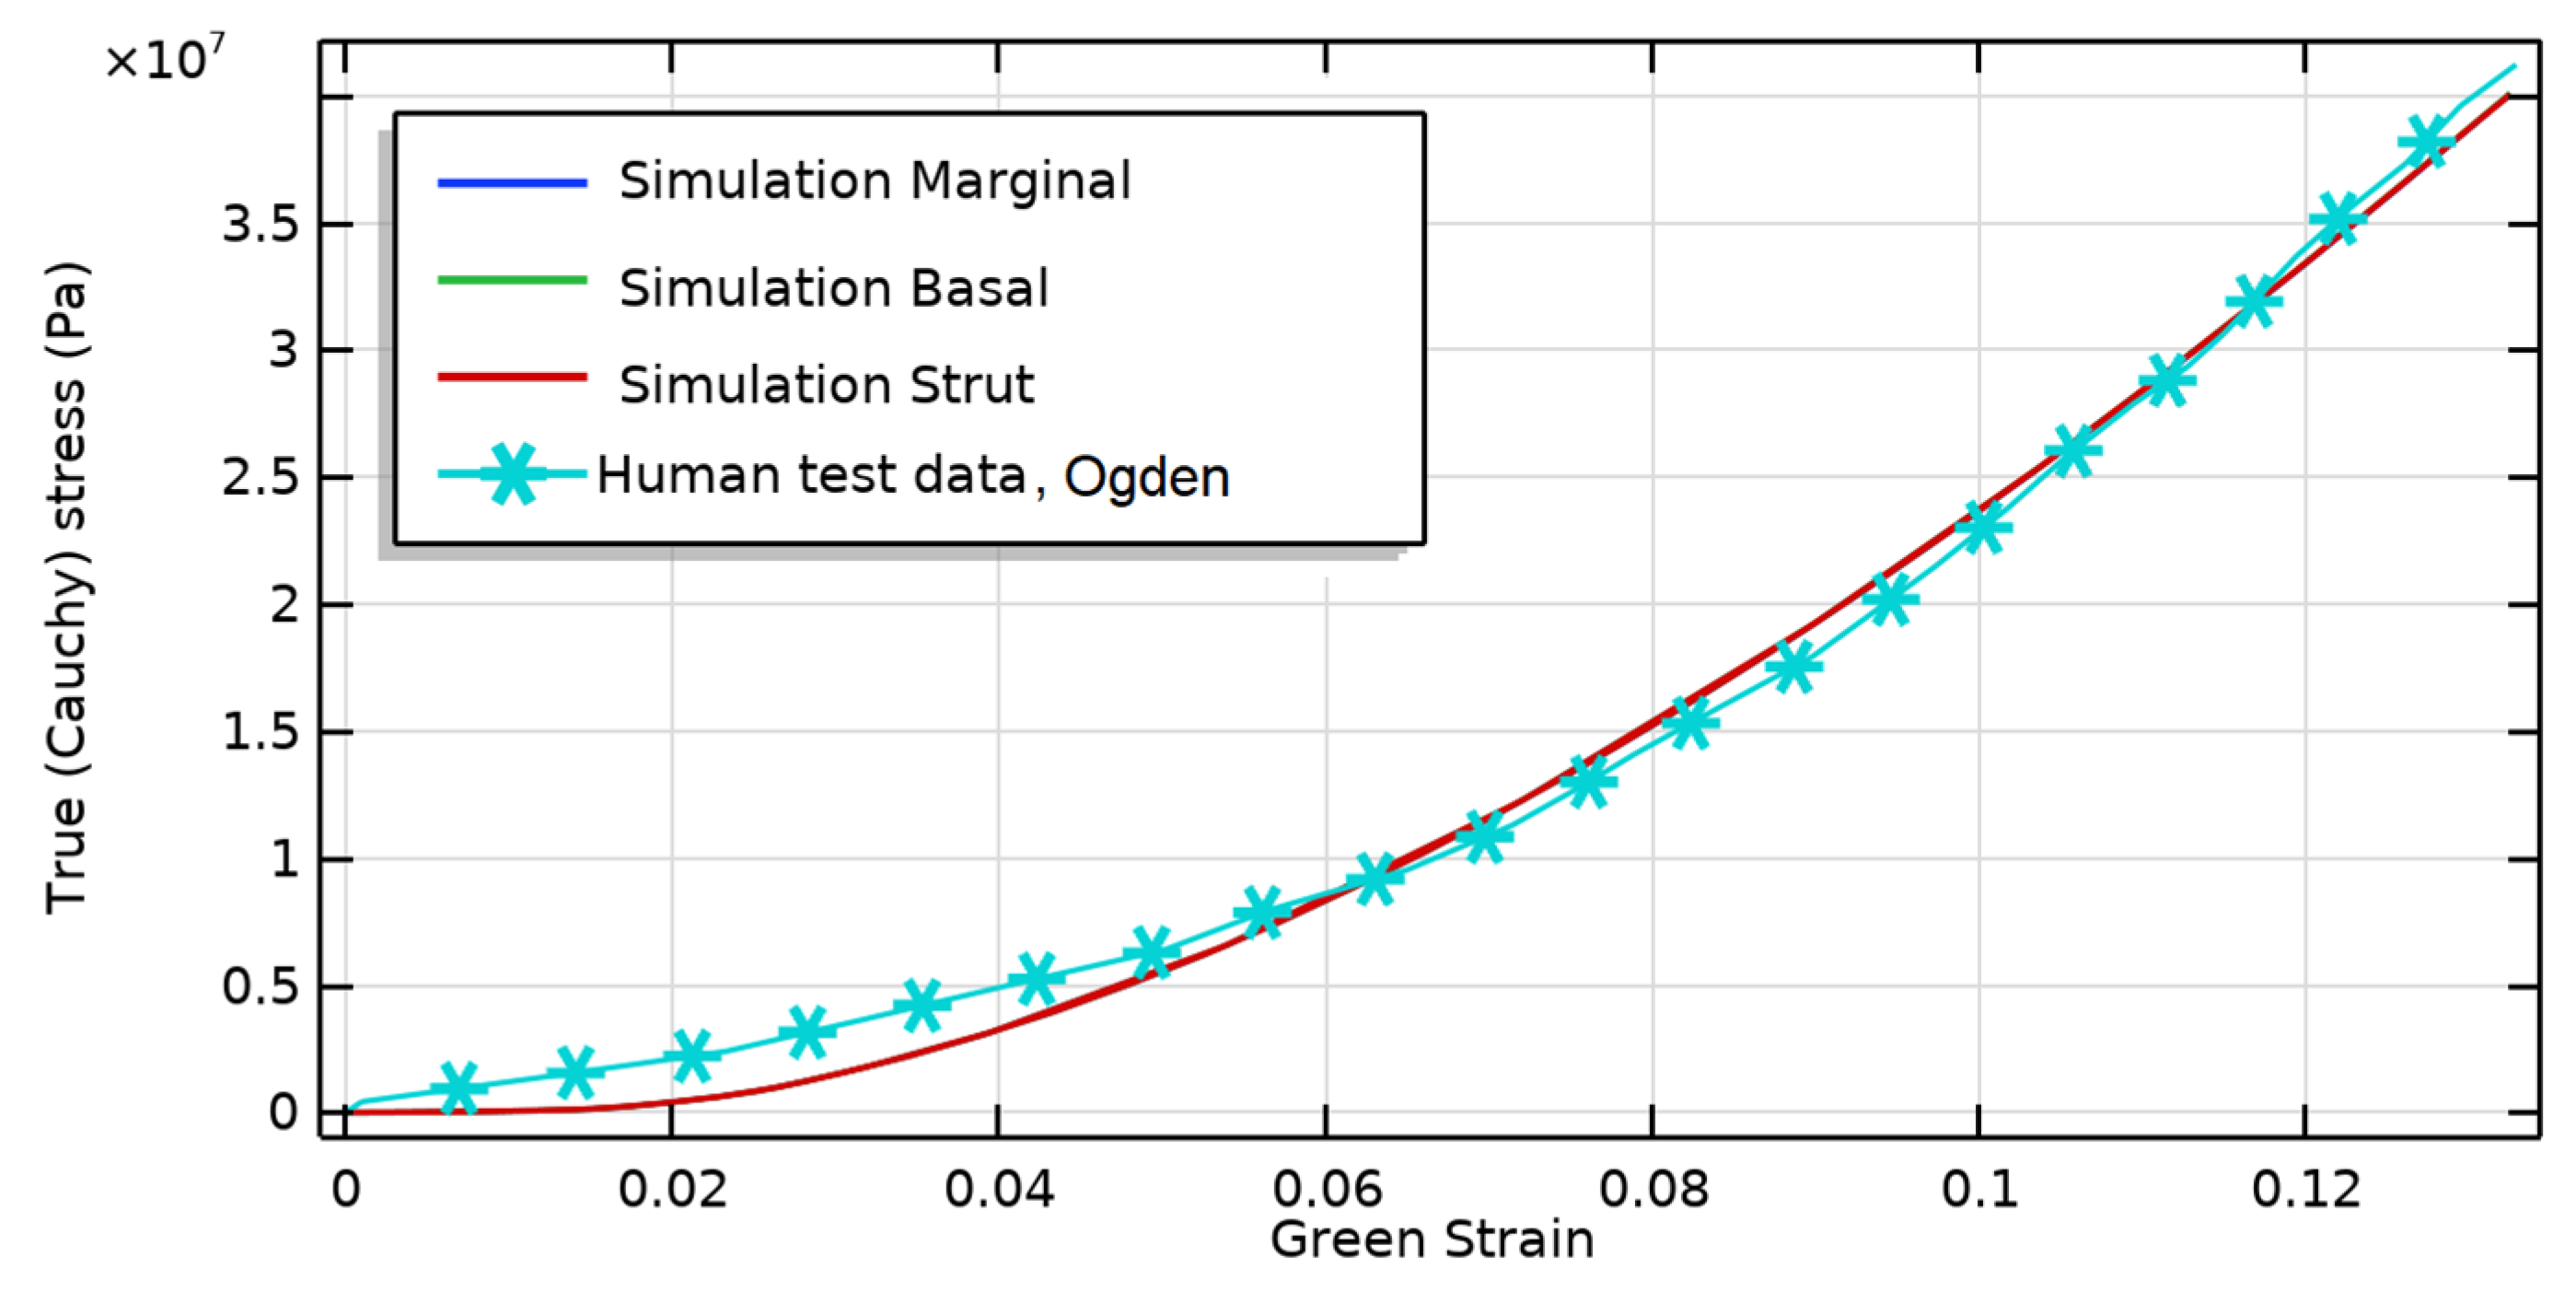
The nonlinear model developed and employed in this study—nonlinear in the sense of incorporating large deformation hyperelastic behaviour—demonstrated strong agreement with experimental observations of chordae tendineae mechanics. Figure 6 presents representative stress–strain curves obtained from uniaxial tensile testing of human chordae. It is evident that the proposed 3D finite element model accurately reproduces the characteristic nonlinear response, including the toe region, linear stiffening phase, and ultimate failure point. This close alignment confirms the model’s capability to capture key biomechanical features under physiological loading conditions.
In Figure 6, the x-axis represents Green strain, calculated using the relation ε = λ 2 1 / 2 , where λ = l / l 0 is the stretch ratio and the y-axis represents Cauchy stress in Pascals calculated using σ = F · l / A 0 · l 0 . The simulation results for marginal, basal, and strut chordae are presented in this format to enable direct comparison with experimental human test data reported in [2], Figure 6a.
Our polynomial-based strain-dependent Young’s modulus provides a flexible, computationally efficient alternative to classical hyperelastic models such as the Ogden [15] formulations. While Ogden models are widely used to describe fibrous soft tissues, they typically require fitting multiple material parameters and often assume isotropy or specific fibre orientations. By contrast, our regression-based approach directly incorporates experimentally measured stress–strain data into the constitutive relation. The strong agreement with experimental curves (Figure 6) indicates that this simpler formulation can reproduce nonlinear stiffening without requiring complex parameter identification. In addition, the experimental curve taken from [2] was compared with the Ogden model, from which we can conclude that our proposed formulation demonstrates a high level of correspondence with the Ogden model.
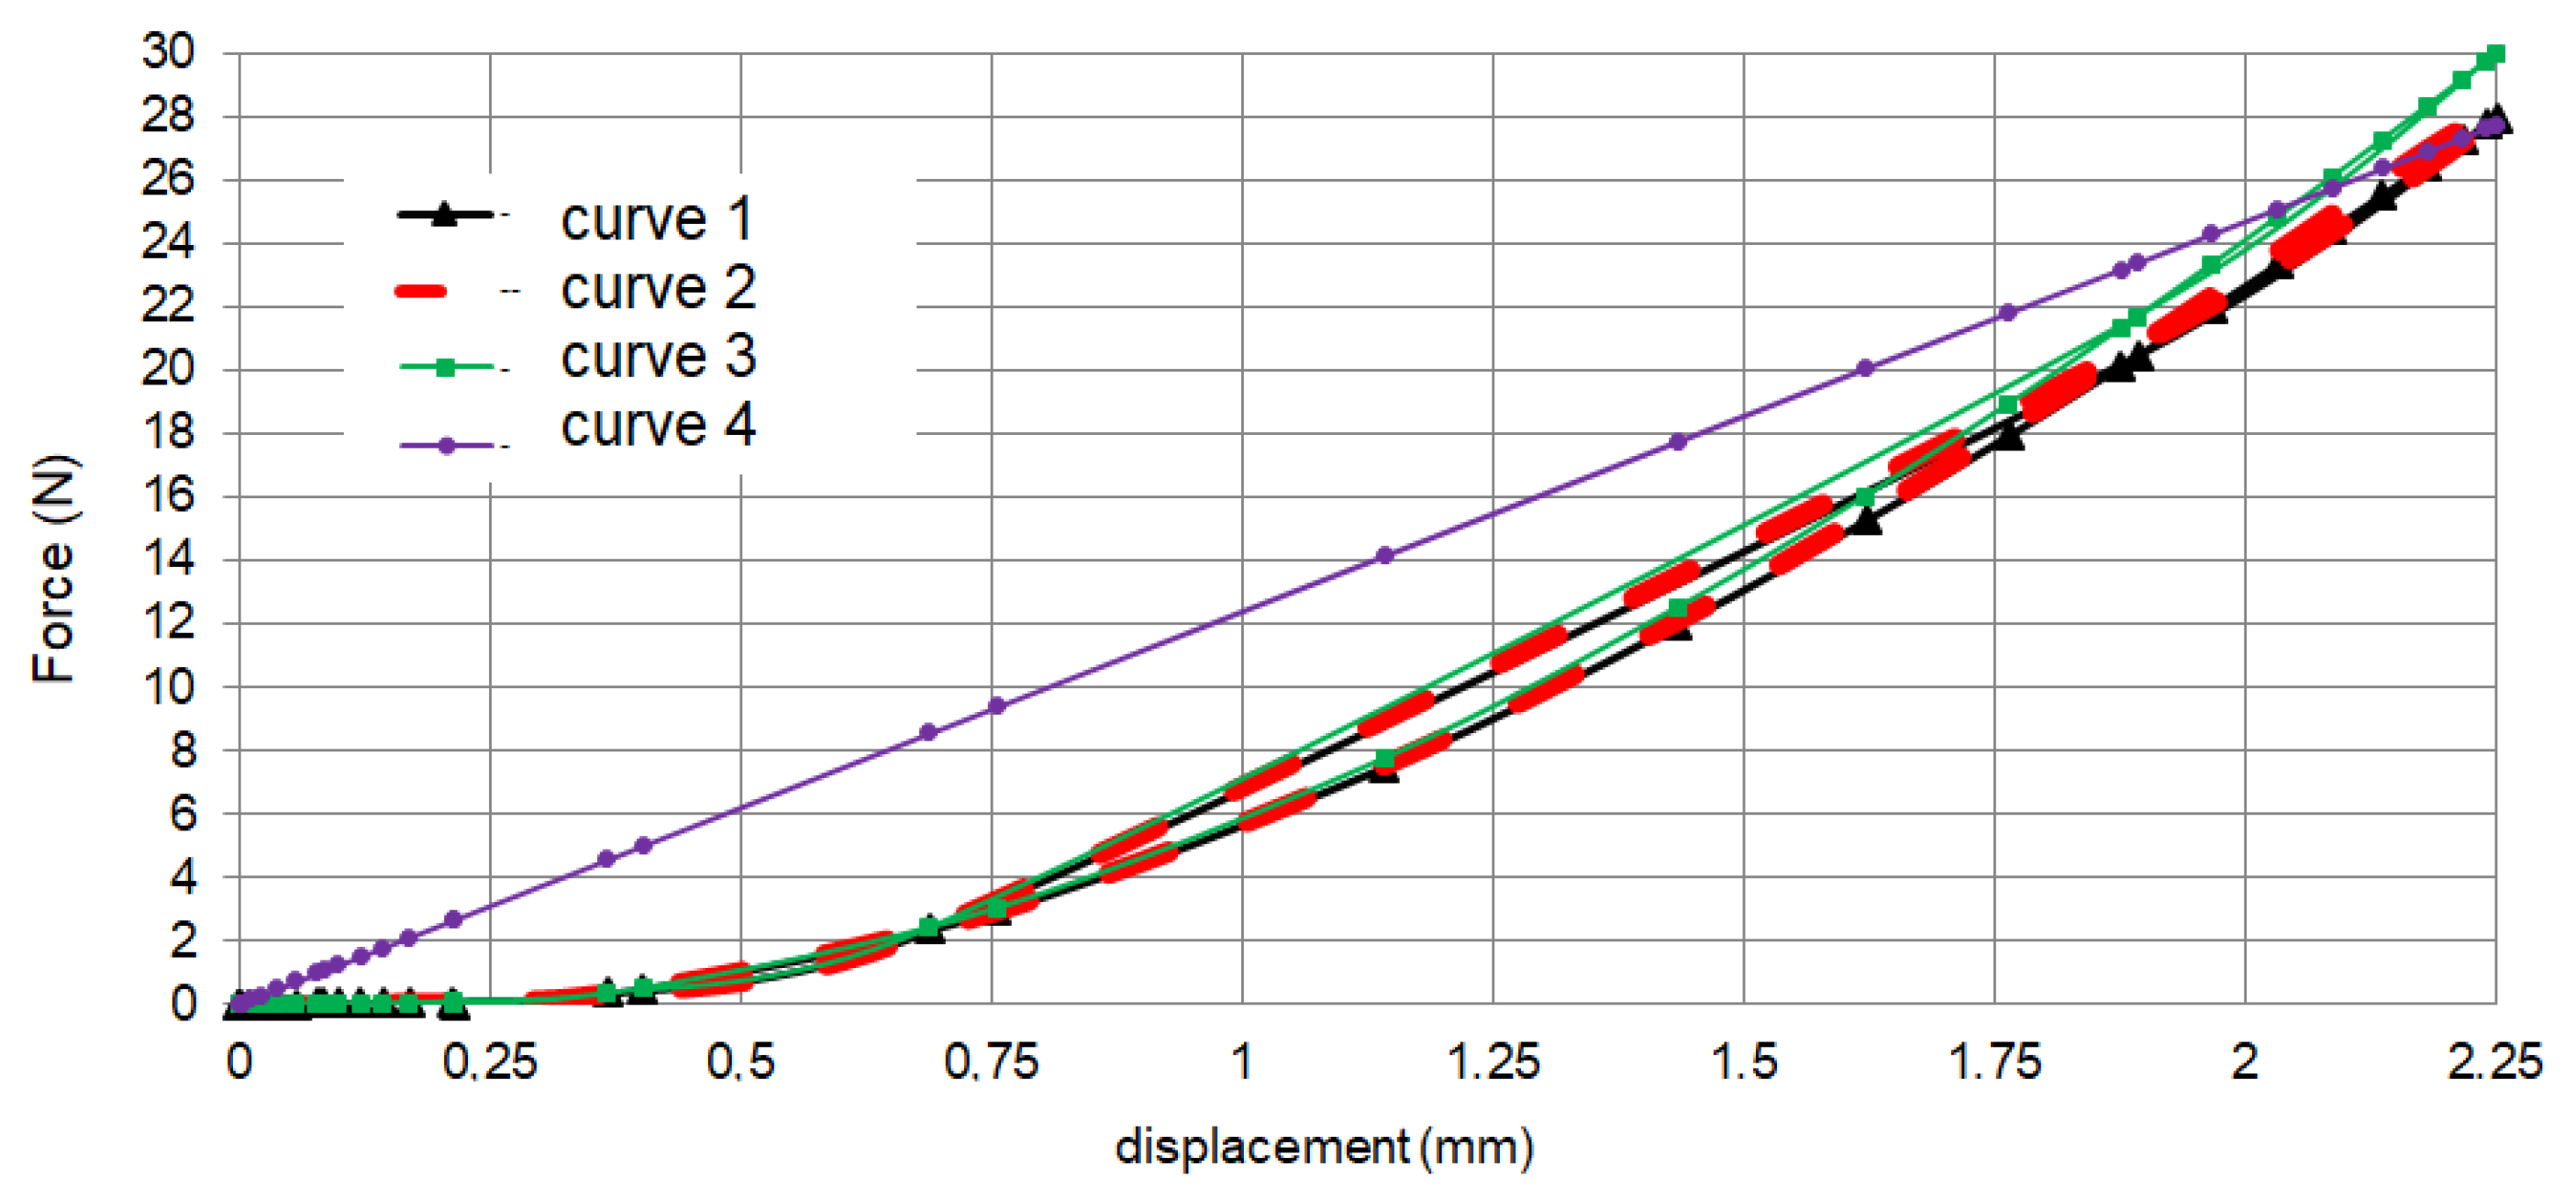
Then, to analyze the effect of various factors on the change in the force–stretch curve. The results shown in Figure 6 were obtained using Equation (19), with an initial chordae diameter of 1.0 mm and a maximum chorda stretch of 12.5% of the initial length. Black and green curves were obtained with the function of Young’s modulus depending on the strain (according to Equations (15) and (16)) with coefficients from Table 1.
E ε x = 30 10 6 ε x 5 + 10 10 6 ε x 4 2 10 6 ε x 3 + 121,676 ε x 2 690.91 ε x + 1.69656 0 ε x 0.02 7521.8 ε x 2 + 3640.3 ε x 50.137 ε x > 0.02
The transition point at εx = 0.02 corresponds to the end of the toe region of the stress–strain curve [2], where collagen fibres within the chordae tendineae transition from a crimped configuration to a fully aligned state. Below this threshold, tissue stiffness increases rapidly in a nonlinear fashion, which we captured using a fifth-degree polynomial fit. Beyond this strain, the majority of fibres are aligned, and the material response enters a stiffer but smoother regime, which can be accurately described using a quadratic polynomial. Physiologically, this transition reflects the onset of significant chordae load-bearing during systole.
The purple curve in Figure 7 represents results using a constant Young’s modulus of E = 285 MPa, taken as the peak from the strain-dependent profile in Figure 5b. While the maximum force at peak strain aligns with the numerical result, the shape of the force–displacement curve deviates significantly from the FE model (red dashed curve), indicating poor representation of the material’s nonlinear behaviour. The green curve was computed without accounting for transverse strain (i.e., assuming constant cross-sectional area). This leads to a similar trend as the FE results but overestimates the peak force by approximately 7%. In contrast, the black curve incorporates both material nonlinearity, a strain-dependent Young’s modulus as in Equation (20), and geometric nonlinearity, through the stretch-induced variation in cross-sectional area. This confirms that accounting for both material and geometric nonlinearity is essential for accurate modelling. Figure 7 clearly illustrates that assuming constant stiffness suppresses the influence of Poisson’s effect and fails to capture the true biomechanical response under physiological loading. Figure 7 highlights the necessity of considering both strain-dependent elasticity and Poisson effects.
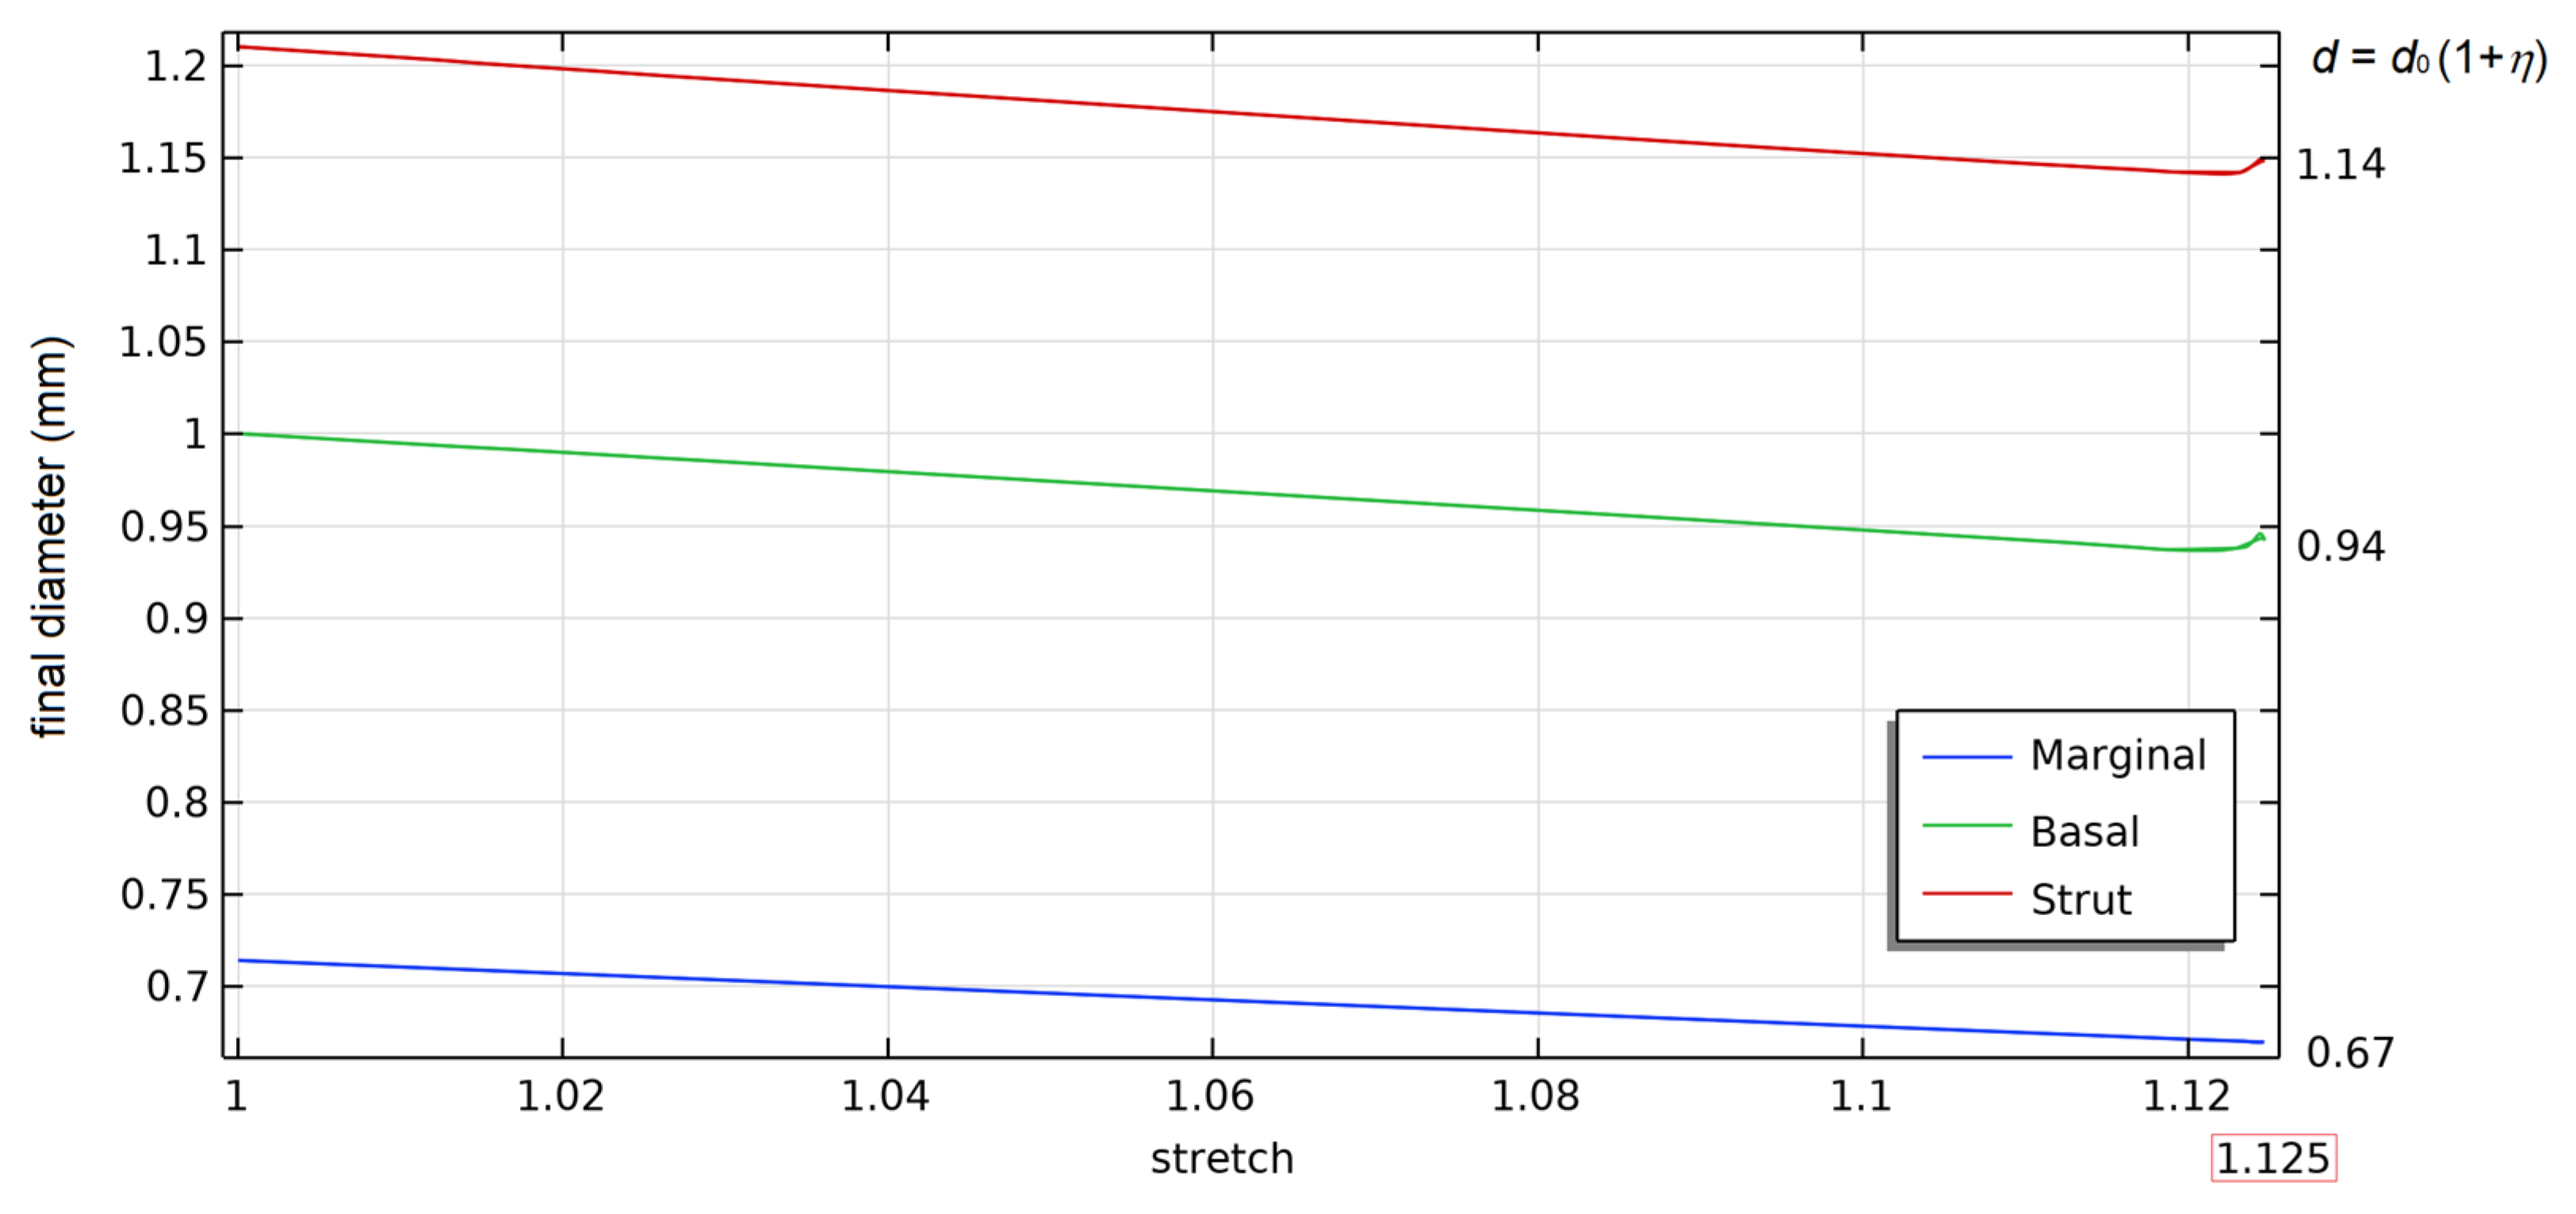
The nonlinear model of the chordae tendineae developed in this study enables the accurate determination of transverse deformation during axial stretching. For chordae of varying stiffness—representing marginal, basal, and strut types—a consistent trend in diameter reduction was observed as a function of the stretch ratio (see Figure 8).
These chordae, with respective initial diameters of 0.714 mm, 1.0 mm, and 1.21 mm, exhibited a gradual decrease in cross-sectional dimension under elongation. The diameter change was evaluated at the mid-length cross-section of each chorda, where the effect of boundary conditions is minimal. Our simulations revealed that, regardless of initial diameter, the percent reduction in diameter reached approximately 6.6% at maximum physiological stretch. To quantify the change in cross-sectional area, we computed the relative area reduction using the expression ψ = A 0 A / A 0 · 100 % . Remarkably, the computed values of ψ were found to be independent of the initial chordal diameter, yielding a consistent cross-sectional area reduction of 12% at mid-length across all chordae types. This result highlights the geometric uniformity of transverse deformation under uniaxial loading and underscores the importance of incorporating Poisson-type effects in modelling fibrous biological tissues.
Diameter reduction arises from the Poisson effect included in the full model and FE analysis (the 1D derivation in Section 2.2.1 assumes constant area only for analytical tractability). At λ = 1.125, all curves converge to ~93.4% of the initial diameter (Figure 8). Since cross-sectional area scales with the square of diameter (Ad2) and the tissue is nearly incompressible (ν ≈ 0.499), this corresponds to reduction in area ψ ≈ 12%.

4. Conclusions

The accurate biomechanical modelling of mitral valve chordae tendineae is essential for understanding their functional role in valvular competence and for developing reliable computational tools for surgical planning and pathology assessment. In this study, we have introduced a one-dimensional finite element formulation that incorporates both geometric and material nonlinearities, enabling a more physiologically accurate representation of chordal mechanics compared to traditional linear or phenomenological models.
Our approach builds upon classical continuum mechanics principles, employing the Green–Lagrange strain tensor to account for large deformations and defining the true (Cauchy) stress as a function of longitudinal strain via experimentally derived data. The resulting strain-dependent constitutive relation was implemented into a 1D nonlinear model, which was validated against three-dimensional finite element simulations performed in COMSOL Multiphysics 6.3. This comparison confirmed the fidelity of our simplified formulation in capturing key mechanical behaviours, including the characteristic toe–linear–failure response of chordae tendineae under uniaxial loading. The assessment of the transverse strain allowed us to quantify the percentage influence of the stretch ratio λ and the initial diameter of the chordae on the percent reduction in cross-section area, which is 12%. Without considering the influence of transverse strain, the load-bearing capacity of the chordae increases to 7%.
Beyond advancing our understanding of chordae mechanics, the reduced-order nonlinear model developed here is well suited for integration into patient-specific mitral valve simulations. As next steps, we will incorporate subject-specific chordae and papillary muscle geometry, together with clinically derived loading conditions, to improve predictive accuracy and enable application of the framework to individual patients.

Author Contributions

Conceptualization, S.B. and O.C.; methodology, S.B.; software, O.C. and J.S.; formal analysis, A.M.H., O.C., J.S. and E.S.; investigation, A.M.H., O.C., J.S. and E.S.; resources, S.B.; writing—original draft preparation, A.M.H., O.C., J.S. and E.S.; writing—review and editing, A.M.H., O.C., J.S. and E.S.; visualization, A.M.H., O.C., J.S. and E.S.; supervision, S.B.; funding acquisition, S.B. All authors have read and agreed to the published version of the manuscript.

Funding

This research received no external funding.

Data Availability Statement

The original contributions presented in the study are included in the article, further inquiries can be directed to the corresponding author.

Acknowledgments

All authors would like to thank Rimantas Kačianauskas for the original idea and consultations.

Conflicts of Interest

The authors declare no conflicts of interest.

Abbreviations

The following abbreviations are used in this manuscript:
MVMitral Valve
CTChordae Tendineae
FSIFluid–Structure Interaction
FEMFinite Element Methods
CFDComputational Fluid Dynamics
MAMitral Annulus

References

  1. Leo, L.A.; Paiocchi, V.L.; Schlossbauer, S.A.; Gherbesi, E.; Faletra, F.F. Anatomy of Mitral Valve Complex as Revealed by Non-Invasive Imaging: Pathological, Surgical and Interventional Implications. J. Cardiovasc. Dev. Dis. 2020, 7, 49. [Google Scholar] [CrossRef]
  2. Zuo, K.; Pham, T.; Li, K.; Martin, C.; He, Z.; Sun, W. Characterization of Biomechanical Properties of Aged Human and Ovine Mitral Valve Chordae Tendineae. J. Mech. Behav. Biomed. Mater. 2016, 62, 607–618. [Google Scholar] [CrossRef]
  3. Koivumäki, J.T.; Hoffman, J.; Maleckar, M.M.; Einevoll, G.T.; Sundnes, J. Computational Cardiac Physiology for New Modelers: Origins, Foundations, and Future. Acta Physiol. 2022, 236, e13865. [Google Scholar] [CrossRef] [PubMed]
  4. Wong, P.; Wisneski, A.D.; Sandhu, A.; Wang, Z.; Mahadevan, V.S.; Nguyen, T.C.; Guccione, J.M. Looking towards the Future: Patient-Specific Computational Modeling to Optimize Outcomes for Transcatheter Mitral Valve Repair. Front. Cardiovasc. Med. 2023, 10, 1140379. [Google Scholar] [CrossRef]
  5. Le, T.B.; Usta, M.; Aidun, C.; Yoganathan, A.; Sotiropoulos, F. Computational Methods for Fluid-Structure Interaction Simulation of Heart Valves in Patient-Specific Left Heart Anatomies. Fluids 2022, 7, 94. [Google Scholar] [CrossRef]
  6. Toma, M.; Einstein, D.R.; Bloodworth, C.H.; Cochran, R.P.; Yoganathan, A.P.; Kunzelman, K.S. Fluid-Structure Interaction and Structural Analyses Using a Comprehensive Mitral Valve Model with 3D Chordal Structure. Int. J. Numer. Methods Biomed. Eng. 2016, 33, e2815. [Google Scholar] [CrossRef]
  7. Abbas, S.S.; Nasif, M.S.; Al-Waked, R. State-of-the-Art Numerical Fluid–Structure Interaction Methods for Aortic and Mitral Heart Valves Simulations. Simulation 2022, 98, 3–34. [Google Scholar] [CrossRef]
  8. Gao, H.; Ma, X.; Qi, N.; Berry, C.; Griffith, B.E.; Luo, X. A Finite Strain Nonlinear Human Mitral Valve Model with Fluid-Structure Interaction. Int. J. Numer. Methods Biomed. Eng. 2014, 30, 1597–1613. [Google Scholar] [CrossRef]
  9. Kunzelman, K.; Cochran, R.; Chuong, C.; Ring, W.; Verrier, E.; Eberhart, R. Finite Element Analysis of the Mitral Valve. J. Heart Valve Dis. 1993, 3, 326–340. [Google Scholar]
  10. Ambrosi, D.; Deorsola, L.; Turzi, S.; Zoppello, M. Elementary mechanics of the mitral valve. SIAM J. Appl. Math. 2022, 82, 75–94. [Google Scholar] [CrossRef]
  11. Liao, J.; Vesely, I. A Structural Basis for the Size-Related Mechanical Properties of Mitral Valve Chordae Tendineae. J. Biomech. 2003, 36, 1125–1133. [Google Scholar] [CrossRef] [PubMed]
  12. Mangine, N.R.; Laurence, D.W.; Sabin, P.M.; Wu, W.; Herz, C.; Zelonis, C.N.; Unger, J.S.; Pinter, C.; Lasso, A.; Maas, S.A.; et al. Effect of Parametric Variation of Chordae Tendineae Structure on Simulated Atrioventricular Valve Closure. arXiv 2024, arXiv:2411.09599. [Google Scholar] [CrossRef]
  13. Crispino, A.; Bennati, L.; Vergara, C. Cardiac Hemodynamics Computational Modeling Including Chordae Tendineae, Papillaries, and Valves Dynamics. bioRxiv 2024. [Google Scholar] [CrossRef]
  14. Ross, C.J.; Zheng, J.; Ma, L.; Wu, Y.; Lee, C.H. Mechanics and Microstructure of the Atrioventricular Heart Valve Chordae Tendineae: A Review. Bioengineering 2020, 7, 25. [Google Scholar] [CrossRef]
  15. Ogden, R. Large Deformation Isotropic Elasticity—On the Correlation of Theory and Experiment for Incompressible Rubberlike Solids. Proc. R. Soc. Lond. A Math. Phys. Sci. 1972, 326, 565–584. [Google Scholar] [CrossRef]
  16. Votta, E.; Arnoldi, A.; Invernizzi, A.; Ponzini, R.; Veronesi, F.; Tamborini, G.; Pepi, M.; Alamanni, F.; Redaelli, A.; Caiani, E.G. Mitral Valve Patient-Specific Finite Element Modeling from 3-D Real Time Echocardiography: A Potential New Tool for Surgical Planning. In Proceedings of the CI2BM09—MICCAI Workshop on Cardiovascular Interventional 370 Imaging and Biophysical Modelling, London, UK, 20 September 2009; 9p. [Google Scholar] [CrossRef]
  17. Lim, K.O.; Boughner, D.R. Mechanical Properties of Human Mitral Valve Chordae Tendineae: Variation with Size and Strain Rate. Can. J. Physiol. Pharmacol. 2011, 53, 330–339. [Google Scholar] [CrossRef]
  18. Liu, L.W.; Lee, C.H.; Aggarwal, A.; Chao, C.M.; Ross, C.J.; Liao, Y.K. Viscoelastic Modelling of the Tricuspid Valve Chordae Tendineae Tissue. Appl. Math. Model. 2022, 105, 648–669. [Google Scholar] [CrossRef] [PubMed]
  19. Gun, M.; Barry, M.; Tribouilloy, C.; Bohbot, Y.; Touati, G. Anatomical Mitral Valve Repair: Mathematical Prediction of Artificial Chordae Length in Para-Commissural Regions. Curr. Probl. Cardiol. 2024, 49, 102063. [Google Scholar] [CrossRef] [PubMed]
  20. Zuo, K. Characterization of Biomechanical Properties of Mitral Valve Chordae Tendineae. Ph.D. Thesis, University of Connecticut, Storrs, CT, USA, 2014. [Google Scholar]
  21. Bonet, J.; Wood, R.D. Nonlinear Continuum Mechanics for Finite Element Analysis; Cambridge University Press: Cambridge, UK, 1997; ISBN 0-521-57272-X. [Google Scholar]
  22. Gaidulis, G.; Suresh, K.S.; Xu, D.; Padala, M. Patient-Specific Three-Dimensional Ultrasound Derived Computational Modeling of the Mitral Valve. Ann. Biomed. Eng. 2022, 50, 847–859. [Google Scholar] [CrossRef] [PubMed]
  23. Chen, S.; Sari, C.R.; Gao, H.; Lei, Y.; Segers, P.; De Beule, M.; Wang, G.; Ma, X. Mechanical and Morphometric Study of Mitral Valve Chordae Tendineae and Related Papillary Muscle. J. Mech. Behav. Biomed. Mater. 2020, 111, 104011. [Google Scholar] [CrossRef]
  24. Fatemifar, F.; Feldman, M.D.; Oglesby, M.; Han, H.C. Comparison of Biomechanical Properties and Microstructure of Trabeculae Carneae, Papillary Muscles, and Myocardium in the Human Heart. J. Biomech. Eng. 2019, 141, 0210071. [Google Scholar] [CrossRef]
  25. Stevanella, M.; Maffessanti, F.; Conti, C.A.; Votta, E.; Arnoldi, A.; Lombardi, M.; Parodi, O.; Caiani, E.G.; Redaelli, A. Mitral Valve Patient-Specific Finite Element Modeling from Cardiac MRI: Application to an Annuloplasty Procedure. Cardiovasc. Eng. Technol. 2011, 2, 66–76. [Google Scholar] [CrossRef]
  26. Lam, J.H.; Ranganathan, N.; Wigle, E.D.; Silver, M.D. Morphology of the Human Mitral Valve. Circulation 1970, 41, 449–458. [Google Scholar] [CrossRef]
  27. Kunzelmann, K.; Cochran, R. Mechanical Properties of Basal and Marginal Mitral Valve Chordae Tendineae. ASAIO Trans. 1990, 3, M405–M408. [Google Scholar]
  28. Constable, M.; Northeast, R.; Lawless, B.M.; Burton, H.E.; Gramigna, V.; Goh, K.L.; Buchan, K.G.; Espino, D.M. Mechanical Testing of Glutaraldehyde Cross-Linked Mitral Valves. Part Two: Elastic and Viscoelastic Properties of Chordae Tendineae. Proc. Inst. Mech. Eng. H 2021, 235, 291–299. [Google Scholar] [CrossRef] [PubMed]
  29. Ott, R.; Öner, A.; Bellé, P.H.; Borowski, F.; Schmitz, K.P.; Stiehm, M. Validation of a Fluid-Structure Interaction Model for the Characterization of Transcatheter Mitral Valve Repair Devices. Curr. Dir. Biomed. Eng. 2021, 7, 605–608. [Google Scholar] [CrossRef]
  30. Paulsen, M.J.; Imbrie-Moore, A.M.; Wang, H.; Bae, J.H.; Hironaka, C.E.; Farry, J.M.; Lucian, H.J.; Thakore, A.D.; MacArthur, J.W.; Cutkosky, M.R.; et al. Mitral Chordae Tendineae Force Profile Characterization Using a Posterior Ventricular Anchoring Neochordal Repair Model for Mitral Regurgitation in a Three-Dimensional-Printed Ex Vivo Left Heart Simulator. Eur. J. Cardio-Thorac. Surg. 2020, 57, 535–544. [Google Scholar] [CrossRef] [PubMed]
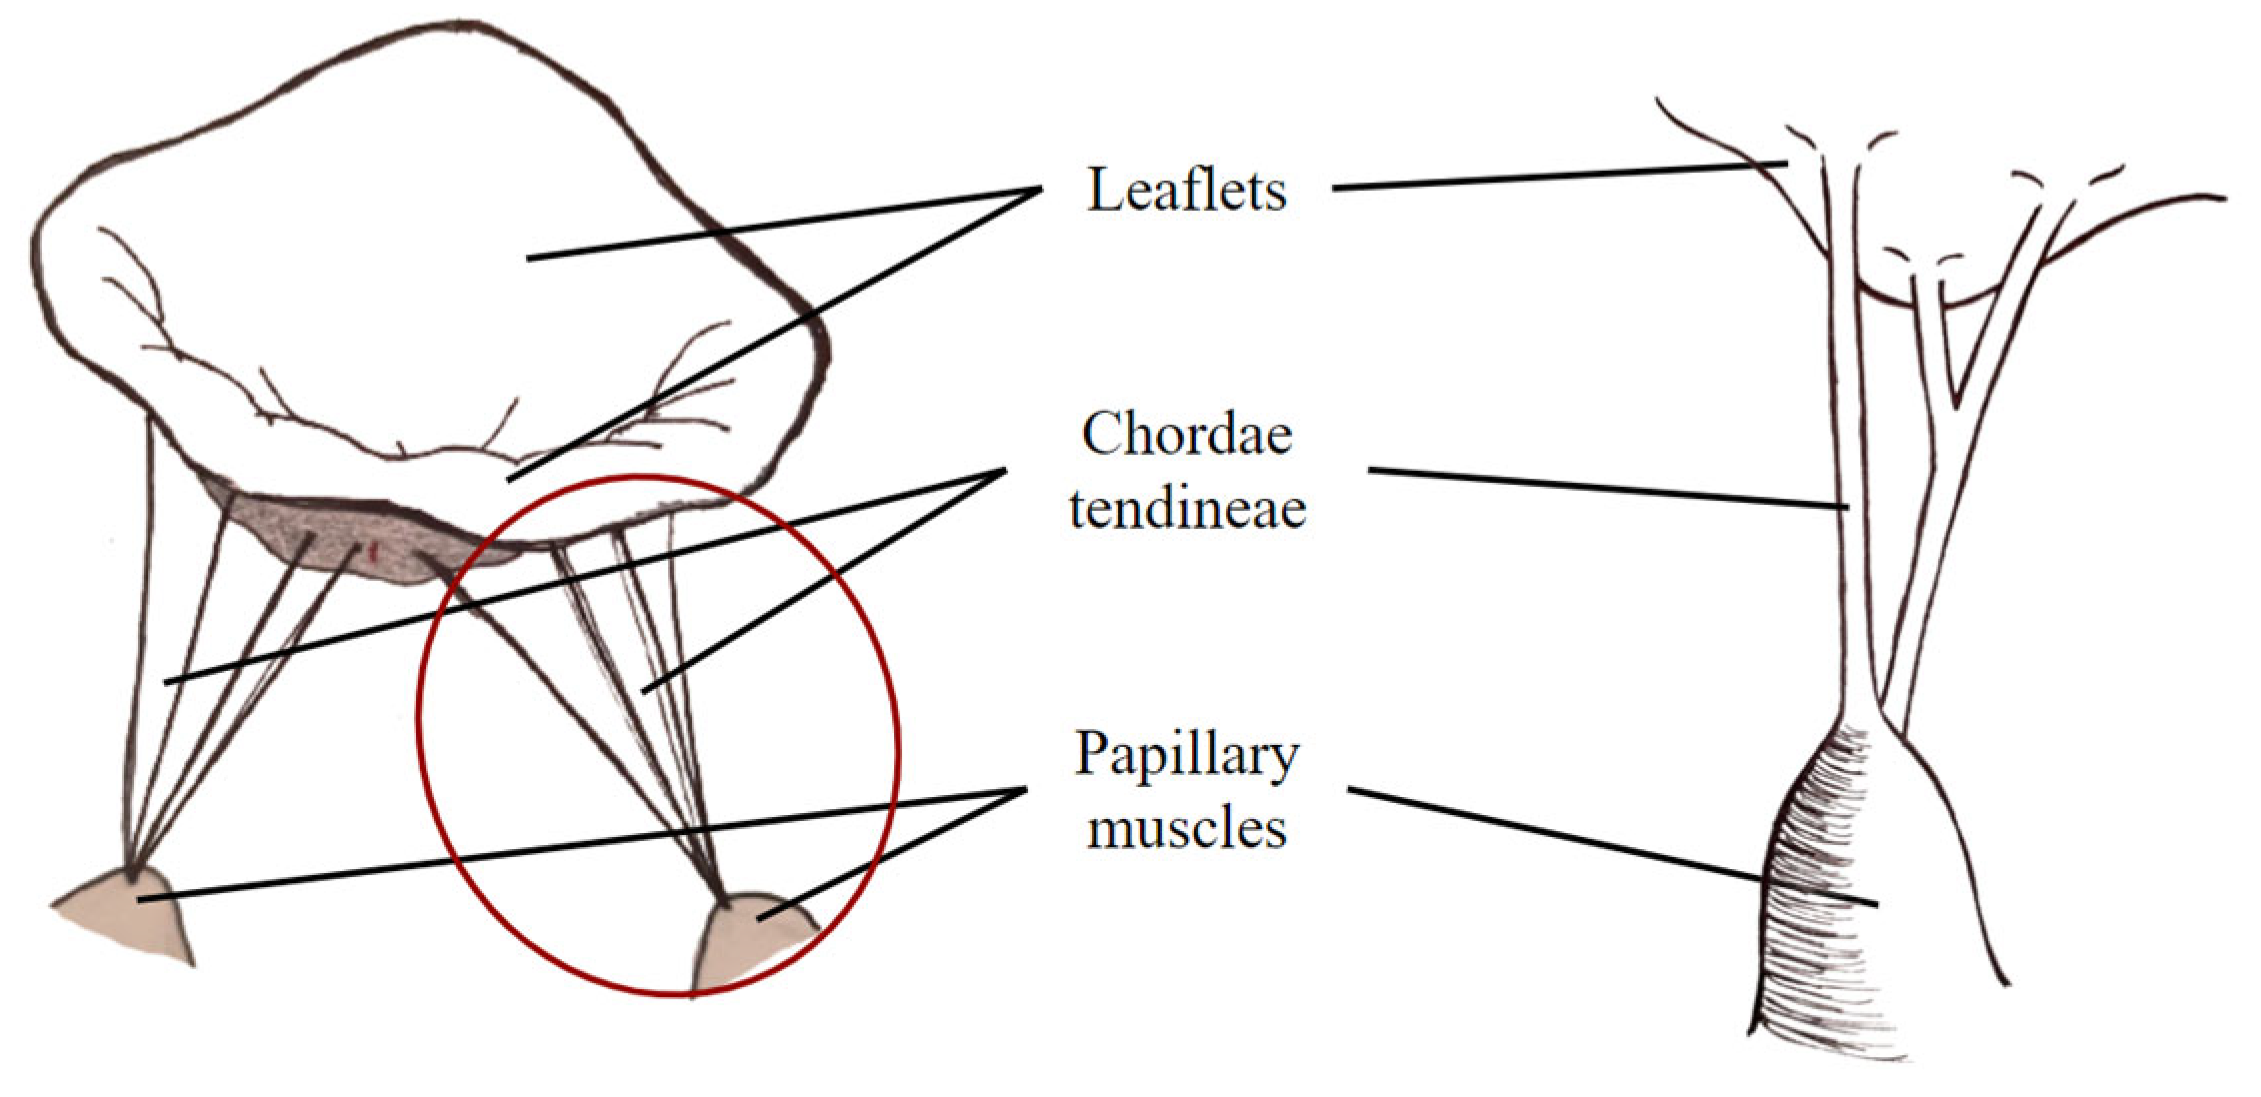
Figure 1. Schematic illustration of the mitral valve (MV), with a detail of the chordae tendineae (CT).
Mathematics 13 03331 g001
Figure 2. Example of a typical stress–strain curve for chordae tendineae and the properties that can be extracted from it.
Mathematics 13 03331 g002
Figure 3. Models of chordae: (a) geometrical, (b) representative FE mesh (Nodes—1084, Tetrahedral Elements—3931).
Mathematics 13 03331 g003
Figure 4. (a) Typical loading profile obtained from pressure profile scaled to the peak systolic pressure; (b) kinematic boundary condition applied to the free end of the chorda—prescribed tip displacement (mm) as a function of time (ms)—obtained by mapping the pressure profile to an equivalent stretch-based loading.
Mathematics 13 03331 g004
Figure 5. Results obtained during chordae (marginal, basal, strut) tensile deformation: (a) force–displacement response curve, comparing analytical and FEM models; (b) evolution of Young’s modulus with time under physiological loading; (c) spatial distribution of Cauchy stress at peak systolic time (148 ms); (d) variation in Young’s modulus as a function of strain, showing nonlinear stiffening. Together, these plots illustrate both material and geometric nonlinearities in the chordae response.
Mathematics 13 03331 g005
Figure 6. Representative Cauchy stress–Green’s strain response curves with our model fits of experimental data [2] under uniaxial stretch.
Mathematics 13 03331 g006
Figure 7. Comparison of different modelling assumptions on the force–strain response for the basal chorda: curve 1 includes strain-dependent modulus and transverse strain (full nonlinear model); curve 2 is the FEM reference result; curve 3 includes strain-dependent modulus but ignores transverse strain; curve 4 assumes a constant modulus with transverse strain.
Mathematics 13 03331 g007
Figure 8. Variation in final diameter versus stretch for three types of chordae: marginal (d0 = 0.714 mm, d = 0.67 mm), basal (d0 = 1.00 mm, d = 0.94 mm), and strut (d0 = 1.21 mm, d = 1.14 mm).
Mathematics 13 03331 g008
Table 1. Values of the coefficients of the polynomial function for describing Young’s modulus prior and after the transitional point (TP).
a5a4a3a2a1a
Prior to
the TP
−30 × 10610 × 106−2 × 106121,676−690.911.69565
After to
the TP
−7521.83640.3−50.137
Disclaimer/Publisher’s Note: The statements, opinions and data contained in all publications are solely those of the individual author(s) and contributor(s) and not of MDPI and/or the editor(s). MDPI and/or the editor(s) disclaim responsibility for any injury to people or property resulting from any ideas, methods, instructions or products referred to in the content.