Abstract
With the increasing emphasis on energy-efficient computing, edge devices accelerated by graphics processing units (GPUs) are gaining attention for their potential in scientific workloads. These platforms support compute-intensive simulations under strict energy and resource constraints, yet their computational efficiency across architectures remains an open question. This study evaluates the performance of GPU-based edge platforms for executing the stochastic simulation algorithm (SSA), a widely used and inherently compute-intensive method for modeling biochemical and physical systems. Execution time, floating point throughput, and the trade-offs between cost and power consumption are analyzed, with a focus on how variations in core count, clock speed, and architectural features impact SSA scalability. Experimental results show that the Jetson Orin NX consistently outperforms Xavier NX and Orin Nano in both speed and efficiency, reaching up to 4.86 million iterations per second while operating under a 20 W power envelope. At the largest workload scale, it achieves 2102.7 ms/W in energy efficiency and 105.3 ms/USD in cost-performance—substantially better than the other Jetson devices. These findings highlight the architectural considerations necessary for selecting edge GPUs for scientific computing and offer practical guidance for deploying compute-intensive workloads beyond artificial intelligence (AI) applications.
Keywords:
edge computing; parallel systems; high-performance computing; graphics processing unit; accelerators; performance benchmarks MSC:
68N01
1. Introduction
The advancement of edge computing has expanded the capabilities of edge devices, allowing them to handle computational tasks that were previously limited to high-performance computing (HPC) systems [1,2]. Among these, scientific computing is one of the emerging applications, particularly with the increasing availability of GPU accelerators in edge platforms [3]. GPU-accelerated edge devices offer substantial computing power while maintaining energy efficiency, making them suitable for real-time and data-intensive applications, including artificial intelligence, machine learning, and scientific simulations [4].
While GPU acceleration has been widely adopted in AI and deep learning applications, its role in scientific computing at the edge remains underexplored. Many scientific workloads, such as Monte Carlo simulations, molecular dynamics, and finite element analysis, require extensive parallel computation and high floating point throughput. The increasing adoption of GPU-based edge platforms has led to renewed interest in their applicability to these domains. Although GPU-accelerated edge computing is becoming more common, its suitability for large-scale scientific simulations—especially compared to traditional high-performance GPUs—has not been thoroughly examined. In this regard, our previous studies [5,6] demonstrated the feasibility of GPU-accelerated edge computing for scientific workloads, while also highlighting limitations in computational power, memory bandwidth, and scalability. As newer generations of edge accelerators continue to emerge, there is a need to evaluate how these advancements address the limitations observed in earlier devices.
SSA [7] is a fundamental computational tool for simulating biochemical reaction networks and is extensively used in fields such as systems biology and chemical kinetics. Due to its trajectory-level parallelism and substantial floating point computation per simulation, SSA benefits significantly from GPU acceleration, making it an ideal candidate for evaluating the computational capabilities of modern edge GPUs. Evaluating edge systems solely from an AI inference perspective, as conducted in prior benchmarks [4,8,9], fails to capture critical performance attributes needed in scientific computing and HPC workloads. Therefore, it is crucial to assess modern GPU-accelerated edge devices beyond standard AI tasks, focusing on their potential for compute-intensive scientific workloads.
While other scientific workloads, such as NAS Parallel Benchmarks (NPB) [10] and Molecular Dynamics (MD) simulations, have been widely used for GPU benchmarking, they primarily involve structured and predictable computation patterns. In contrast, SSA exhibits trajectory-level parallelism with dynamic reaction events and irregular memory access, making it a distinct workload for evaluating GPU architectures. Here, “irregular” denotes algorithm-level irregularity–data-dependent control flow and per-trajectory variability that induce warp divergence and temporal incoherence across threads–rather than persistent uncoalesced global memory accesses. This makes it particularly well-suited for evaluating architectural factors such as core-level parallelism, instruction throughput, and memory hierarchy. SSA also enables a direct assessment of parallel efficiency, execution time scaling, and power consumption trade-offs, which are critical factors for GPU-accelerated edge devices. Focusing on SSA as a representative scientific workload, this study evaluates the impact of CUDA (Compute Unified Device Architecture) [11] core count, memory bandwidth, and architectural changes on the performance and efficiency of the modern edge computing platforms.
Specifically, our research makes the following key contributions:
- Extensive Benchmarking of SSA on Modern Edge GPUs: The SSA algorithm is implemented and optimized on the latest Jetson devices, including the Volta-based Xavier NX [12,13], the Ampere-based Orin Nano and Orin NX [14,15]. Unlike prior studies that evaluated the old-generation Jetson Nano [5,6], our work extends the analysis to newer architectures, quantifying the impact of increased CUDA cores, improved memory bandwidth, and higher GPU clock speeds on SSA performance.
- Energy and Cost Efficiency Analysis: Beyond measuring execution time, energy efficiency (ms/W) and cost-effectiveness (ms/USD) are evaluated in detail. Instead of relying on hardware-centric metrics like GFLOPS/W (giga floating point operations per second per Watt), these practical measures are adopted to capture algorithm-level efficiency and deployment relevance. This extends prior studies by incorporating realistic and application-driven metrics, enabling a more holistic assessment of GPU-accelerated edge devices for compute-intensive scientific workloads.
- Comparison of Edge GPUs with High-End Desktop GPUs: The performance of edge GPUs is evaluated in a broader context by comparing them with the RTX 3080, a high-performance desktop GPU. This allows us to assess the trade-offs between computational efficiency, power consumption, and cost-effectiveness, highlighting both the advantages and inherent limitations of edge GPUs for scientific computing workloads.
This study systematically evaluates modern GPU-accelerated edge platforms for stochastic simulations, offering practical insights into their applicability for compute-intensive scientific workloads in resource-constrained environments. Our results demonstrate that the latest devices provide substantial performance improvements over their predecessors, making them more suitable for scientific applications that demand both computational efficiency and energy awareness.
Although SSA is often run on clusters, several use cases favor energy-constrained edge execution: closed-loop experimental control, in situ analysis when uplink is limited, and privacy-restricted settings. In such cases, predictable performance within tight power/size budgets matters more than peak throughput. Jetson-class edge devices enable real-time, on-device simulation without backhaul, whereas desktop GPUs exceed edge power/thermal limits; accordingly, we evaluate edge deployment suitability rather than cluster-scale peak performance.
The remainder of this paper is organized as follows. Section 2 describes the hardware and software environments used in our experiments. Section 3 provides an overview of related work in the field of edge computing and scientific simulations. Section 4 provides our SSA implementation and its optimization details. Section 5 presents the performance evaluation results and discusses the implications of our findings. Finally, Section 6 concludes the paper and outlines future research directions.
2. Background
This section provides an overview of the GPU-accelerated edge computing platforms evaluated in this study. The SSA, a well-established method for modeling biochemical reaction networks, is also introduced, and its computational characteristics that make it particularly well-suited for parallel execution on GPUs are discussed. In addition, a theoretical performance model is presented to estimate the upper bound of floating point throughput for SSA execution, providing a baseline for interpreting the experimental results in subsequent sections.
2.1. NVIDIA Jetson Edge Devices
Among GPU-accelerated edge computing platforms, NVIDIA Jetson devices have been widely adopted due to their high-performance GPU architectures optimized for low-power environments. The Jetson Xavier NX, Orin Nano, and Orin NX are among the latest advancements in this series, providing substantial improvements in computational power, memory bandwidth, and energy efficiency compared to previous models.
Jetson Xavier NX is built on the Volta architecture and features 6 streaming multiprocessors (SMs) with a total of 384 CUDA cores, accompanied by 48 tensor cores for deep learning acceleration. It delivers up to 21 TOPS (tera operations per second) of AI performance and is equipped with 8 GB LPDDR4x memory. The device supports a configurable power mode ranging from 10 W to 15 W, allowing flexibility in balancing power consumption and computational performance.
Jetson Orin Nano is a more recent entry-level device based on the Ampere architecture, designed to offer a significant performance boost over previous-generation devices like the Jetson Nano. It features 8 SMs, amounting to 1024 CUDA cores, along with 32 tensor cores. The device provides up to 40 TOPS of AI performance, with a memory bandwidth of 68 GB/s and 8 GB of LPDDR5 memory. With a power envelope of 15 W, it maintains a strong balance between efficiency and computational capability.
Jetson Orin NX builds upon the Orin Nano by increasing both computational power and memory bandwidth. It features the same Ampere architecture with 8 SMs (1024 CUDA cores) and 32 tensor cores but delivers up to 70 TOPS of AI performance. Additionally, it offers a higher memory bandwidth of 102.4 GB/s while retaining 8 GB of LPDDR5 memory. The power configuration is set at a maximum of 20 W, making it the most powerful among the three models in terms of raw computational throughput.
The performance of GPU-accelerated edge devices is heavily influenced by their hardware characteristics, including GPU architecture, computational parallelism, memory bandwidth, and power consumption. Table 1 summarizes the key specifications of the Jetson devices evaluated in this study, alongside the RTX 3080, which serves as a desktop-class reference GPU for comparative evaluation. For clarity, TDP in the table refers to thermal design power, representing the maximum sustained power consumption under typical workloads, while DLA stands for deep learning accelerator, a dedicated hardware module for AI inference tasks present in some Jetson devices.

Table 1.
Specifications of the evaluated NVIDIA Jetson series [13,15].
2.2. Stochastic Simulation Algorithm
The SSA, originally proposed by Gillespie [16], is a Monte Carlo-based method for simulating the time evolution of biochemical reaction networks. The SSA is particularly well-suited for systems where stochastic fluctuations play a significant role, such as in gene regulatory networks or cellular signaling pathways. The algorithm operates on a system of N molecular species that interact through M reaction channels . Each reaction is associated by a propensity function and a stoichiometric vector , where represents the current state of the system, and denotes the population of species .
The propensity function defines the probability that reaction will occur in the next infinitesimal time interval and is given by
where represents the number of molecular combinations available for reaction . For example, in a bimolecular reaction involving different species such as , ; for a reaction involving two identical molecules, such as , the term becomes .
The SSA proceeds by iteratively generating random numbers to determine the next reaction and the time interval until that reaction occurs. Specifically, at each step of the simulation, the algorithm performs the following operations:
- Calculate Propensities: Compute the propensity functions for all M reactions and the total propensity , defined as
- Generate Reaction Time: Draw a random number from a uniform distribution and compute the time interval until the next reaction using
- Select Reaction: Draw a second random number from and determine the index j of the next reaction such that
- Update System State: Update the state vector and the simulation time t according to
- Repeat or Terminate: If the simulation time t exceeds the final time , the simulation terminates; otherwise, the algorithm returns to Step 1 to continue the simulation.
The SSA is inherently parallelizable, as the evolution of individual reaction trajectories can be computed independently. This property makes it particularly suitable for GPU-accelerated execution, where thousands of threads can simultaneously simulate different trajectories [17]. The algorithm’s ability to leverage massive parallelism aligns well with the architectural strengths of modern GPU-based edge platforms. These devices are equipped with a large number of CUDA cores (typically hundreds or more), enabling efficient execution of parallel workloads like the SSA. By evaluating the performance of the SSA on GPU-accelerated edge devices, we gain insights into their throughput, parallel execution efficiency, and suitability for compute-intensive scientific computing tasks. However, as the number of reactions and species increases, the algorithm’s computational complexity grows rapidly, reinforcing the importance of efficient implementation to maintain scalability on edge platforms.
2.3. Theoretical Performance Model of GPU Architectures
To evaluate the computational capabilities of different GPU architectures, we derive theoretical performance estimates based on their specifications. The primary metric considered is the theoretical peak floating point operations per second (FLOPS), which provides an upper bound on compute throughput for SSA workloads.
2.3.1. Theoretical Compute Performance
The theoretical peak FLOPS for each GPU can be estimated using the formula:
where the factor of 2 accounts for fused multiply–add (FMA) operations, which are common in GPU computations. Based on the hardware specifications in Table 1, the estimated peak FLOPS for each Jetson device are as follows:
- Xavier NX: GFLOPS
- Orin Nano: GFLOPS
- Orin NX: GFLOPS
These values serve as theoretical ceilings for floating point throughput, assuming full utilization of available CUDA cores and ideal scheduling conditions.
2.3.2. Performance Implications
The differences in theoretical compute performance across Xavier NX, Orin Nano, and Orin NX reflect architectural advancements in CUDA core count and clock frequency. The Orin NX stands out with its higher FLOPS ceiling, indicating its suitability for demanding compute-bound applications like SSA.
In Section 5, we compare these theoretical estimates with empirical results to assess actual GPU utilization efficiency and identify bottlenecks in real-world SSA execution.
3. Related Work
While numerous studies have benchmarked edge computing platforms, most focus on AI workloads [18,19,20], with relatively few addressing HPC applications. Prior research has largely emphasized performance metrics relevant to AI tasks, such as inference speed and model accuracy, whereas comprehensive evaluations of edge systems for computationally intensive scientific workloads remain limited [21,22]. In contrast, this study examines the computational efficiency of GPU-accelerated edge devices for stochastic simulations, providing insights into their suitability for scientific computing.
3.1. GPU-Accelerated Edge Devices for Scientific Computing
Our prior work [23] reviewed the current state of HPC on modern edge platforms, focusing on programming models, benchmarking methodologies, and software environments optimized for parallel execution. This study highlighted the challenges of adapting traditional HPC programming paradigms, such as CUDA and OpenCL [24], to edge architectures, particularly in handling memory management and optimizing parallel workloads. Unlike desktop GPUs such as the RTX 3080, Jetson-class edge GPUs adopt a tightly integrated system-on-module (SoM) design, where the CPU, GPU, and memory controller share a unified memory space. This architectural feature leads to a different performance profile compared to discrete GPUs, particularly affecting memory access behavior, scheduling latency, and thermal constraints. For further details on such architectural differences and their performance implications, we refer readers to our prior work [23].
In addition to AI inference, recent research has explored broader applications of GPU-accelerated edge computing beyond AI inference. Cecilia et al. [25] evaluated the computational performance of executing clustering algorithms on an NVIDIA Jetson AGX Xavier, demonstrating its energy efficiency compared to desktop HPC systems. However, their work primarily focused on general-purpose workloads rather than domain-specific scientific simulations such as SSA, which involve irregular memory access patterns and parallel trajectories.
Several studies have explored SSA performance on GPU-accelerated edge devices. Early GPU-based SSA implementations laid the foundation for trajectory-parallel execution strategies. Slepoy et al. [26] proposed a constant-time kinetic Monte Carlo algorithm optimized for large biochemical networks, showcasing the potential of CUDA for simulating many independent SSA trajectories in parallel. Similarly, Dematté and Prandi [27] examined GPU acceleration in systems biology, emphasizing SSA as a representative workload well suited to many-core architectures due to its inherent stochastic and irregular nature. These studies demonstrated the feasibility of GPU-parallel SSA prior to the emergence of edge platforms such as Jetson. Our previous work [6] evaluated the feasibility of executing stochastic simulations on Jetson Nano, demonstrating its cost-effectiveness for scientific applications. Similarly, in another study [5], we analyzed SSA performance in a Jetson Nano-based multi-device cluster, highlighting its parallel processing capabilities. However, these studies were restricted to earlier hardware generations and did not examine how advancements in GPU architectures influence SSA execution. This work extends our previous research by evaluating the latest GPU-accelerated edge devices, analyzing their efficiency and scalability in executing SSA. Unlike Jetson Nano, which contains only 128 CUDA cores, the newer Jetson Orin NX features 1024 CUDA cores and significantly higher memory bandwidth. These advances represent a major architectural leap in edge GPU design. However, the effects of these improvements on real-world scientific workloads such as SSA remain underexplored.
Our study addresses this gap by benchmarking SSA performance on modern Jetson devices, analyzing execution trends in relation to memory behavior, parallel throughput, and energy efficiency. While this study focuses on Jetson devices due to their CUDA programmability and widespread use in scientific GPU computing, it is worth noting that other edge platforms such as Google Coral (Edge TPU) [28], Intel Edge AI platforms (e.g., Movidius [29] and OpenVINO [30]), and AMD Ryzen Embedded devices [31] also support hardware acceleration for edge inference and data processing tasks. However, their programmability and parallel computing support for floating point intensive simulations such as SSA remain limited compared to Jetson’s CUDA ecosystem.
3.2. Parallel Programming Models and Benchmarks for Edge Systems
Another line of research examines parallel programming models for edge computing. Nam [32] evaluated the feasibility of OpenMP [33], OpenCL, OpenACC [34], and OpenSYCL [35] on heterogeneous edge devices such as Raspberry Pi 4 and Jetson Orin Nano. Hoffmann et al. [36] benchmarked OpenMP, Intel Threading Building Block (TBB) [37], and CUDA implementations on single-board computers (SBCs) across various edge computing applications. These studies provide insights into how programming models perform on different architectures but focus primarily on general-purpose parallel computing rather than GPU-accelerated edge systems in scientific computing workloads.
Efforts have also been made to optimize memory management in CUDA-based programming models for system-on-module architectures. Choi et al. [38] evaluated the impact of different CUDA memory management techniques, including unified memory and pinned memory, on Jetson TX2. Their findings highlight how memory access patterns influence performance on edge devices. Our study expands on this by examining how architectural changes in newer Jetson devices influence SSA execution performance, particularly in relation to memory bandwidth and parallel execution efficiency.
Benchmarking edge devices for HPC applications remains an evolving research area. The NPB have been widely used to assess parallel system performance, but adaptations for edge devices are still limited. Seo et al. [39] implemented NPB in OpenCL, observing that its source-level portability does not always translate to performance portability across architectures. Araujo et al. [40] further explored CUDA-based implementations of NPB, optimizing memory access patterns, leveraging shared memory, and tuning thread configurations to enhance performance across multiple GPU architectures. Their study demonstrated that carefully optimized CUDA implementations can yield significant speedups compared to OpenCL and OpenACC versions of NPB. While these efforts provide insights into GPU optimizations for traditional benchmarking workloads, our study extends this research by evaluating how architectural advancements in the latest Jetson devices impact the performance of stochastic simulations, particularly in terms of computational efficiency and power consumption. Unlike structured workloads such as NPB, SSA features irregular memory access patterns and trajectory-level parallelism. By benchmarking SSA on edge GPUs, we offer a complementary perspective on GPU performance under less structured, compute-intensive workloads that are common in scientific simulations.
4. Stochastic Simulation Algorithm on GPUs
In this study, we implement the SSA on NVIDIA GPUs using CUDA, adapting the kernel for execution on Jetson Xavier NX, Orin Nano, and Orin NX devices. The implementation adopts a trajectory-parallel approach, where each GPU thread independently simulates an SSA trajectory. This structure allows for effective parallel execution with minimal thread synchronization overhead, making it suitable for GPU acceleration.
Listing 1 shows the CUDA kernel implementation of SSA on the GPUs of the Jetson devices, which is structured into five key steps that correspond to the algorithm described in Section 2:
- The system state, including species populations, reaction rate constants, and random number generator states, is initialized. (line 10).
- Each thread independently computes reaction propensities based on the current system state. (lines 19–21).
- A reaction is selected by drawing a uniform random number and scanning the cumulative propensities until the running sum exceeds the threshold; the loop stops one position past the target, and the subsequent rxn–– yields the correct channel index. Species populations are updated accordingly. (lines 24–28).
- The simulation time is updated based on a randomly sampled time step (lines 31–32).
- The simulation continues until the predefined final time is reached. (line 35).
| Listing 1. Simplified CUDA kernel for SSA (conceptual excerpt; full code in the repository). |
 |
This CUDA implementation is adapted from our previous work [5,6], which demonstrated efficient SSA execution using a hybrid CUDA+MPI approach on earlier Jetson platforms. While the original implementation was designed for distributed simulation across multiple edge devices, the present study targets optimized single-device execution on modern Jetson systems. This shift allows us to focus on platform-level performance and energy efficiency, which are critical in standalone edge computing scenarios. The kernel shown in Listing 1 reflects a simplified version; the actual benchmarking code includes several practical enhancements such as per-trajectory iteration counting, validation checks for negative species populations, and block-level synchronization logic to ensure correct termination. These adjustments improve the numerical robustness and practical reliability of SSA execution at scale.
Implementation details. To enhance execution efficiency, multiple CUDA-specific optimizations are incorporated. First, shared memory is used for species populations, stoichiometry matrices, and reaction rates (lines 5–7) to minimize global memory accesses, which are significantly slower. The global-to-shared memory transfer (line 10) ensures that frequently accessed variables are cached within low-latency shared memory, reducing redundant memory fetches. Although SSA execution is not primarily memory-bound, coalesced access patterns are still applied (lines 19–21) to improve efficiency by avoiding unnecessary memory transaction overhead. The state layout is organized so that threads in a warp read/write contiguous global addresses (coalesced access), while hot data (rates, stoichiometry, and per-thread slices of xShared) reside in shared memory. Accordingly, the primary source of “irregularity” in SSA is divergent control flow and per-trajectory timing, not systematic uncoalesced global memory patterns.
Warp divergence is minimized in the reaction selection process (lines 24–25) by structuring the iteration over reaction channels in a predictable sequence. This avoids multiple conditional branches, ensuring that threads within a warp follow the same execution path and reducing branching overhead. Efficient random number generation is implemented using cuRAND [41] (lines 15–16), where thread-local states are maintained in registers instead of generating new random values at each step. This reduces memory contention and improves sampling efficiency. Synchronization overhead is also minimized using __syncthreads() (line 32), which is only applied when necessary to maintain shared memory consistency while avoiding unnecessary stalls. These optimizations ensure that SSA execution scales effectively with increasing simulation size, particularly benefiting from the compute-intensive nature of the algorithm when executed across thousands of parallel GPU threads.
Implementing SSA on GPUs poses three practical challenges: (i) data-dependent control flow and variable trajectory lengths induce warp divergence; (ii) maintaining statistically independent, reproducible per-thread random-number streams at scale; and (iii) sustaining instruction throughput by keeping the small working set on-chip to minimize global-memory stalls. Our kernel addresses (i) via a trajectory-parallel direct method with a uniform inner-loop structure and minimal branching, (ii) via per-thread cuRAND states seeded with a fixed base and unique sequence IDs, and (iii) via staging species, stoichiometry, and rates in shared memory. Prior GPU–SSA implementations (e.g., [17]) predominantly target desktop/data-center GPUs and algorithmic variants; in contrast, this work focuses on Jetson-class edge SoMs and reports time, energy, and cost metrics under tight power envelopes.
In practice the kernel is compute-bound; the largest gains come from keeping the working set in shared memory/registers and reducing branch divergence, whereas host–device transfers and any inter-device communication are excluded from the timed region and play no role in steady-state performance.
Zero-copy allocation. Zero-copy memory allocation [42] allows the GPU to directly access host memory without explicit memory transfers. While this technique is generally beneficial for workloads with frequent memory access, our previous study [6] demonstrated that zero-copy provided negligible performance gains for SSA on Jetson Nano, with at most a 0.7% improvement for small problem sizes and even degraded performance for larger problem sizes. This unexpected behavior was attributed to the impact of zero-copy on the initialization of random states for SSA simulations. Profiling results indicated that using zero-copy resulted in excessive memory pinning without caching, leading to increased memory management overhead as problem sizes grew. Given that the latest Jetson devices share a similar memory architecture with Jetson Nano, we do not apply zero-copy in this study, as the performance degradation observed in our previous work is likely to persist. Instead, we optimize memory access patterns using shared memory to maximize computational efficiency.
Kernel resource usage and profiling. The SSA kernel stores per-trajectory species vectors, stoichiometry, and rate constants in shared memory. For a block size XBLOCKSIZE and NX species, the per-block shared-memory footprint is approximately
so shared memory is not the limiting factor for occupancy at typical XBLOCKSIZE values (128–256). In practice, occupancy is governed mainly by register allocation and the chosen thread/block geometry; we therefore keep the inner-loop state minimal and use block sizes in the 128–256 range to remain in a high-occupancy regime. Because the kernel is floating point dominated and coalesces global accesses via shared memory, memory throttling is not expected to be a primary stall source; residual stalls arise from mild control-flow divergence due to data-dependent termination. A full Nsight breakdown is omitted here, as such microarchitectural counters can vary with driver and firmware revisions; the empirical results in Section 5 are consistent with a compute-bound regime on Orin-class devices.
Block level synchronization. In the simplified kernel of Listing 1, a single __syncthreads() is included as a conservative barrier to ensure that per-block shared data—stoichiometry nu, rate constants proprates, and each thread’s slice of xShared—are fully visible before the next loop iteration. Because each thread updates only its own xShared region and there is no cross-thread dependence, the barrier is not strictly required for correctness in this minimal example and can be removed without affecting results; it is retained here to reflect the synchronization used when shared values are initialized at block scope in the full implementation.
Random number generation and seeding. The kernel maintains a per–trajectory cuRAND state array passed as states and draws variates via curand_uniform(&states[tid]), where the global trajectory ID is . To ensure reproducibility and stream independence across millions of trajectories, each run uses a fixed 64-bit base seed, while the cuRAND sequence is set to the unique (with offset ). For experiments that involve multiple kernel launches, a launch-specific base is added to the sequence, i.e., , so that no sequence is ever reused across launches. This policy yields statistically independent per-thread streams and deterministic reruns without extra synchronization or host–device transfers.
5. Experimental Results and Evaluation
To clarify the evaluation methodology, Figure 1 illustrates the overall procedure adopted in this study. The process begins with selecting SSA workload parameters and target hardware platforms. Each device is evaluated under varying problem sizes, ranging from to simulation trajectories, with a fixed number of iterations per trajectory. Execution time is measured on-device, and the total number of floating point operations is estimated based on SSA kernel characteristics. Using these values, practical metrics such as energy efficiency (ms/W), cost-effectiveness (ms/USD), and estimated throughput are computed. The results are then compared across platforms to assess both raw performance and deployment suitability in edge environments.
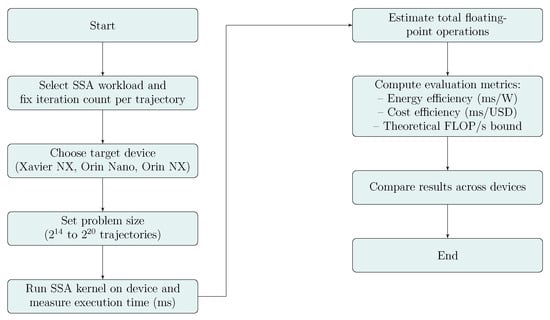
Figure 1.
Evaluation procedure for SSA execution on GPU-based edge platforms.
All experiments simulate the fast reversible isomerization system—a simplified yet widely used biochemical model for evaluating the performance of stochastic simulation algorithms [43]. The reaction network consists of one fast reversible and one slow irreversible reaction:
where denotes the chemical species and represents the reaction rate constants. This system captures the interplay between fast equilibrium dynamics and slow transitions, making it well-suited for benchmarking SSA implementations. The corresponding propensity functions and state-change vectors are defined in accordance with Gillespie’s framework. All simulations use fixed initial molecule counts and rate constants and vary the number of trajectories to assess scalability. Each experiment is repeated five times to reduce variance. On average, each SSA trajectory involves over two million reaction steps, providing a rigorous compute-intensive workload. Table 2 summarizes the essential simulation-level and execution-level parameters for the SSA evaluation, providing a clear reference point for the experimental setup.
Table 2.
Key simulation and execution parameters used for SSA evaluation.
By using this well-characterized biochemical model and standardized settings, we ensure consistency across hardware platforms and enable meaningful comparisons of computational performance and efficiency. The full source code used in this study is publicly available at https://github.com/pilsungk/ssa-jetson, including unified memory variants.
5.1. Execution Time Analysis
To assess the computational performance of each device, we measured the execution time (in milliseconds) for varying problem sizes. In our SSA setup, the problem size (from to ) directly controls the number of concurrently simulated trajectories; thus, sweeping the problem size constitutes a controlled increase in trajectory-level parallelism. The execution times reported in Table 3 and Figure 2 therefore quantify both raw performance and scalability as parallelism grows. Table 3 summarizes the recorded execution times, rounded to one decimal place.
Table 3.
Execution time (ms) of SSA for different problem sizes.
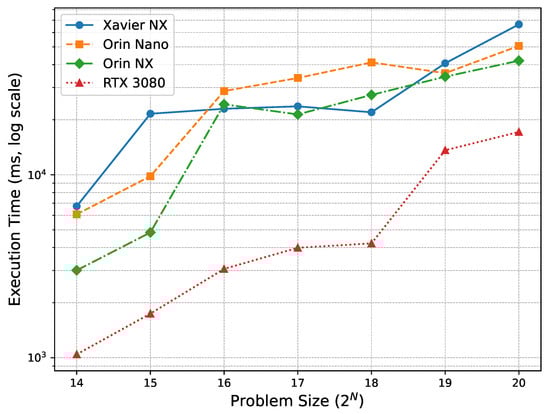
Figure 2.
Execution time across problem sizes (log scale). Larger problem sizes correspond to higher trajectory-level parallelism (more concurrent trajectories), revealing each device’s scalability under increasing parallel load.
Among the Jetson series, the Orin NX generally delivers the best execution times, especially for large-scale workloads. Its higher GPU clock frequency (0.76 GHz) and larger number of CUDA cores (1024) compared to the Xavier NX enable superior scalability as the number of simulation trajectories increases. Interestingly, for mid-sized workloads ( to ), the Xavier NX outperforms the Orin Nano, despite having fewer CUDA cores and lower theoretical throughput. This counterintuitive result is likely due to the significantly higher GPU clock frequency of the Xavier NX (1.1 GHz) compared to the Orin Nano (0.62 GHz), which reduces per-thread latency. Additionally, the Orin Nano’s increased parallelism may lead to higher kernel resource contention—particularly in shared memory or register usage—which can limit occupancy and reduce overall execution efficiency. These results emphasize that increasing core count alone does not guarantee better performance; clock speed and execution efficiency play equally critical roles in compute-intensive workloads like SSA.
The performance gap between the Xavier NX and the Orin NX becomes more pronounced with increasing problem size, clearly illustrating the architectural advantage of the Ampere-based Orin NX over the older Volta-based Xavier NX. The Orin NX consistently maintains predictable performance scaling without the fluctuations observed in the Orin Nano, highlighting its superior balance of computational resources. These findings suggest that the Orin NX is the most suitable platform for executing compute-intensive SSA workloads efficiently in power-constrained edge environments.
While the Orin NX exhibits a larger absolute increase in execution time with problem size, its scaling behavior remains consistent and predictable. In contrast, the Orin Nano shows irregular fluctuations at larger scales (Figure 2), likely due to architectural bottlenecks such as shared memory contention. This stability reinforces the Orin NX’s suitability for compute-bound simulations where predictable throughput is essential.
The RTX 3080 consistently achieves the fastest execution times across all problem sizes, as expected, due to its significantly higher number of CUDA cores and clock frequency. However, this advantage comes at the cost of substantially greater power consumption (350 W TDP), which severely limits its practicality for edge deployments. It is included in this study solely as a reference baseline for high-end desktop GPU performance, not as a practical candidate for edge scenarios.
5.2. Cost-Performance and Power-Performance Evaluation
Given that the hardware specifications, pricing, and power consumption details of these devices are already provided in Section 2, we focus on analyzing their efficiency based on execution time per cost (ms/USD) and execution time per watt (ms/W). All experiments were conducted under each device’s default power envelope (Xavier NX: 15 W; Orin Nano: 15 W; Orin NX: 20 W), and we did not vary power limits to preserve cross-device comparability. Because the SSA workload is compute-bound, lowering the power cap primarily reduces GPU frequency and throughput, which typically increases the energy per trajectory (power × time) rather than reduces it.
To evaluate power efficiency, we analyze execution time per watt (ms/W) using the TDP values of each device. While direct power measurements using a wattmeter could provide additional accuracy, our preliminary tests showed that the actual power consumption closely aligned with the TDP values provided by NVIDIA. Specifically, for the Jetson Orin NX and Orin Nano, real-time power measurements under full computational load deviated by less than 4% from their rated TDP values, indicating that TDP serves as a reliable estimate for power consumption in our workload. Given this negligible discrepancy, we use TDP as the basis for power-performance analysis, ensuring consistency across different devices without requiring additional power monitoring hardware.
To validate the use of nominal power budgets, we additionally sampled on-device power via tegrastats at two representative scales ( and trajectories). During steady-state kernel execution, the average GPU power remained within of the nominal budgets (20 W for Orin NX; 15 W for Orin Nano). Given the compute-bound nature of our SSA kernel—which sustains high SM occupancy with minimal host–device traffic—we therefore report energy efficiency as time-per-watt (ms/W) using the nominal power budgets. Energy per run is estimated as (with t in seconds); dividing by the number of trajectories yields energy per trajectory.
For both cost and power efficiency analyses, we adopt inverse metrics—execution time per dollar (ms/USD) and execution time per watt (ms/W)—to reflect the efficiency of each device. In both cases, lower values indicate better performance, as they represent shorter execution times for a given cost or power budget. Although these metrics differ from more common formulations such as performance per dollar (e.g., GFLOPS/USD), the inverse form is intuitive in the context of SSA simulations where reducing execution time is the primary objective.
The cost-performance analysis, illustrated in Figure 3, reveals that among the Jetson devices, the Orin NX consistently delivers the best execution time per dollar (ms/USD) across nearly all problem sizes. Its values range from 7.5 ms/USD at to 105.4 ms/USD at , demonstrating both high efficiency and scalability. In contrast, the Orin Nano, while showing promising cost-efficiency at the smallest size (, 20.3 ms/USD), suffers from significant degradation as the problem size increases, reaching 169.0 ms/USD at . The Xavier NX generally exhibits the least favorable cost-performance, starting at 16.9 ms/USD and increasing to 166.4 ms/USD at the largest problem size.
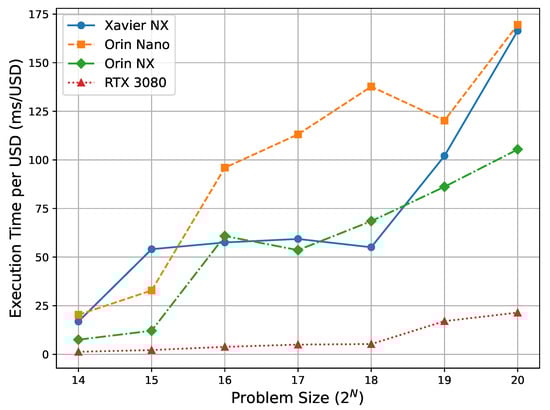
Figure 3.
Cost–performance (ms/USD) across problem sizes. Because problem size controls trajectory-level parallelism, these curves reflect how cost-normalized efficiency changes as parallelism increases. Lower is better.
However, an exception arises in the mid-range sizes (–), where the Xavier NX unexpectedly outperforms the Orin Nano in execution time. For instance, at , Xavier NX records 55.1 ms/USD compared to Orin Nano’s 137.2 ms/USD. This anomaly leads to a temporary advantage for Xavier NX in cost-performance despite its older Volta architecture. This advantage in cost-performance is not solely due to faster execution by the Xavier NX. As noted earlier, its significantly higher clock frequency (1.1 GHz) contributes to lower execution time in mid-sized workloads despite fewer cores. In addition, since the Xavier NX and Orin NX are priced similarly at $399, execution time differences directly influence their ms/USD values. In contrast, although the Orin Nano is priced lower at $299, its degraded performance at larger workloads offsets the cost benefit, resulting in poorer cost-efficiency.
The power-performance analysis, shown in Figure 4, demonstrates that the Orin NX provides the best overall energy efficiency among the Jetson devices. It achieves the smallest execution time per watt (ms/W), starting at 150.2 ms/W for and reaching 2102.7 ms/W at . This steady performance trend across problem sizes highlights its strong suitability for power-constrained edge environments.
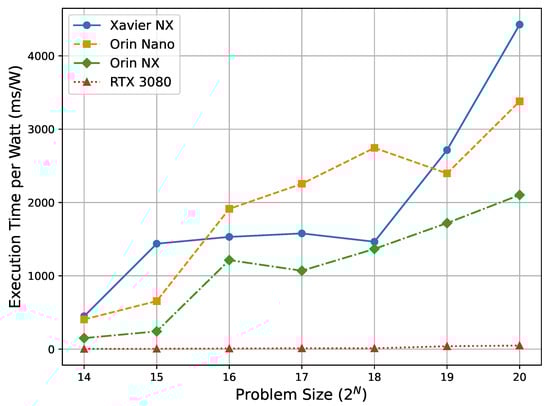
Figure 4.
Power-performance (ms/W) across problem sizes. As the number of concurrent trajectories increases, the trends indicate each device’s ability to sustain energy-efficient throughput under higher parallelism. Lower is better.
The Orin Nano, despite sharing the same 15 W TDP as the Xavier NX, exhibits higher ms/W values, indicating reduced energy efficiency at larger problem sizes. For example, its ms/W increases from 202.7 at to 3379.2 at . In contrast, the Xavier NX begins with 448.7 ms/W at and rises to 4426.8 ms/W at , confirming its relatively poor energy efficiency across all workloads.
Interestingly, similar to the cost-performance results, the Xavier NX shows better energy efficiency than the Orin Nano at mid-range problem sizes (–). For instance, at , the Xavier NX achieves 1578.2 ms/W, whereas the Orin Nano reaches 2255.1 ms/W. This temporary advantage in ms/W is consistent with its lower execution time in these ranges, as discussed earlier. It is also worth noting that the Xavier NX operates at a lower TDP (15 W) than the Orin NX (20 W), which contributes to its favorable ms/W scores despite having fewer cores. However, as problem sizes scale up, the Orin NX consistently delivers the best power-performance among Jetson devices, reaching 2102.7 ms/W at . Its balance of throughput and power budget reinforces its suitability for compute-intensive edge workloads where energy efficiency is critical.
Although primarily designed for desktop HPC use, the RTX 3080 achieves the most favorable scores in both cost-performance and power-performance metrics, recording the lowest execution time per dollar and per watt across all problem sizes. For instance, at , it reaches just 21.5 ms/USD and 49.0 ms/W, significantly outperforming the Jetson devices in raw efficiency. However, this performance comes at the cost of significantly higher power consumption (350 W) and larger system form factors, making it impractical for energy-constrained or portable environments. The RTX 3080 is included in this study solely as a reference point for high-end desktop GPU performance, not as a practical solution for edge deployments.
5.3. Discussion on Performance Trends
The experimental results highlight several important trends in GPU-accelerated edge computing:
- Impact of GPU Architecture on Execution Efficiency: The performance differences among Xavier NX, Orin Nano, and Orin NX highlight how architectural features—such as core count, clock frequency, and memory bandwidth—affect SSA execution efficiency. The transition from Volta to Ampere architecture delivers substantial gains in computational throughput. For instance, at the largest problem size (), Orin NX achieves a 1.58× speedup over Xavier NX and a 1.20× speedup over Orin Nano. While memory bandwidth remains a contributing factor—59.7 GB/s for Xavier NX versus 102.4 GB/s for Orin NX—the higher execution efficiency is primarily attributable to increased CUDA core counts and improved compute performance. Notably, unlike earlier studies that required MPI-based multi-device setup to achieve reasonable performance on Jetson Nano [5], the Orin NX achieves significantly higher throughput as a standalone device. This shift underscores the practical implications of architectural advancements in modern edge GPUs for scientific computing.
- Cost–Performance Trade-offs: The cost-performance results (Figure 3) reveal that the Orin NX provides the most consistently favorable execution time per dollar across all problem sizes, with values ranging from 7.5 ms/USD at to 105.3 ms/USD at . Although the Orin Nano is more affordable ($299), its cost-efficiency degrades significantly for larger workloads—reaching 169.5 ms/USD at . Interestingly, it achieves a minimum of 32.9 ms/USD at , temporarily outperforming Xavier NX at smaller scales. However, its instability at higher problem sizes limits its suitability for demanding simulations. The Xavier NX, despite having a similar price point to the Orin NX, consistently exhibits poorer cost-performance, particularly at large problem sizes ( ms/USD at ), making it a less attractive option for computationally intensive scientific workloads.
- Power Efficiency and Suitability for Edge Applications: The power-performance results (Figure 4) show that the Orin NX consistently delivers the most favorable execution time per watt (ms/W), starting at 150.2 ms/W for and reaching 2102.7 ms/W at . This demonstrates its strong suitability for power-constrained scientific environments. The Orin Nano also performs reasonably well at small to mid-range workloads, achieving 654.9 ms/W at , but its efficiency deteriorates significantly as the workload increases, with values rising to 3379.2 ms/W at . While minor variations exist—such as Xavier NX briefly outperforming Orin Nano in mid-range power efficiency—these do not alter the overall conclusion: the Orin NX offers the best balance of performance and energy efficiency among Jetson devices. Prior work requiring multi-device setups can now be matched or exceeded by a single Orin NX, simplifying edge deployment for scientific workloads.
Overall, these findings confirm that the Orin NX is the most suitable Jetson platform for computationally demanding SSA simulations, offering a well-balanced trade-off between performance, cost, and power efficiency in a compact form factor. These results underscore the importance of considering deployment constraints—not just raw performance—when selecting GPU-accelerated platforms for scientific computing in real-world environments. These trends should be read explicitly in the context of trajectory-level parallelism: as the number of concurrent trajectories increases from to , Figure 3 and Figure 4 show how cost- and power-normalized efficiencies evolve with parallel load, highlighting each device’s ability to sustain throughput under higher parallelism.
Finally, while the observed performance trends provide valuable empirical insights, it is essential to compare these results against theoretical performance estimates to better understand the computational efficiency and potential bottlenecks of each device. The following subsection presents a detailed comparison between theoretical and experimental performance, highlighting key factors influencing real-world execution efficiency.
Throughput in Operations per Second (GFLOPS ≡ FP-Only GOPS)
Following common usage, we report throughput as GFLOPS (i.e., floating point operations per second). Because the SSA kernel is dominated by floating point arithmetic in its inner loop, these values are numerically identical to operations-per-second when restricted to floating point work; we therefore interpret reported GFLOPS as FP-only GOPS ( operations per second). For a workload with average iterations per trajectory , number of trajectories , and measured wall time , the effective FP-only GOPS (equal to GFLOPS) is
where 19 denotes the floating point operations per iteration, as explained in the following paragraph. If one wishes to approximate total GOPS including integer operations, a simple upper bound can be obtained by multiplying FP-only GOPS by , where r is the implementation-specific ratio of integer to floating point operations; we do not apply this scaling in order to avoid overestimation and to preserve cross-device comparability.
To assess how effectively each GPU utilizes its computational capacity, we estimate the effective FLOPS achieved during SSA execution and compare this with the theoretical peak values.
Each SSA trajectory involves a series of simulation steps. In each step, the following floating point operations are performed:
- Propensity calculation (Step 1): three multiplications;
- Total propensity and reaction selection (Steps 2–3): two additions and approximately four fused operations (e.g., comparisons and accumulations);
- Time-step computation (Step 4): one logarithm, one division, one negation;
- State update (Step 5): three additions;
- Random number generation: two calls to curand_uniform, each estimated at two floating point (FP) operations.
This results in approximately floating point operations per iteration. Based on empirical profiling, each trajectory performs on average 2,381,417 iterations. For a problem size of (1,048,576 trajectories), the total number of floating point operations is
Table 4 presents the effective GFLOPS and utilization rate relative to each device’s theoretical compute performance.
Table 4.
Estimated effective throughput at (GFLOPS ≡ FP-only GOPS).
The results reveal that all devices achieve a substantial fraction of their theoretical peak FLOPS. The Xavier NX, despite its lower core count and older architecture, achieves the highest relative utilization at 84.6%, while the Orin NX and Orin Nano reach 72.5% and 73.7%, respectively. These findings suggest that the SSA kernel effectively leverages available computational resources on modern edge GPUs, and that the performance gap relative to peak theoretical limits may now stem more from instruction-level and memory latency overheads than from underutilization of the hardware.
5.4. Limitations and Generality
This study evaluates GPU-accelerated edge platforms using a trajectory-parallel CUDA implementation of Gillespie’s SSA, tuned for compute-bound execution via shared memory, efficient random number generation, and minimal synchronization. While this design is common in high-performance scientific simulations, alternative implementations—e.g., with different memory access patterns or thread-level load balancing—may exhibit different performance characteristics.
We selected SSA because it captures properties shared by a broader class of Monte Carlo–style scientific workloads: per-trajectory independence with minimal global synchronization, irregular control flow, and extensive on-device pseudo-random number generation. Accordingly, the architectural trends we report (e.g., the trade-off between clock frequency and core-level parallelism, and the influence of GPU scheduling efficiency) are expected to carry to models with similar parallel structure, including reaction–diffusion systems [44] and agent-based simulations [45,46]. We do not claim universality; workloads dominated by global reductions, frequent host–device transfers, or strongly memory-bound kernels may scale differently on edge SoCs.
To aid transferability beyond SSA, we report algorithm-level efficiency metrics—execution time per watt (ms/W) and execution time per dollar (ms/USD)—alongside throughput so that readers can interpret results under their own deployment constraints. For transparency and reproducibility, the key simulation and execution settings are summarized in Table 2, providing a consistent basis for cross-device comparison. Our analysis is scoped to GPU-accelerated edge platforms; therefore, cost- and power-normalized execution times are reported within the GPU device class. A controlled CPU-only OpenMP baseline would introduce architecture-specific tuning confounds and is left to future work.
This study evaluates a single, optimized trajectory-parallel direct-method SSA kernel per device. Alternative implementations (e.g., unified-memory and zero-copy variants) were prototyped and showed no material differences in preliminary runs, so they are omitted from the main results. The reference codebase, including these variants, is provided (see Data Availability).
Finally, while the approximation was validated within for our compute-bound SSA workload on the tested devices, workloads with highly variable utilization (e.g., memory-bound or bursty kernels) may exhibit larger deviations; in such cases, external watt-meter logging would be preferable for precise joule-per-run estimates.
6. Conclusions
This study evaluated the performance of modern GPU-accelerated edge devices for stochastic simulations, a representative workload in scientific computing. Execution time, computational throughput, energy efficiency, and cost-effectiveness were analyzed across three Jetson platforms: Xavier NX, Orin Nano, and Orin NX. Among them, the Orin NX consistently demonstrated the most favorable performance profile, offering a strong balance of speed, power efficiency, and cost-effectiveness. These results highlight the suitability of Jetson-class devices for scientific workloads in resource-constrained environments.
Experimental results confirm that SSA performance is largely governed by architectural features related to compute throughput—such as CUDA core count, clock speed, and kernel execution efficiency—rather than memory bandwidth. The Orin NX achieved up to 4.86 million iterations per second while consuming no more than 20 W, delivering superior scalability across problem sizes. At the largest scale, it reached 2102.7 ms/W in power-performance and 105.3 ms/USD in cost-performance, outperforming both the Xavier NX and Orin Nano. These results suggest that future edge GPU designs should emphasize improvements in core-level parallelism, frequency scaling, and instruction throughput to meet the growing demands of scientific computing.
To complement the empirical analysis, a theoretical performance model was incorporated and effective FLOP utilization was estimated. All Jetson devices achieved over 70% of their theoretical peak performance, confirming that SSA leverages the underlying hardware effectively. SSA’s irregular memory access patterns and fine-grained parallelism also make it a representative proxy for evaluating the broader applicability of edge GPUs in high-performance computing scenarios.
Future work will explore optimization techniques such as mixed-precision arithmetic and tensor core acceleration. We also plan to extend the benchmarking framework to include other scientific workloads—such as Monte Carlo integration and reaction–diffusion systems—to evaluate the generality of our findings across diverse GPU-accelerated edge applications.
Funding
This research was funded by the research fund of Dankook University in 2025.
Data Availability Statement
The full source code used in this study is publicly available at https://github.com/pilsungk/ssa-jetson (accessed on 13 October 2025).
Acknowledgments
The present research was supported by the research fund of Dankook University in 2025.
Conflicts of Interest
The author declares no conflicts of interest.
References
- Shi, W.; Cao, J.; Zhang, Q.; Li, Y.; Xu, L. Edge Computing: Vision and Challenges. IEEE Internet Things J. 2016, 3, 637–646. [Google Scholar] [CrossRef]
- Varghese, B.; Wang, N.; Barbhuiya, S.; Kilpatrick, P.; Nikolopoulos, D.S. Challenges and Opportunities in Edge Computing. In Proceedings of the 2016 IEEE International Conference on Smart Cloud (SmartCloud), New York, NY, USA, 18–20 November 2016; pp. 20–26. [Google Scholar]
- Faqir-Rhazoui, Y.; García, C. SYCL in the Edge: Performance and Energy Evaluation for Heterogeneous Acceleration. J. Supercomput. 2024, 80, 14203–14223. [Google Scholar] [CrossRef]
- Antonini, M.; Vu, T.H.; Min, C.; Montanari, A.; Mathur, A.; Kawsar, F. Resource Characterisation of Personal-Scale Sensing Models on Edge Accelerators. In Proceedings of the First International Workshop on Challenges in Artificial Intelligence and Machine Learning for Internet of Things, New York, NY, USA, 10–13 November 2019; pp. 49–55. [Google Scholar]
- Lim, S.; Kang, P. Implementing Scientific Simulations on GPU-accelerated Edge Devices. In Proceedings of the 34th International Conference on Information Networking (ICOIN), Barcelona, Spain, 7–10 January 2020; pp. 756–760. [Google Scholar] [CrossRef]
- Kang, P.; Lim, S. A Taste of Scientific Computing on the GPU-Accelerated Edge Device. IEEE Access 2020, 8, 208337–208347. [Google Scholar] [CrossRef]
- Gillespie, D.T. Exact Stochastic Simulation of Coupled Chemical Reactions. J. Phys. Chem. 1977, 81, 2340–2361. [Google Scholar] [CrossRef]
- Chen, J.; Ran, X. Deep Learning with Edge Computing: A Review. Proc. IEEE 2019, 107, 1655–1674. [Google Scholar] [CrossRef]
- Li, E.; Zeng, L.; Zhou, Z.; Chen, X. Edge AI: On-Demand Accelerating Deep Neural Network Inference via Edge Computing. IEEE Trans. Wirel. Commun. 2020, 19, 447–457. [Google Scholar] [CrossRef]
- Bailey, D.; Barszcz, E.; Barton, J.; Browning, D.; Carter, R.; Dagum, L.; Fatoohi, R.; Frederickson, P.; Lasinski, T.; Schreiber, R.; et al. The NAS Parallel Benchmarks. Int. J. High Perform. Comput. Appl. 1991, 5, 63–73. [Google Scholar] [CrossRef]
- Nickolls, J.; Buck, I.; Garland, M.; Skadron, K. Scalable Parallel Programming with CUDA. Queue 2008, 6, 40–53. [Google Scholar] [CrossRef]
- NVIDIA. NVIDIA Tesla V100 GPU Architecture v1.0. 2017. Available online: http://www.nvidia.com/content/gated-pdfs/Volta-Architecture-Whitepaper-v1.0.pdf (accessed on 15 March 2025).
- NVIDIA. Jetson Xavier NX Series. 2020. Available online: https://developer.nvidia.com/embedded/jetson-xavier-nx (accessed on 15 March 2025).
- NVIDIA. NVIDIA Ampere Architecture In-Depth. 2020. Available online: https://developer.nvidia.com/blog/nvidia-ampere-architecture-in-depth (accessed on 15 March 2025).
- NVIDIA. Jetson Orin Series. 2022. Available online: https://developer.nvidia.com/embedded/jetson-orin (accessed on 15 March 2025).
- Gillespie, D.T. A General Method for Numerically Simulating the Stochastic Time Evolution of Coupled Chemical Reactions. J. Comput. Phys. 1976, 22, 403–434. [Google Scholar] [CrossRef]
- Komarov, I.; D’Souza, R.M. Accelerating the Gillespie Exact Stochastic Simulation Algorithm using Hybrid Parallel Execution on Graphics Processing Units. PLoS ONE 2012, 7, e46693. [Google Scholar] [CrossRef] [PubMed]
- Chen, Y.; Xie, Y.; Song, L.; Chen, F.; Tang, T. A Survey of Accelerator Architectures for Deep Neural Networks. Engineering 2020, 6, 264–274. [Google Scholar] [CrossRef]
- Chang, Z.; Liu, S.; Xiong, X.; Cai, Z.; Tu, G. A Survey of Recent Advances in Edge-Computing-Powered Artificial Intelligence of Things. IEEE Internet Things J. 2021, 8, 13849–13875. [Google Scholar] [CrossRef]
- Hua, H.; Li, Y.; Wang, T.; Dong, N.; Li, W.; Cao, J. Edge Computing with Artificial Intelligence: A Machine Learning Perspective. ACM Comput. Surv. 2023, 55, 184. [Google Scholar] [CrossRef]
- Kong, X.; Wu, Y.; Wang, H.; Xia, F. Edge Computing for Internet of Everything: A Survey. IEEE Internet Things J. 2022, 9, 23472–23485. [Google Scholar] [CrossRef]
- Varghese, B.; Wang, N.; Bermbach, D.; Hong, C.H.; Lara, E.D.; Shi, W.; Stewart, C. A Survey on Edge Performance Benchmarking. ACM Comput. Surv. 2021, 54, 66. [Google Scholar] [CrossRef]
- Kang, P. Programming for High-Performance Computing on Edge Accelerators. Mathematics 2023, 11, 1055. [Google Scholar] [CrossRef]
- Stone, J.E.; Gohara, D.; Shi, G. OpenCL: A Parallel Programming Standard for Heterogeneous Computing Systems. Comput. Sci. Eng. 2010, 12, 66–73. [Google Scholar] [CrossRef] [PubMed]
- Cecilia, J.M.; Cano, J.C.; Morales-Garcia, J.; Llanes, A.; Imbernon, B. Evaluation of Clustering Algorithms on GPU-Based Edge Computing Platforms. Sensors 2020, 20, 6335. [Google Scholar] [CrossRef] [PubMed]
- Slepoy, A.; Thompson, A.P.; Plimpton, S.J. A Constant-time Kinetic Monte Carlo Algorithm for Simulation of Large Biochemical Reaction Networks. J. Chem. Phys. 2008, 128, 205101. [Google Scholar] [CrossRef] [PubMed]
- Dematté, L.; Prandi, D. GPU Computing for Systems Biology. Briefings Bioinform. 2010, 11, 323–333. [Google Scholar] [CrossRef]
- Google Coral Dev Board. 2019. Available online: https://coral.ai/products/dev-board (accessed on 15 March 2025).
- Intel. Intel® Movidius™ Neural Compute Stick. Available online: https://www.intel.com/content/www/us/en/products/sku/125743/intel-movidius-neural-compute-stick/specifications.html (accessed on 15 March 2025).
- Intel. Intel® Distribution of OpenVINO™ Toolkit. Available online: https://www.intel.com/content/www/us/en/developer/tools/openvino-toolkit/overview.html (accessed on 15 March 2025).
- AMD. AMD Ryzen™ Embedded Family. Available online: https://www.amd.com/en/products/embedded/ryzen.html (accessed on 15 March 2025).
- Nam, D. A Performance Comparison of Parallel Programming Models on Edge Devices. IEMEK J. Embed. Syst. Appl. 2023, 18, 165–172. [Google Scholar]
- Dagum, L.; Menon, R. OpenMP: An Industry Standard API for Shared-Memory Programming. IEEE Comput. Sci. Eng. 1998, 5, 46–55. [Google Scholar] [CrossRef]
- OpenACC. Available online: http://www.openacc.org (accessed on 15 March 2025).
- Alpay, A.; Soproni, B.; Wünsche, H.; Heuveline, V. Exploring the Possibility of a hipSYCL-based Implementation of oneAPI. In Proceedings of the 10th International Workshop on OpenCL, Bristol, UK, 10–12 May 2022. [Google Scholar]
- Hoffmann, R.B.; Griebler, D.; da Rosa Righi, R.; Fernandes, L.G. Benchmarking Parallel Programming for Single-Board Computers. Future Gener. Comput. Syst. 2024, 161, 119–134. [Google Scholar] [CrossRef]
- Pheatt, C. Intel® Threading Building Blocks. J. Comput. Sci. Coll. 2008, 23, 298. [Google Scholar]
- Choi, J.; You, H.; Kim, C.; Young Yeom, H.; Kim, Y. Comparing Unified, Pinned, and Host/Device Memory Allocations for Memory-intensive Workloads on Tegra SoC. Concurr. Comput. Pract. Exp. 2021, 33, e6018. [Google Scholar] [CrossRef]
- Seo, S.; Jo, G.; Lee, J. Performance Characterization of the NAS Parallel Benchmarks in OpenCL. In Proceedings of the 2011 IEEE International Symposium on Workload Characterization (IISWC), Austin, TX, USA, 6–8 November 2011; pp. 137–148. [Google Scholar]
- Araujo, G.; Griebler, D.; Rockenbach, D.A.; Danelutto, M.; Fernandes, L.G. NAS Parallel Benchmarks with CUDA and Beyond. Softw. Pract. Exp. 2021, 53, 53–80. [Google Scholar] [CrossRef]
- NVIDIA. cuRAND. Available online: https://docs.nvidia.com/cuda/curand/index.html (accessed on 15 March 2025).
- NVIDIA. CUDA Toolkit Documentation. 2019. Available online: https://docs.nvidia.com/cuda/cuda-c-best-practices-guide/index.html#zero-copy (accessed on 15 March 2025).
- Cao, Y.; Gillespie, D.T.; Petzold, L.R. The Slow-Scale Stochastic Simulation Algorithm. J. Chem. Phys. 2005, 122, 014116. [Google Scholar] [CrossRef]
- Erban, R.; Chapman, S.J. Reactive Boundary Conditions for Stochastic Simulations of Reaction–Diffusion Processes. Phys. Biol. 2007, 4, 16. [Google Scholar] [CrossRef]
- Macal, C.M.; North, M.J. Tutorial on Agent-Based Modelling and Simulation. J. Simul. 2010, 4, 151–162. [Google Scholar] [CrossRef]
- Railsback, S.F.; Grimm, V. Agent-Based and Individual-Based Modeling: A Practical Introduction; Princeton University Press: Princeton, NJ, USA, 2011. [Google Scholar]
Disclaimer/Publisher’s Note: The statements, opinions and data contained in all publications are solely those of the individual author(s) and contributor(s) and not of MDPI and/or the editor(s). MDPI and/or the editor(s) disclaim responsibility for any injury to people or property resulting from any ideas, methods, instructions or products referred to in the content. |
© 2025 by the author. Licensee MDPI, Basel, Switzerland. This article is an open access article distributed under the terms and conditions of the Creative Commons Attribution (CC BY) license (https://creativecommons.org/licenses/by/4.0/).