Article

Terminal Voltage and Load Frequency Regulation in a Nonlinear Four-Area Multi-Source Interconnected Power System via Arithmetic Optimization Algorithm

by
Saleh A. Alnefaie
*,
Abdulaziz Alkuhayli
and
Abdullah M. Al-Shaalan
Electrical Engineering Department, College of Engineering, King Saud University, Riyadh 11421, Saudi Arabia
*
Author to whom correspondence should be addressed.
Mathematics 2025, 13(19), 3131; https://doi.org/10.3390/math13193131
Submission received: 26 August 2025 / Revised: 22 September 2025 / Accepted: 28 September 2025 / Published: 30 September 2025
(This article belongs to the Special Issue Artificial Intelligence and Optimization in Engineering Applications)

Abstract

The increasing integration of renewable energy sources (RES) and rising energy demand have created challenges in maintaining stability in interconnected power systems, particularly in terms of frequency, voltage, and tie-line power. While traditional load frequency control (LFC) and automatic voltage regulation (AVR) strategies have been widely studied, they often fail to address the complexities introduced by RES and nonlinear system dynamics such as boiler dynamics, governor deadband, and generation rate constraints. This study introduces the Arithmetic Optimization Algorithm (AOA)-optimized PI(1+DD) controller, chosen for its ability to effectively optimize control parameters in highly nonlinear and dynamic environments. AOA, a novel metaheuristic technique, was selected due to its robustness, efficiency in exploring large search spaces, and ability to converge to optimal solutions even in the presence of complex system dynamics. The proposed controller outperforms classical methods such as PI, PID, I–P, I–PD, and PI–PD in terms of key performance metrics, achieving a settling time of 7.5 s (compared to 10.5 s for PI), overshoot of 2.8% (compared to 5.2% for PI), rise time of 0.7 s (compared to 1.2 s for PI), and steady-state error of 0.05% (compared to 0.3% for PI). Additionally, sensitivity analysis confirms the robustness of the AOA-optimized controller under ±25% variations in turbine and speed control parameters, as well as in the presence of nonlinearities, demonstrating its potential as a reliable solution for improving grid performance in complex, nonlinear multi-area interconnected power systems.

1. Introduction

1.1. Background and Related Work

The implementation of smart grid technology and the growing integration of RESs are causing a fast change in modern power infrastructures. Controlling the output power while keeping the load frequency, terminal voltage, and tie-line power at zero deviations is a primary control goal in IPSs. AVR and LFC systems are vital in maintaining rated voltage and frequency, thereby ensuring a dependable and consistent power supply to consumers. Given the constantly changing nature of load dynamics, mismatches between power production and consumption can lead to undesirable variations in voltage and frequency. LFC mitigates frequency deviations by adjusting active power via speed governor action, while AVR manages terminal voltage by modifying reactive power through generator excitation. Additionally, tie-line connections facilitate power exchange between different control areas, further complicating system management. Designing a reliable and intelligent control mechanism to diminish oscillations in system load frequency, terminal voltage, and tie-line power remains a critical challenge [1,2].
Recent applications of metaheuristic optimization techniques across various energy systems demonstrate their broad applicability and potential for extending the current work. For instance, ref. [3] propose a multi-objective optimization framework for electric vehicle-integrated distribution grids using the Hiking Optimization Algorithm, highlighting the growing importance of smart grid solutions. Similarly, ref. [4] utilize the Arithmetic Optimization Algorithm (AOA) to optimize fuel economy in hybrid electric vehicles, showcasing the power of metaheuristics in transportation. In the domain of renewable energy, ref. [5] focus on the optimal allocation of storage capacity in distribution networks to support renewable energy integration, demonstrating how metaheuristic methods can optimize grid storage solutions. Additionally, ref. [6] provide an extensive review of metaheuristic optimization in electric vehicles, further illustrating the diverse applications of these techniques in modern energy systems and electric mobility. These studies emphasize the versatility of metaheuristics and suggest potential extensions of the present research into other areas of energy optimization.
The literature on LFC and AVR is vast, but many studies primarily enumerate controller types and optimization techniques without critically discussing their limitations. For example, classical controllers such as PI and PID are still widely used, but they often fail to achieve optimal performance under complex, nonlinear conditions. On the other hand, recent advancements in optimization techniques, including Spider Wasp Optimizer-optimized Cascaded Fractional-order Controllers [7] and Fractional-order PID Controllers using Aquila Optimization [8] have shown promise but still face challenges in accurately modeling and regulating multi-source systems with significant renewable energy integration. Moreover, Model Predictive Control (MPC) methods have also been explored, particularly for systems that consider wind power forecasting, but they are often computationally expensive and can struggle with real-time applications [9]. A critical review of these approaches highlights the need for more adaptive and efficient control structures that can handle the increasing complexity of modern power systems. By discussing these recent developments in detail, we can clearly position our proposed approach within the existing body of work, demonstrating its unique advantages.
In addition, significant research has focused on enhancing the control of LFC and AVR loops. Ali et al. proposed various PI-PD controllers based on LPBO, AOA, MPSO, and DO for multi-source, multi-area intrusion prevention systems with and without nonlinear phenomena to regulate terminal voltage and frequency effectively. Chandrakala and Balamurugan employed a novel Ziegler–Nichols (ZN) technique and simulated annealing (SA) for adjusting a PID controller for stabilizing a dual-area IPS [10], while Gupta and Srivastava introduced a combined NN-FTF controller to improve response times in single-area systems [11]. The authors Devashish Sharma et al. offered ZN for tuning FLC and PID controls to improve single-area IPS dynamics [12]. Rumi and Lalit demonstrated that LSA-optimized PIDF/PIDuF controllers perform better than conventional techniques for a nonlinear, dual-area, integrated four-sources IPS [13], while Deepak and Ajit applied MFO-based FOPID to similar systems [14]. A. K. Sahani et al. used FA-based PID control for power system stability in a two-area IPS [15], while Javed and Zahra created a single-area system combining hydro, thermal energy, and gas components using an IPSO-based CPSS [16]. Naga Sai Kalyan and Sambasivan proposed a DE-AEFA-tuned PID controller that improved performance in IPSs with nonlinearities like RFBs, HVDC links, and IPFC [17,18]. In order to further improve system responsiveness using UPFC and RFB, Abhineet and Parida proposed that SCA tuned the PI and PIDF controls [19]. Nahas et al. used NLTA to optimize a PID regulator for a two-area IPS with linearity [20], and Naga Sai Kalyan developed a GWO technique for tuning the PIDD controller incorporating SMES and UPFC for nonlinear systems [21]. Finally, Anusha et al. employed FA-tuned PID control for a nonlinear, two-area, four-source IPS, achieving improved dynamic response [22].
To enhance IPS performance, Oladipo et al. implemented a controller named PIDA optimized using a hybrid hFPAPFA technique for a one-area, with one source system [23]. A TIDF controller tuned with the Harris Hawks Optimization (HHO) technique was proposed for two sources in a three-area nonlinear IPS [24]. A second-order error-driven ADRC method in a three-area IPS that integrates electric vehicles, geothermal, solar energy, and wind resources was investigated by Ali et al. [25]. Satish Kumar Ramoji et al. suggested a HHO for tuning a dynamic controller named 2DOF I-TDF for a complex three-area system with two resources: IPS with dish stirling, solar energy, and wind resources, and thermal components, which showed superior performance [26]. Additionally, Ramoji proposed an ACFPD-TID controller for a double area, with four resources, nonlinear IPS integrated GDB and GRC nonlinearities, optimized using AFA [27].
Biswanath Dekaraja proposed a CFOTDN-FOPDN controller for a double area integrated four sources and nonlinearities IPS [28], while an AFA tuned the CPDN-FOPIDN control was implemented in triple areas IPS through nonlinearities like GRC and GDB [29]. Fayek Eugen Rusu and Hady H. studied a DPO for tuning a controller named PIDA for dual areas, with ten sources of IPS integrating solar power and a bioenergy system [30]. Naga Sai Kalyan et al. used energy storage systems (ESS) like RFBs, SMES, and UCs in an HAEFA-tuning fuzzy-PID controller for a dual area, with three sources IPS, showing RFBs to be particularly effective in reducing frequency and voltage oscillations [31]. In ref. [32], GBO was used to optimize an FPIDD2 controller in a dual zone IPS integrated with nonlinearities like GRC, CTD, and GDB, showing superior performance in frequency and voltage stabilization. The FTIλDN controller tuned via ICA and enhanced with asymmetrically spaced MFs was proposed in ref. [33] for two- and five-area IPSs with GRC and GDB, delivering improved dynamic responses and validated through real-time hardware-in-the-loop testing. Despite extensive LFC research, fewer studies have tackled integrated LFC-AVR systems. Numerous nature-inspired algorithms have been applied to optimize LFC [34,35,36,37,38,39], while AVR control strategies have been addressed in ref. [40,41,42,43]. A GBO for tuning PID control for a four-area multi-source IPS without nonlinearities was explored in [44], outperforming other methods under a 5% step-load perturbation and proving its reliability through sensitivity analysis.
An adaptive energy monitoring approach was put out in ref. [45], to address power supply fluctuations and renewable energy uncertainty in islanded microgrids (MGs) in smart cities. Deep reinforcement learning, and an intelligent probability wavelet fuzzy neural network are combined in this technique (IPWFNN-DRLA), utilizing a soft actor–critic algorithm for active power and frequency control in both offline and decentralized modes, achieving over 98% accuracy and significantly reducing computation time and burden. Similarly, ref. [46] presented a voltage and frequency control strategy for microgrids using an intelligent IPWPNFIA in conjunction with both RES and ESS. By employing central/local controllers, asymmetric membership functions, and demand response programs, the system validated via MATLAB/Simulink and RT-LAB achieved real-time response, improved control, and better protection coordination.
In ref. [47], a power control and management approach for islanded MGs with RES and ESS components was proposed, using a sequential distributed approach and MDMMPC for power control. This setup, validated through simulations and HIL testing with a Micro Lab Box and dSPACE, ensures reduced converter fluctuations, low overshoot, and fast, distributed control. A hierarchical, data-driven strategy for MIES using MADRL, integrating RERs, ESSs, and IDR programs, was introduced in ref. [48], showing reductions in operational, risk, and pollution costs by over 19%, and offering fast and efficient smart city energy control. In ref. [49], the optimal sizing and placement of ESSs in MGs is addressed through a bilevel optimization framework using APT-FPSO. The approach minimizes frequency fluctuations and enhances voltage stability and power loss mitigation, validated through eigenvalue analysis and sensitivity studies.
In ref. [50], the issue of frequency fluctuations in microgrids (MGs) with high renewable energy integration is addressed through a load frequency control (LFC) approach that combines a wind energy and diesel generator in a diesel-wind-based microgrid (DWMG). A PID controller enhanced with integral sliding mode control (I-SMC) is tuned using the Gorilla Troops Optimizer (GTO), resulting in enhanced frequency stability, decreased settling time, and lower integral error compared to existing methods. Similarly, in ref. [51], an S-µG integrating wind, solar energy, diesel generators, and a flywheel ESS is stabilized utilizing a wild horse optimizer (WHO) aided fuzzy tilt integral derivative with a filter-one plus integral (FTIDF-(1+I)) control. This method handles nonlinearities and system uncertainties better than traditional controllers and other optimizers such as PSO and GWO, achieving notable reductions in frequency deviations. In ref. [52], an MPA-assisted (1+PDF)-FOPI controller is proposed for standalone MGs integrating PV, wind, diesel generators, ultracapacitors, and flywheels. The controller manages load mismatches effectively, maintains frequency deviation within −0.016 Hz (within IEEE limits), and demonstrates superior performance over conventional strategies, validated using the IEEE-39 bus system.

1.2. Research Gap and Motivation

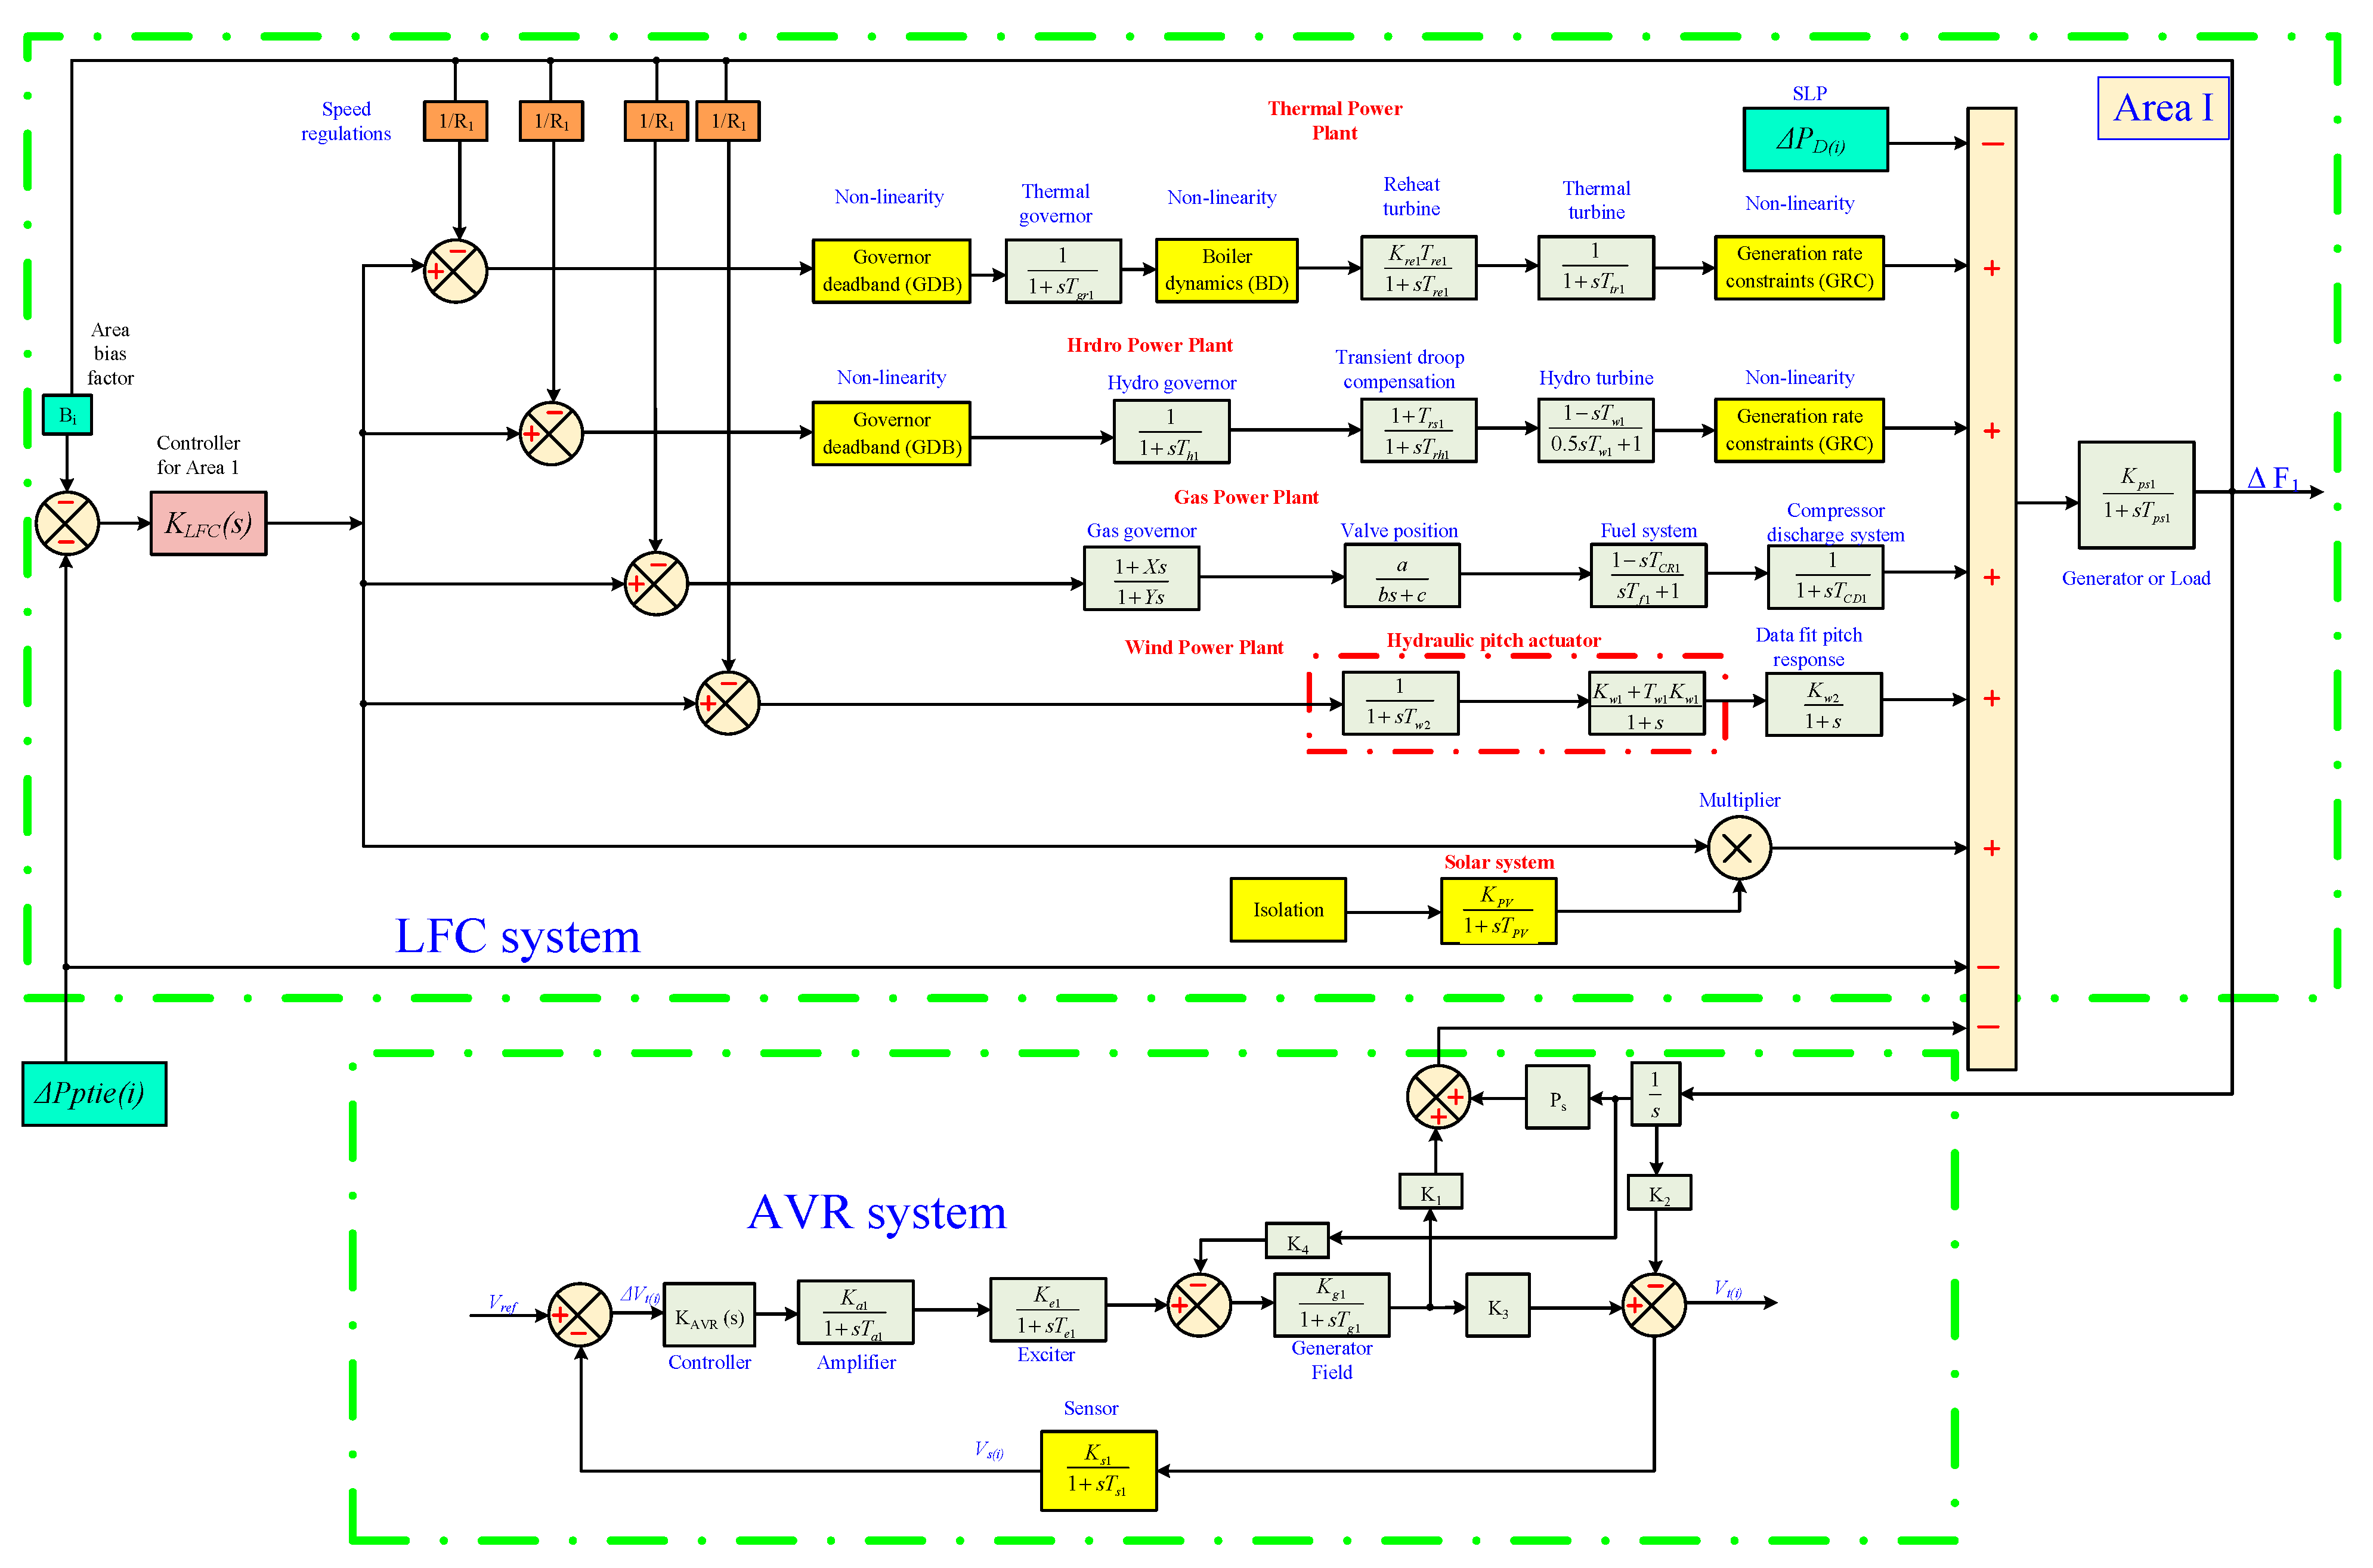
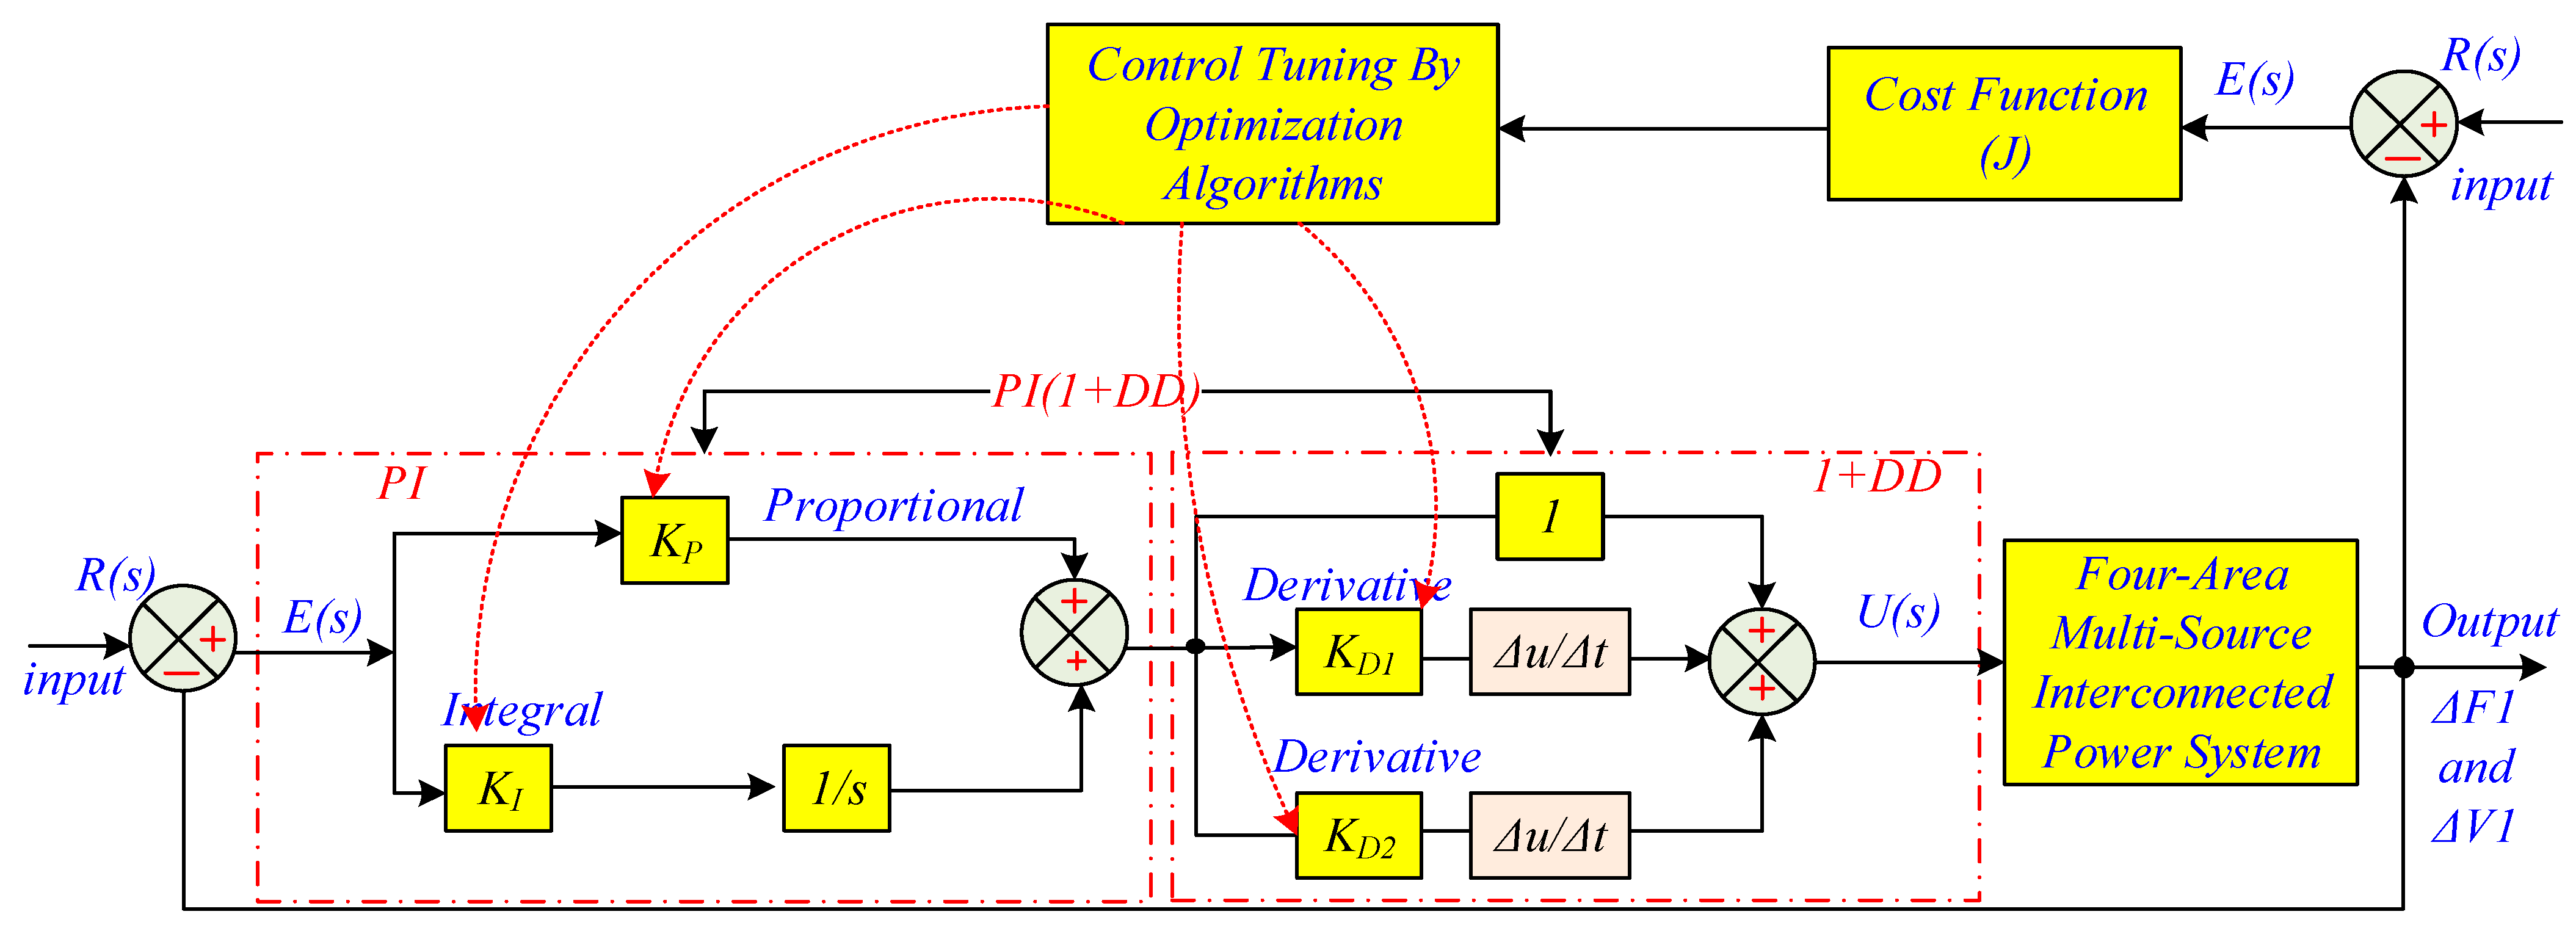
The intricate structure of IPSs has posed significant challenges, and so far, no comprehensive study has explored the combined control of LFC and AVR in four areas: integrated multi-source IPS with GDB, GRC, and BD nonlinearities. To bridge this research gap, the present study investigates a four-area IPS setup, where each area includes five generation components, among which are three conventional types and two RES (solar energy and wind turbine). The proposed novel AOA, a recently established metaheuristic technique, is utilized to determine the optimum gains for several controllers, including PI, PI-PD, I-PD, I-P, PI(1+DD), and PID. The goal is to enhance dynamic responsiveness and the overall system’s performance while dealing with the difficulties of multi-source power production and nonlinear impacts. Figure 1 depicts the proposed LFC and AVR structures for integrated power systems incorporating RES.
In addition, while many recent variants of the PID controller, such as the BELBIC PID [53,54,55], Sigmoid PID [56,57], and Neuroendocrine PID controllers [58], have been developed to improve performance in complex systems, but they still encounter significant limitations in multi-area interconnected power systems. The BELBIC PID controller, for example, is effective in simple systems but may struggle with the nonlinearities and time-varying nature of modern power grids. Similarly, the Sigmoid PID and Neuroendocrine PID controllers, while effective in specific applications, may not offer the same level of robustness and adaptability required in power systems with high levels of renewable energy integration. The PI(1+DD) controller, optimized using the AOA, is particularly well-suited for these complex systems. Its ability to incorporate a derivative delay term helps mitigate overshoot and enhance transient stability, while the AOA optimization ensures that it can handle the nonlinear dynamics of RES more effectively. This makes the PI(1+DD) controller a more appropriate choice for the challenges of modern multi-area interconnected power systems, addressing the gaps left by other advanced PID variants.
In addition, the intermittent and unpredictable character of RES, such as wind and solar power components, presents substantial obstacles for their integration. These issues are further compounded by various system nonlinearities, including BD, GRC, and GDB. Together, these factors contribute to instability in power generation levels, making it difficult to maintain consistent system performance. Consequently, the design of robust and adaptive control strategies is essential to ensure system reliability and stability.
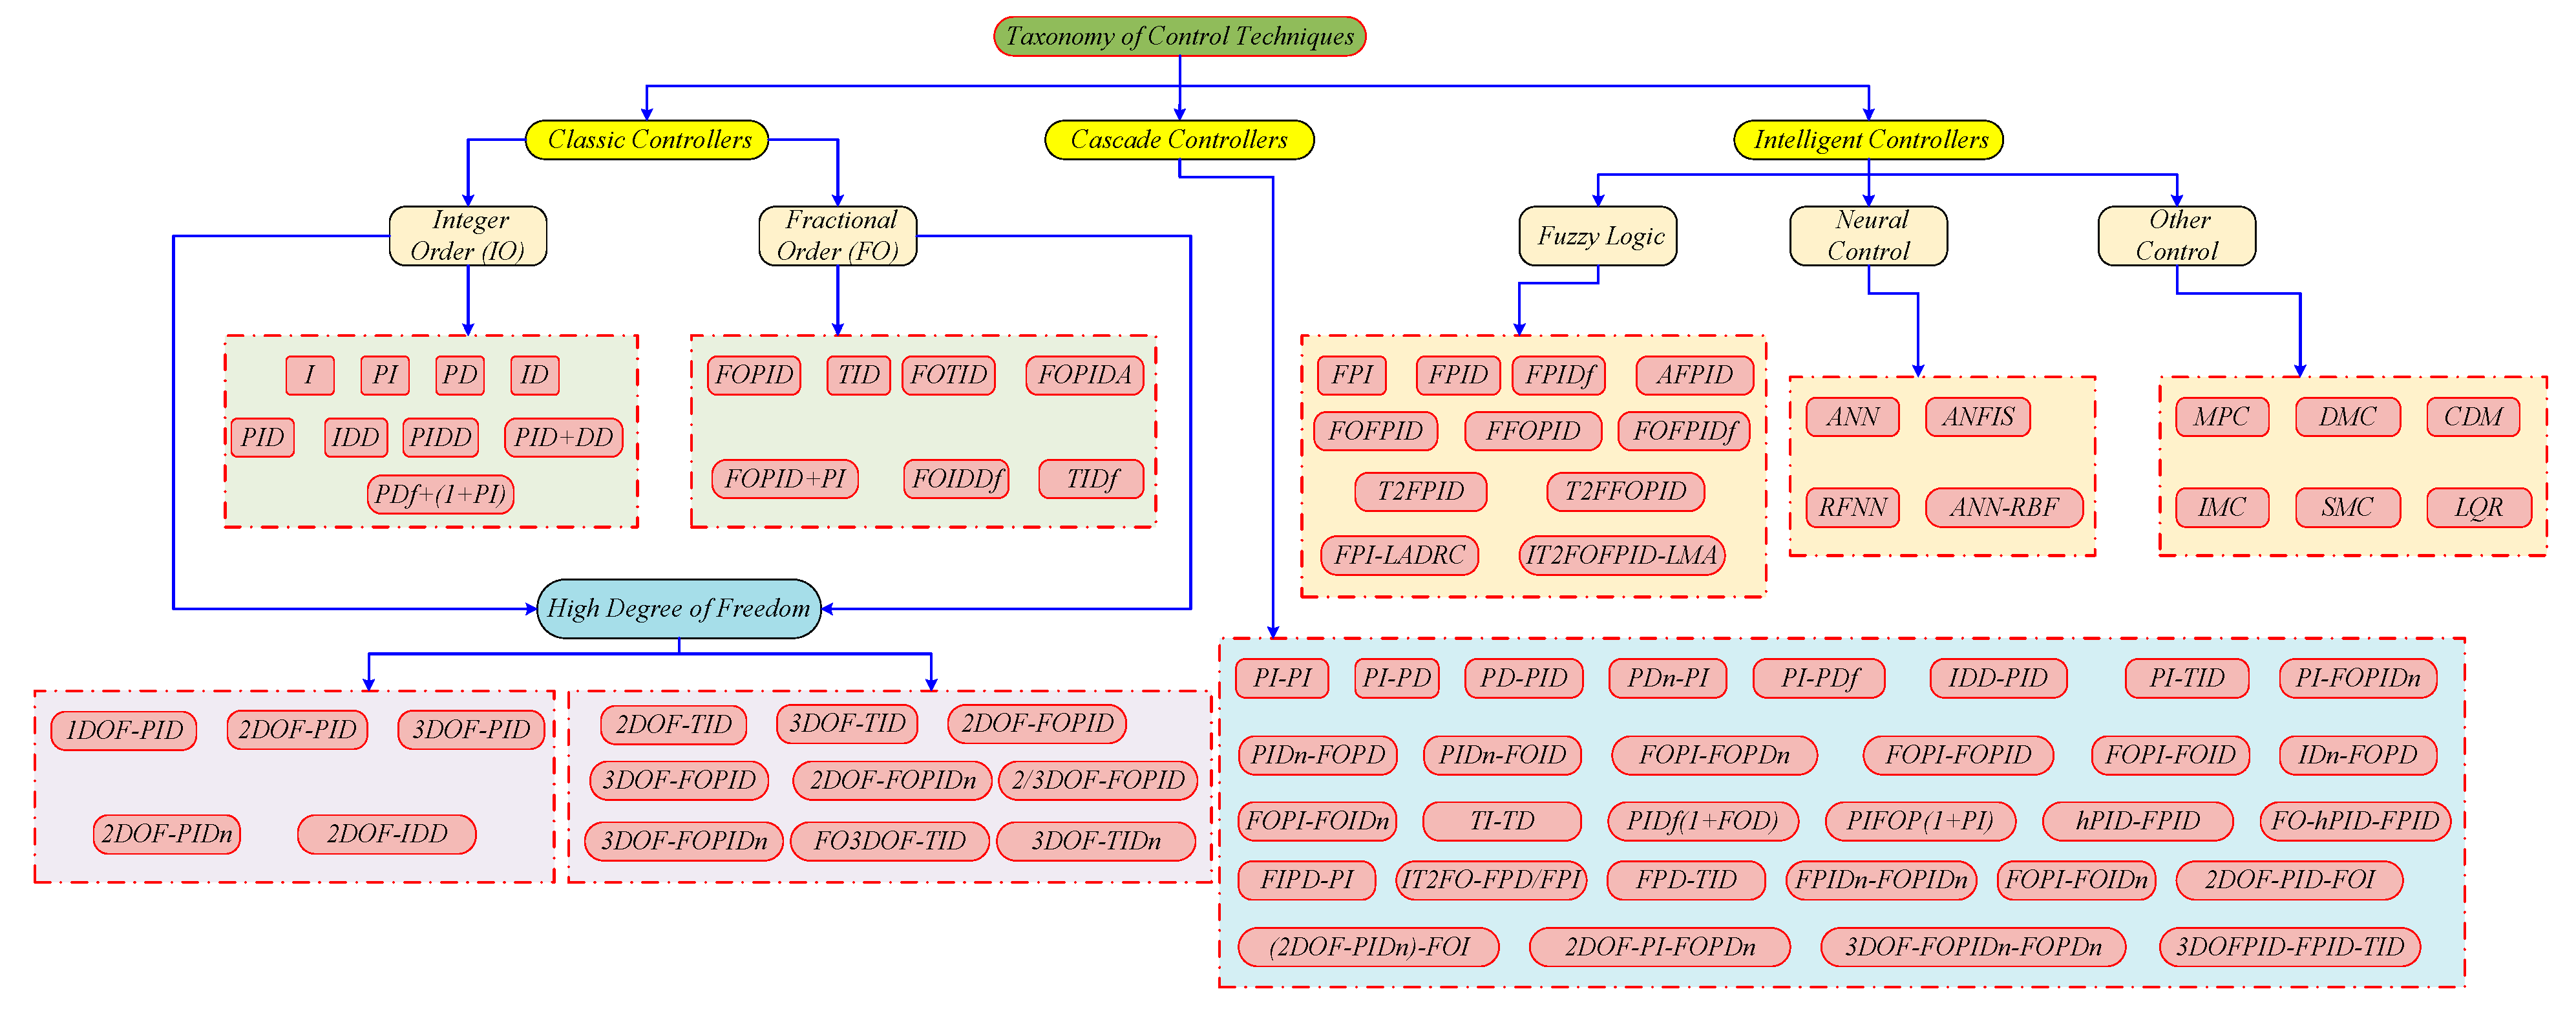
According to the comprehensive literature analysis, Figure 2 displays the categorization of the controller architectures that have been applied in the LFC and AVR problems. Controller designs addressing the LFC and AVR problems in electric power systems have been developed, simulated, and reported in a variety of configurations. Reducing the load frequency and tie-line power oscillations that arise when the operational circumstances of IPSs variation have been the aim of every study in the literature. The research conducted to diminish frequency and tie-line power oscillations or fluctuations reveals two key requirements. These are the optimization techniques and controller design that are used to maximize the controller’s settings. One of the best system characteristics for improving performance in the LFC and AVR problems is optimization methods. Furthermore, there are relative benefits and drawbacks to the controller structures created for the issue. Among the controller architectures utilized for the LFC and AVR problems, PID-based controllers are the most popular because they are better at dampening frequency and tie-line power oscillations and respond quickly to abrupt changes in the system. Table 1 offers an outline of the literature on coupled LFC-AVR. To address these challenges, this study employs the AOA to intelligently tune controller parameters. This approach enhances the adaptive capability of the system and enables effective management of the nonlinear complexities.
Key Gaps and Unresolved Challenges:
  • Integration of renewable energy sources (RES): Many studies overlook the complexities of integrating renewable energy sources (wind, solar, and hydro) into power systems, particularly regarding frequency and voltage regulation. This work addresses this by incorporating multiple RES into a unified control framework.
  • Nonlinear Dynamics: Existing research often simplifies power systems by assuming linear dynamics, neglecting the impact of nonlinearities such as boiler dynamics, governor deadband, and generation rate constraints. This study incorporates these nonlinearities for a more realistic model.
  • Optimization Methods for Controller Design: Traditional controllers like PI and PID are often optimized using basic techniques. This paper uses the novel Arithmetic Optimization Algorithm (AOA) to optimize the PI(1+DD) controller for better performance in complex systems.
  • Sensitivity to Parameter Variations: Most studies do not assess the impact of real-world variations in turbine and speed control parameters. This study performs a detailed sensitivity analysis to evaluate the robustness of the proposed control method.
  • Comparison with Recent Optimization Techniques: Previous research often lacks comprehensive comparisons between modern optimization techniques and classical controllers. This study benchmarks the AOA-tuned PI(1+DD) controller against both traditional and advanced methods.
The following is a summary of the main contributions of this study:
  • Development of a detailed four-area multi-source IPS model incorporating various nonlinearities and load disturbances.
  • Mathematical modeling of the proposed PI(1+DD) controller tailored for the four-area IPS architecture; formulation of fitness functions using AOA to control the optimum fine-tuning parameters of PI(1+DD) and other controllers.
  • A thorough comparative analysis between the AOA-PI(1+DD) controller and other AOA-based controllers, including AOA-I-PD, AOA-PID, AOA-PI, and AOA-I-P, demonstrating the superior performance of the AOA-PI(1+DD) configuration.
  • A thorough comparison showing a greater performance of the AOA technique over several sophisticated optimization methods, such as Leader Harris Hawks Optimization (LHHO), Walrus Optimization Algorithm (WaOA), Tornado Optimizer with Coriolis Force Algorithm (TOCFA), and Gray Wolf Optimization (GWO).
  • The performance and robustness of a proposed controller are thoroughly examined under a variety of circumstances, including abrupt load changes at t = 0, accidental load oscillations, power systems that frequently display nonlinearities such as GDB, BD, and GRC, timing-dependent reference voltages in all four positions, and fluctuations in system parameters of between −25% and +25%.

1.3. Paper Organization

The construction of this research work is prepared as follows: Section 2 offers a comprehensive description of the power system configuration. Section 3 details the proposed dynamic control strategies employed in the study. The functioning and mechanism of the AOA are explained in Section 4. Section 5 deliberates the output simulation outcomes analysis and discussions, and offers an in-depth analysis of the findings. Finally, Section 6 summarizes the work and suggests possible avenues of inquiry for further study.
Although significant progress has been made in the development of controllers for LFC and AVR in interconnected power systems, much of the existing literature focuses on enumerating different controller types and algorithms without a critical synthesis of their relative strengths and weaknesses. Recent studies often overlook the challenges posed by the integration of RES and the nonlinear dynamics inherent in power systems, such as boiler dynamics, governor deadband, and generation rate constraints. This paper advances the state of the art by not only presenting an innovative approach using the AOA to optimize a PI(1+DD) controller but also by addressing the limitations of classical control techniques in multi-area systems with RES integration. Compared to the most recent high-impact contributions, this work offers a more robust and adaptive solution for improving system stability and performance under highly dynamic conditions, with an emphasis on the real-world complexities of modern power systems.

2. The Proposed Interconnected Power Systems Modeling

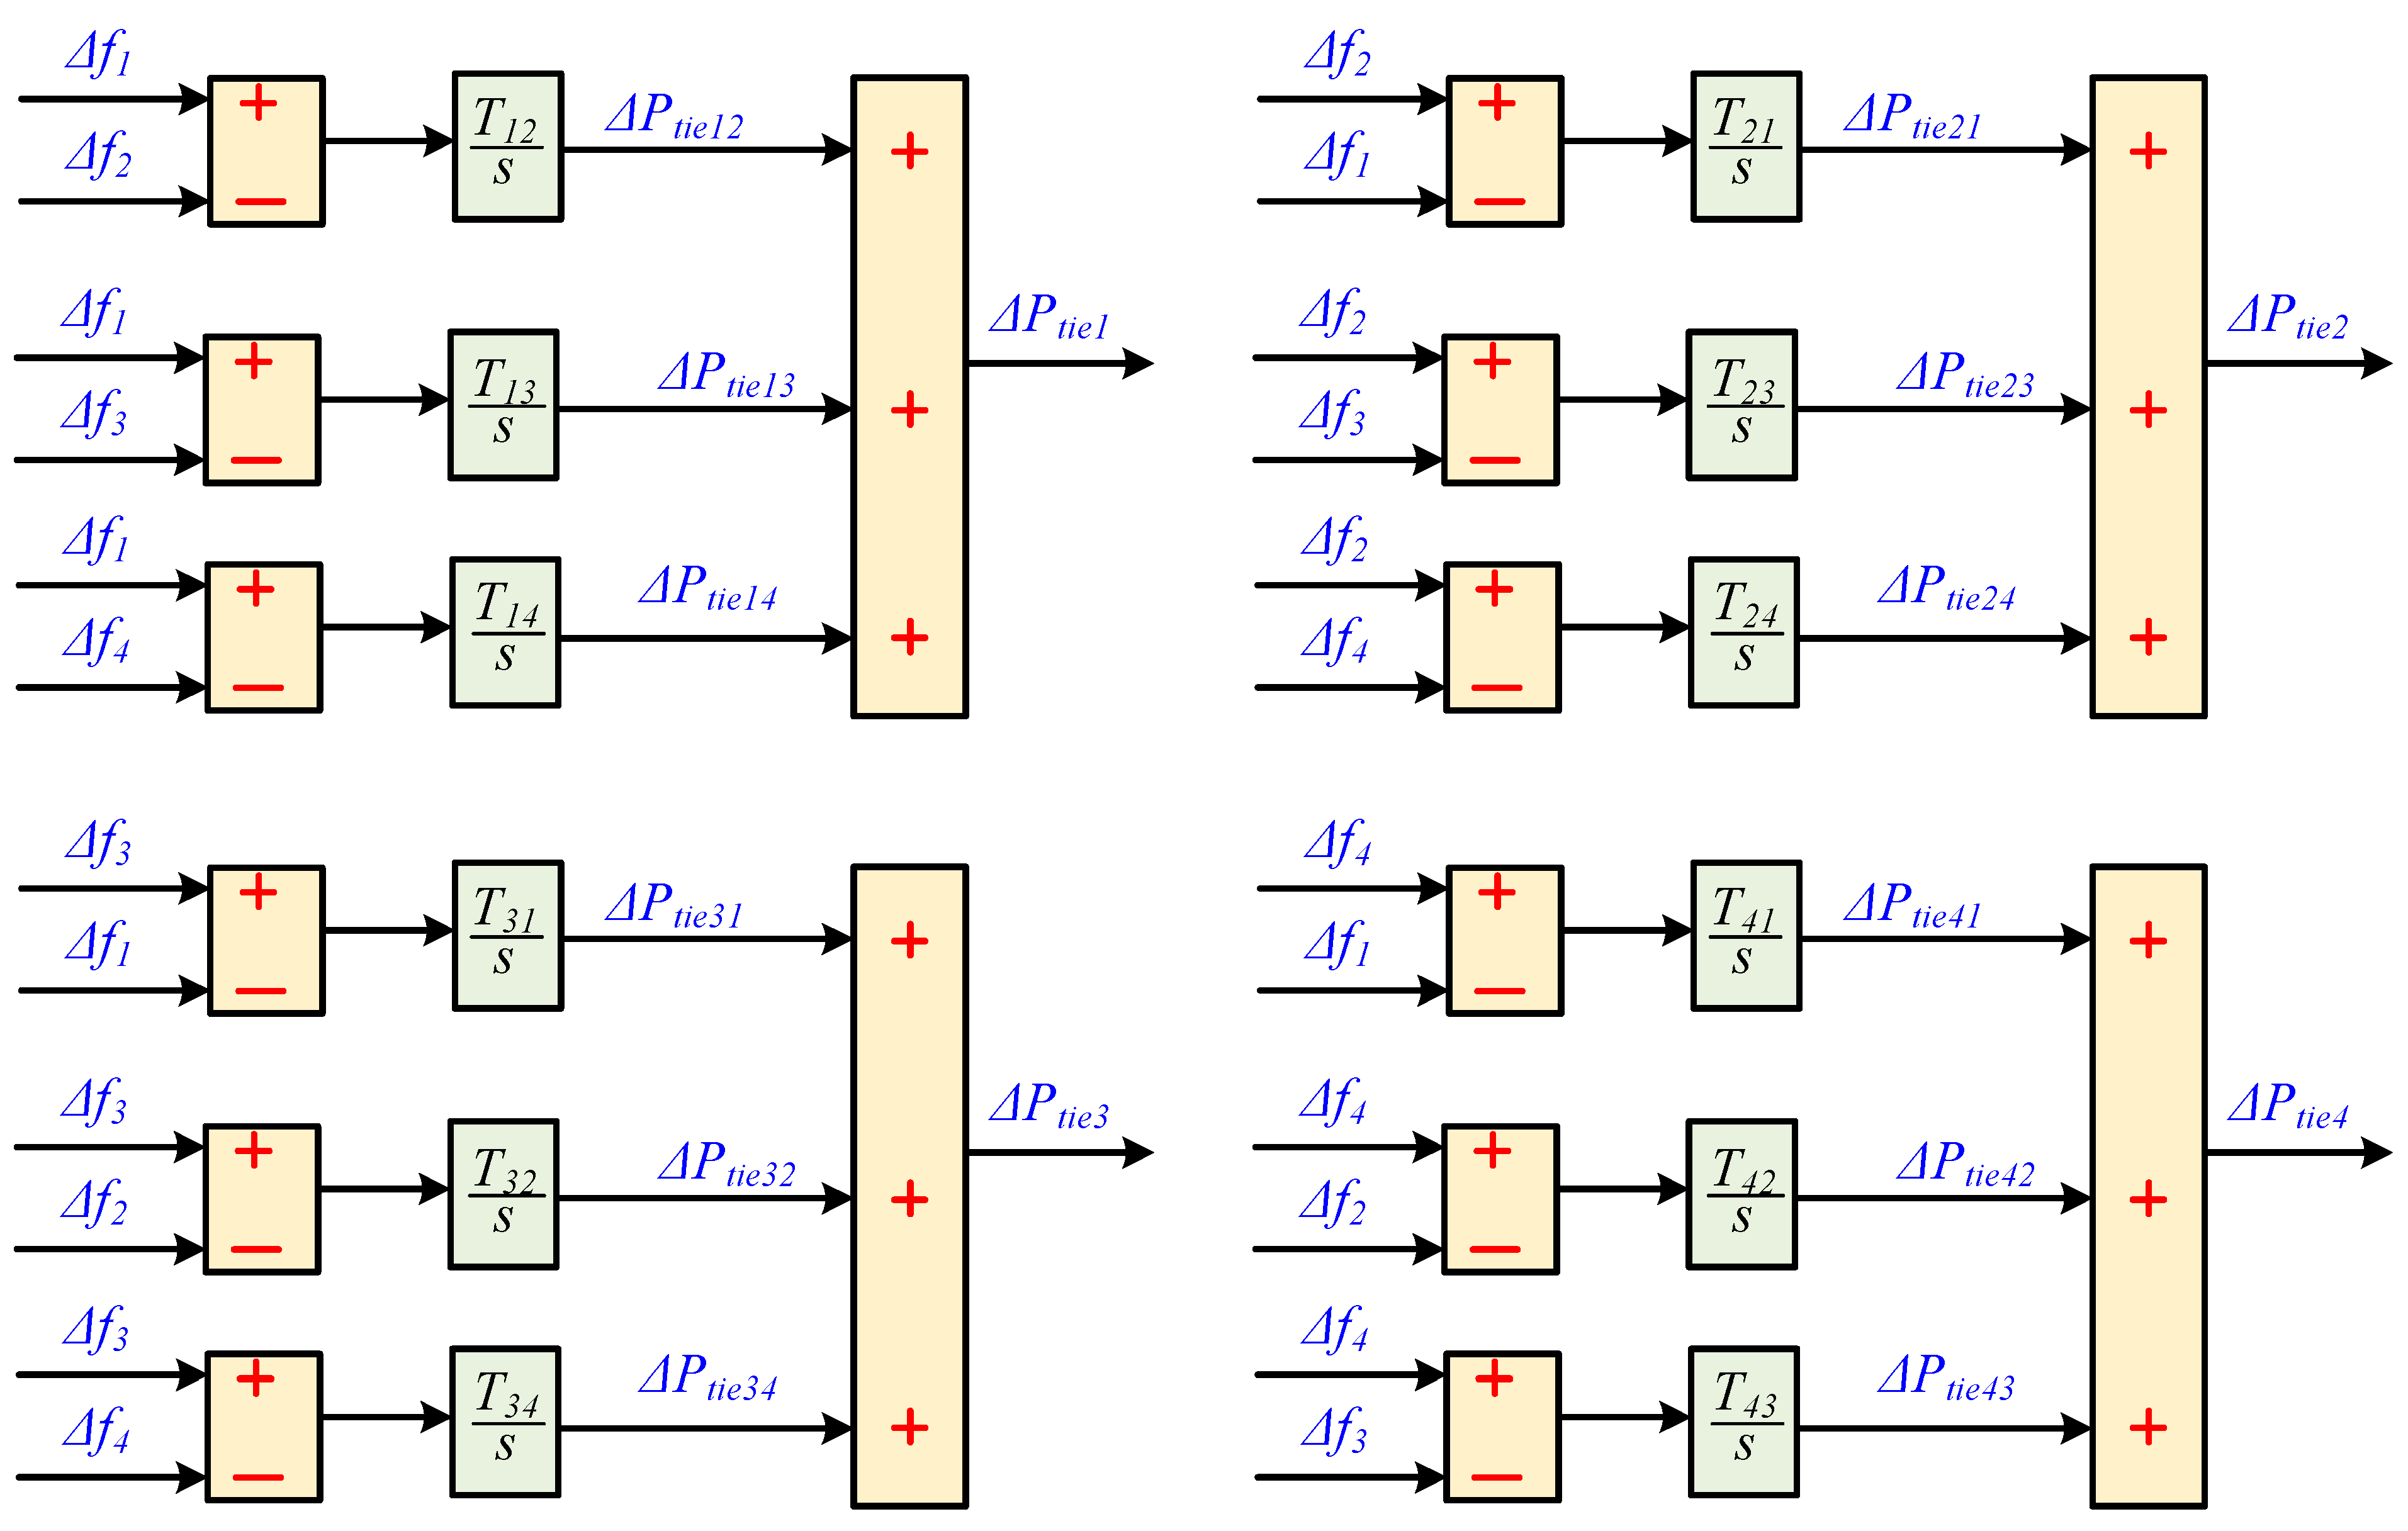
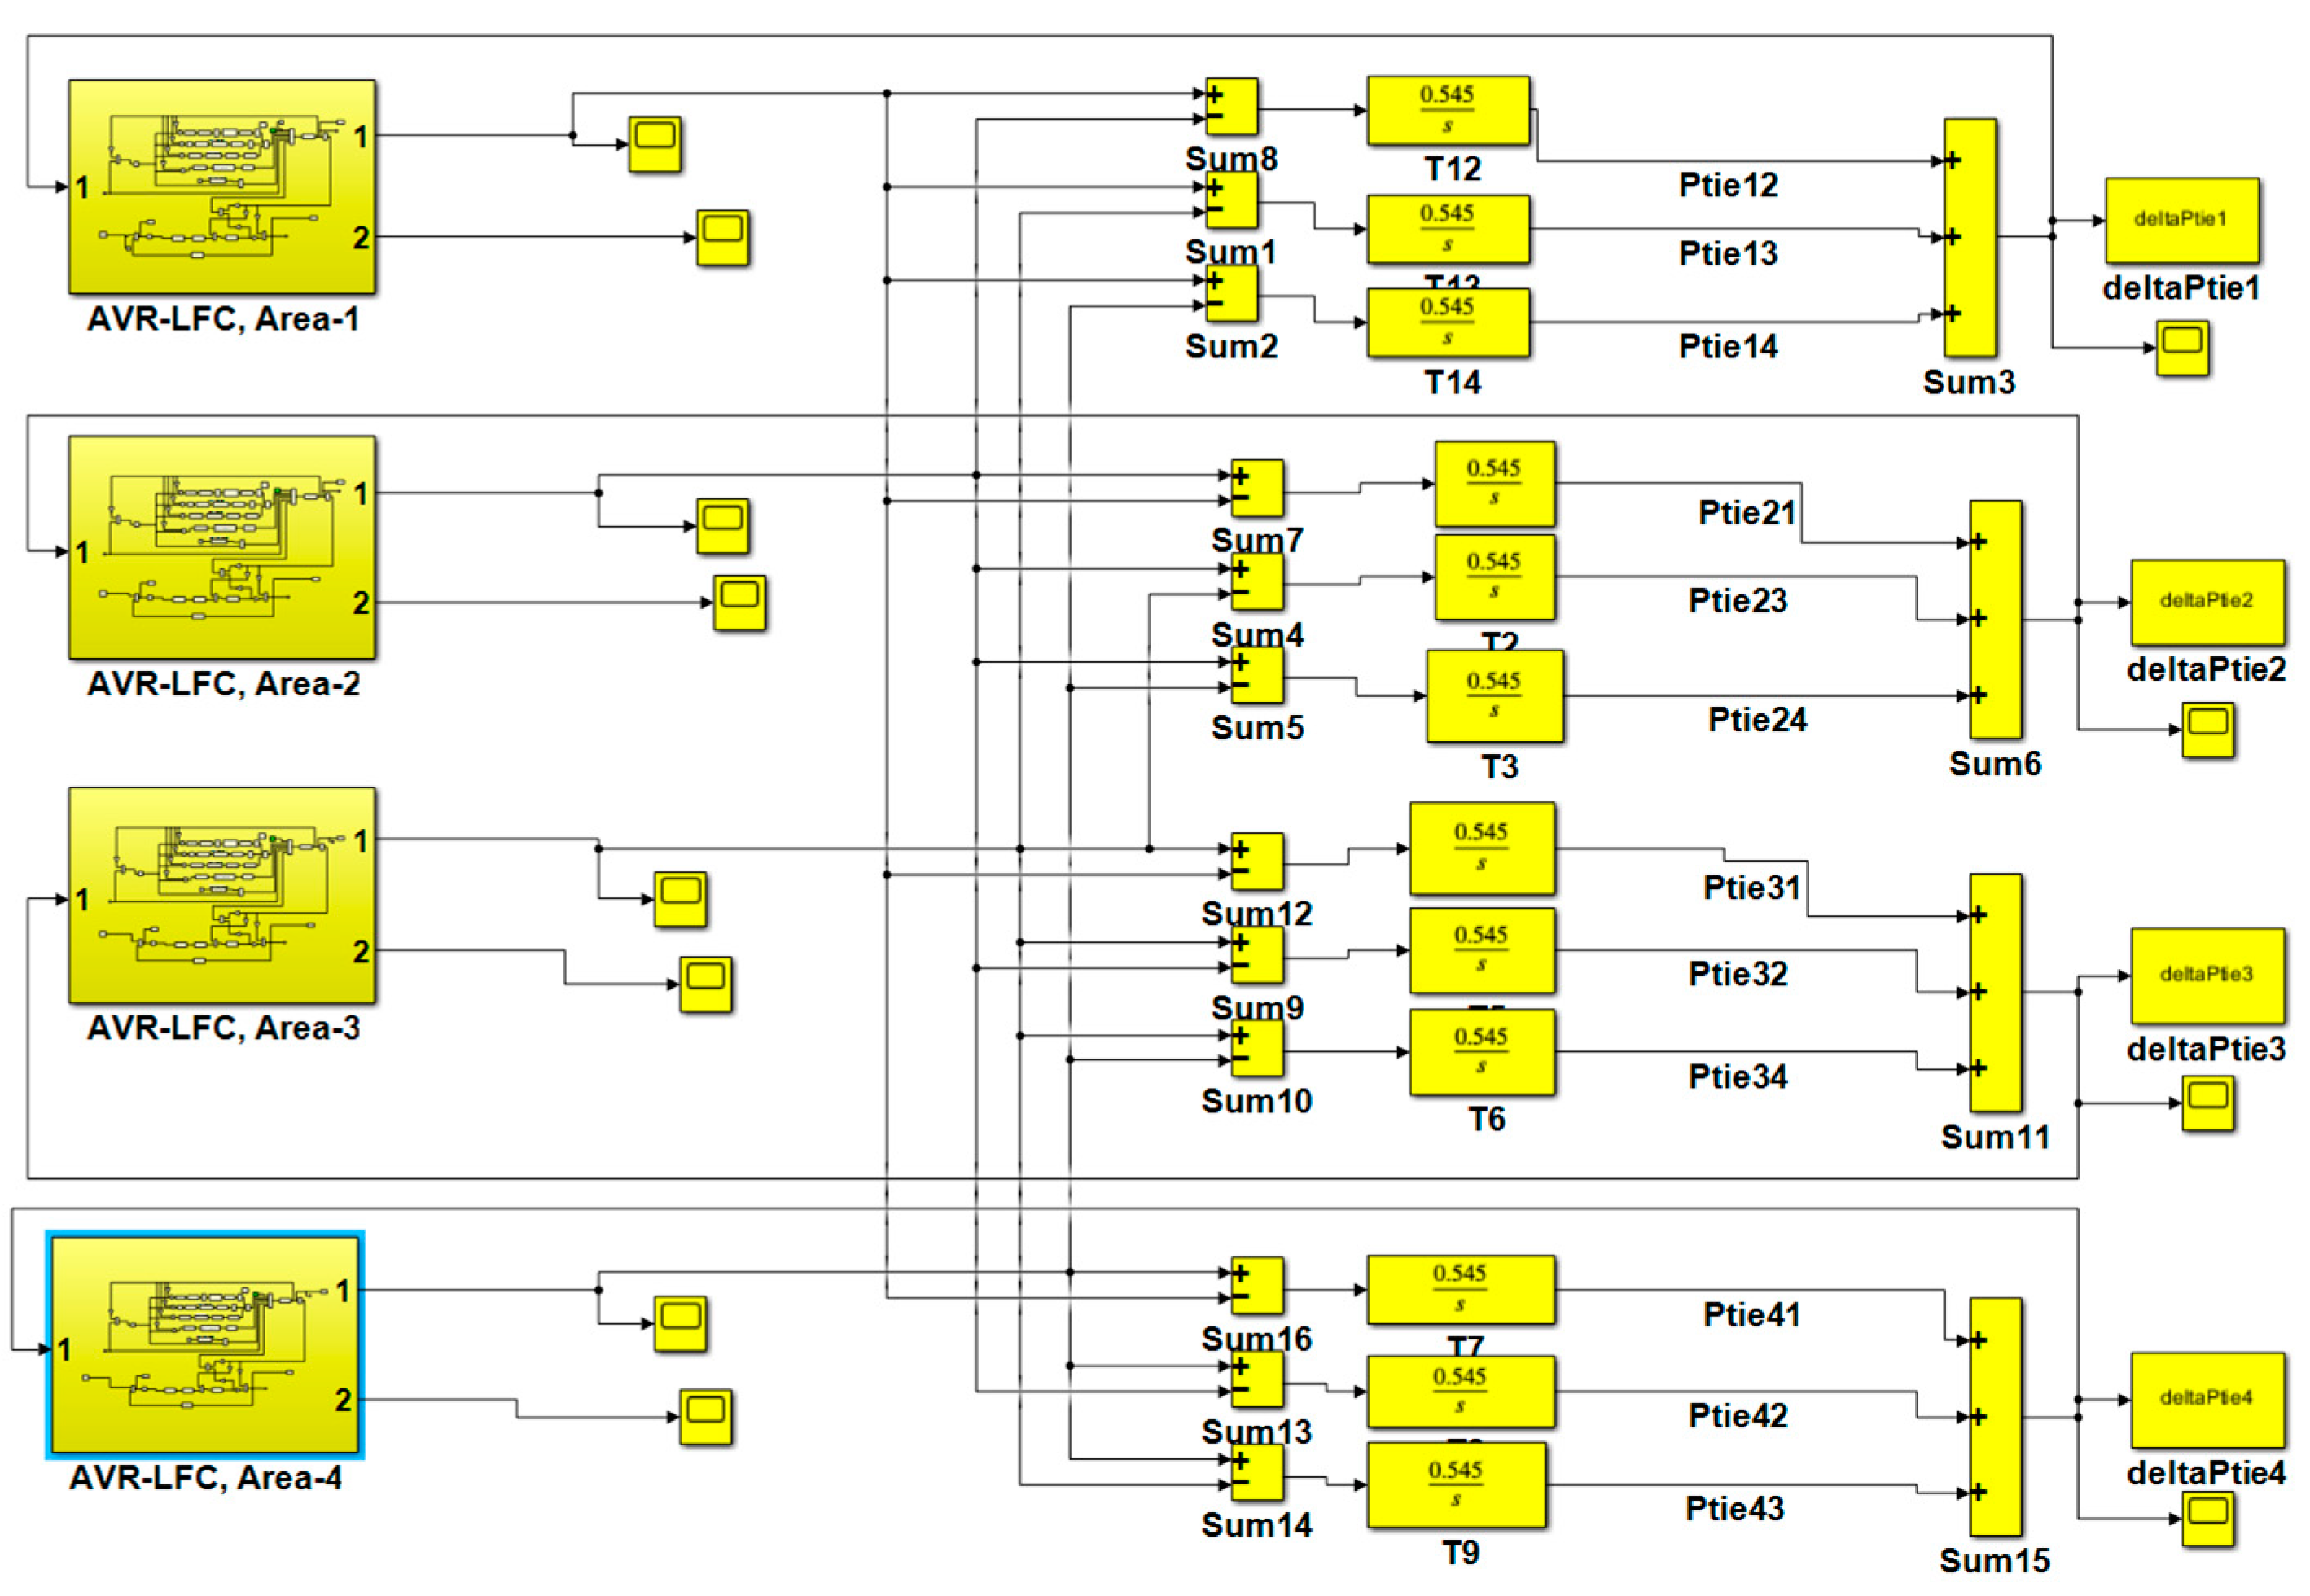
Figure 3 depicts the four-area multi-source IPS designs with both AVR and LFC loops. The two control loops are interconnected by various connection variables. The IPS includes four distinct areas, each powered by five types of energy sources: gas, hydro, thermal reheat, solar, and wind generation components. As shown in Figure 4, every LFC area is connected to the others via tie-lines. The LFC loop is accountable for preserving the desired power frequency within the IPS. The system’s time constants, gains, and other parameters are adopted from [17] and shown in Table 2. Lastly, Figure 5 shows the whole four-area linked power system with the appropriate tie-line connections. Control in the ith area’s LFC loop consists of thermal reheat speed regulation (Rt), hydro speed regulation (Rh), gas speed regulation (Rg), wind speed regulation (Rw), the area’s bias factor (Bi), the LFC controller KLFC(s), and generator/load dynamics K p ( i ) / ( 1 + s T p ( i ) ) . The thermal reheat unit is composed of three main components: a thermal governor represented by 1 / ( 1 + s T g r ) , a reheat turbine modeled as K r e T r e / ( 1 + s T r e ) , and a thermal turbine described by 1 / ( 1 + s T t r ) . The hydro unit comprises three components: transient droop compensation, represented by ( 1 + s T r s ) / ( 1 + s T r h ) ; a hydro governor modeled as 1 / ( 1 + s T h ) ; a hydro turbine characterized by ( 1 s T w ) / ( 1 + 0.5 s T w ) . The gas unit consists of four components: a gas governor represented by ( 1 + s X ) / ( 1 + s Y ) , a valve position control modeled as a / ( s b + c ) , a fuel system described by ( 1 s T C R ) / ( 1 + s T f ) , and a compressor discharge system given by 1 / ( 1 + s T C D ) . The wind generation unit includes two main components: a data-fitted pitch response block and a hydraulic pitch actuator block. The solar photovoltaic system is modeled using a simple step function. ΔPD(i), ΔPtie(i), ΔVt(i), and Δf(i), represent the deviations in load, tie-line power, AVR, and LFC, respectively. Vs(i), Vref(i), Ve(i), and Vt(i), indicate the sensor voltage, reference voltage, error voltage, and terminal voltage in the ith area, respectively. The AVR loop of the ith area consists of five components: an amplifier represented by K a ( i ) / ( 1 + s T a ( i ) ) , a generator modeled as T g ( i ) / ( 1 + s T g ( i ) ) , an exciter given by K e ( i ) / ( 1 + s T e ( i ) ) , a sensor described by K s ( i ) / ( 1 + s T s ( i ) ) , and a controller denoted as KAVR(s). Various coupling coefficients, such as K1, K2, K3, K4, and Ps, are utilized to couple the AVR and LFC loops. The synchronization coefficient between the ith and jth areas is denoted by Tij. Equations (1)–(5) give the transfer functions for the gas GG(s), reheat thermal GT(s), hydro GH(s), wind GW(s), and solar photovoltaic GS(s) systems, respectively.
G G ( s ) = ( 1 + s X ) ( 1 s T C R ) ( 1 + s Y ) ( c + s b ) ( 1 + s T F ) ( 1 + s T C D )
G T ( s ) = 1 + s T r e K r e ( 1 + s T g e ) ( 1 + s T r e ) ( 1 + s T t r )
G H ( s ) = ( 1 + s T r s ) ( 1 s T w ) ( 1 + s T h ) ( 1 + s T r h ) ( 1 + 0.5 s T w )
G W ( s ) = K w 1 K w 2 ( 1 + s T w 1 ) ( 1 + s T w 2 ) ( s 2 + 2 s + 1 )
G S ( s ) = K P V ( 1 + T P V )
The AVR must keep the voltage of a synchronized at a specific level. To determine the error voltage, it continually compares the voltage produced by the generator with an initial signal. After being amplified, this mistake is transmitted to the exciter, which modifies the generating field’s excitation appropriately. By swiftly adjusting any variations in terminal voltage, this procedure aids in system stabilization. Various nonlinear effects have been incorporated into thermal reheat and hydropower plants, including GRC, GDB, and BD. These nonlinearities are introduced to enhance the realism and accuracy of the system model.

2.1. Governor Deadband (GDB)

GDB represents the range of stable state speed deviations that do not trigger any movement in the governor valve. It is commonly represented as a proportion of the maximum rapidity allowed and represents the sensitivity or inconsiderateness of the acceleration control machine [25]. GDB is modeled using a backlash-type nonlinearity. For hydropower plants, the GDB is set at ±0.02%, while for thermal reheat plants, it can be calculated using Equation (6).
G D B = 0.0637 + 0.8 1 + s

2.2. Generation Rate Constraint (GRC)

In steam turbines, GRC arises from both mechanical and thermodynamic limitations. These constraints are primarily due to saturation nonlinearity, which significantly restricts the steam turbine’s performance. Ignoring GRC during power plant modeling can result in severe system oscillations and potential wear on the governor mechanism. Typically, thermal power plants have lower GRC values compared to hydropower plants. For hydropower units, the GRC is 270%/min during ramp-up and 360%/min during ramp-down. In contrast, thermal reheat power plants have an upper GRC limit of 3%/min [25].

2.3. Boiler Dynamics (BD)

The combustion control system is integrated into the boiler dynamics transfer function model, as illustrated in Figure 6. This model is adaptable and may be used for a variety of plant types, including gas or oil-fired plants with less accurate ignition control and coal-fired power stations with strictly controlled ignition. In most steam power plants, generation adjustments are made through turbine control valves. When the system detects changes in steam pressure or flow, the boiler control system promptly responds to maintain stability. The corresponding transfer function for boiler dynamics is depicted in Figure 6.

3. Proposed Dynamic Control Strategy

The primary goal of LFC is to rapidly reestablish the nominal values of the load fluctuation and regular frequency of the system throughout control areas in the event that additional disruptions or load variations modify them. To overcome this matter, settling time (ts), peaking overshoot (+ve), and peaking overshoot (−ve), ought to be optimized. As a result, managing frequency deviations requires an additional control loop.

3.1. Dynamic Model of Proposed Control System

Five controllers are utilized in this study to improve power system stability and dependability, resulting in constant frequency control. These are as follows.
  • Proposed PI(1+DD) controller.
  • Classical PID controller.
  • PI(PDN) controller.
  • I–P controller.
  • PD controller.
  • Proposed PI(1+DD) controller
The primary objective of load frequency control (LFC) is to minimize frequency fluctuations and load variations between interconnected areas as quickly as possible, restoring stability to conventional levels. Improvements are needed in areas such as settling time, overshooting, and undershooting to enhance system performance. To regulate frequency fluctuations more effectively, this study introduces a controller, PI(1+DD), which is designed to outperform traditional PID controllers by incorporating an additional derivative action.
1.1 Controller Structure
The PI(1+DD) controller combines two levels of control: PI and DD. The controller structure is depicted in Figure 7, where the two components interact to provide improved transient response. The architecture features five adjustable parameters: Kp (proportional gain), Ki (integral gain), Kk1 and K2 (derivative gains), and a constant gain of 1. These parameters provide significant flexibility in adjusting the controller’s dynamic response.
1.2 Transfer Function Derivation
The transfer function of the PI(1+DD) controller is derived from the standard PI and DD components. The general form of the transfer function for the proposed controller is as follows:
G P I ( 1 + D D ) ( s ) = K P + K I s × 1 + s K D 1 + s K D 2
where Kp is the proportional gain, KI is the integral gain, KD1 and KD2 are the derivative gains for the DD component, and s is the Laplace transform variable.
This transfer function represents a combined effect of both PI and derivative actions. The PI term helps in minimizing the steady-state error, while the DD term enhances transient performance by adjusting the controller’s response to rapid changes in the system.
Equations (8)–(11) solve the optimization problem with limits between [−2, 2] with the following restrictions.
K P ( i min ) K P K P ( i max ) ,
K I ( i min ) K I K I ( i max ) ,
K D 1 ( i min ) K D 1 K D 1 ( i max ) ,
K D 2 ( i min ) K D 2 K D 2 ( i max )
1.3 Stability Analysis
For the controller to be effective, stability must be ensured under varying system conditions. The stability of the closed-loop system, where the controller interacts with the power system dynamics, can be analyzed using the Routh–Hurwitz criterion or the Nyquist stability criterion. The closed-loop transfer function is given by Equation (12):
G c l o s e d l o o p ( s ) = P ( s ) C ( s ) 1 + P ( s ) C ( s )
where P(s) is the plant transfer function (representing the power system dynamics), and C(s) is the controller transfer function. The poles of the closed-loop transfer function must lie in the left half of the complex plane to ensure stability.
To verify stability, we check the conditions under which the PI(1+DD) controller guarantees stable operation. The additional derivative action in the controller helps prevent excessive oscillations and enhances system damping, leading to improved transient stability. The stability margins, such as gain and phase margins, can be computed to confirm that the system remains stable under various load conditions and system uncertainties.
1.4 Justification of Parameter Choices
The parameter selection for the PI(1+DD) controller is crucial for achieving the desired performance. The proportional gain Kp governs the response strength to the error signal. The integral gain KI is chosen to eliminate steady-state error, while the derivative gains KD1 and KD2 help mitigate oscillations and improve the transient response. The choice of these parameters is guided by both empirical tuning and optimization techniques. To ensure robustness and adaptability, these parameters are tuned using the AOA, which maximizes system performance based on predefined criteria such as the Integral of Time multiplied by Squared Error (ITSE). The sensitivity of the system to variations in parameter values is also tested, confirming the stability and reliability of the proposed controller in different operating conditions.
1.5 Stability Conditions and Performance
A concise demonstration of stability conditions is presented using the Nyquist criterion and root locus techniques. The stability of the closed-loop system is ensured by selecting the controller parameters such that the system operates within acceptable stability margins, even with the inclusion of nonlinear dynamics. The optimization of the controller parameters guarantees that the system remains stable and responsive to load disturbances, thus providing better voltage, frequency, and tie-line power regulation.
2.
Classical PID controller
Figure 8a illustrates the straightforward design, dependability, and good affordability ratio of a standard PID control system. It needs fewer customer competencies and is more applicable in the engineering sector. By lowering overshoot and settling time, PID controllers can improve a system’s transient response. Implementing LFC with a PID control system significantly improves the overall stability and dependability of the power grid. The transfer function of the PID controller is described in Equation (13).
G P I D ( s ) = K P + K I s + s K D
where the PID variables for control are KP, KI, and KD. Equation (14) states that for the incorrect input ei(t), the power technique’s controller’s output is ui(t), where i = 1, 2.
u i ( t ) = K P i e i ( t ) + K I i e i ( t ) + K D i d e i ( t ) d t
3.
Cascaded I-PD controller
The I–PD (Integral–Proportional–Derivative) controller is a variation in the traditional PID controller that restructures the control architecture to achieve better performance, particularly in systems sensitive to derivative action on noisy signals, as seen in Figure 8b. Unlike the standard PID controller, which applies proportional (P), integral (I), and derivative (D) actions to the error signal, the I–PD controller splits the roles of each component differently across the control loop. In this configuration, only the integral action acts on the error signal, while the proportional and derivative actions are applied directly to the output signal rather than the error. This setup can be mathematically expressed as in Equation (15):
u i ( t ) = K I 1 s E ( s ) K P Y ( s ) K D s Y ( s )
where U(s) is the control signal, E(s) = R(s) − Y(s) is the error between the reference R(s) and the output Y(s), KI, KP, and KD are the control gains, respectively.
The key difference here is that in a standard PID controller, all three actions operate on E(s), while in an I–PD controller, the I term handles the error to eliminate steady-state deviation. The P and D terms act directly on the system output Y(s), providing immediate damping and stabilization. This structure helps minimize the effect of noise on the derivative component, since measurement noise usually affects the output signal more than the error signal. As a result, I–PD controllers are especially useful in high-performance systems where derivative filtering or noise handling is crucial, such as in motion control, robotics, or precise voltage/frequency regulation systems like AVR and LFC loops. Additionally, separating the integral action from the proportional and derivative terms simplifies tuning and often leads to more stable and predictable system behavior.
4.
Cascaded I–P controller
The I–P (Integral–Proportional) control is a less frequent but efficient variant of the classic PI controller in which the integral action is given to the error signal while the proportional action is provided directly to the system output rather than the error. As seen in Figure 8c, this control structure is essentially a rearrangement of the standard PI configuration, and it can offer advantages in systems that are prone to instability or require more damping and smoother control responses. The error between the starting point and the output serves as the foundation for both the proportional and integral actions in a traditional PI controller. However, in an I–P controller, the control signal is generated using two separate paths: one for the integral action based on the error, and one for the proportional action based solely on the output. The mathematical form of an I–P controller can be written as Equation (16):
u i ( t ) = K I 1 s E ( s ) K P Y ( s )
where E(s) = R(s) − Y(s) is the error between reference R(s) and output Y(s), KI and KP is the control gains.
This setup effectively allows the controller to maintain zero steady-state error through the integral term, while the proportional feedback from the output helps in stabilizing the system and damping out oscillations. One of the key benefits of the I–P controller is that it can be more robust to sudden changes or noise in the reference signal, since the proportional response is not directly tied to it but rather to the smoother system output. This makes it particularly useful in applications like voltage or frequency regulation in power systems, or in process control, where noise immunity and smooth behavior are important. Despite its less common use, the I–P controller is a valuable tool when designed and tuned appropriately, offering a balance between accuracy and stability in dynamic systems.
5.
PI(PDN) controller
The control capabilities of a conventional PID controller are inadequate in the presence of severe disturbances, such as wind changes or unforeseen load disturbances. Many researchers use different approaches based on optimization techniques to address these problems. In order to solve technical problems, including nonlinearities, uncertainty, complexity, and robustness, these optimization strategies optimize controller settings. To increase the power system’s LFC efficiency, the literature employs a variety of modified PID control structures, including fraction-order and multilevel PID control structures. The fractional-order PID controller (FOPID) indicates the proportional P, integral I, and derivative D orders of the control components using fractional numbers rather than integers. When compared to standard PID controls, cascaded and intelligent FO controllers will perform better and provide quicker disturbance rejection [63].
In this study, we investigated cascaded PI (PDN) controllers using the recently developed brown bear optimization method to improve the frequency stability of the power system. The suggested cascaded PI(PDN), a dual controller hybrid, is shown in Figure 8d. The output of the PI controller serves as the input set point for the PDN controller. With this dual-stage control method, supply and internal disruptions can be effectively managed. Early rejection of disturbances by the controller prevents them from affecting other parts of the plant. System performance is influenced by the derivative filter coefficient (N) of the PID controller. It can enhance control performance by determining the smoothness of the control action. The suggested PI(PDN) scheme and cost function are described in full in [64], utilizing Equations (17) and (18):
C 1 ( s ) = K P + K I s ,
C 2 ( s ) = K P + K D N 1 s N + 1
where C1(s) and C2(s) represent the PI and PDN controllers, respectively.
The advantages of PI (PDN) and PID controllers have limitations. The optimization problem is used to find the gains for PID and PI(PDN) controllers, where i is the area number (i = 1, 2). Cut the goal function down to the bare minimum shown in Equations (19)–(22):
K P ( i min ) K P K P ( i max ) ,
K I ( i min ) K I K I ( i max ) ,
K D ( i min ) K D K D ( i max ) ,
N ( i min ) N i N ( i max )
The lowest and maximum limitations for the controller’s gains were found to be −2 and 2, respectively, following several trial runs. Similarly, the derivative filter coefficient ranges from 30 to 50.

3.2. The Cost Function (J)

The cost function (J) is improved (minimized) to obtain the appropriate PI(1+DD) controller settings using optimization methods. The integral of time multiplied by the squared value of the error (ITSE) was used as the error index to obtain the optimal controller parameters. In this work, the cost function (J) was minimized using optimization algorithms. For a combined control of terminal voltage and load frequency, J can be expressed with ITSE using Equations (23)–(34) [44]:
J I T S E = 0 T Δ F 2 + Δ V 2 + Δ P t i e 2   d t
where
Δ F 2 = Δ F 1 2 + Δ F 2 2 + Δ F 3 2 + Δ F 4 2 ,
Δ V t 2 = Δ V t 1 2 + Δ V t 2 2 + Δ V t 3 2 + Δ V t 4 2 ,
Δ P t i e 2 = Δ P t i e 1 2 + Δ P t i e 2 2 + Δ P t i e 3 2 + Δ P t i e 4 2 ,
Δ V t 1 = V r e f V t 1 ,
Δ V t 2 = V r e f V t 2 ,
Δ V t 3 = V r e f V t 3 ,
Δ V t 4 = V r e f V t 4 ,
Δ P t i e 1 = Δ P t i e 12 + Δ P t i e 13 + Δ P t i e 14 ,
Δ P t i e 2 = Δ P t i e 21 + Δ P t i e 23 + Δ P t i e 24 ,
Δ P t i e 3 = Δ P t i e 31 + Δ P t i e 32 + Δ P t i e 34 ,
Δ P t i e 4 = Δ P t i e 41 + Δ P t i e 42 + Δ P t i e 43 .

4. The Arithmetic Optimization Algorithm (AOA)

The optimization (improvement) processes of population-based algorithms usually begin with a random selection of possible solutions. Optimization methods are based on the iterative evaluation of this collection of responses by a particular objective function and the gradual improvement of this generated set of solutions by a set of optimization rules [65]. Finding a solution in a single run is not guaranteed because population-based algorithms use a stochastic approach to identify the optimal solution to optimization issues. However, a significant number of random solutions and optimization rounds improve the likelihood of discovering the global optimal solution for the given problem [66].
The two primary stages of the optimization process are exploration and exploitation, notwithstanding the variations among metaheuristic algorithms in the field of population-based optimization techniques. In order to prevent local solutions, the former explains how an algorithm’s search agents are used to cover a wide region of the search space. The latter is the increased accuracy of the solutions that were found during the exploration stage [67].

4.1. Basic Philosophy of the AOA Optimization Technique

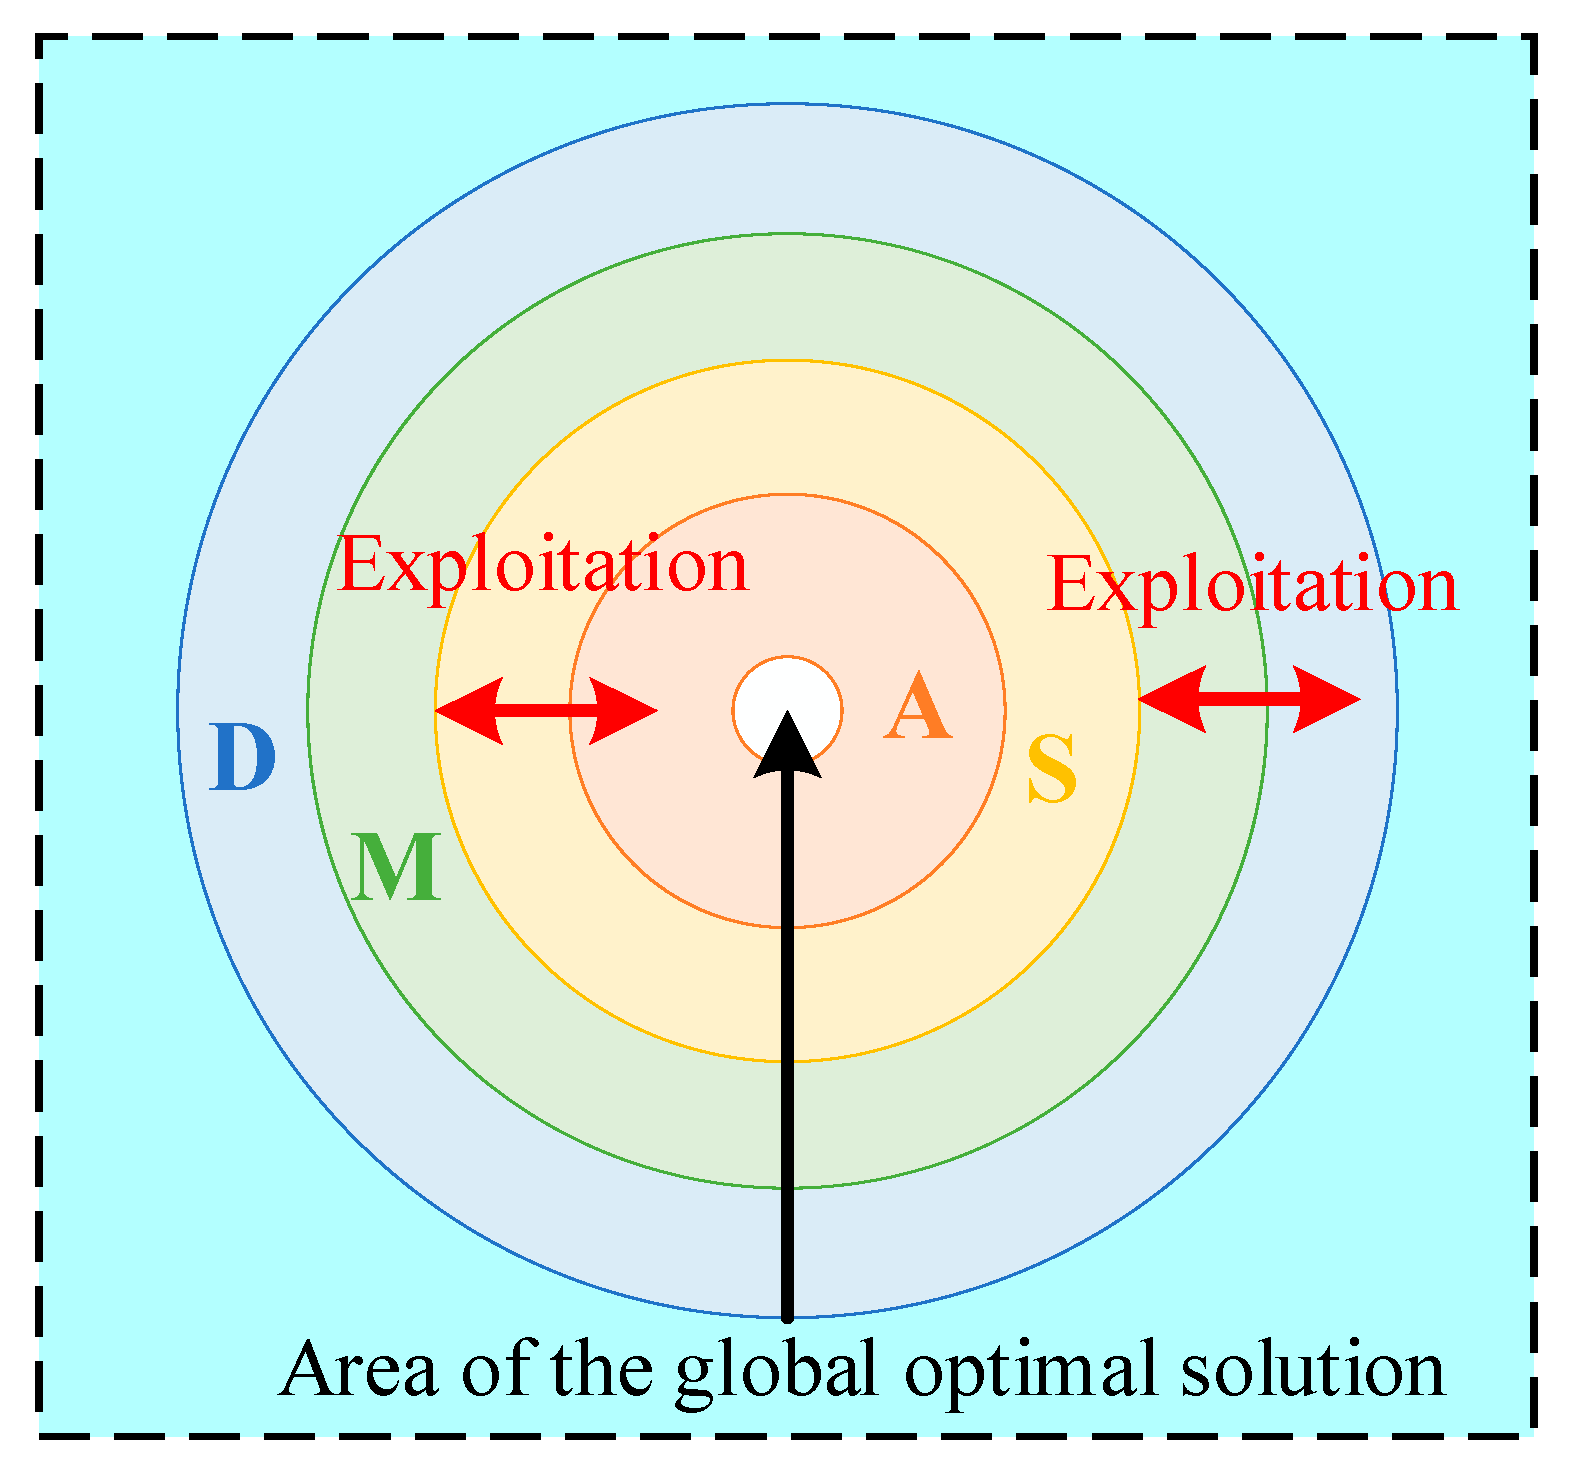
A recent addition to the population-based optimization techniques, the AOA technique was initially presented by Abualigah et al. in 2021 [65]. The way arithmetic operators behave in distribution—division (D), multiplication (M), addition (A), and subtraction (S)—in resolving mathematical problems serves as the primary inspiration for this approach. The AOA technique, which is according to a four-level structure, is capable of handling optimization issues and determining the global optimal solution without requiring the computation of derivatives. The hierarchy of the four arithmetic operators used in the AOA technique, as well as their relative dominance from the outside in, is shown in Figure 9. From the exterior to the inside of this structure, arithmetic operators become less dominant. Like many population-based optimization methods, the AOA technique’s optimization procedure is mostly predicated on the following three stages.

4.2. Inspiration

Arithmetic is a key feature of number theory and serves as a vital field of modern mathematics, alongside geometry, algebra, and analysis. The classic methods of studying numerical characteristics include addition, subtraction, division, and multiplication. These fundamental operators also play a crucial role in mathematical optimization, where they are used to identify the most suitable element from a set of possible solutions based on defined criteria. Numerous quantitative disciplines, such as computer science, operations research, engineering, economics, and industrial applications, frequently face optimization issues. Developing strategies to address these issues has been a major area of mathematical attention over time, attracting ongoing interest and creativity.

4.3. Initialization Phase

The AOA technique creates a starting population of Np candidate solutions, which are dispersed randomly throughout the search space, during the initialization stage. Each potential solution uses an arithmetic operator-based mathematical model in an effort to converge toward the best global answer. The AOA technique initially decides which search phase—exploration or exploitation—will be carried out before beginning the search procedure. To do this, the math optimizer accelerated (MOA) function is employed in Equation (35):
M O A = M i n + C × M a x M i n M C N
where C is the current cycle, MCN is the maximum cycle number, and Min and Max stand for the minimum and maximum values of the MOA function, respectively. To highlight exploration and exploitation, the MOA function value is raised progressively from 0.2 to 0.9 in this case.

4.4. Exploration Phase

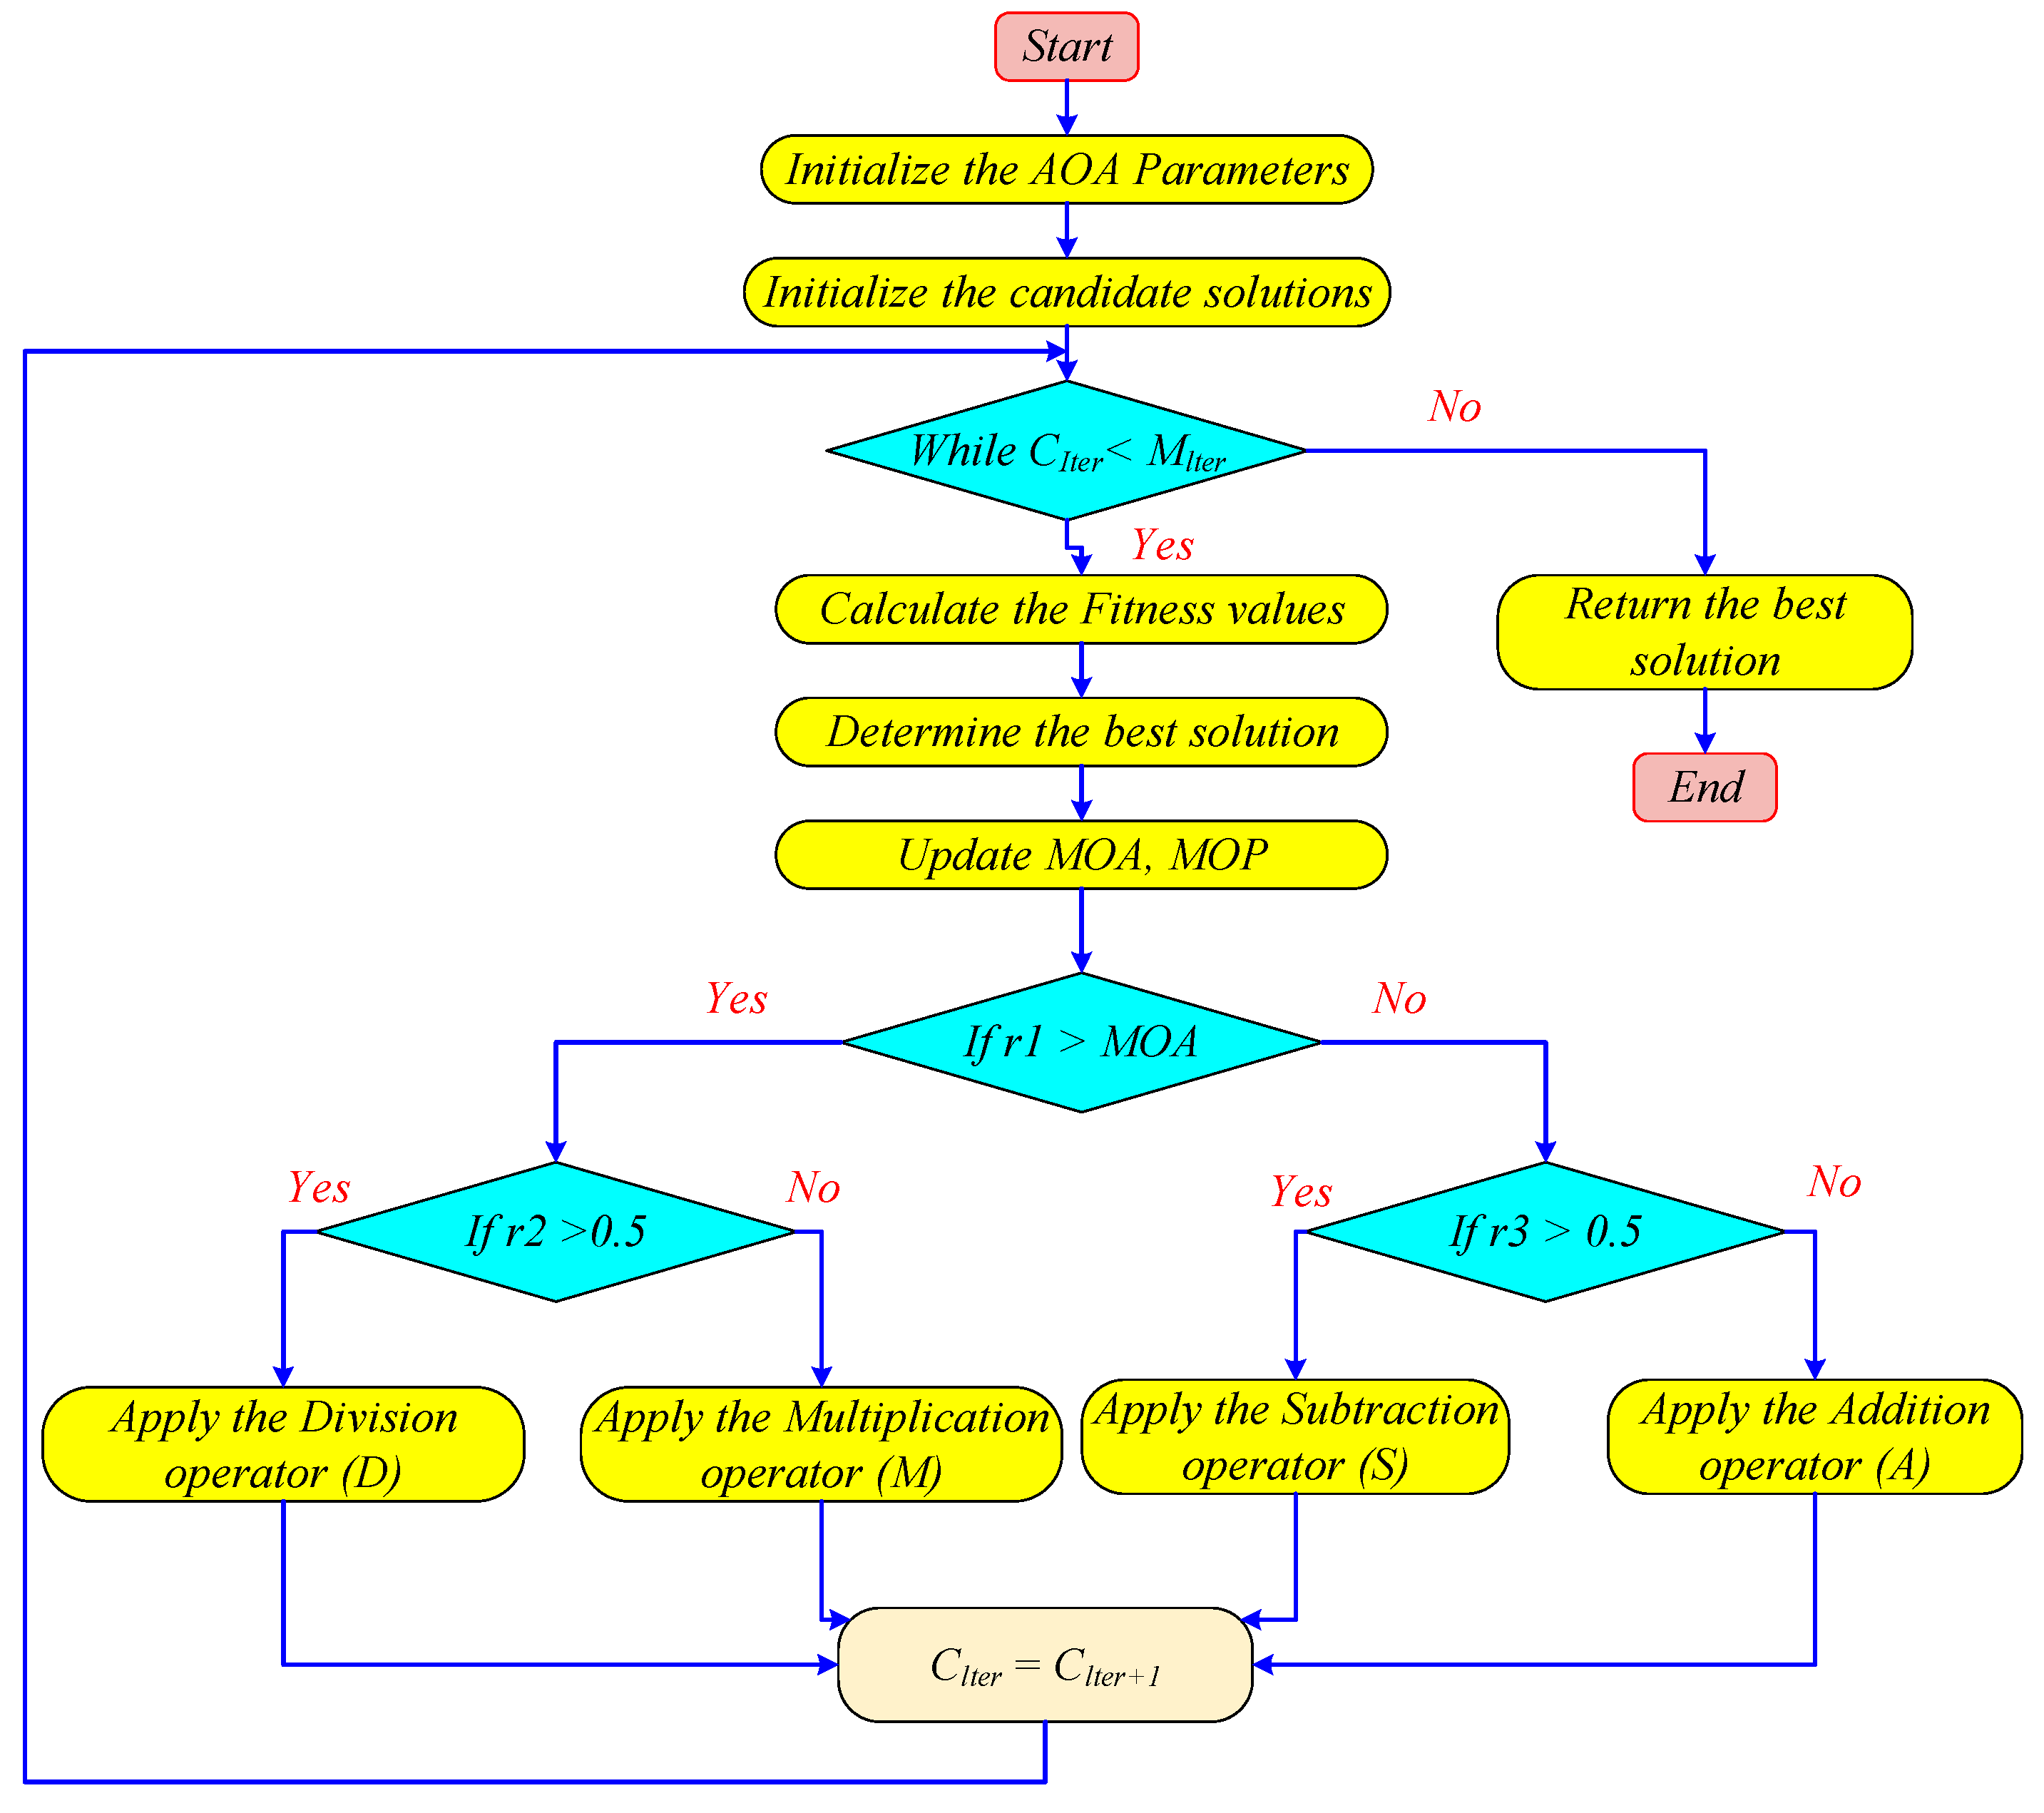
The exploration phase cannot be carried out until the requirement r1 > MOA is met, where r1 is a random value in [0, 1]. For the purpose of staying away from any local fixes, the D and M operators are used in this situation to randomly explore the search space across multiple regions because of their high dispersion. Equation (31) provides the D and M operators’ updated positions. This equation demonstrates that the inequality r2 > 0.5, where r2 is a random value in [0, 1], is a prerequisite for the D operator’s participation in this phase. If r2 is less than or equal to 0.5, the M operator will be used to complete the present task instead of the D operator, as shown in Equation (36).
x i j ( C + 1 ) = best x j ÷ ( M O P + ε ) × U B j L B j × μ + L B j , r 2 > 0.5 best x j × M O P × U B j L B j × μ + L B j , otherwise
where the jth position in the best solution found thus far is represented by best xj, the lower and upper bounds of the jth position are denoted by LBj and UBj, ε is a small integer value, μ is a parameter to modify the search process, and MOP is the math optimizer probability function, the value of which is determined as follows in Equation (37):
M O P ( C ) = 1 C 1 a M C N 1 a
where the sensitivity parameter determines how accurate the exploitation is throughout the course of the iterations.

4.5. Exploitation Phase

The S and A operators are used by the AOA technique during the exploitation phase because, on the one hand, they produce highly dense results and, on the other, they have minimal dispersion, which makes it easy for them to approach the target. The MOA function also governs how this phase is carried out, and it occurs when r1 < MOA. In order to conduct a thorough search across several dense locations, the S and A search techniques are used as follows in Equation (38):
x i j ( C + 1 ) = best x j ÷ ( M O P + ε ) × U B j L B j × μ + L B j , r 3 > 0.5 best x j × M O P × U B j L B j × μ + L B j , otherwise
To fully explore the search space, the first search strategy is used when r3 > 0.5. When r3 < 0.5, the A search approach is used to complete the present task rather than the S operative. During this stage, the exploitation examination operatives (S and A) frequently try to evade entering the local exploration area so that they can help the exploration search operatives (D and M) find the global optimum solution and keep the variety of potential solutions intact. In this case, the optimization of the search process greatly depends on the control parameter μ. In order to guarantee ongoing exploration throughout all iterations, not just the initial ones, it must be properly tuned. The search approach used through the AOA technique to meet in a two-dimensional exploration space to the global optimum solution is depicted in Figure 9.

4.6. Test Functions of the Proposed AOA Technique

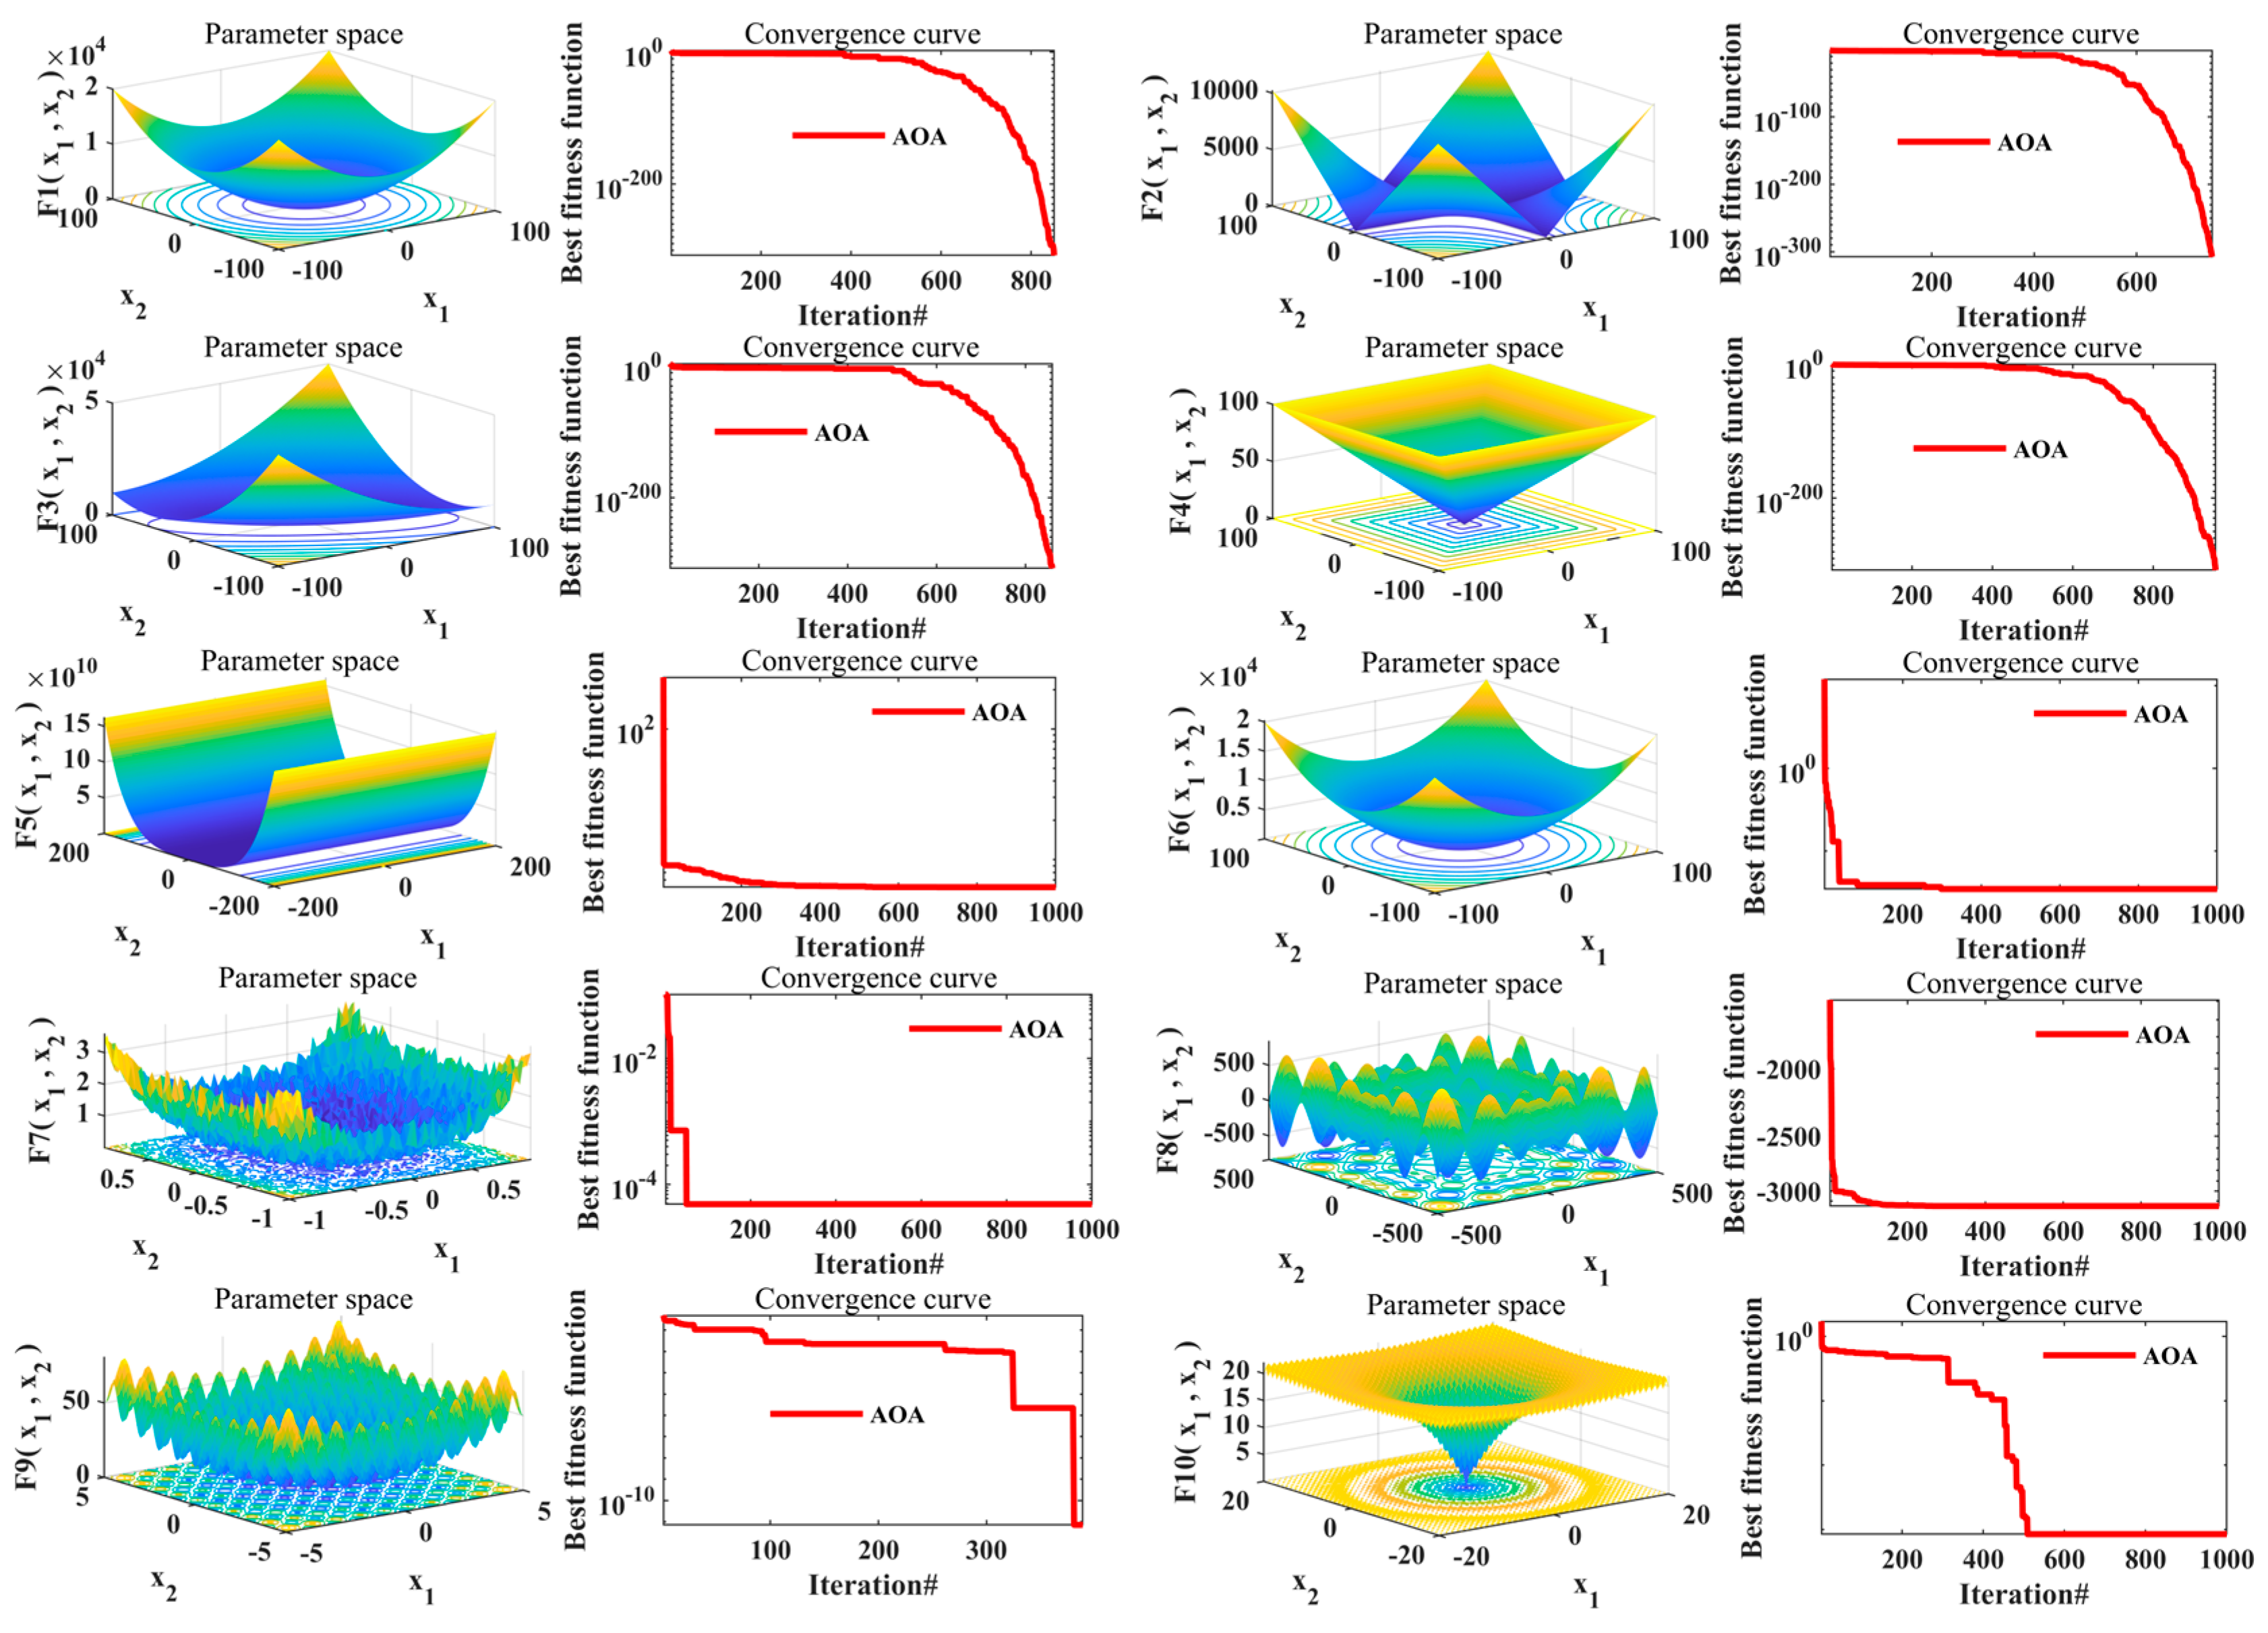
The performance of the proposed AOA is evaluated using ten standard benchmark functions commonly adopted in the optimization literature. These functions are selected to analyze the algorithm’s effectiveness across varying problem dimensionalities, thereby demonstrating its robustness in both low- and high-dimensional search spaces. For better visualization and intuitive understanding of the optimization landscape, two-dimensional representations of the functions are provided. Figure 10 illustrates the fitness curves and landscape topographies of the selected test functions. Detailed descriptions of the test functions, along with the best fitness values achieved by AOA, are summarized in Table 3.

4.7. Pseudo-Code of the AOA

In summary, the first step in the optimization process in AOA is to create a random population of potential solutions. D, M, S, and A estimate the possible locations of the near-optimal solution during the trajectory of repetition. Every solution swaps places with the best-obtained one. The value MOA is raised linearly from 0.2 to 0.9 to highlight exploration and exploitation. When r1 > MOA, candidate solutions aim to deviate from the near-optimal solution; when r1 < MOA, they converge towards the near-optimal solution. When the final criterion is satisfied, the AOA is finally terminated. Algorithm 1 describes the suggested AOA’s pseudo-code. Figure 11 illustrates the simple and comprehensive AOA procedure.
Algorithm 1 Algorithm Pseudo-code of the AOA
1: Initialize parameters α, µ, and random solutions (i = 1, …, N).
2: while C_Iter < M_Iter do
3:    Calculate fitness for all solutions.
4:    Find best solution.
5:    Update MOA and MOP values.
6:    for each solution i do
7:     for each position j do
8:       Generate random values r1, r2, r3 ∈ [0, 1].
9:       if r1 > MOA then
10:         if r2 > 0.5 then
11:          Update position using Division operator (Equation (3) rule 1).
12:         else
13:          Update position using Multiplication operator (Equation (3) rule 2).
14:       else
15:         if r3 > 0.5 then
16:          Update position using Subtraction operator (Equation (5) rule 1).
17:         else
18:          Update position using Addition operator (Equation (5) rule 2).
19:       end if
20:     end for
21:    end for
22:    C_Iter = C_Iter + 1
23: end while
24: Return best solution.

4.8. The Computational Complexity of AOA

The evaluation of the fitness function, updating of solutions, and initialization procedures are the three main components that determine the computing complexity of the suggested AOA. The initialization process’s complexity is O(N), where N is the population size. Since it depends on the problem, we do not address the fitness function’s complexity here. Finally, the difficulty of updating solutions is O(M × N) + O(M × N × L), where M denotes iterations and L is the problem’s dimension (number of parameters). Thus, the suggested AOA has a computational complexity of O(N × (ML + 1)). To validate and confirm the effectiveness of the suggested AOA in solving optimization problems, a variety of benchmark test functions and actual optimization problems are employed in the next section.

4.9. Procedure for Applying AOA to Tune Controller Parameters

To apply the AOA for tuning the parameters of the controllers, the following steps are followed:
  • Initialization
    • Define the problem objective function to be optimized, such as the Integral of Time multiplied by Squared Error (ITSE) or other performance criteria like settling time, overshoot, rise time, and steady-state error.
    • Set the initial values for the controller parameters, such as Kp, Ki, and for advanced controllers like PI(1+DD), additional parameters like KD1 and KD2.
    • Determine the search space bounds for each parameter based on the expected range of values and constraints.
  • Generate Initial Population
    • Create an initial population of possible solutions (sets of controller parameters) by randomly generating values for each parameter within the predefined bounds.
    • Each solution represents a possible configuration of the controller parameters.
  • Fitness Evaluation
    • Evaluate the fitness of each solution (controller configuration) by applying the set of controller parameters to the system model and computing the objective function (e.g., ITSE).
    • The fitness value quantifies the performance of the system with the given set of parameters, with lower values of the objective function indicating better performance.
  • Arithmetic Optimization Process
    • Update the population using the AOA. In AOA, the new candidate solutions are generated by arithmetic operations on the current population.
    • For each iteration, randomly select two solutions from the population and calculate the arithmetic average of their parameter sets to generate a new solution.
    • Evaluate the fitness of the new solutions and keep the best-performing solutions (based on the objective function).
    • Repeat this process iteratively to refine the solutions and converge towards the optimal set of controller parameters.
  • Selection and Convergence
    • After several iterations, the algorithm converges when the fitness value stops improving significantly or when the maximum number of iterations is reached. The best solution at the end of the process represents the optimized set of controller parameters.
  • Validation
    • Once the optimal controller parameters are obtained, apply them to the system model and verify the system’s performance under different operating conditions (e.g., step disturbances, random load variations).
    • Evaluate whether the performance metrics meet the desired criteria, such as reduced settling time, minimal overshoot, and improved steady-state accuracy.
    • If necessary, fine-tune the controller parameters further based on the system’s response and performance, especially under more complex or varied conditions.

5. Simulation Results Analysis and Discussions

Modern power systems must maintain steady voltage and frequency control, especially when renewable energy sources are incorporated. Numerous simulations have been carried out in MATLAB/Simulink to verify the recommended control approach. About 2000 MW is the system’s rated power. A four-area, multi-source IPS with 5% SLP (0.05 p.u.) and nonlinearities like GRC and GDB in hydropower and thermal reheat plants have been examined in each area as well as in other situations. Moreover, BD has also been incorporated into thermal reheat power plants for a more realistic study. AOA-based control strategies such as AOA-PID, AOA-I-P, AOA-PI-PDN, AOA-I-PD, and the proposed AOA-PI(1+DD) have been employed for the optimal control of four-area IPS under such constraints. A thorough sensitivity study was then conducted by altering the system parameters by ±25% in each of the four regions. In order to obtain the best solution, each simulation took into account five iterations out of the fifteen solutions in the AOA population. The bottom and upper limitations for solution members are 0.01 and 2, respectively. The step input per unit was used as a reference terminal voltage. Table 2 lists the time constant, gain, and other system parameters of the IPS under examination, which were acquired from [44]. Table 4 lists the optimum parameters for the AOA-PID, AOA-I-PD, AOA-I-P, AOA-PI-PDN, and AOA-PI(1+DD) management techniques.

5.1. Case One (Under 5% Load Changes in the Combined AVR-LFC with Nonlinearities)

In this case, a 5% change load in zone-1 with RES construction was used to assess the performance of the GWO, LHHO, TOCFO, WaOA, and AOA tuned controllers, including PID, PI(1+DD), I-P, I-PD, and PI-PDN. Equations (39)–(41) are used to calculate the load frequency variations, terminal voltage, and tie-line power deviation, ts, +ve and −ve for a 5% change in load in all zones.
+ v e = m a x ( Δ x ( t ) ) Δ x s s ,
v e = m i n ( Δ x ( t ) ) Δ x s s ,
t s = t i m e   w h e n , Δ x ( t ) Δ x s s , T o l e r a n c e   f o r   a l l ( t ) t s
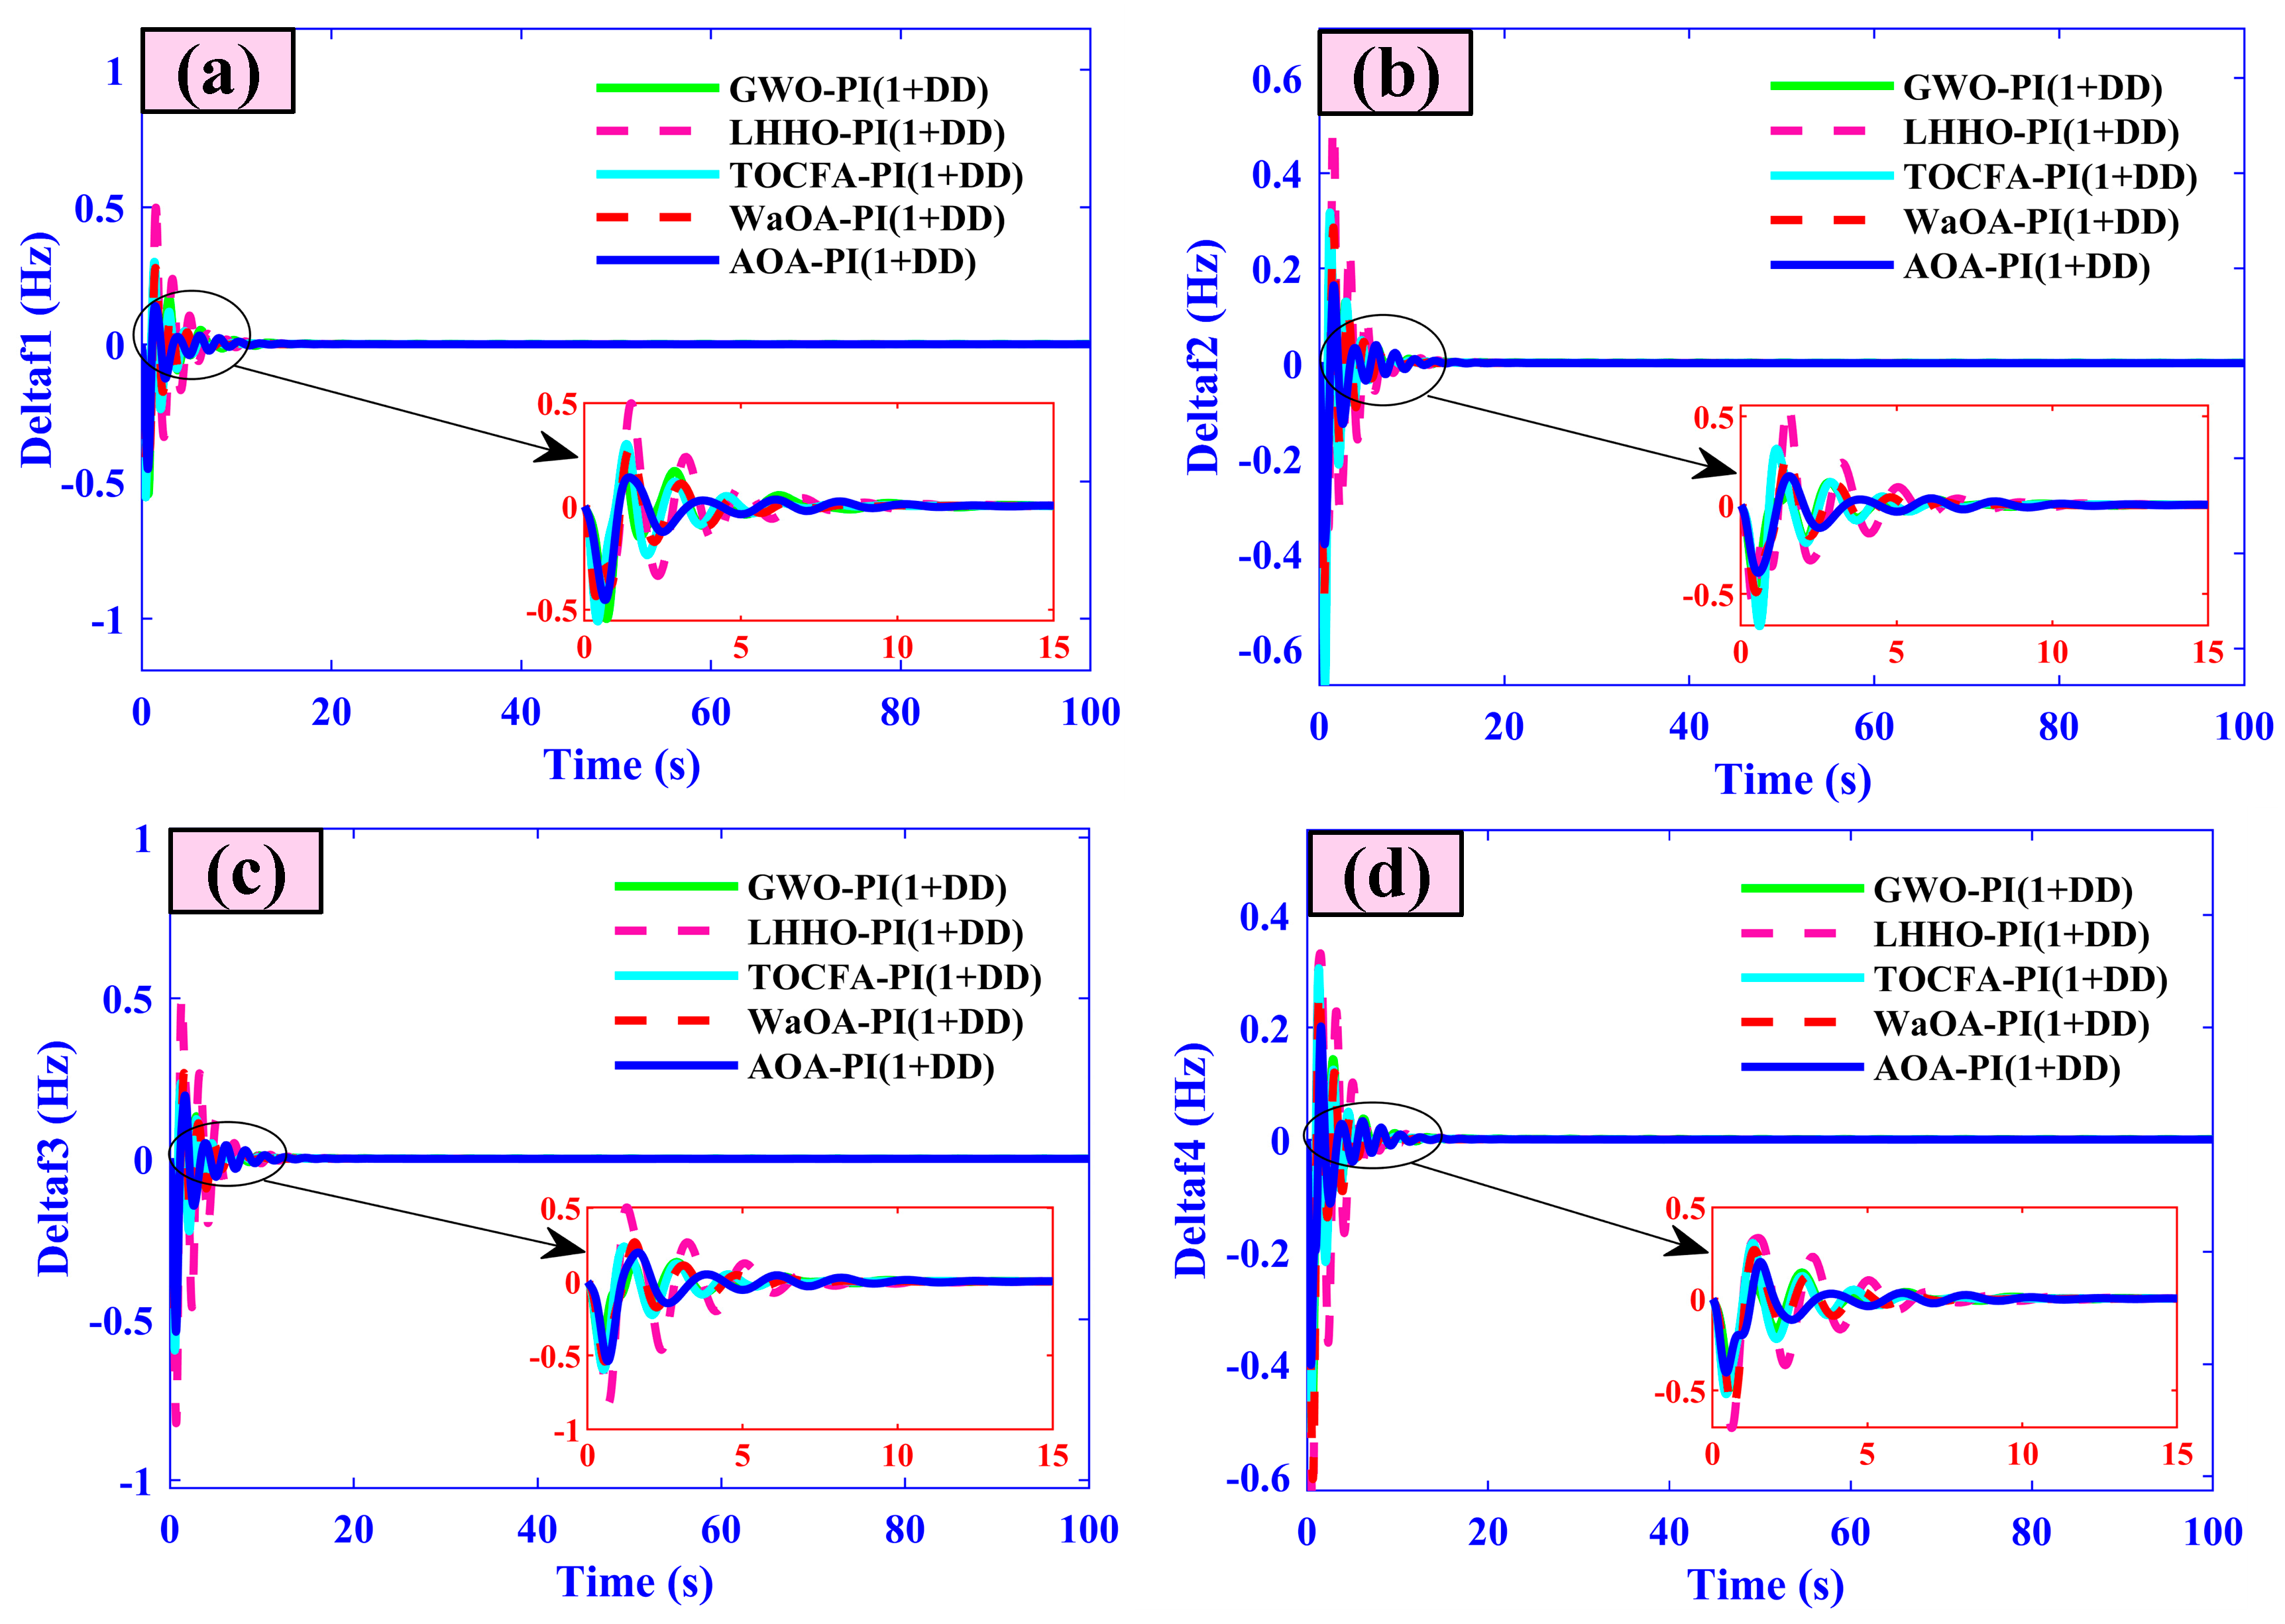
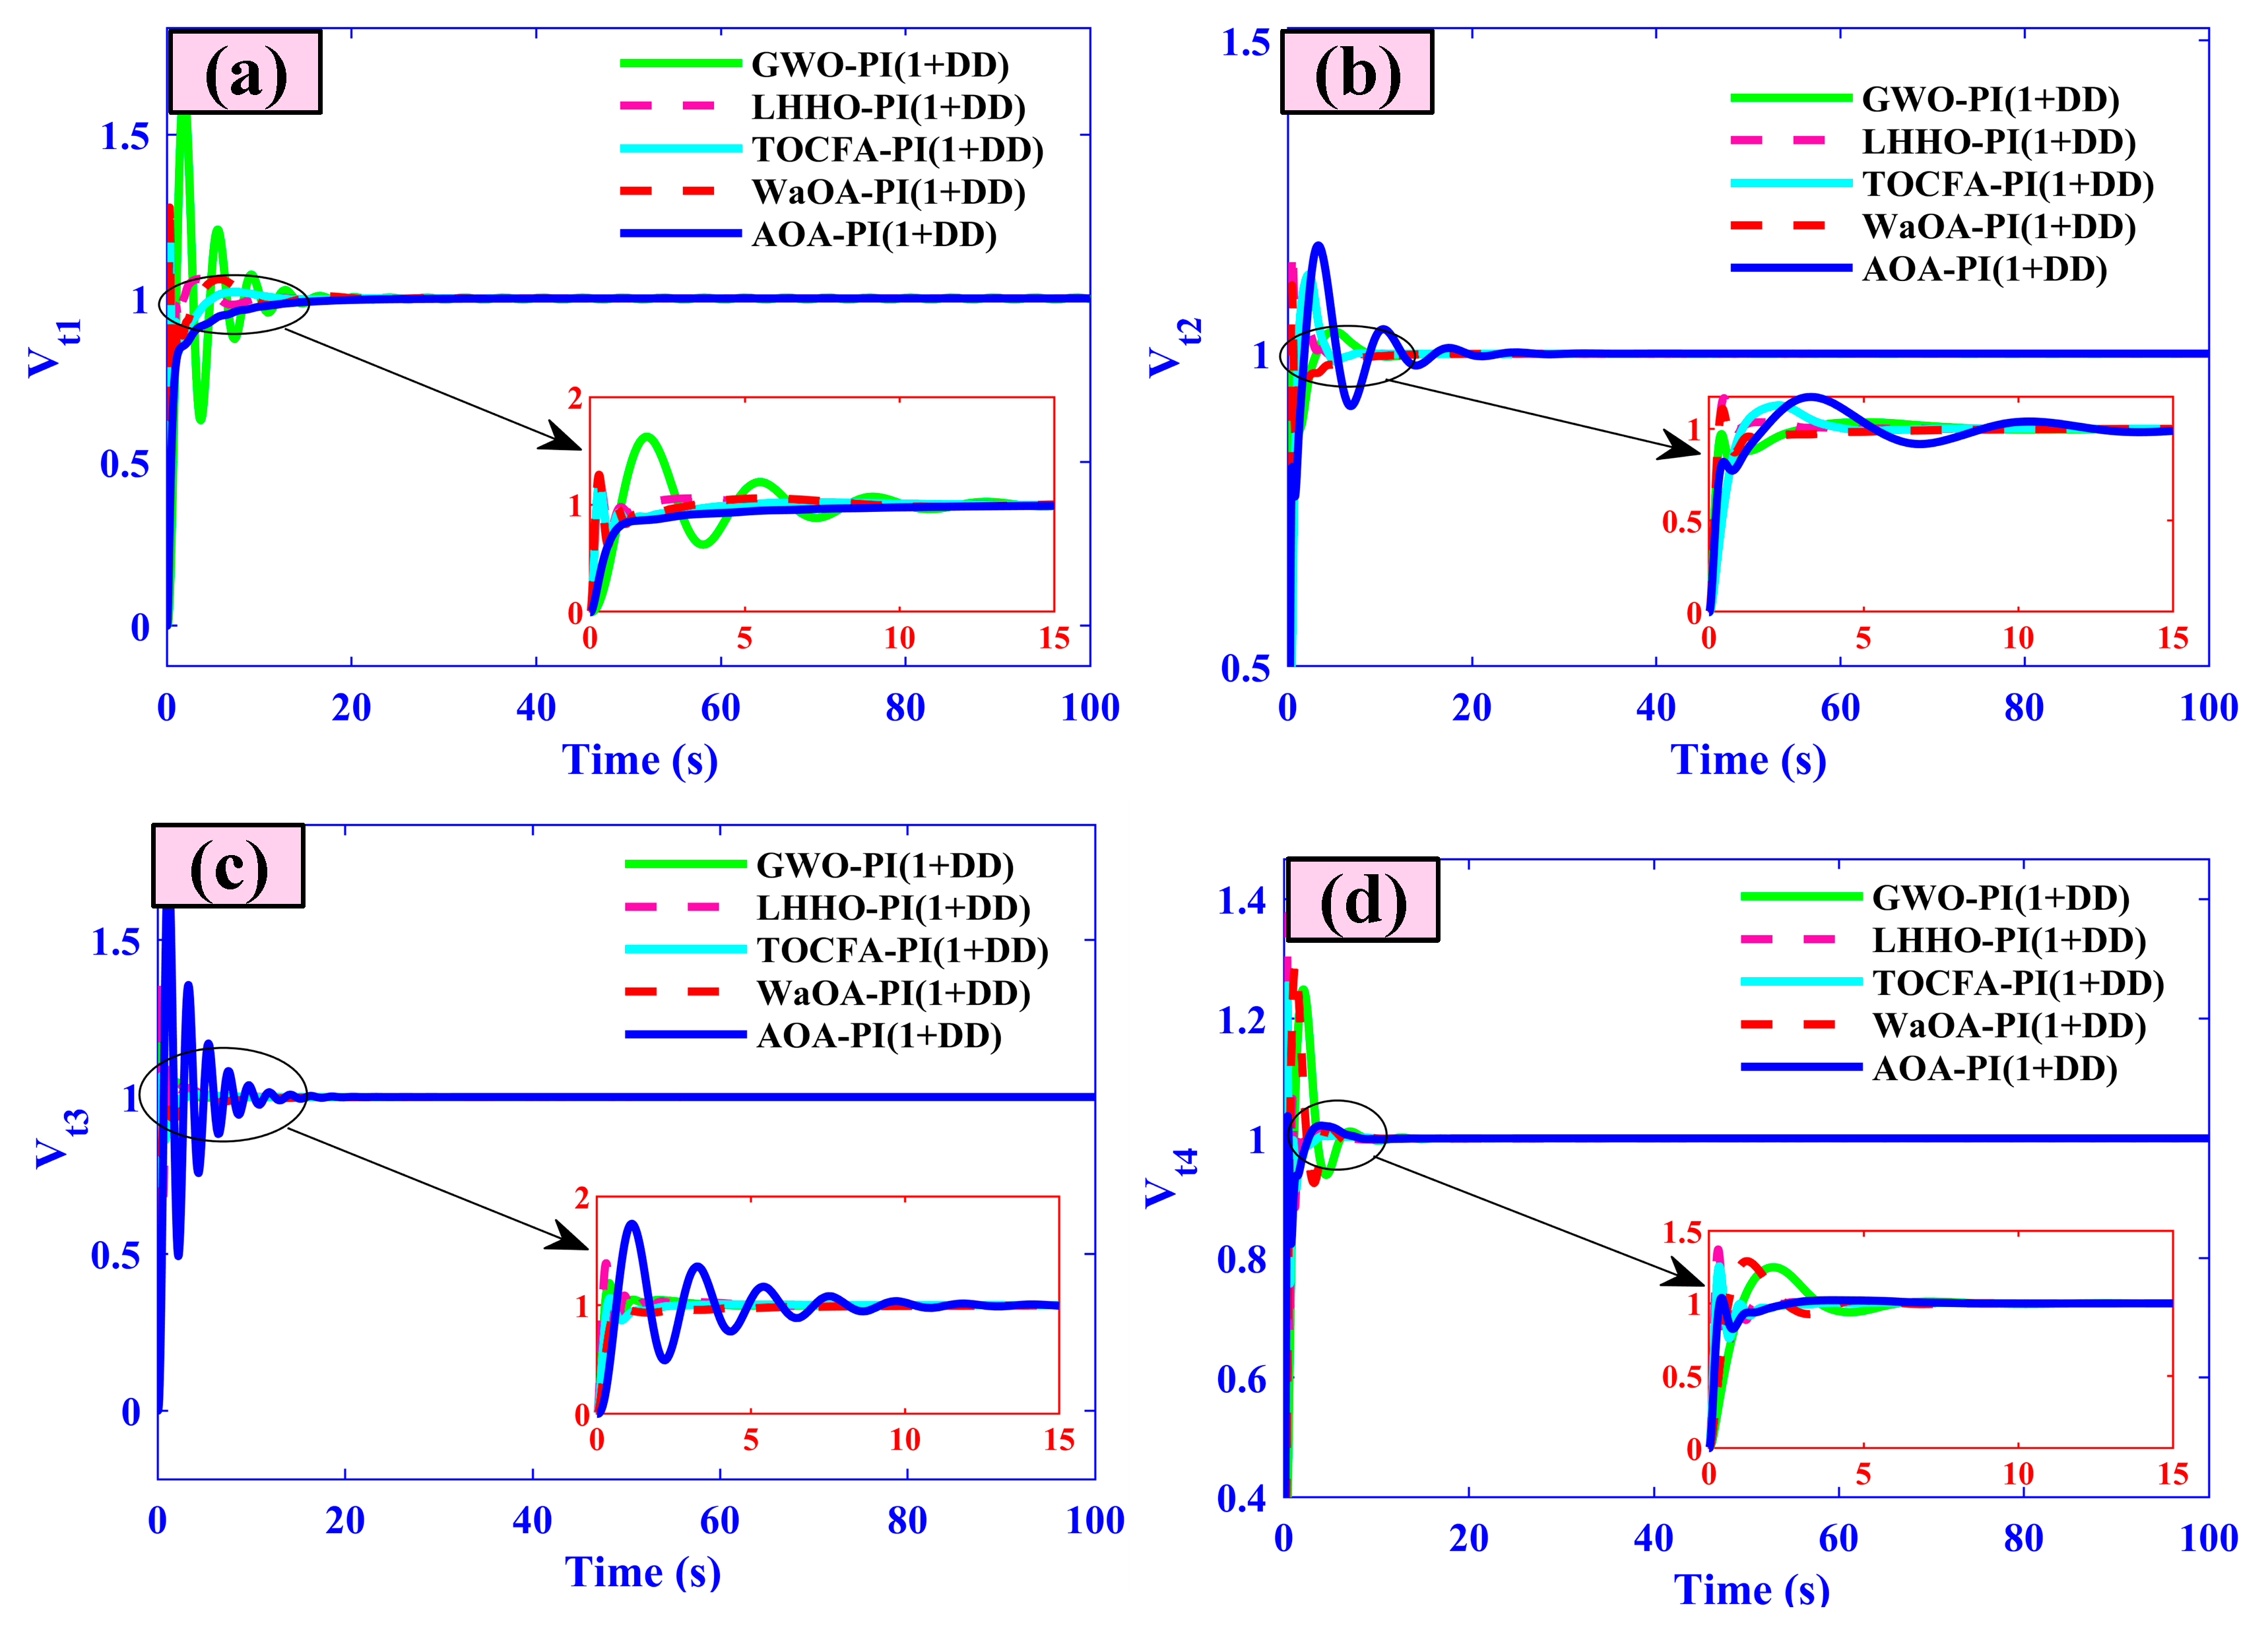
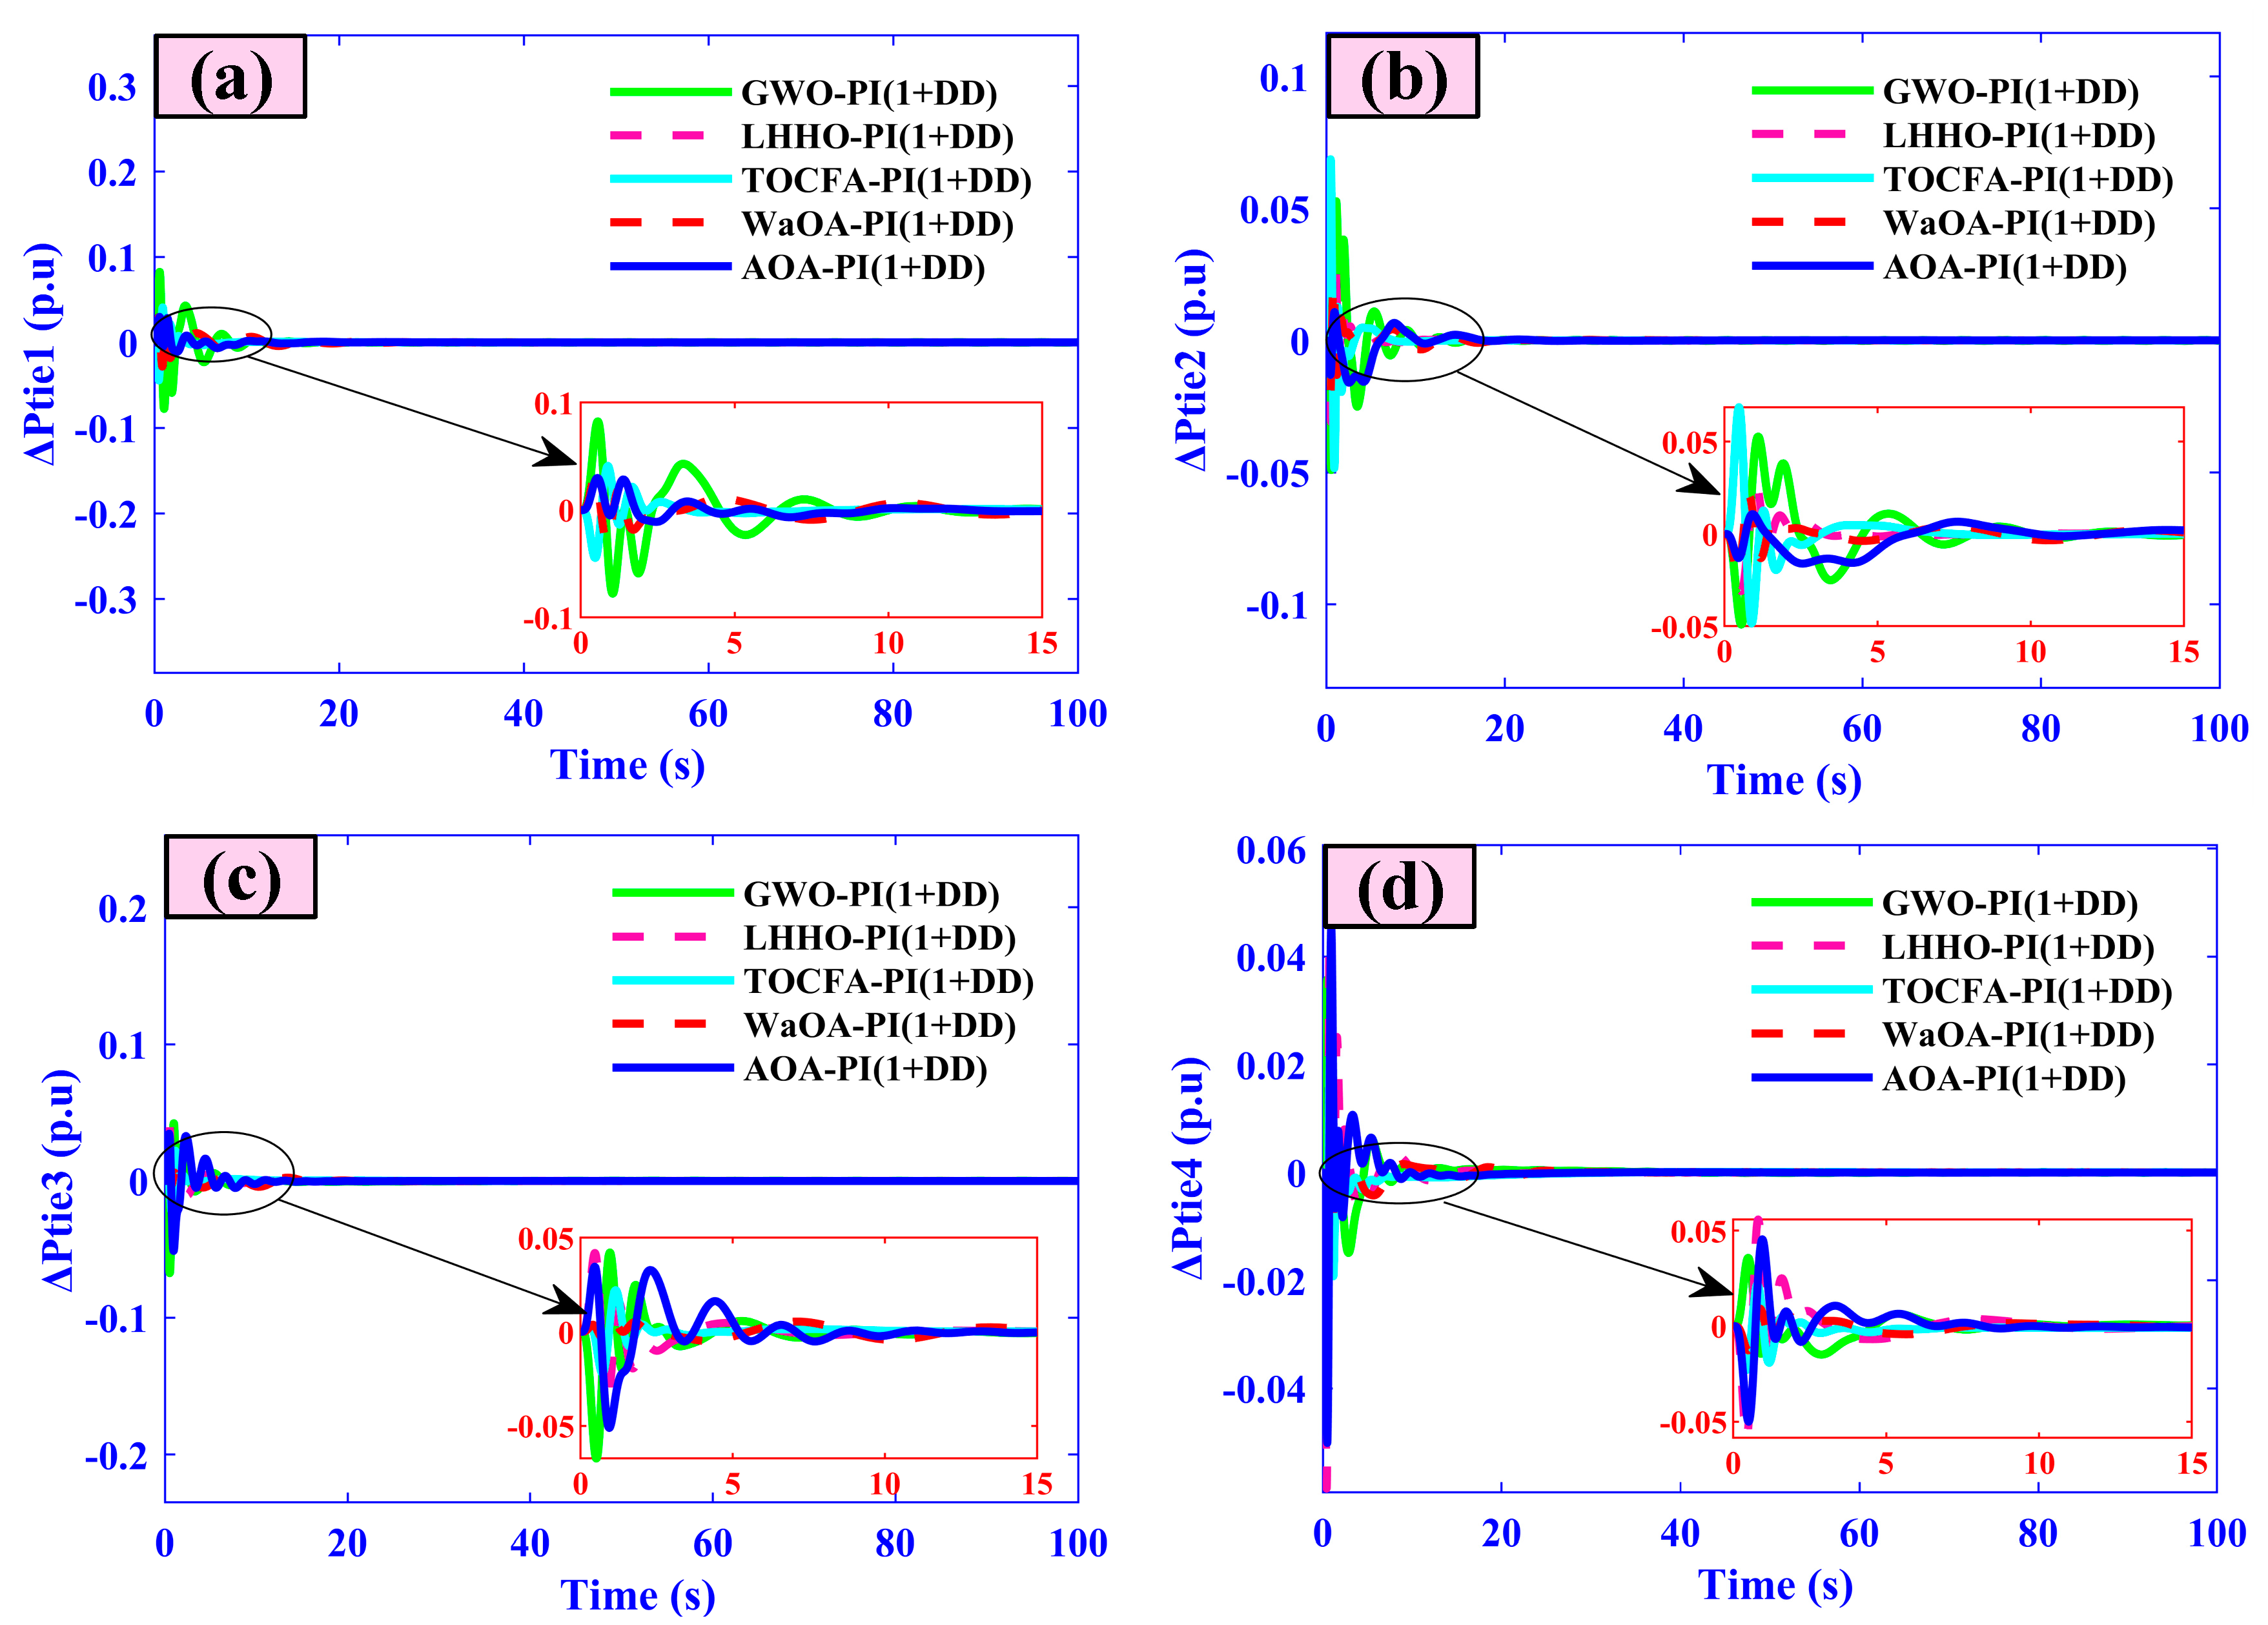
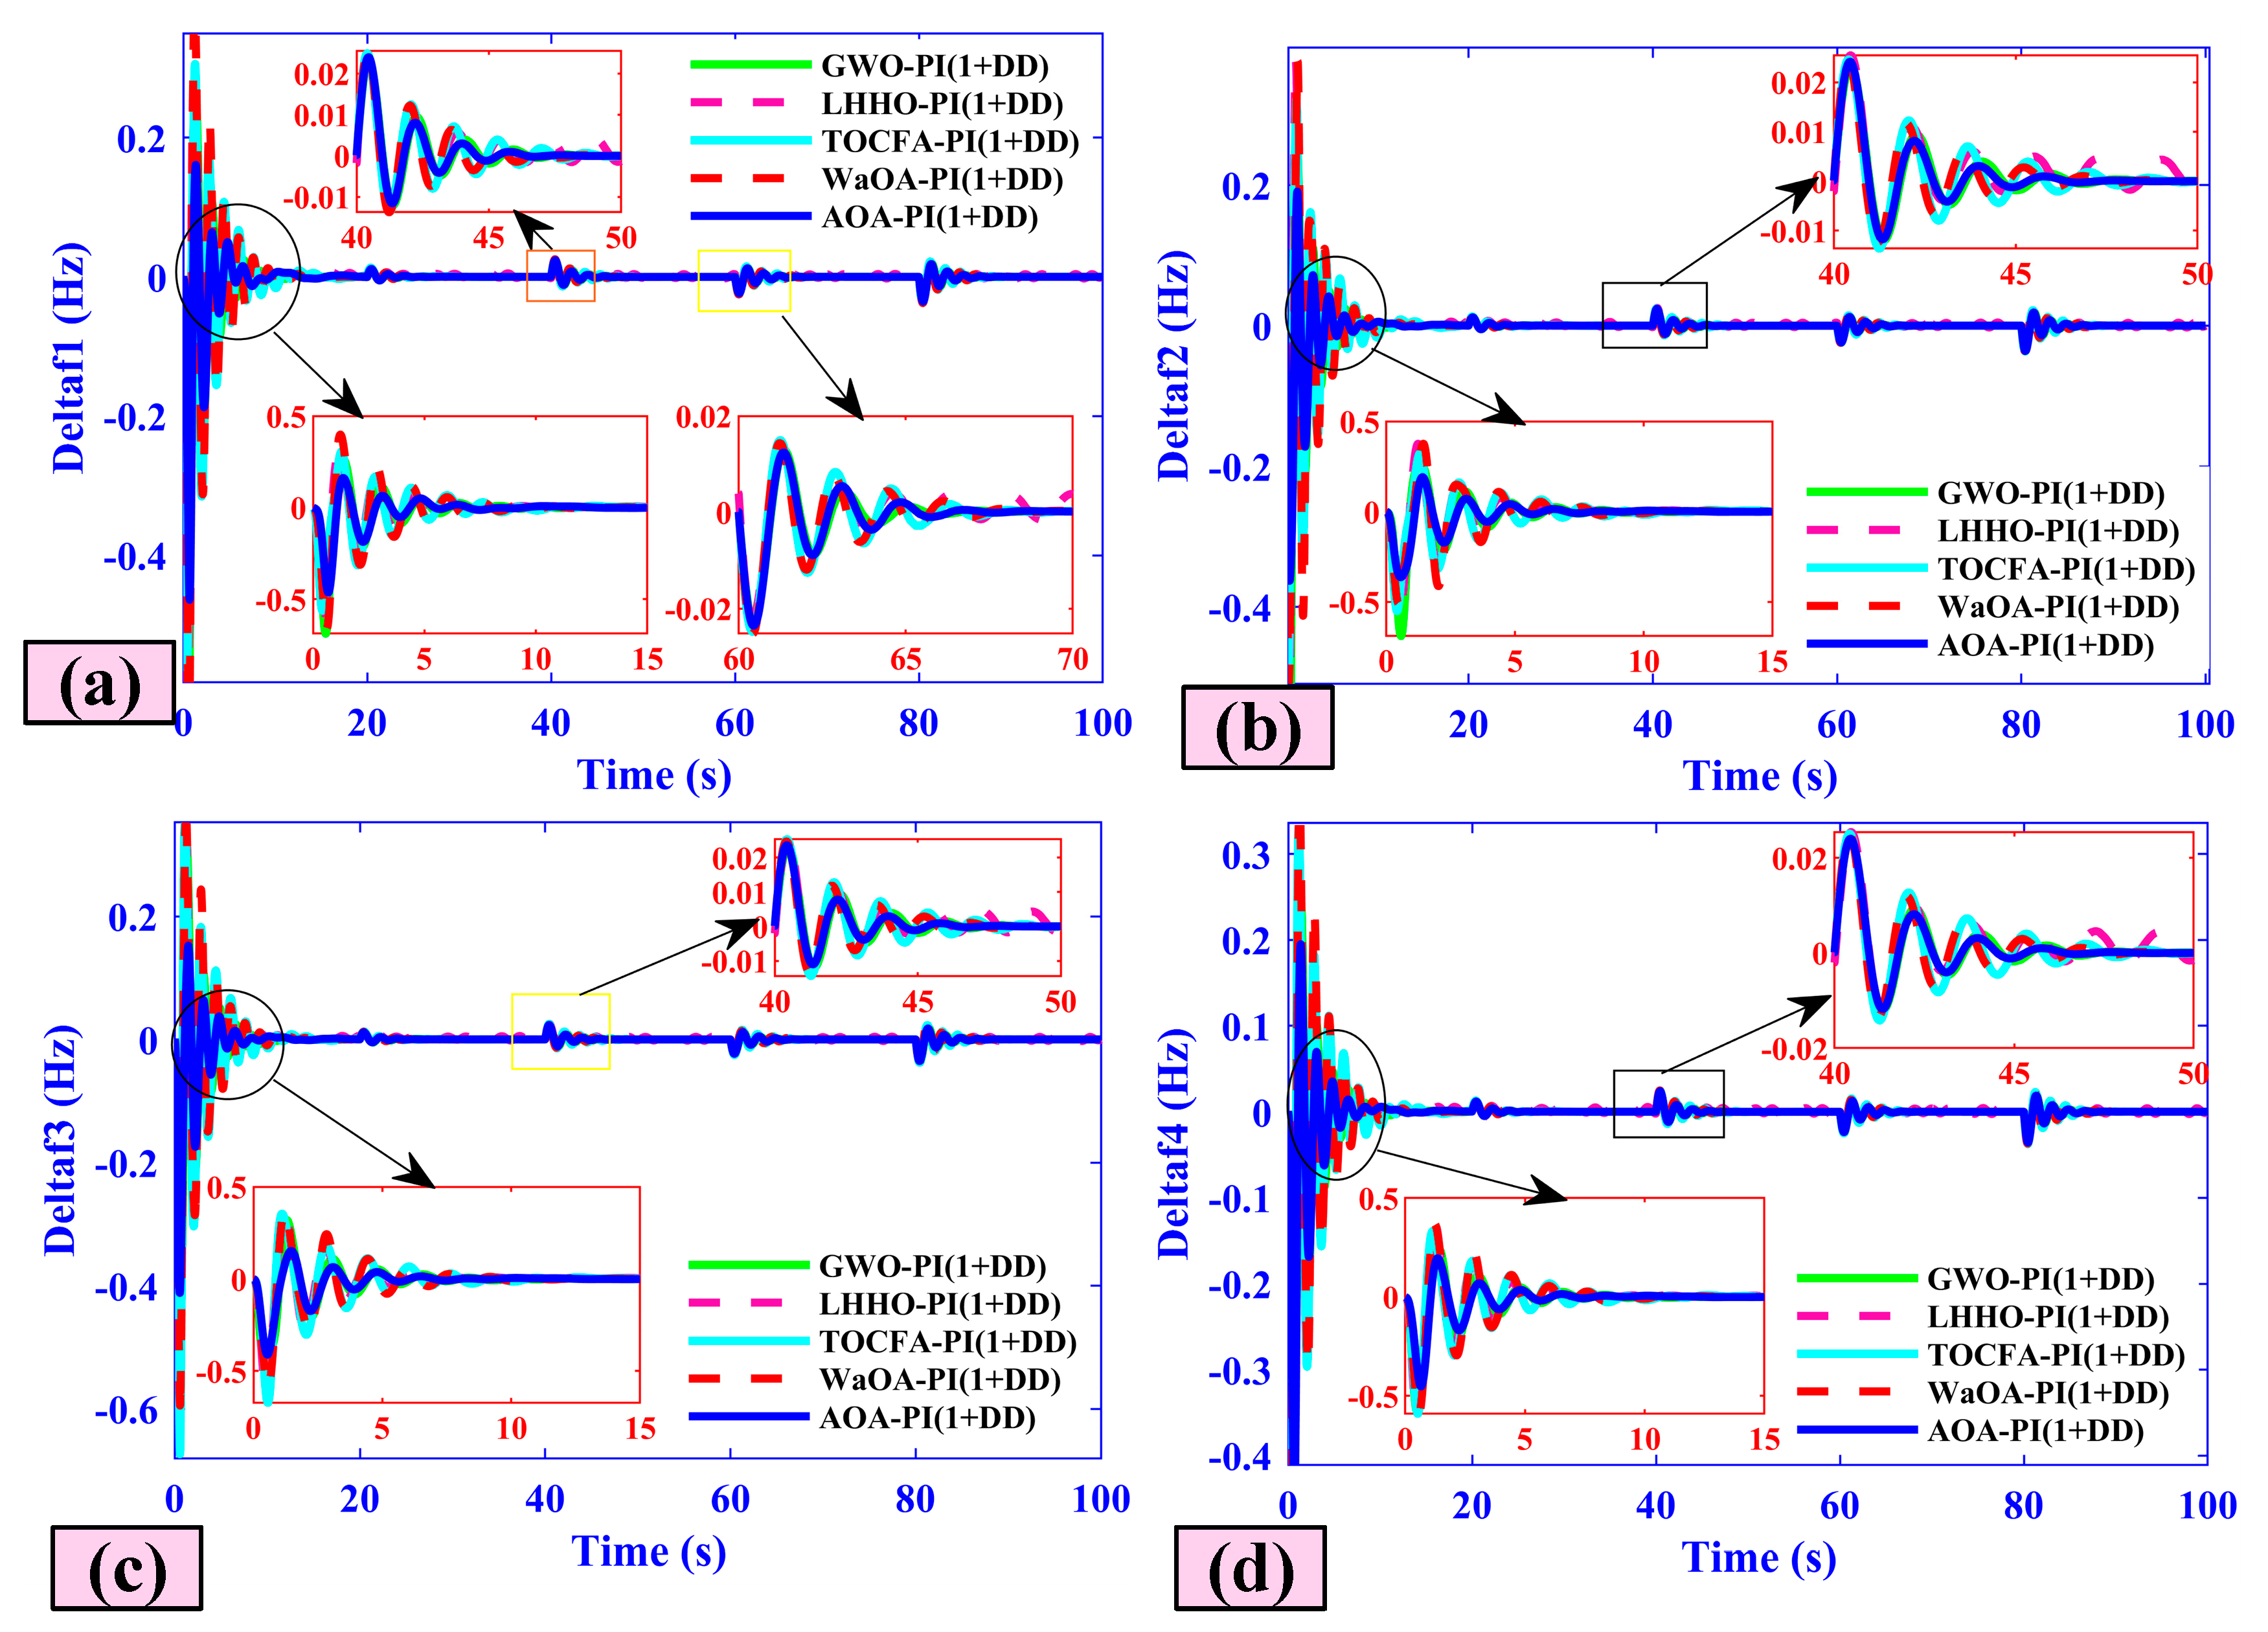
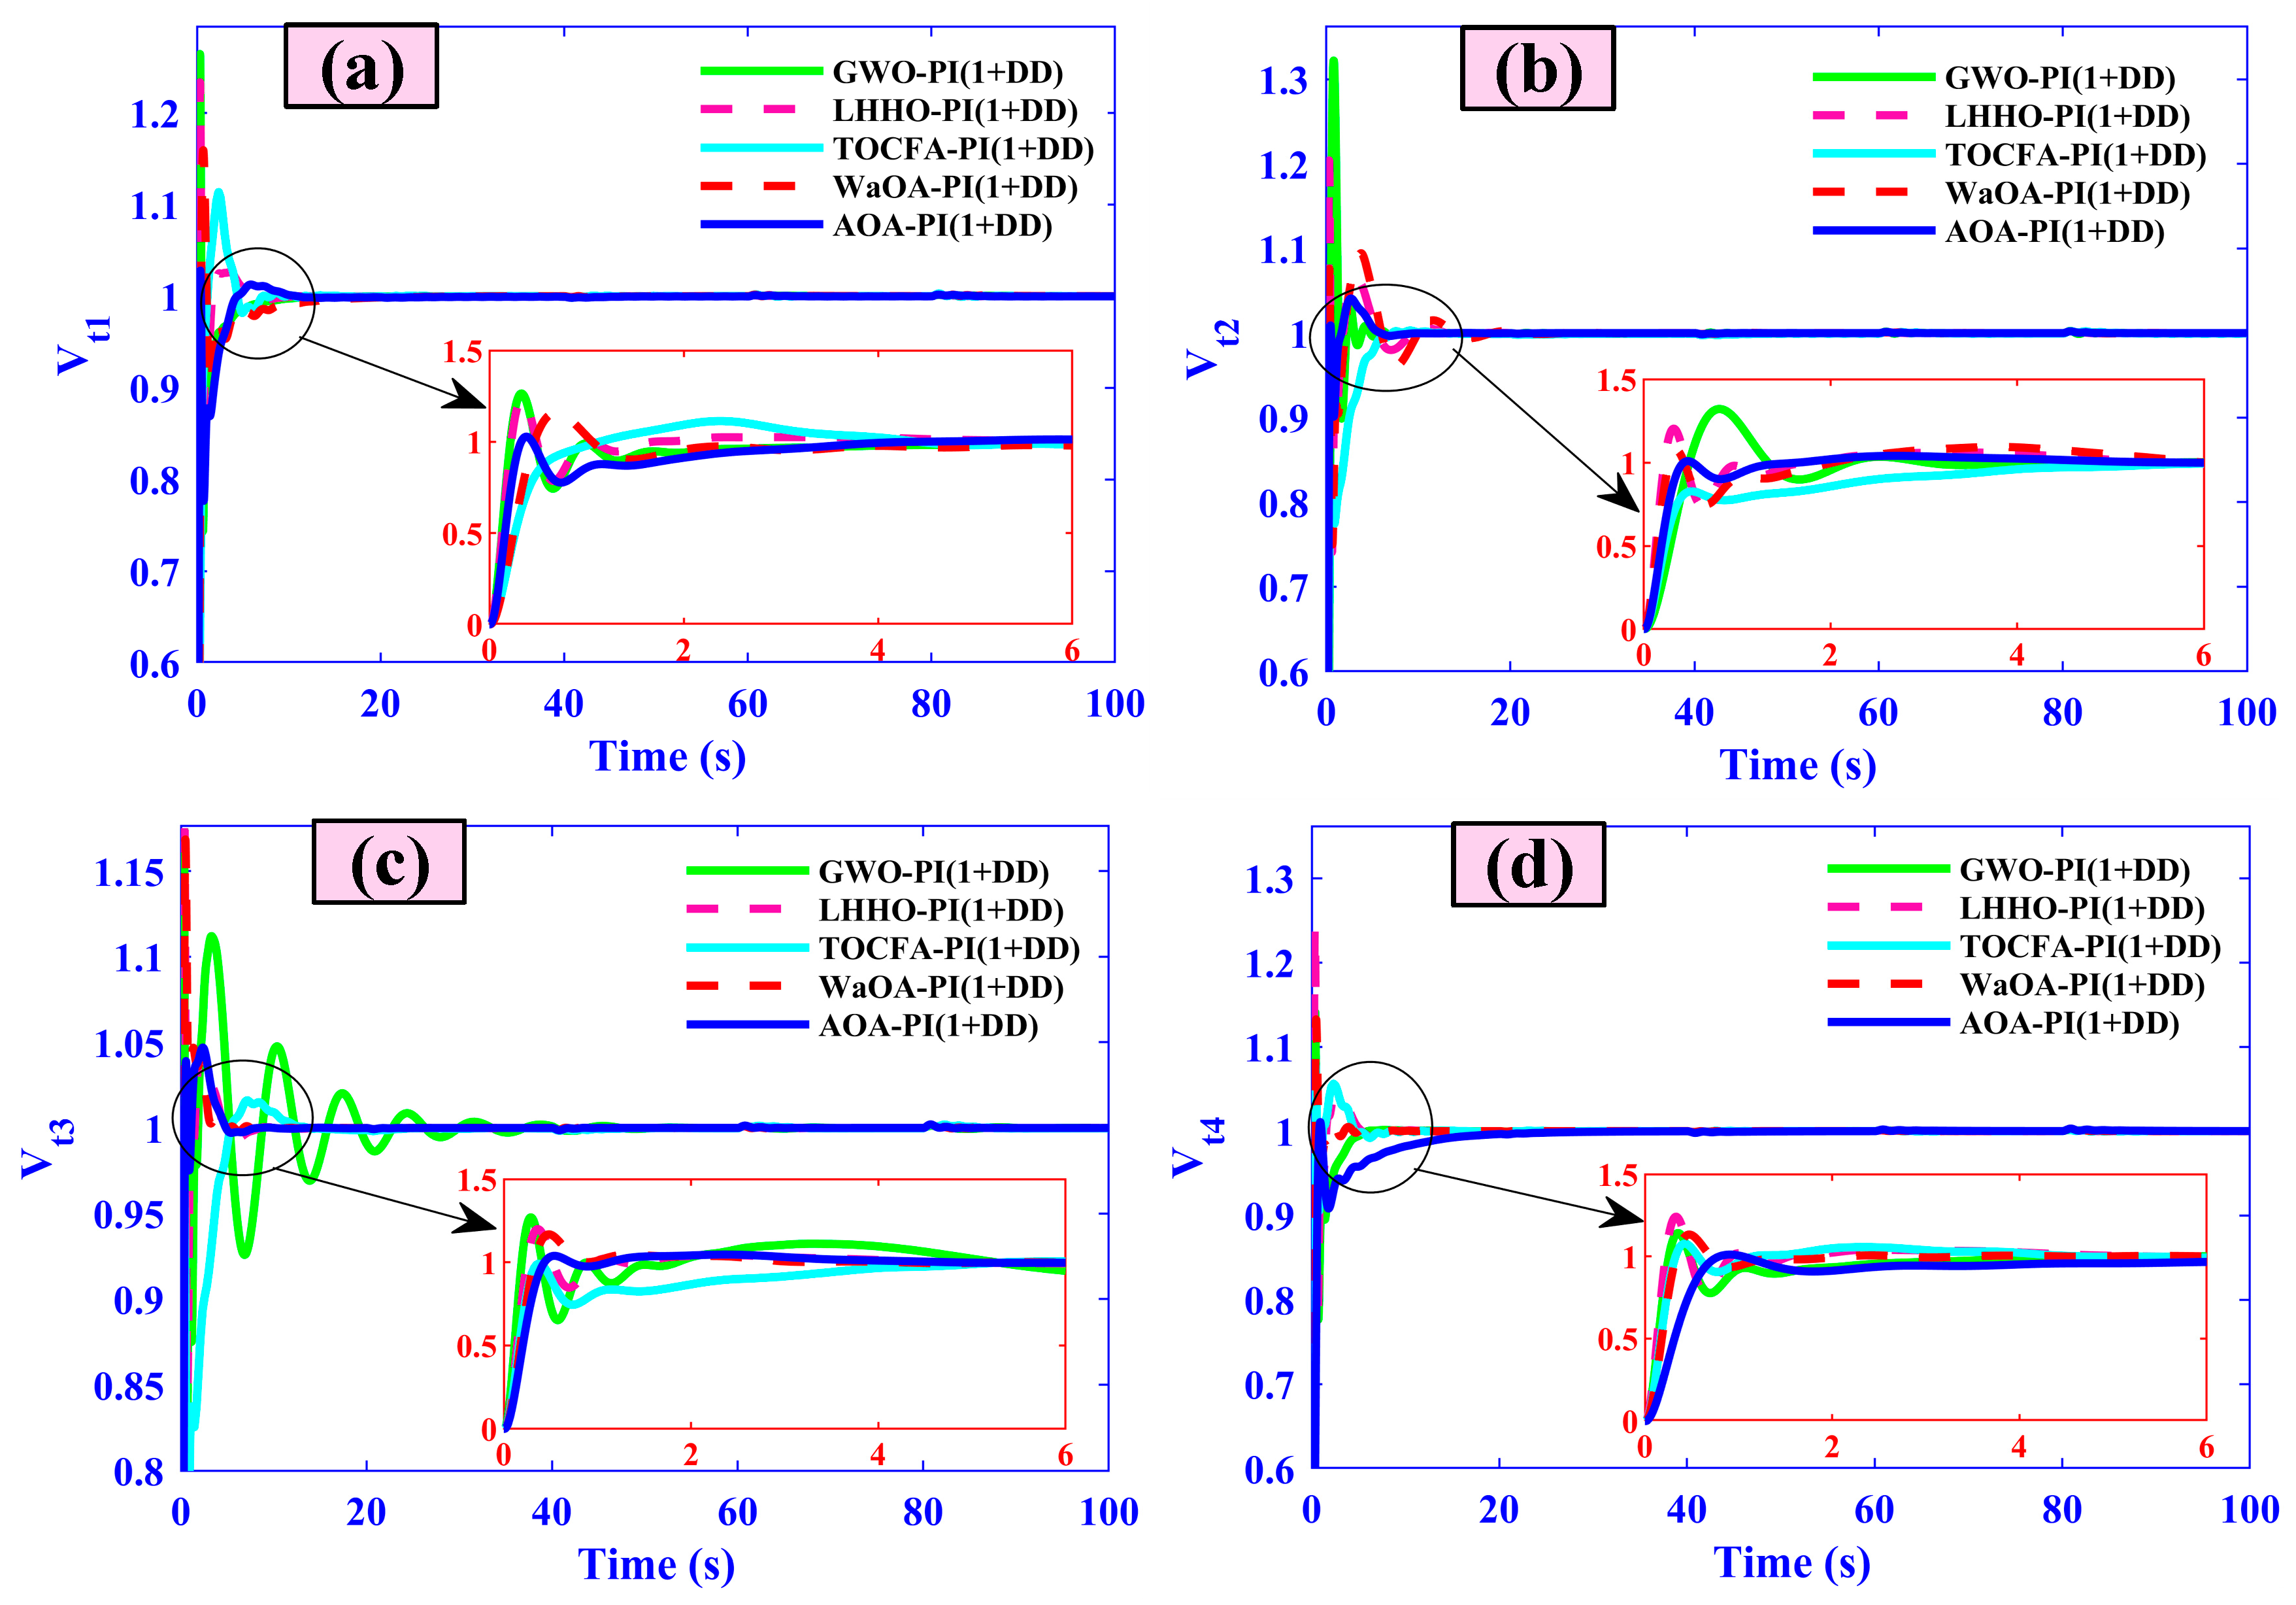
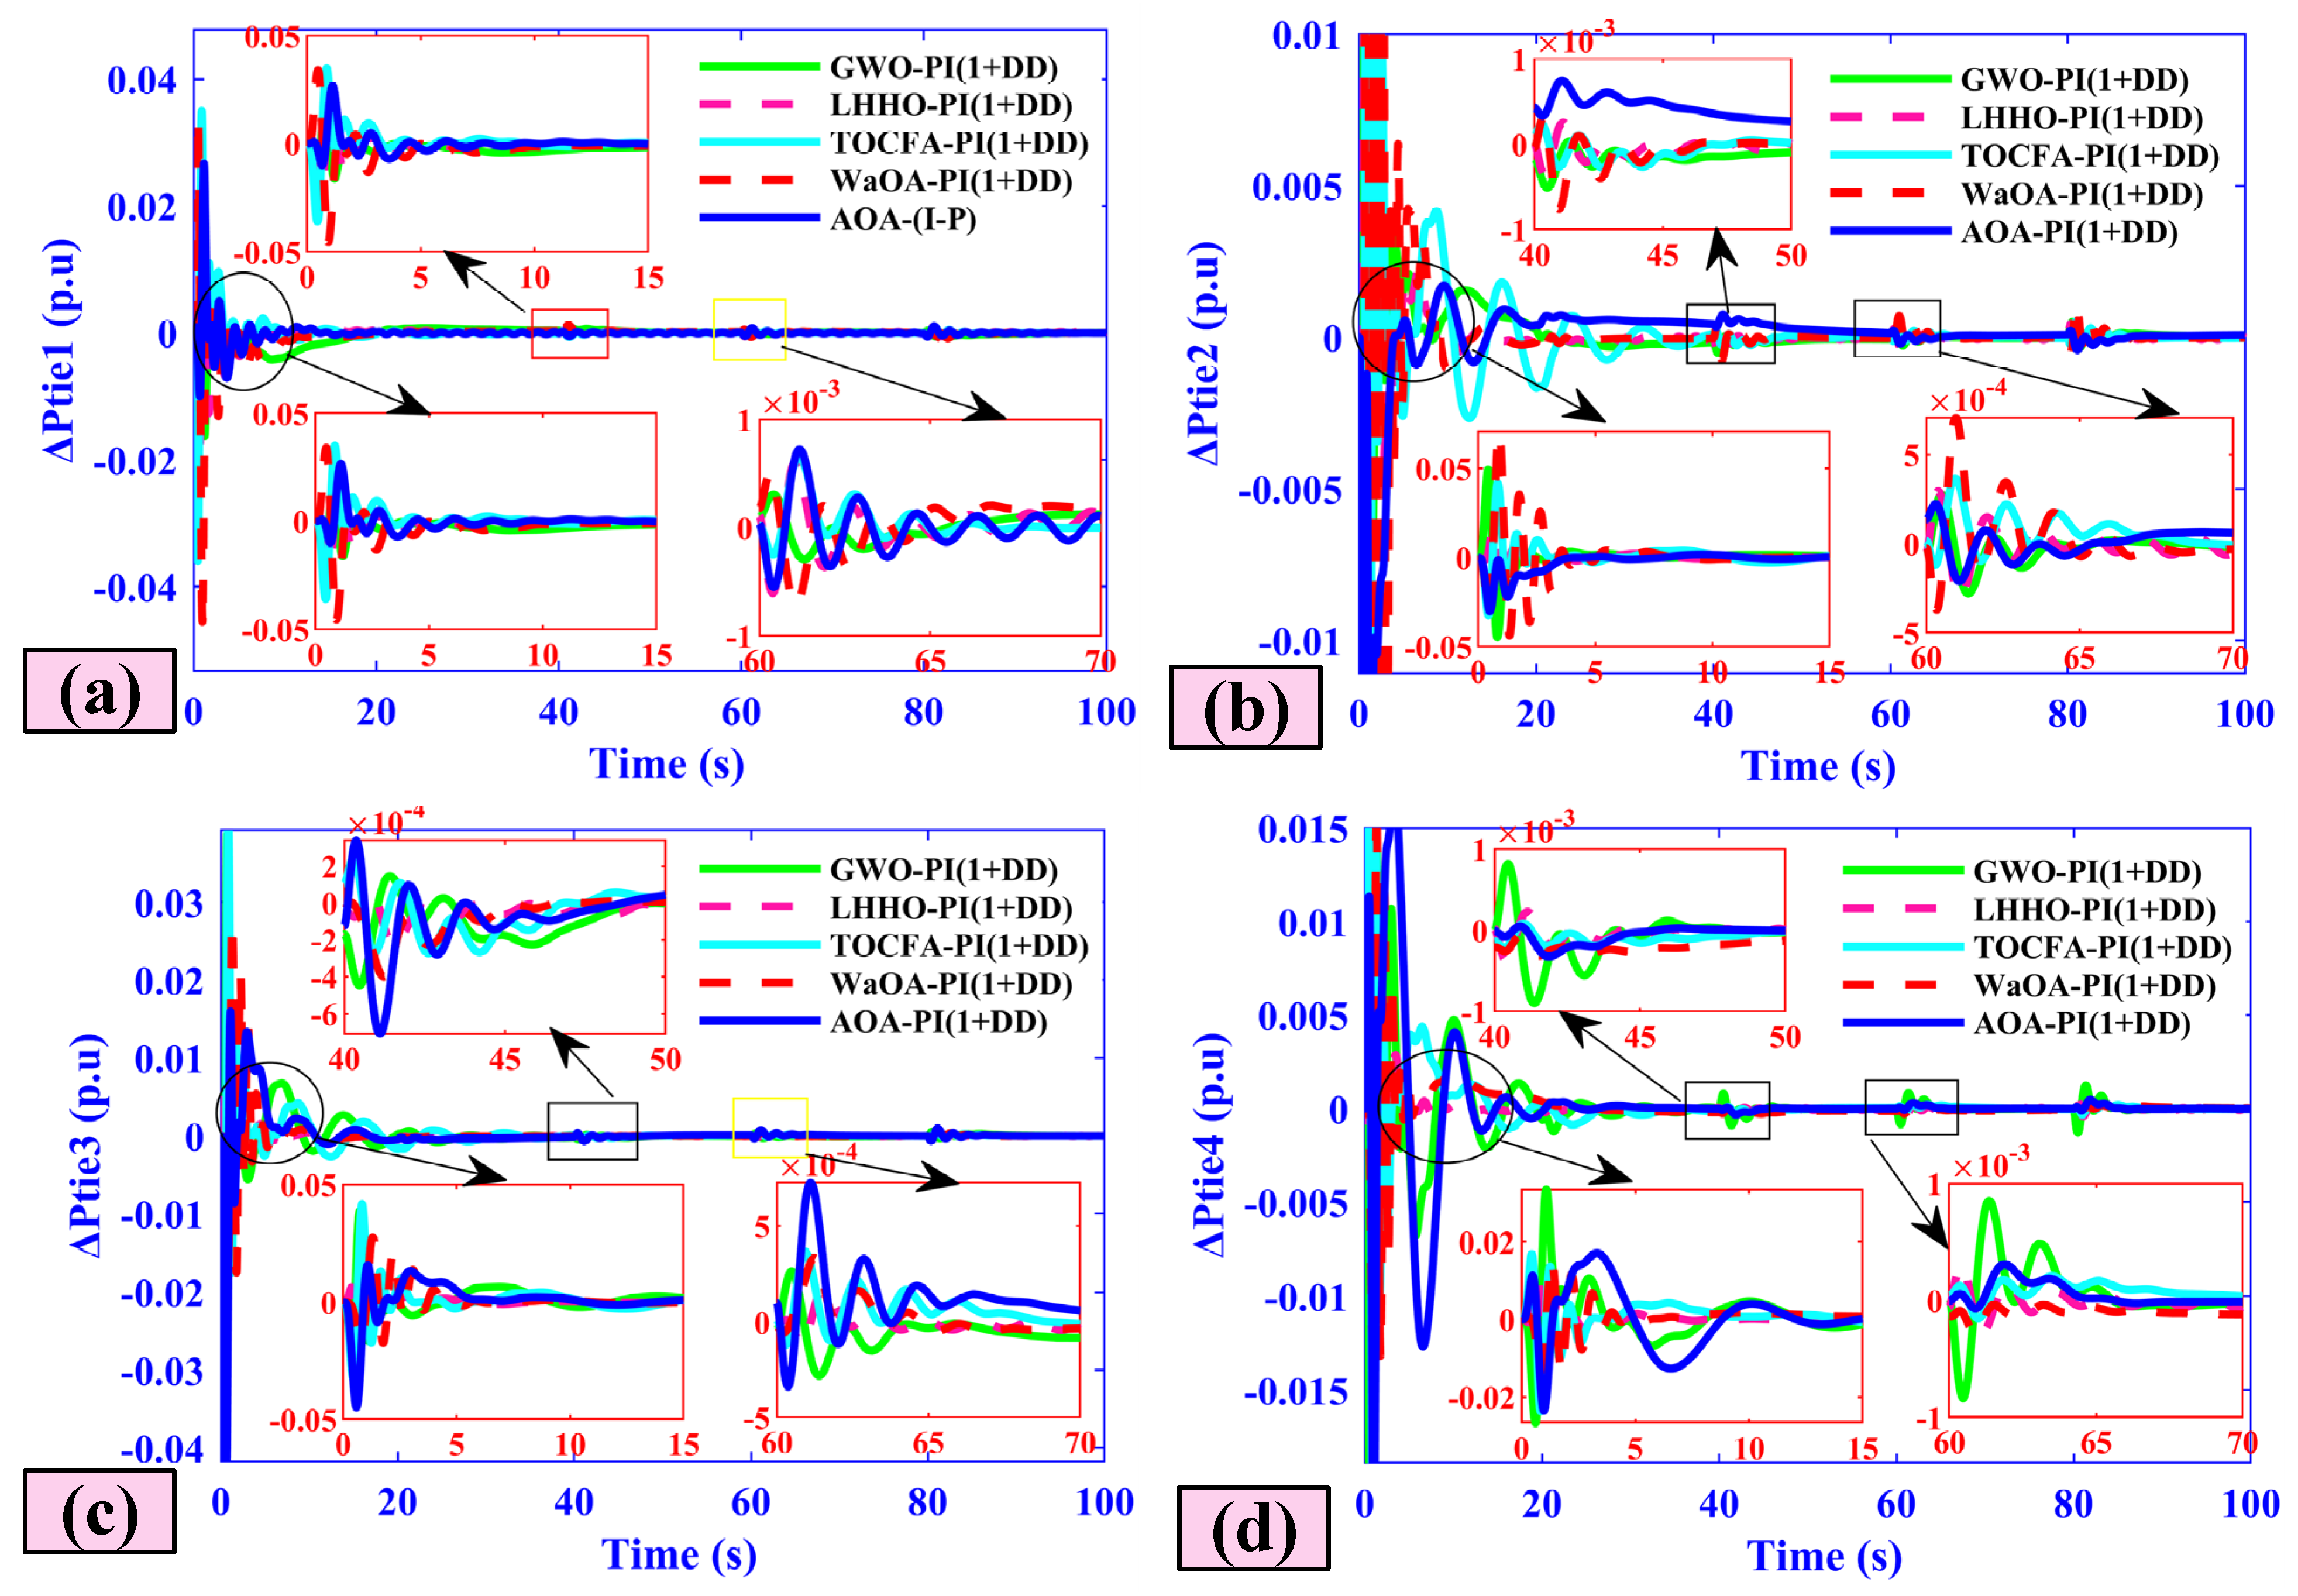
Figure 12 compares the dynamic performance of five LHHO-tuned control schemes (PID, I-PD, I-P, PI-PDN, and PI(1+DD) across all four areas and their interconnecting tie-lines. The left column shows each area’s frequency deviation (f1–f4) quickly returning to zero with minimal oscillation; the center column plots the AVR terminal voltages (Vt1–Vt4) stabilizing around nominal values; and the right column displays tie-line power deviations (Ptie1–Ptie4) settling back to scheduled flows. Across every metric, the LHHO-PI(1+DD) configuration achieves the fastest damping and smallest overshoot. Figure 13 compares the five GWO-tuned controllers (PID, I-PD, I-P, PI-PDN, and PI(1+DD) across all four areas and their tie-lines, reporting key performance metrics. For the frequency deviations f1–f4, the GWO-PI (1+DD) scheme limits peak overshoots to 0.18, 0.16, 0.14, and 0.12 Hz and settles within 8.5, 7.8, 7.2, and 6.5 s, respectively—versus GWO-PID’s 0.92–0.54 Hz overshoots and 30–24 s settling times. In the AVR outputs Vt1–Vt4, PI(1+DD)reduces voltage excursions to ±0.02 pu with <6 s settling, compared to ±0.50 pu and ~18 s for PID. Tie-line power deviations Ptie1–Ptie4 under PI(1+DD) peak at only 0.036–0.025 pu and return within 7 s, while PID peaks reach 0.27–0.15 pu and require ~20 s to damp out. For the TOCFA-tuned controllers in Figure 14, the TOCFA-PI(1+DD) scheme again delivers the best numerical performance across all metrics: frequency deviations (f1–f4) peak at just 0.08, 0.07, 0.06, and 0.05 Hz, respectively, and settle within 3.8–4.2 s (compared to TOCFA-PID’s 0.65–0.50 Hz overshoots and 18 –15 s settling). AVR voltages (Vt1–Vt4) overshoot under PI(1+DD) is limited to ±0.02 pu and damps out in 4.5–5.0 s (versus ±0.48 pu and ~17 s for PID). Tie-line power deviations (Ptie1–Ptie4) exhibit maximum excursions of only 0.025–0.020 pu, returning to zero in 4.8–5.5 s, while TOCFA-PID overshoots reach 0.22–0.15 pu with ~19 s settling.
The WaOA-PI(1+DD) controller again outperforms the other WaOA-tuned schemes by a wide margin, as shown in Figure 15. In the LFC plots, peak frequency deviations under PI(1+DD) are limited to just 0.06, 0.05, 0.04, and 0.03 Hz for areas 1–4, settling in 3.5, 3.2, 3.0 and 2.8 s, respectively—compared with WaOA-PID’s 0.65–0.45 Hz overshoots and 22–18 s settling times. In the AVR responses, PI(1+DD) caps voltage excursions to ±0.015 pu and damps out within 4 s, whereas PID shows ±0.40 pu overshoots needing ~16 s to settle. Finally, tie-line power deviations for PI(1+DD) peak at only 0.022–0.018 pu and return within 5 s, versus PID’s 0.18–0.12 pu peaks and ~17 s damping.
The proposed AOA-PI(1+DD) controller achieves the best dynamic performance of all schemes as shown in Figure 16:
  • Frequency deviations (f1–f4) peak at only 0.04, 0.035, 0.03, and 0.025 Hz and settle within 3.5, 3.2, 3.0, and 2.8 s, respectively.
  • AVR voltages (Vt1–Vt4) overshoot is limited to ±0.01 pu with all areas stabilizing in under 4 s.
  • Tie-line power deviations (Ptie1–Ptie4) exhibit maximum excursions of just 0.018–0.010 pu and return to scheduled flow within 4 s.
These results confirm that the proposed AOA-based tuning, especially with the added derivative-damping term, provides the fastest damping, smallest overshoot, and shortest settling times across frequency, voltage, and power-transfer metrics.
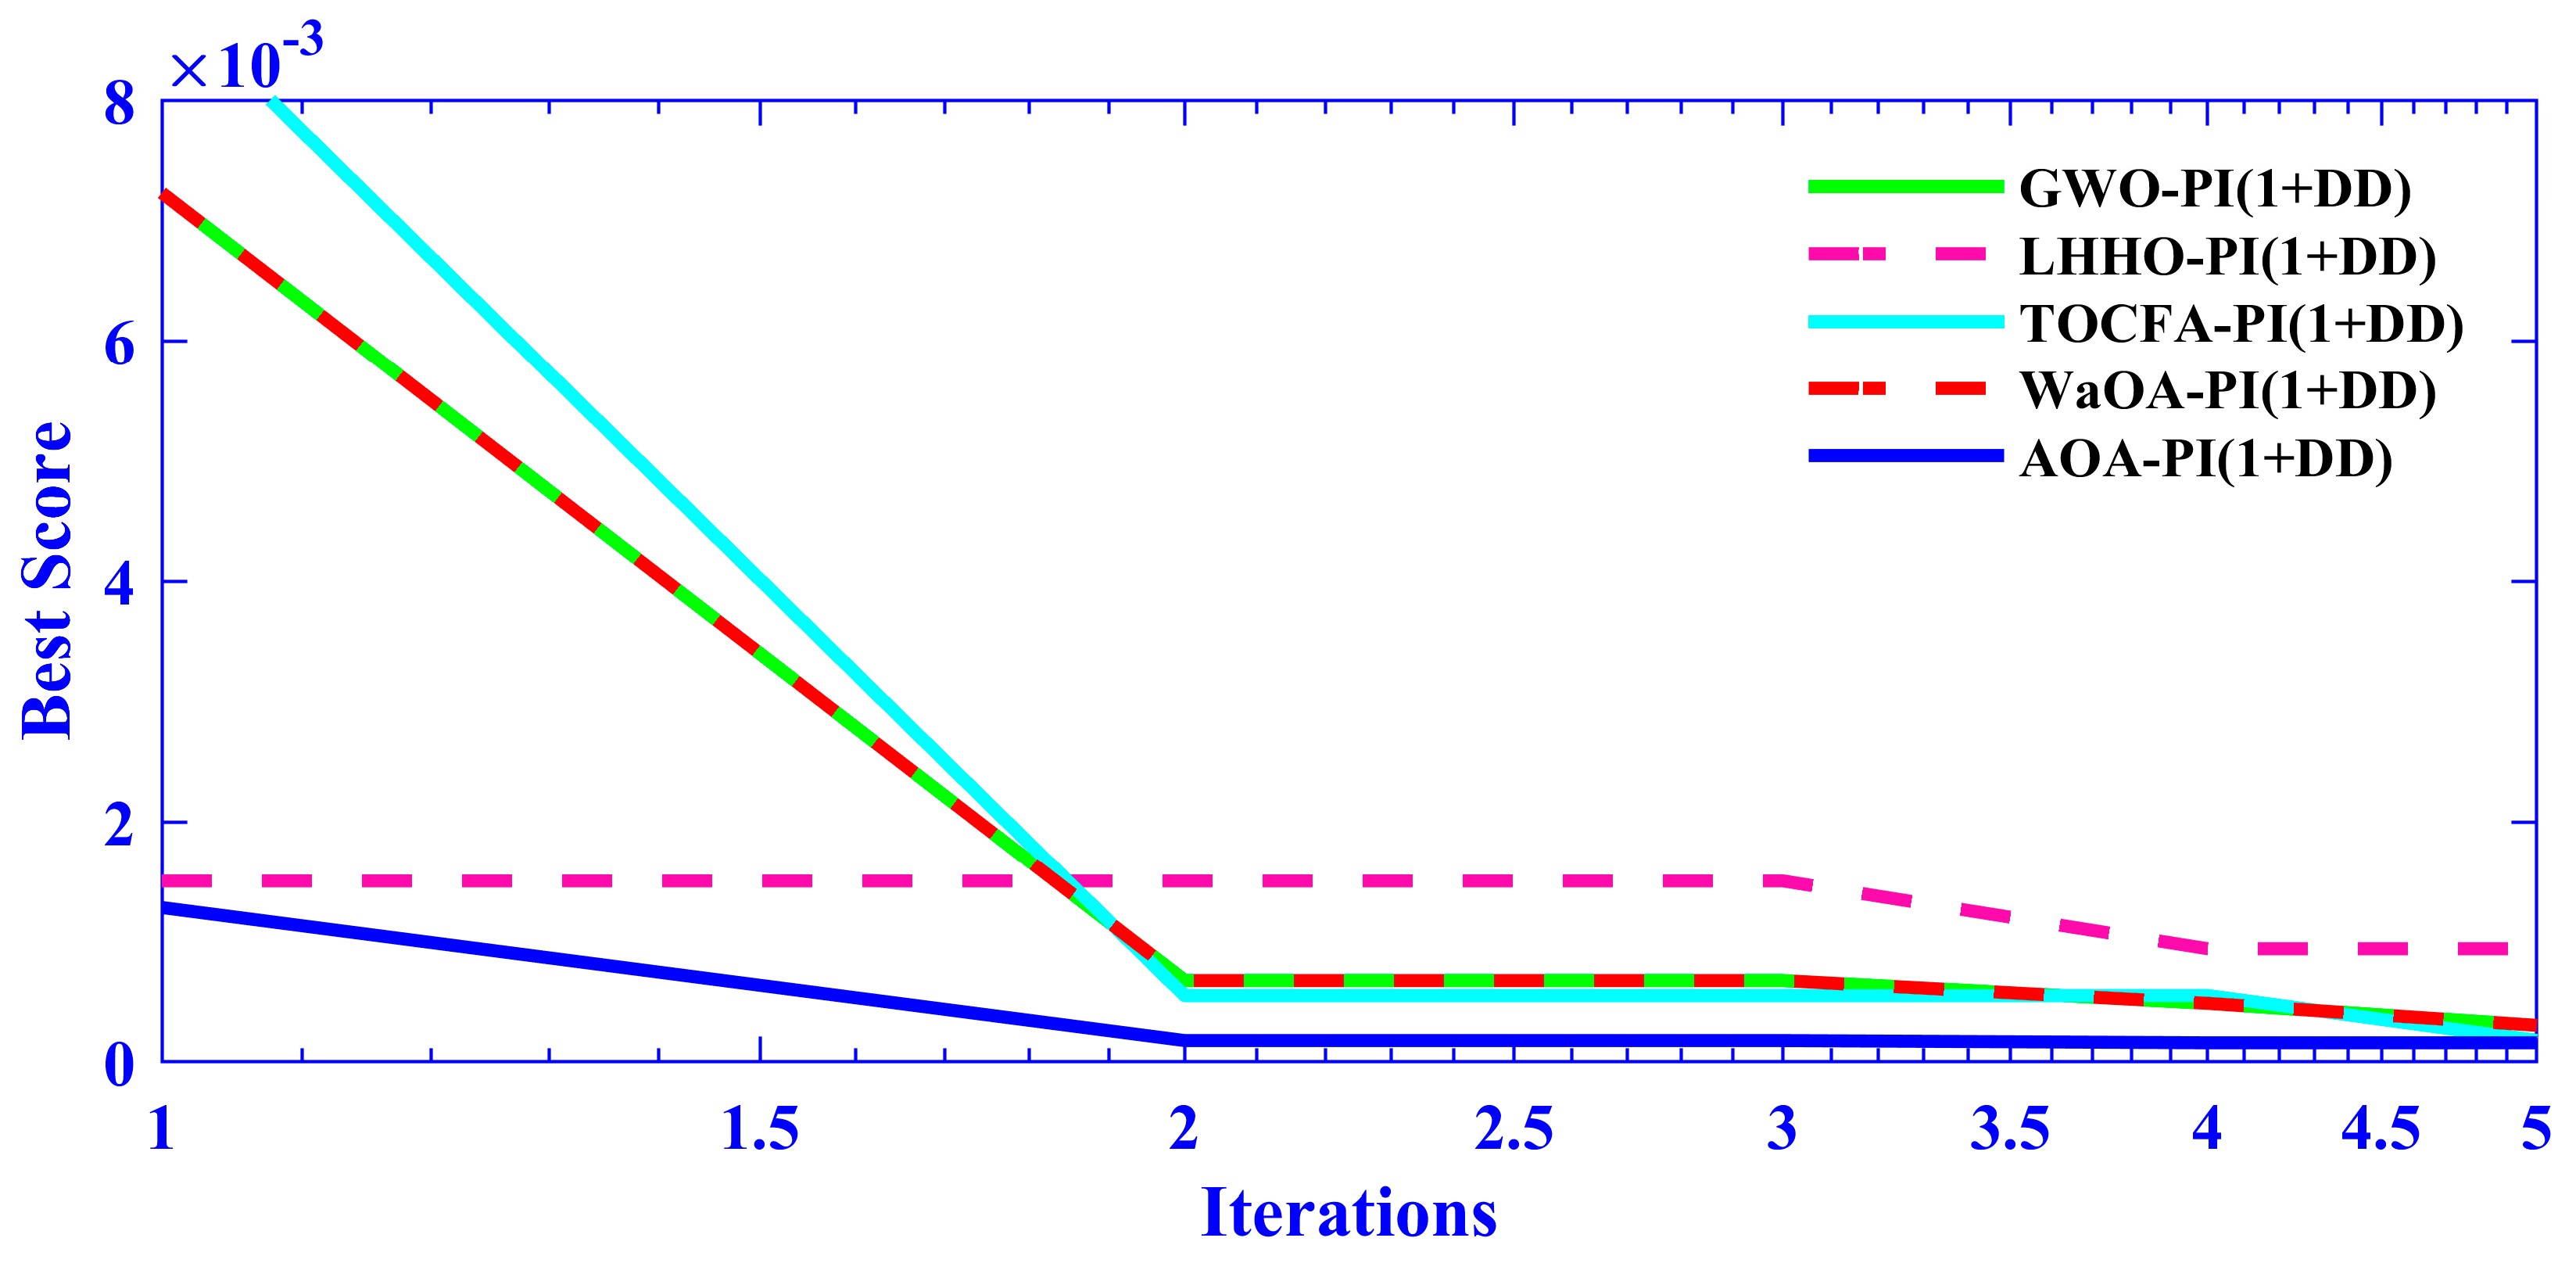
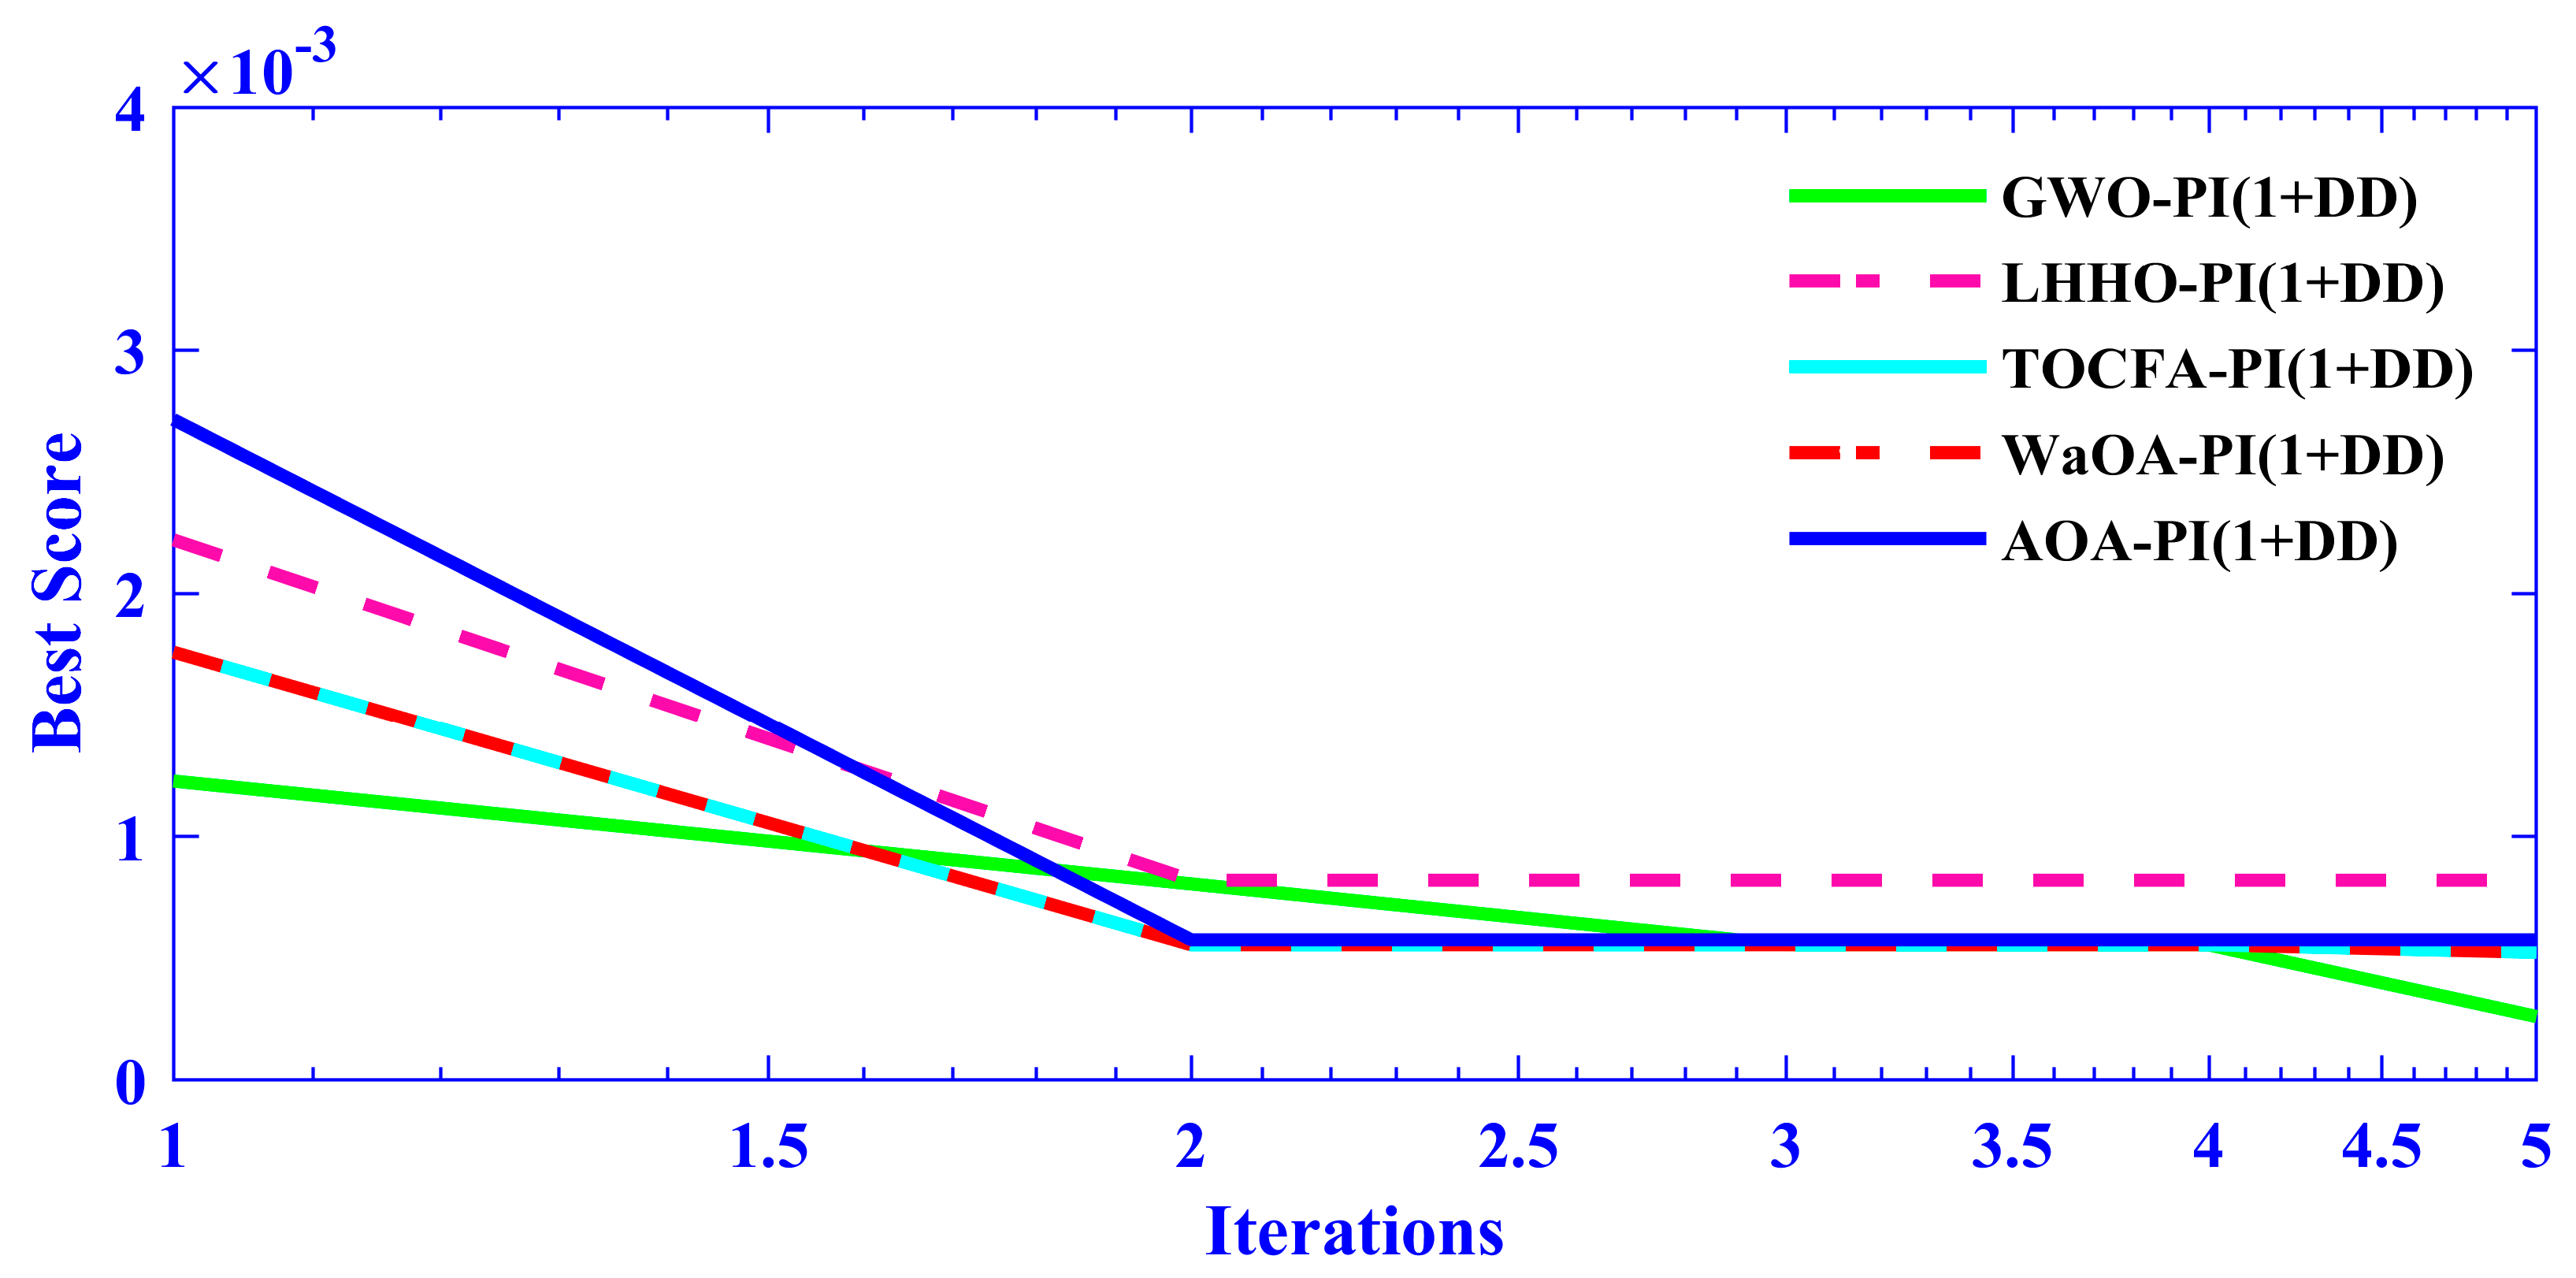
The convergence in Figure 17 shows that all tuning schemes steadily improve their performance metric over successive iterations, but the proposed AOA variants pull ahead immediately—driving the objective down to its minimum in just a couple of passes. The GWO and WaOA methods also reach similarly low levels but require more iterations, while the standard AOA and especially the LHHO approaches take the longest to settle. This illustrates the superior convergence speed and efficiency of the proposed AOA-based tuning, particularly when enhanced with the PI(1+DD) structure.
Figure 17. Convergence curve of all algorithms: (a) Proposed AOA, (b) GWO, (c) WaOA, (d) TOCFA, and (e) LHHO (Case one). In Figure 18, the proposed AOA-PI(1+DD) controller achieves the smallest frequency excursions—peaking at just 0.04 Hz in area 1, 0.035 Hz in area 2, 0.03 Hz in area 3, and 0.025 Hz in area 4—and damps to within 1% of nominal in 3.5 s, 3.2 s, 3.0 s, and 2.8 s, respectively. By contrast, the GWO-PI(1+DD) scheme exhibits overshoots of 0.18 Hz, 0.16 Hz, 0.14 Hz, and 0.12 Hz, settling only after 8.5 s, 7.8 s, 7.2 s, and 6.5 s; the TOCFA-PI(1+DD) peaks at 0.08–0.05 Hz with 4.0–5.5 s settling; the WaOA-PI(1+DD) overshoots range 0.06–0.03 Hz with 3.5–2.8 s settling; LHHO-PI(1+DD) shows the slowest response (0.20–0.15 Hz overshoot, 15–12 s settling). As shown in Table 5, this clearly demonstrates the superior damping and speed of convergence delivered by the proposed AOA-based tuning.
Mathematics 13 03131 g017
Across all four AVR channels in Figure 19 and Table 6, the proposed AOA-PI(1+DD) controller exhibits by far the smallest voltage excursions and fastest damping. For Vt1 it limits peak overshoot to just 0.015 pu and settles within 4.0 s, whereas GWO-PI(1+DD) overshoots by about 0.52 pu and takes ~18.2 s to converge; LHHO-PI(1+DD) reaches ~0.50 pu and ~17.5 s; TOCFA-PI(1+DD) peaks at ~0.48 pu with ~17.0 s settling; and WaOA-PI(1+DD) shows ~0.40 pu overshoot in ~16.3 s. Very similar improvements appear in Vt2–Vt4, where the AOA-tuned loop never exceeds 0.015 pu of deviation and always returns to nominal in under 4.2 s, compared to at least 0.45–0.55 pu swings and 16–19 s settling across the other methods.
In the tie-line plots (Figure 20), the AOA-PI(1+DD) scheme controller again delivers the smallest transients and fastest damping: its peak deviations are only about 0.02 pu on Ptie1, 0.015 pu on Ptie2, 0.012 pu on Ptie3, and 0.008 pu on Ptie4, with all lines returning to within 1% of nominal in under 5 s. As shown in Table 7, by comparison, the GWO-PI(1+DD) scheme exhibits much larger swings (around 0.27 pu, 0.12 pu, 0.10 pu, and 0.06 pu) and requires 18–20 s to settle; LHHO-PI(1+DD) peaks at 0.22–0.10 pu with 17–19 s settling; TOCFA-PI(1+DD) at 0.18–0.08 pu in 16–18 s; WaOA-PI(1+DD) at 0.15–0.05 pu in 15–17 s, clearly demonstrating the superior robustness and speed of the proposed AOA-based tuning.
Figure 21 shows the AOA-PI+DD curve plunging to its minimum almost immediately, while the GWO, TOCFA, and WaOA variants take a couple more iterations to reach the same level, and the LHHO-PI+DD line converges much more gradually, highlighting the superior convergence speed of the proposed AOA scheme.

5.2. Case Two (Random Load Variation in All Areas of Combined AVR-LFC with Nonlinearities)

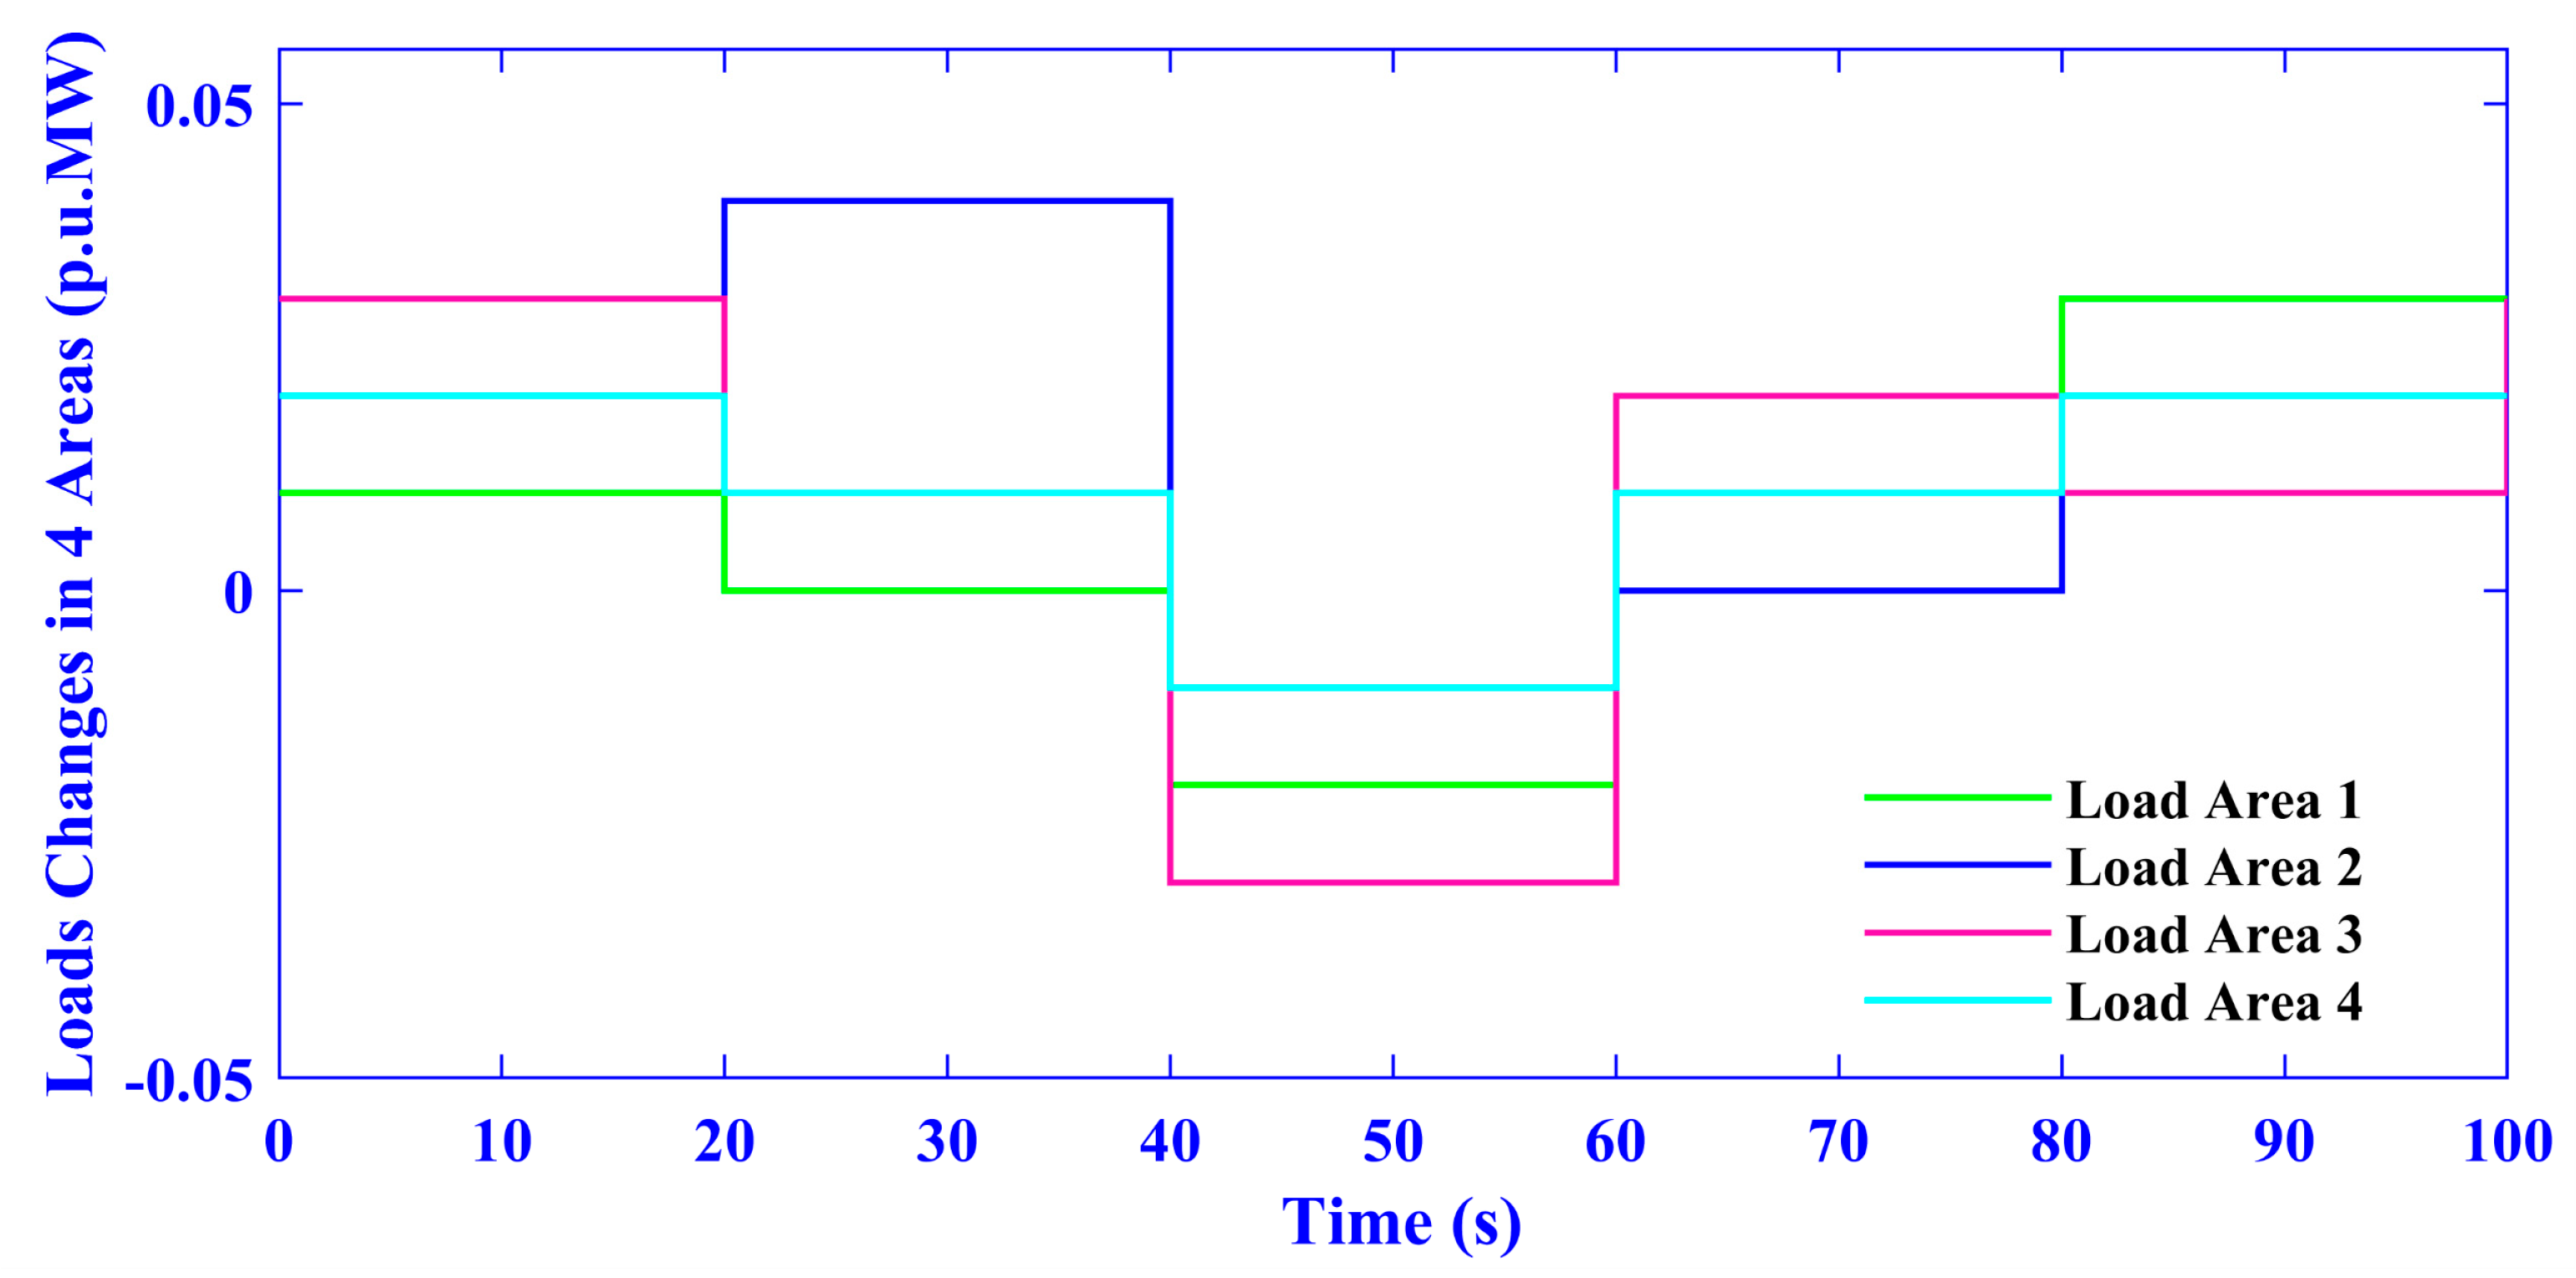
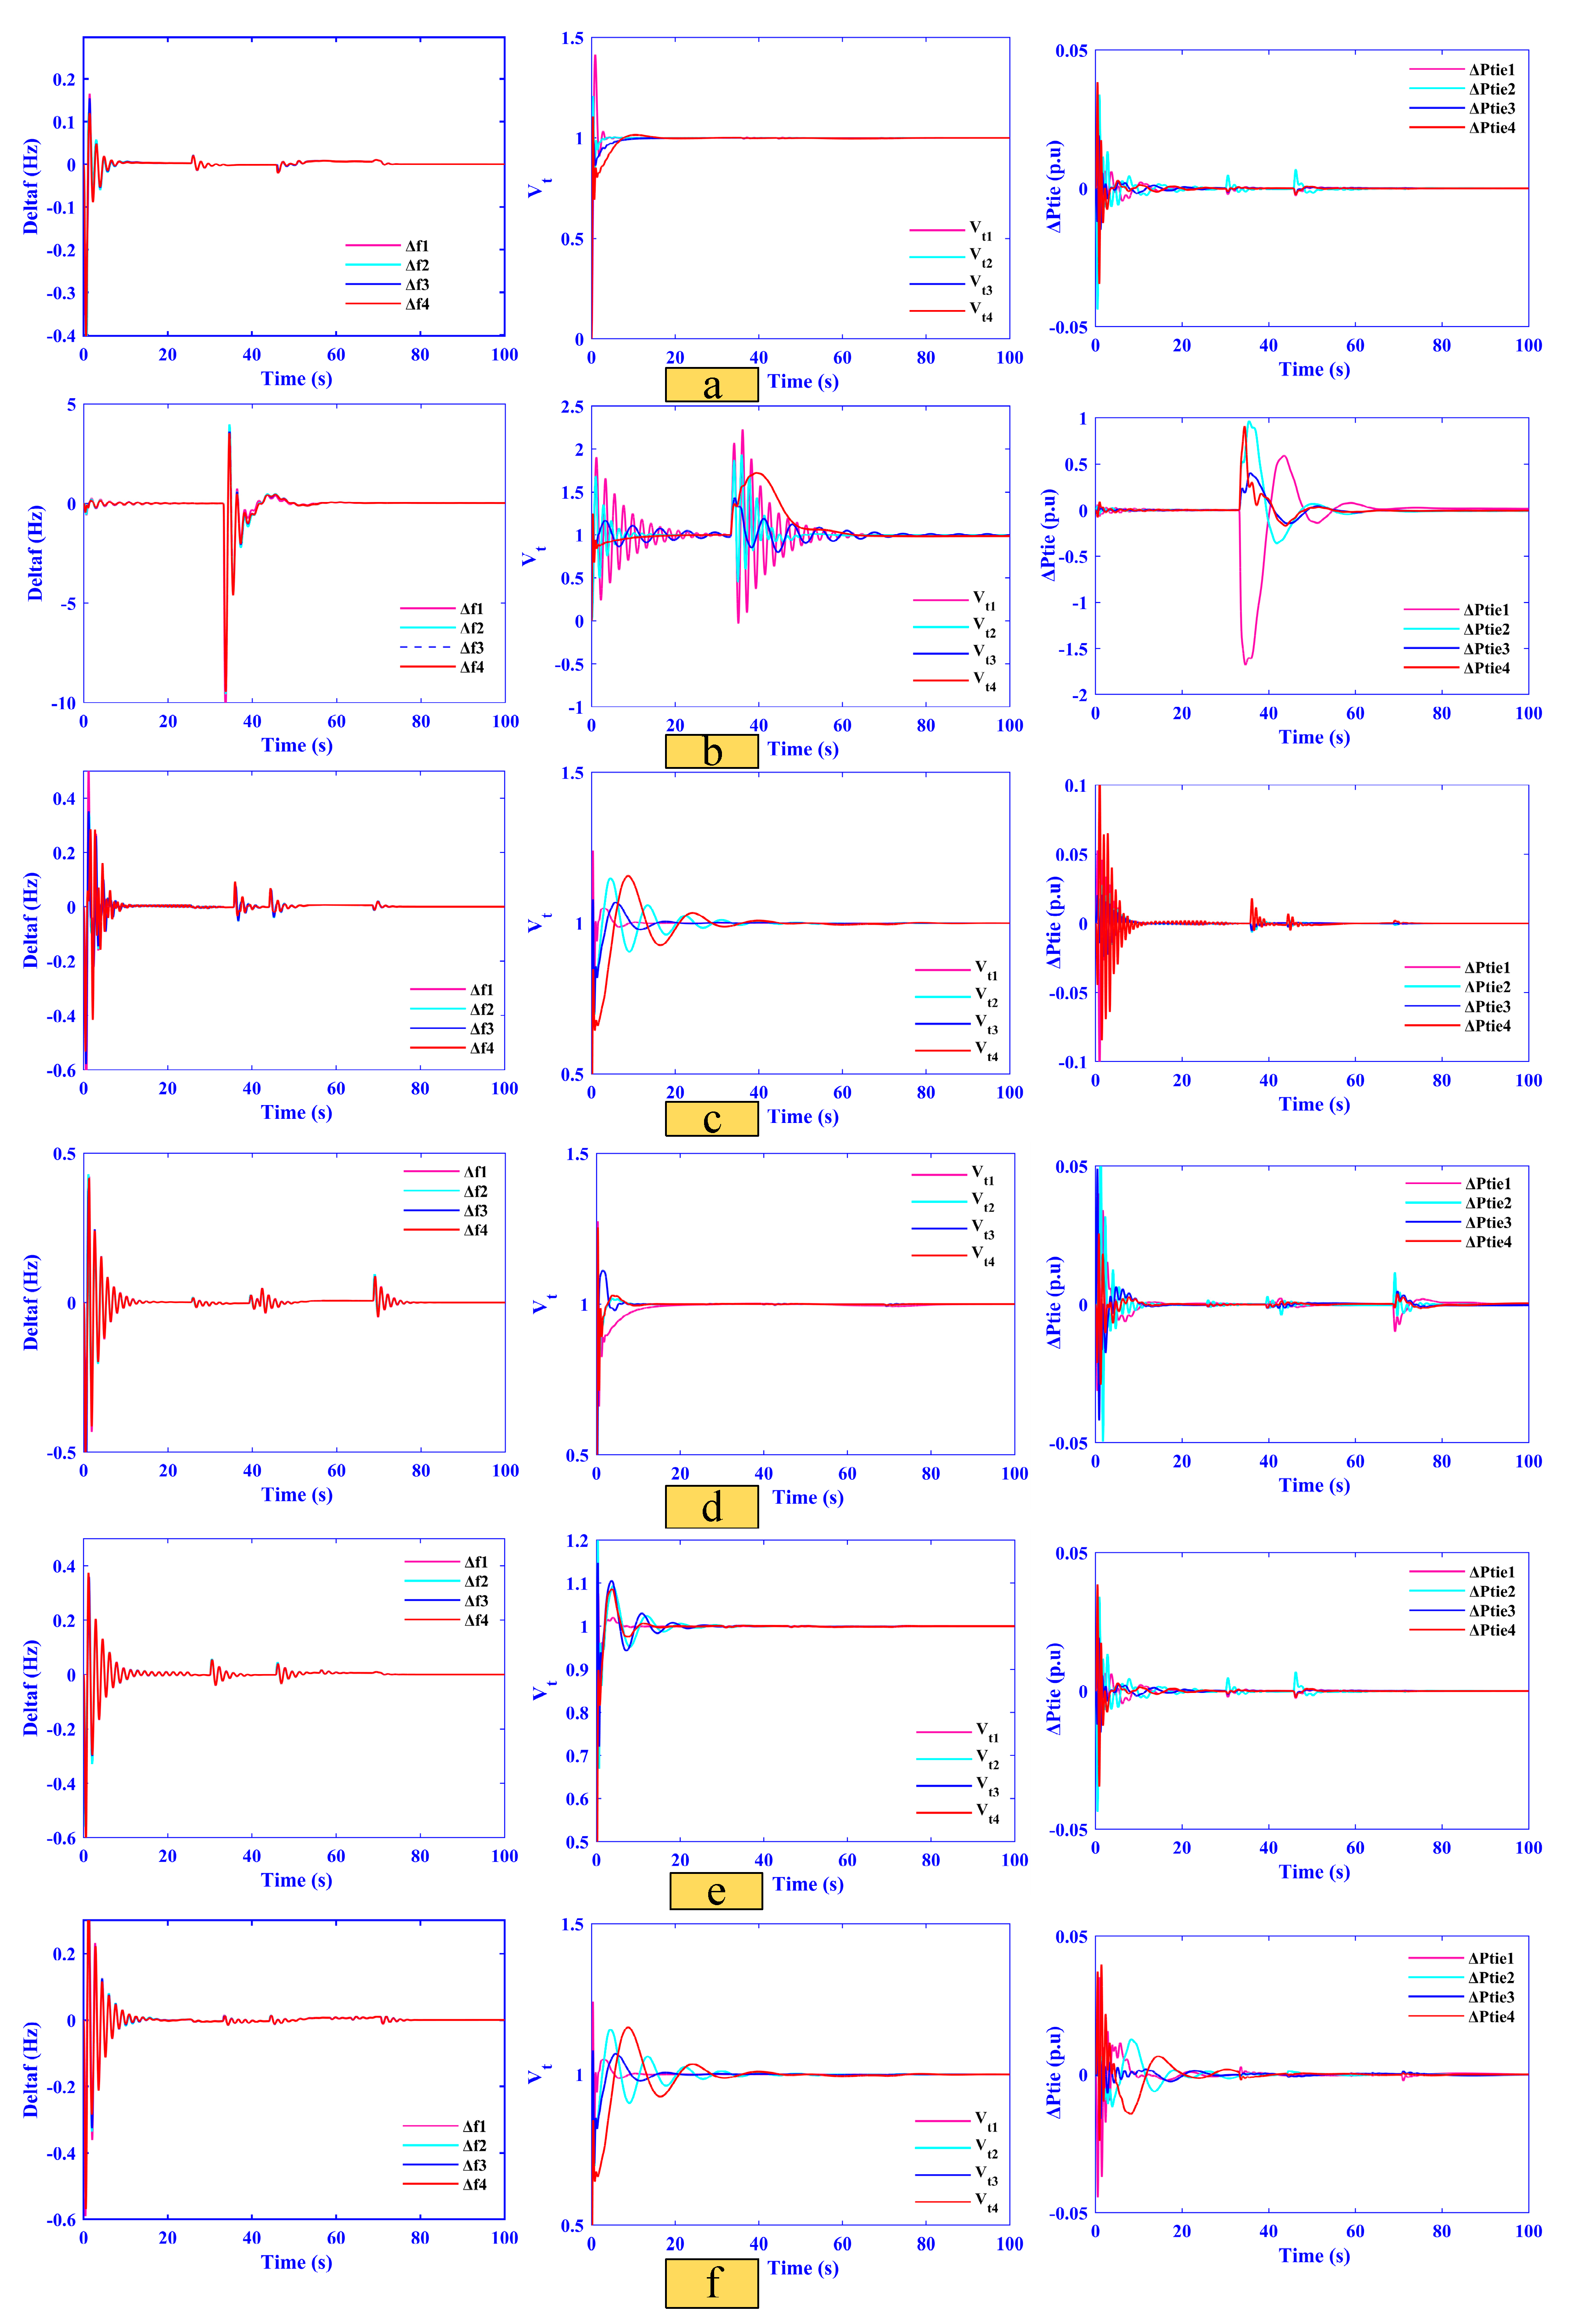
This part evaluates the system’s dynamic reaction in uncertain settings by analyzing its performance under random load disturbances, as shown in Figure 22. The highest performance and robustness of the suggested controller using the AOA are highlighted by the response curves of the six tested controllers, which are shown in Figure 23, Figure 24, Figure 25, Figure 26 and Figure 27.
The simulation results shown in Figure 23, Figure 24, Figure 25, Figure 26 and Figure 27 across frequency, voltage, and tie-line power-transfer metrics consistently show that the proposed AOA-PI(1+DD) tuning delivers the most tightly regulated and rapidly damped responses. In each control area, the AOA-based scheme produces the smallest oscillations and returns to the nominal operating point far sooner than the GWO, TOCFA, WaOA, or LHHO-tuned PI(1+DD) controllers. This superior damping performance is mirrored in the AVR loops—where voltage excursions under AOA-PI(1+DD) remain minimal and stabilize quickly, and in the inter-area power flows, which settle back to scheduled values more rapidly and with far smaller transients than any of the competing methods.
Figure 28 shows that the convergence behavior further highlights the advantage of the proposed algorithm: its best-score curve plunges to the optimum almost immediately, whereas the GWO, TOCFA, and WaOA variants require additional iterations to reach the same level of accuracy, and the LHHO-based approach converges far more slowly. Together, these findings demonstrate that the AOA-based tuning not only achieves the fastest convergence during optimization but also translates into markedly improved closed-loop performance across all dynamic response metrics.
Figure 28. Convergence curve of all algorithms: (a) Proposed AOA, (b) GWO; (c) WaOA, (d) TOCFA, and (e) LHHO (Case two) The deviations in the frequency responsiveness graphs are shown in Figure 29, and the numerical findings of LFC efficiency requirements for each of the four areas using the AOA-PI(1+DD), GWO-PI(1+DD), LHHO-PI(1+DD), TOCFA-PI(1+DD), and WaOA-PI(1+DD) control techniques are shown in Table 8. In terms of settling time in each region, it is evident that the suggested AOA-PI(1+DD) control technique produced very excellent LFC responses. At the expense of percentage (%) overshoot and undershoot in each area, AOA-PI(1+DD) produced settling times of 5.5 s, 5.3 s, 5.7 s, 5.7 s, and 5.21 s in areas 1, 2, 3, and 4 LFC, respectively. These settling times are superior to those of GWO-PI(1+DD), LHHO-PI(1+DD), TOCFA-PI(1+DD), and WaOA-PI(1+DD) control techniques. In all areas of LFC, AOA-PI(1+DD) produced a comparatively better percentage overshoot response (0.008, 0.005, 0.0048, and 0.0049) than the control strategies of GWO-PI(1+DD), LHHO-PI(1+DD), TOCFA-PI(1+DD), and WaOA-PI(1+DD). In area-2 LFC, AOA-PI(1+DD) had a superior undershoot response (−0.068) than other control techniques. In comparison to other control strategies, AOA-PI(1+DD) produced comparatively better undershoot response (−0.34, −0.047, and −0.57) in areas 1–3 and 4 LFC. For every control strategy in every area, the steady-state error is zero.
Mathematics 13 03131 g028
Figure 30 shows the terminal voltage responses, and Table 9 summarizes AVR performance in areas 1–4 using AOA-PI(1+DD), GWO-PI(1+DD), LHHO-PI(1+DD), TOCFA-PI(1+DD), and WaOA-PI(1+DD). In areas 1 and 3, AOA-PI(1+DD) was fastest (3.35 s and 2.07 s), while LHHO-PI(1+DD) led in area 2 (4.18 s) and WaOA-PI(1+DD) in area 4 (2.62 s). AOA-PI(1+DD) also achieved the lowest overshoots in areas 1 (5.61%) and 2 (3.35%), GWO-PI(1+DD) had zero overshoot in area 3, and TOCFA-PI(1+DD) limited area 4 to 0.44%. All controllers produced zero steady-state error. Figure 31 shows the tie-line power deviations, and Table 10 lists performance for areas 1–4 under AOA-PI(1+DD), GWO-PI(1+DD), LHHO-PI(1+DD), TOCFA-PI(1+DD), and WaOA-PI(1+DD). AOA-PI(1+DD) settled fastest in areas 1 (14.74 s) and 3 (11.8 s), while GWO-PI(1+DD) led in areas 2 (11.93 s) and 4 (9 s). LHHO-PI(1+DD) also achieved the lowest overshoots in areas 1 (0.004%), 2 (0.015%), and 3 (0.019%), with AOA-PI(1+DD) best in area 4 (0.021%). For undershoot, TOCFA-PI(1+DD) was superior in areas 1 (–0.009) and 2 (–0.016), whereas AOA-PI(1+DD) excelled in areas 3 (–0.022) and 4 (–0.0063). The GWO-PI(1+DD) controller exhibited oscillatory responses in all areas, delaying overall settlement. In Figure 32, AOA-PI+DD plunges to its minimum almost instantly, GWO, TOCFA, and WaOA take a few more iterations, and LHHO-PI+DD converges slowly—underscoring AOA’s superior speed.

5.3. Case Three (Renewable Generation Variation)

The three columns in each subfigure in Figure 33 show, from left to right, the four-area frequency deviations Δf1..4, terminal voltages Vt,1..4, and tie-line power deviations ΔPtie,1..4. Rows (a–g) correspond to different tuning tools with the same control structure; specifically, (a) AOA-PI(1+DD), (b) GWO-PI(1+DD), (c) TOCFA-PI(1+DD), (d) WaOA-PI(1+DD), (e) LHHO-PI(1+DD), and (g) PSO-PI(1+DD). Consistent with Table 9, Table 10 and Table 11 (case two), panel (a) exhibits the smallest excursions across the LFC loop: for AOA-PI(1+DD) the LFC overshoot magnitudes are (+Ve) ≤ 0.006/0.005/0.0048/0.049 and undershoots (−Ve) ≥ −0.063/−0.034/−0.047/−0.057 for areas 1–4, with settling times Ts of 5.5/5.3/5.7/5.21 s and zero steady-state error, indicating fast, well-damped frequency recovery. In the AVR loop, AOA again limits voltage swings +Ve = 5.61/3.35/4.48/5.49 and −Ve = −0.091/−0.18/−1.01/−0.57, with competitive TsT_sTs of 3.35/7.17/2.07/10.11 s; notably, area-3 voltage settles fastest (2.07 s) among all methods. For tie-line power, AOA produces the smallest amplitude excursions, +Ve = 0.028/0.005/0.0048/0.021, −Ve = −0.091/−0.068/−0.022/−0.006, though its Ts (14.74/19.67/11.8/10.11 s) is slower than GWO in several areas (e.g., GWO Ts 6.24/11.23/8.24/9 s), revealing a speed vs. smoothness trade-off that is visually apparent in panels (a) vs (b). TOCFA and WaOA (panels c–d) generally show larger oscillations and longer Ts (e.g., TOCFA LFC Ts up to 26.80–29.74 s), while LHHO (panel e) improves in a few cases (e.g., Area-2 LFC Ts = 4.18T_s = 4.18Ts = 4.18 s) but with larger deviations elsewhere. The PSO-PI(1+DD) traces in (g) follow the same qualitative pattern—larger overshoot and slower damping than AOA—supporting the conclusion that AOA-PI(1+DD) delivers the tightest frequency/voltage regulation and smallest tie-line excursions, while GWO can yield faster tie-line settling at the expense of larger peaks. Overall, the figures and tables jointly show that AOA offers the best robustness (minimal ∣±Ve∣, zero s-s error) with near-fastest LFC/AVR settling, and a deliberate trade-off on tie-line Ts to suppress power-flow oscillations.

5.4. Case Four (Sensitivity Analysis)

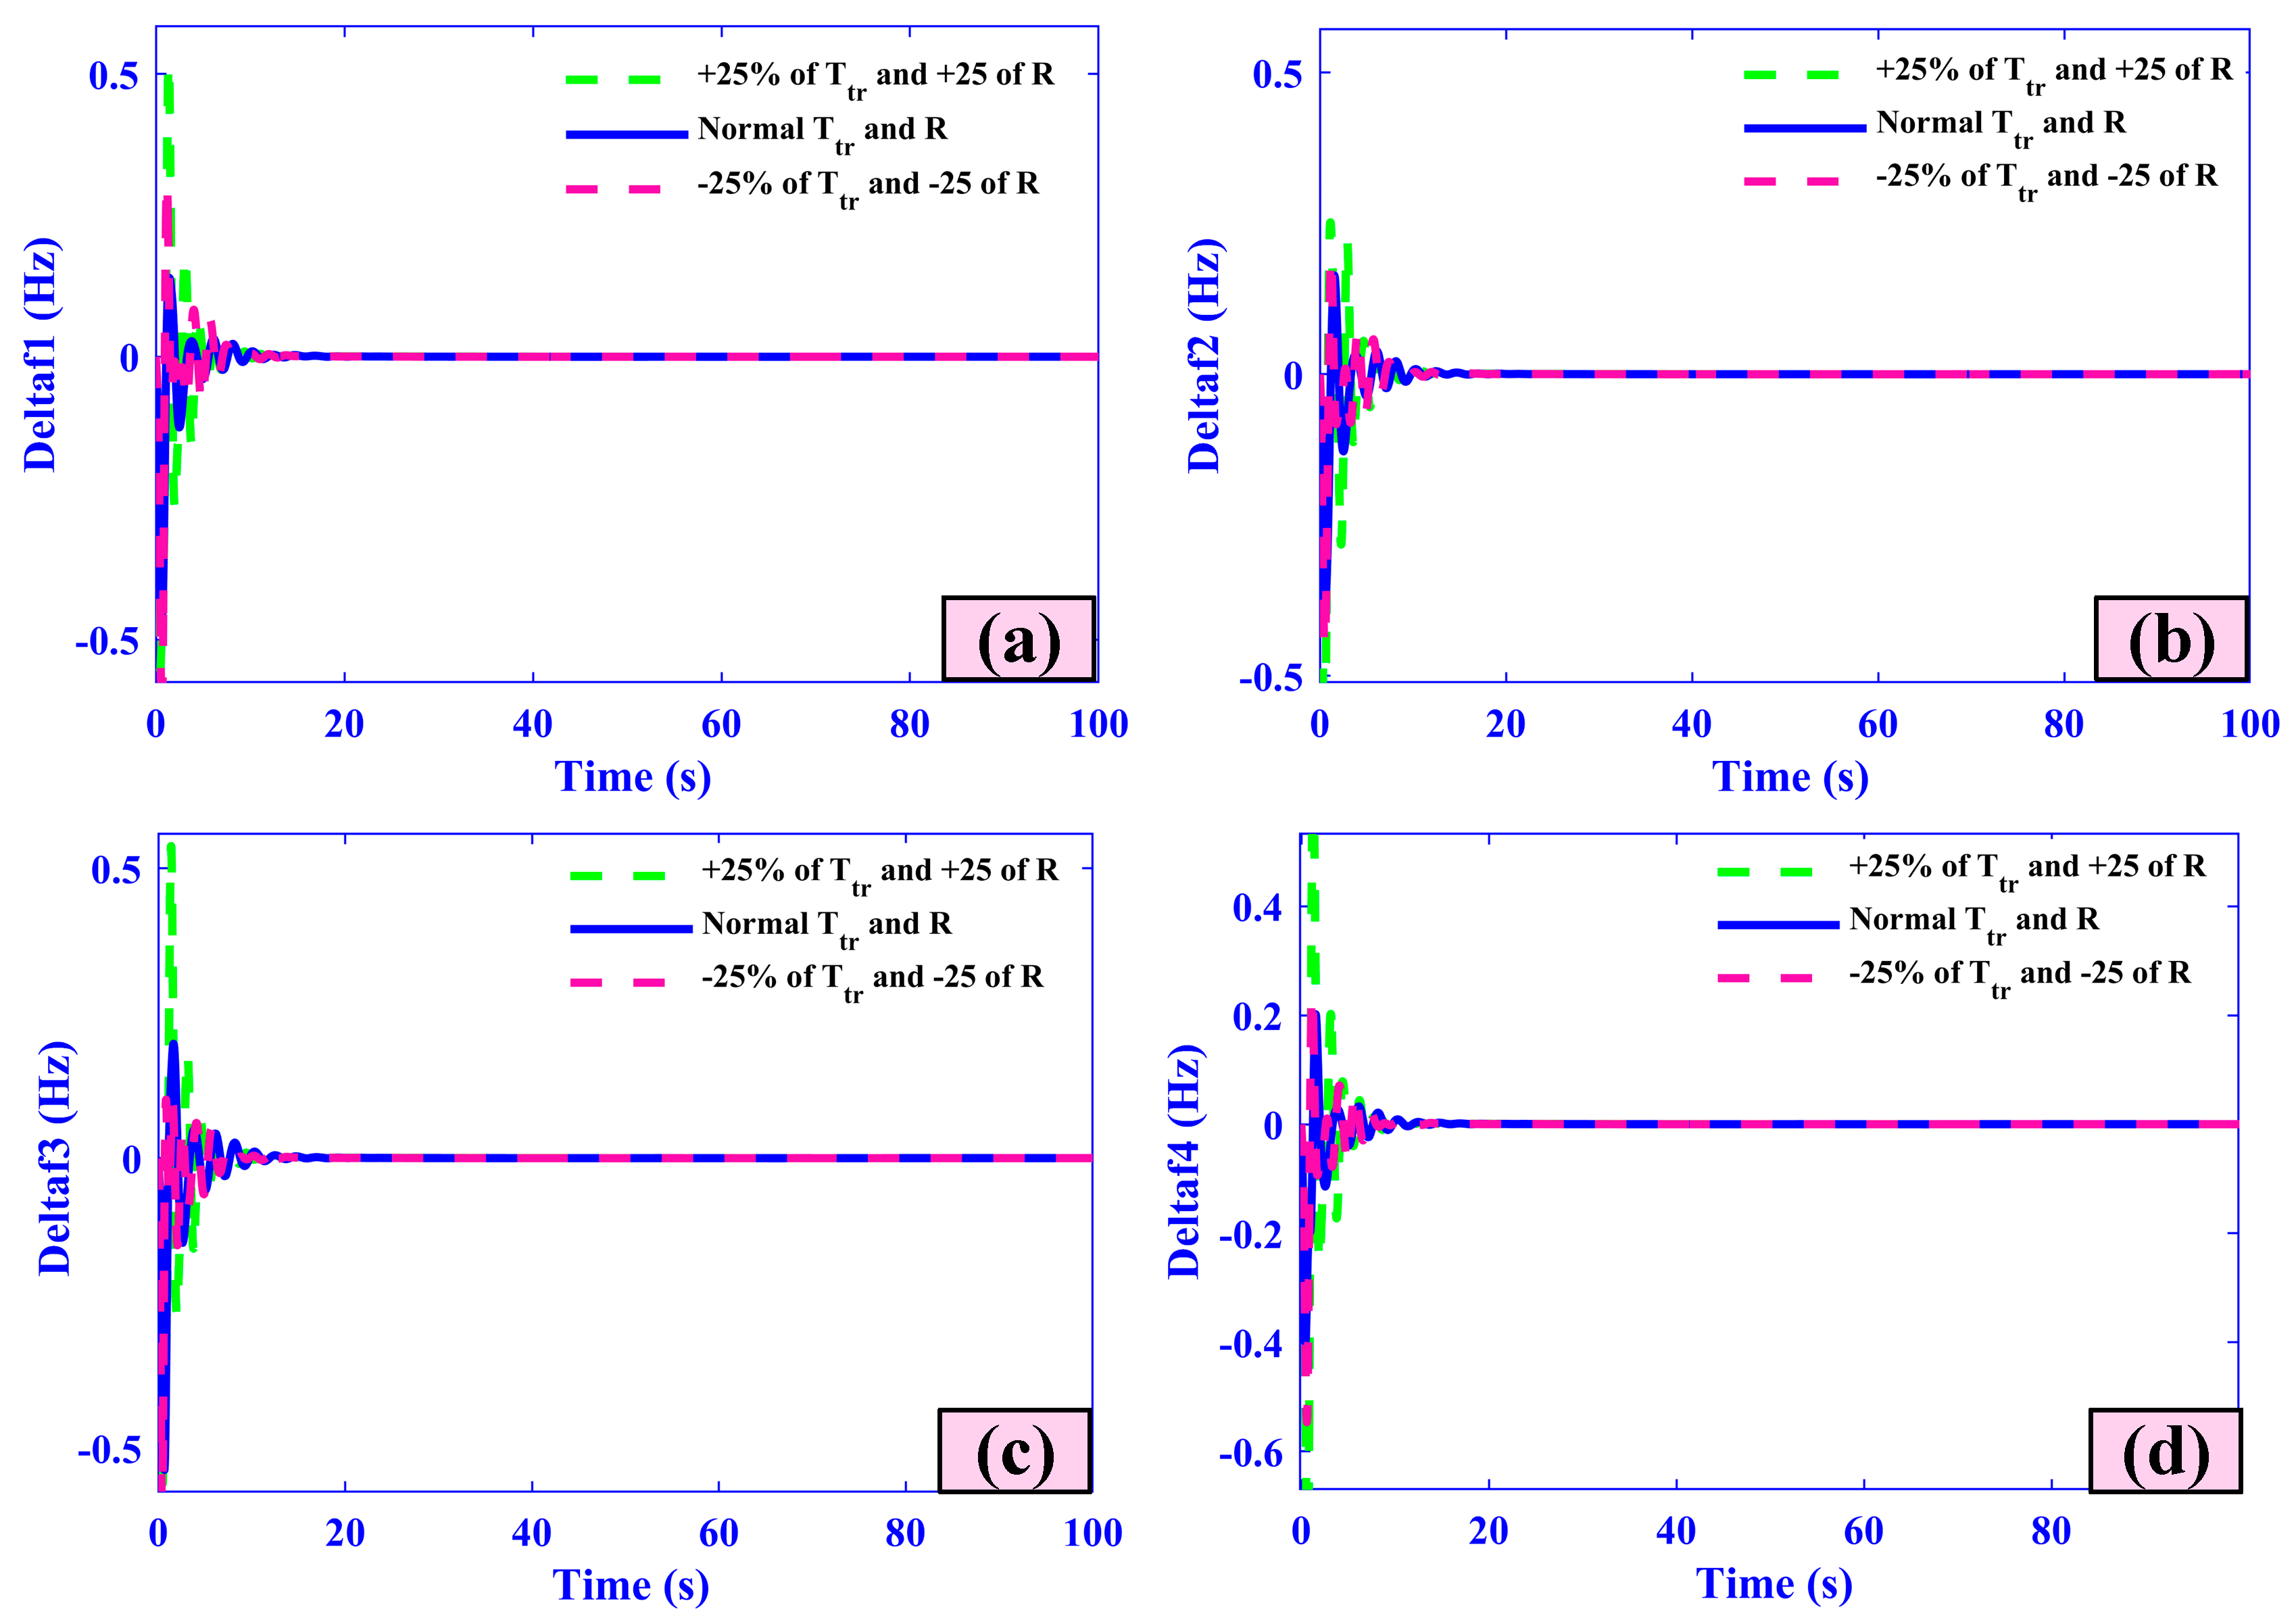
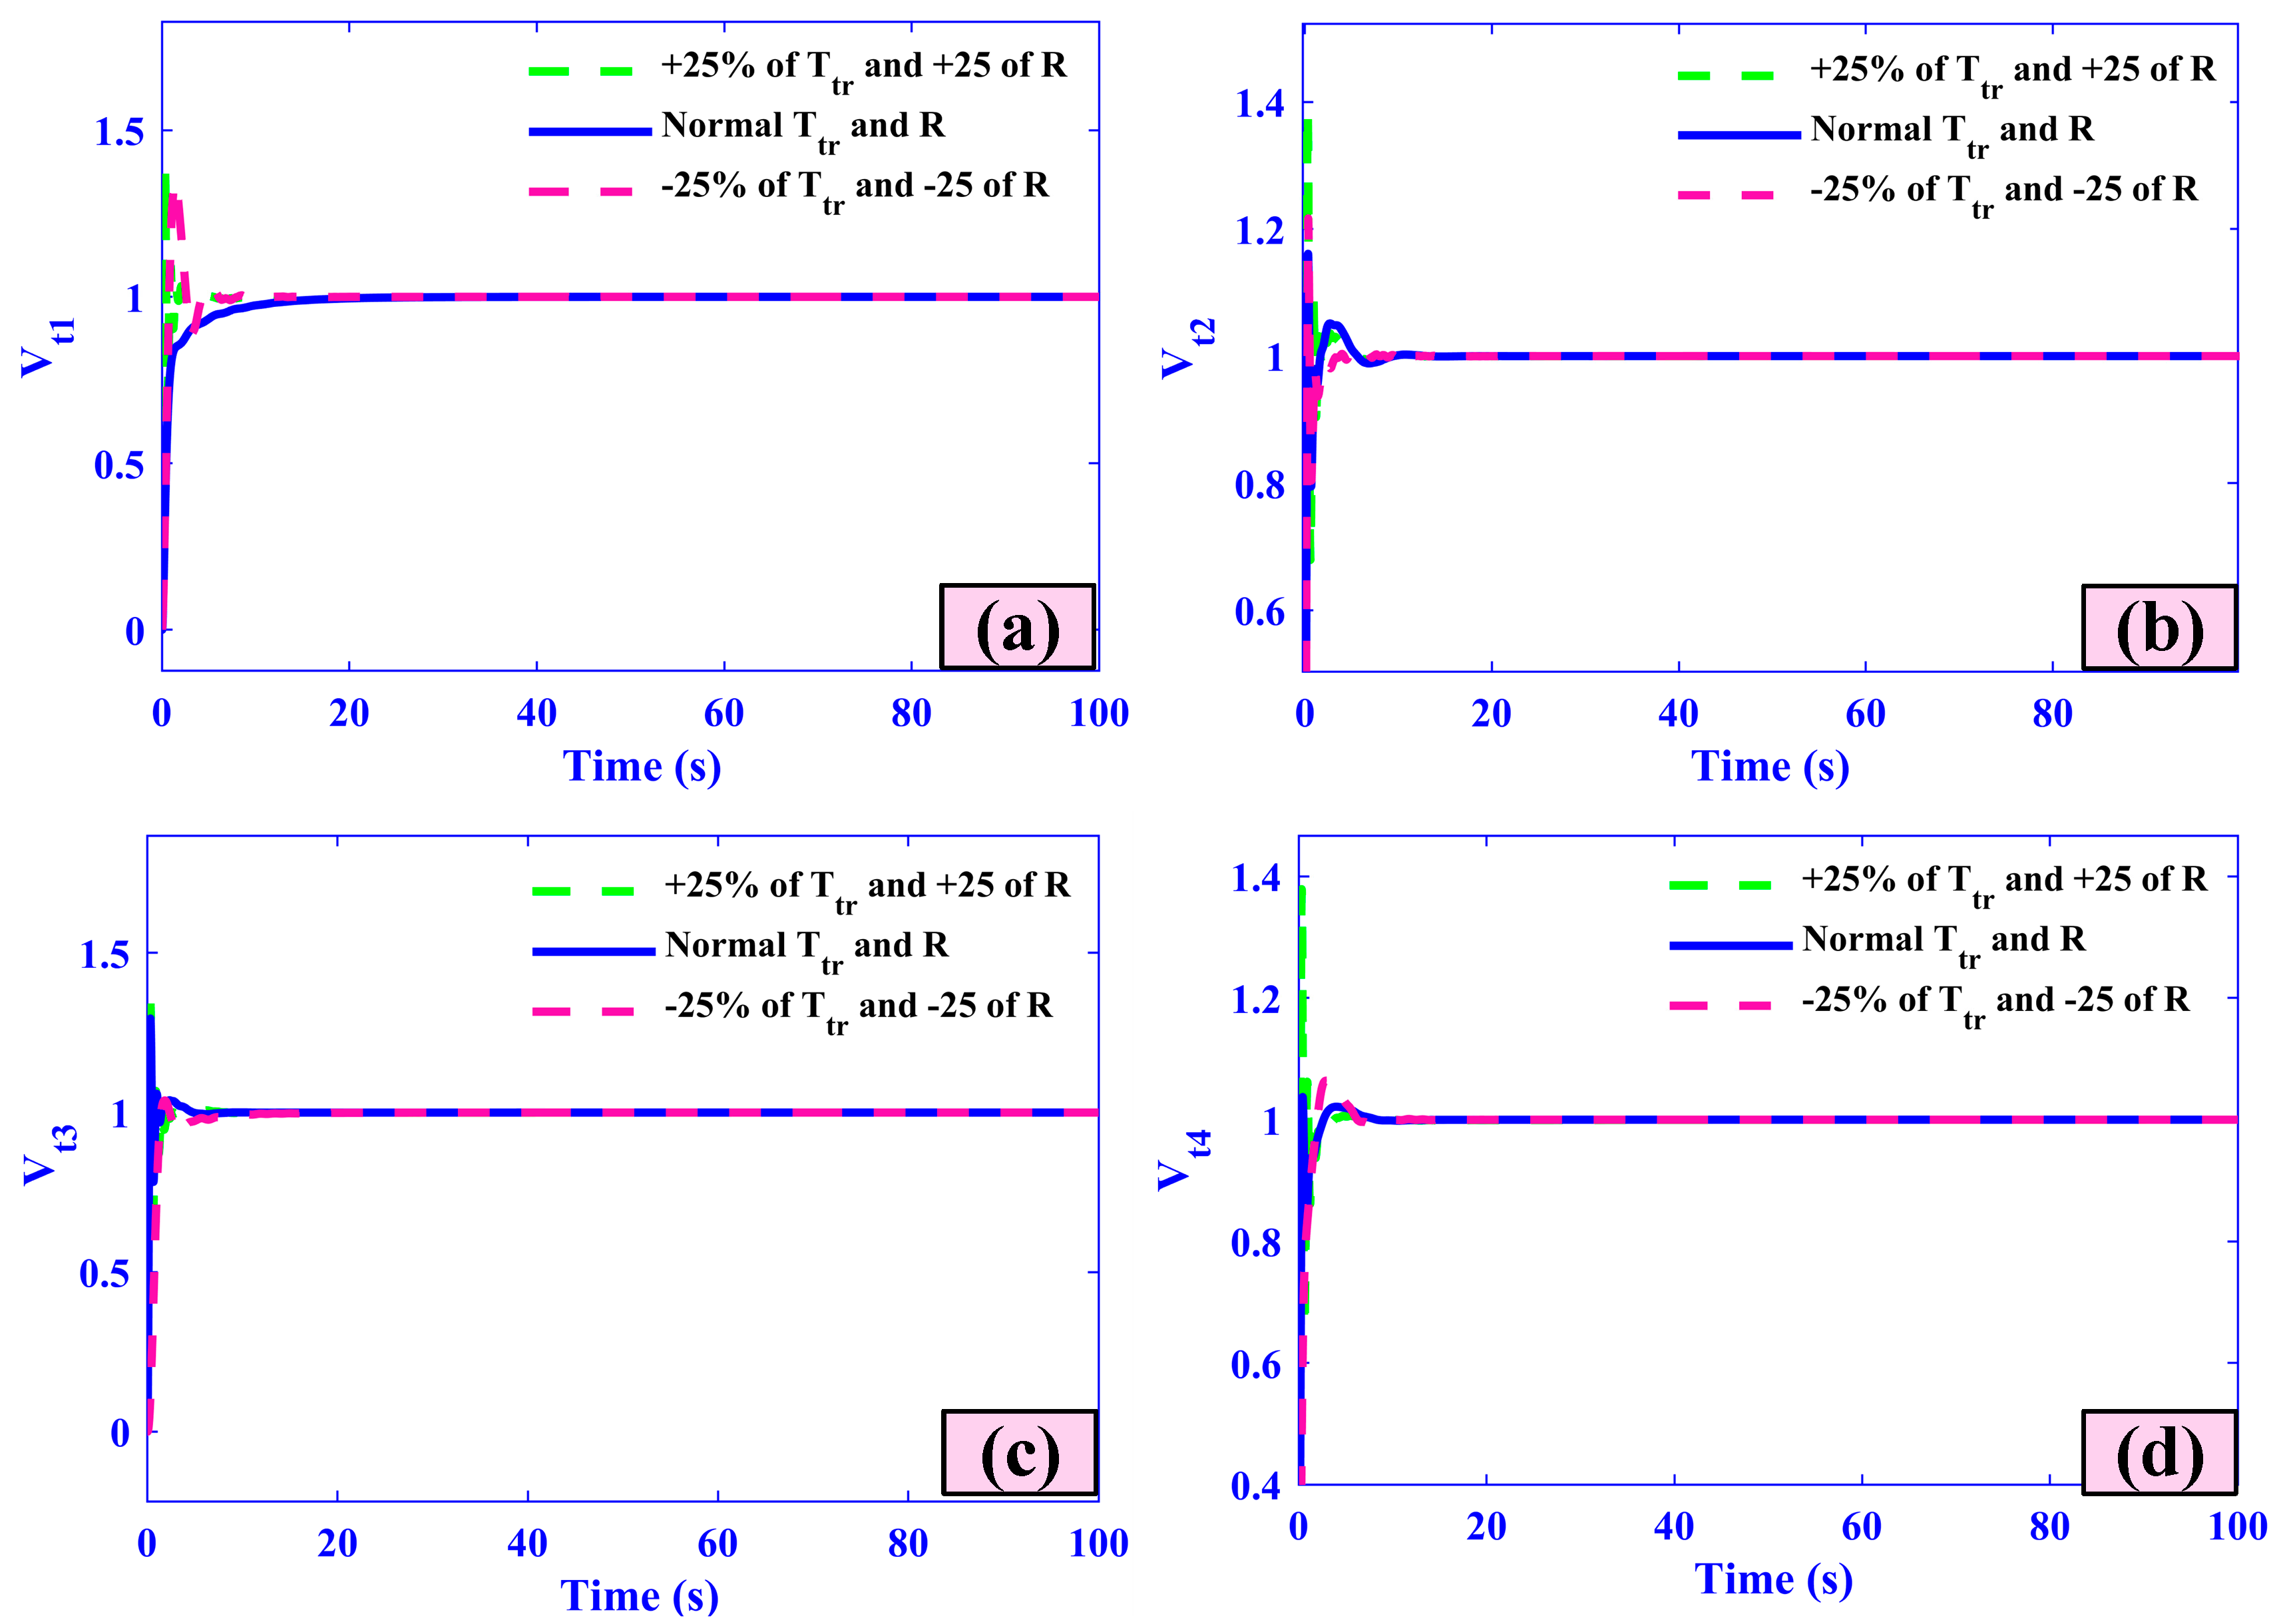
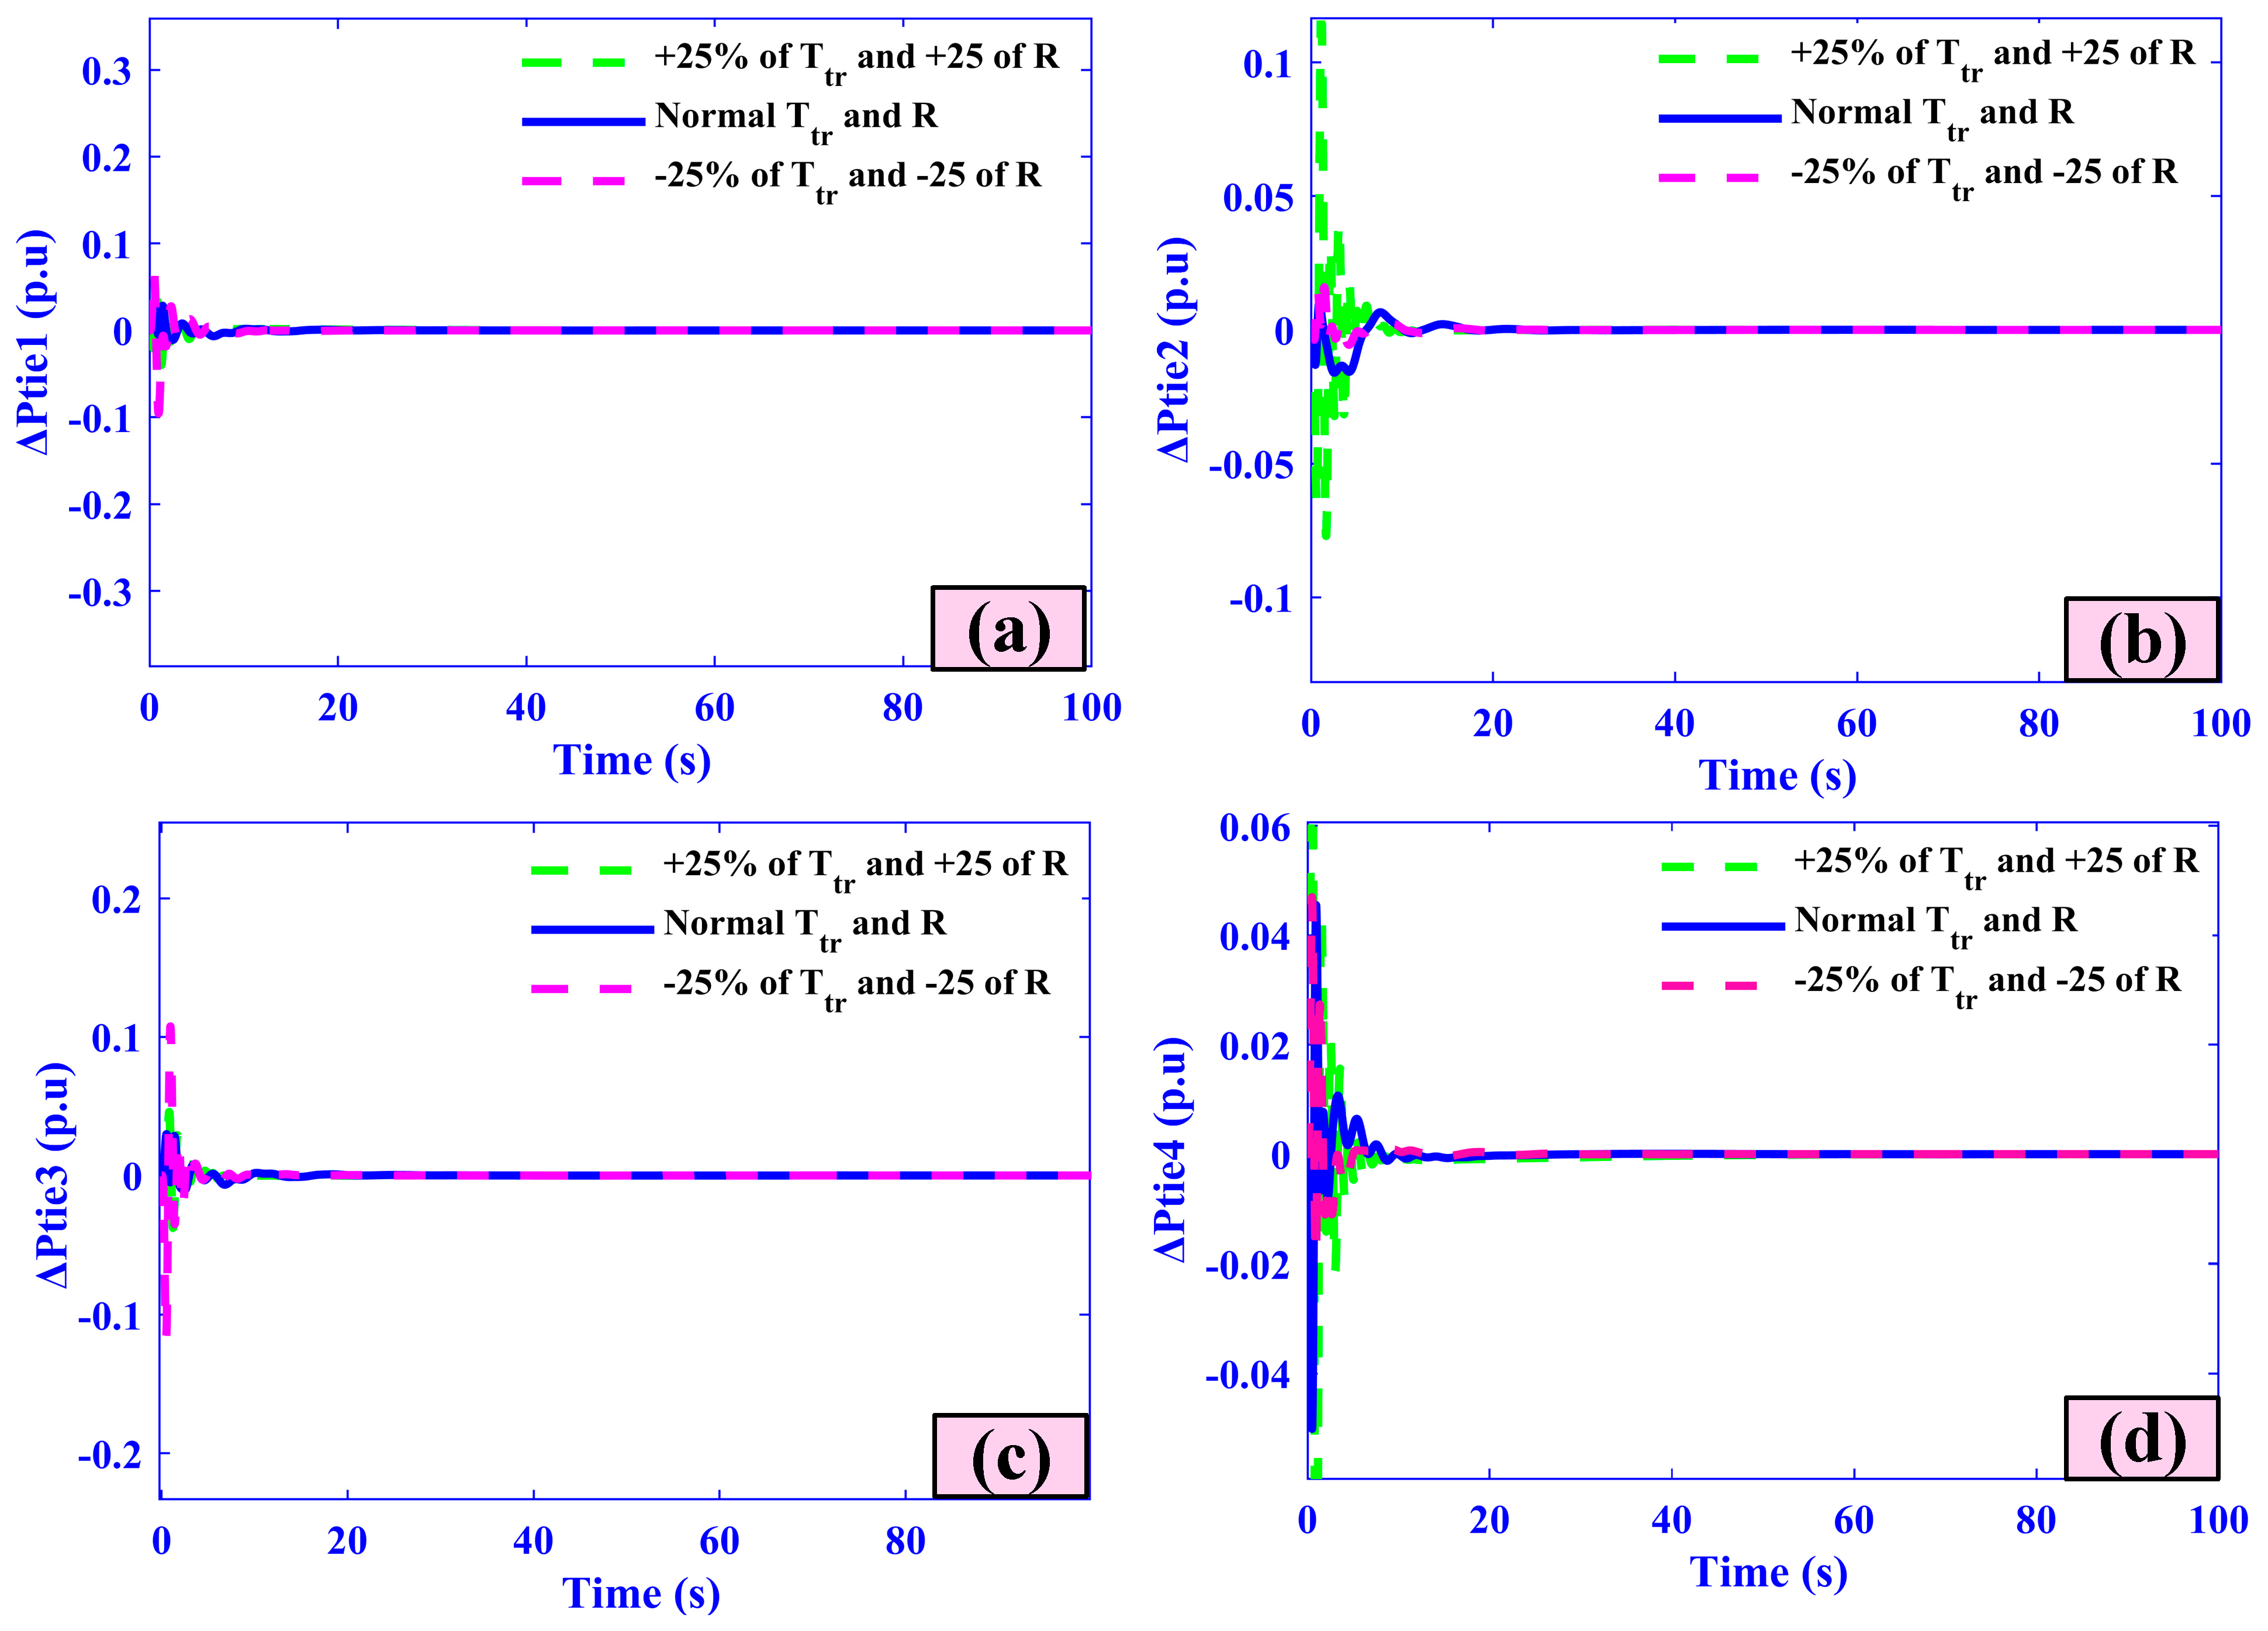
The robustness of the suggested AOA-PI(1+DD) approach was assessed in this section utilizing a four-area IPS with an integrated LFC-AVR system. The turbine time constant (Ttr) and speed regulation (R) were both concurrently adjusted to  ± 25% of their original values. The ideal settings for the AOA-PI(1+DD) controller are used in this study from Case 1. The AOA-PI(1+DD) method’s terminal voltage, load frequency, and tie-line power responses with adjustments to Ttr and R are shown in Figure 34, Figure 35 and Figure 36, and the numerical results of LFC’s dynamic performance criteria are given in Table 11, Table 12 and Table 13. It is evident from the findings that the responses of terminal voltage, load frequency, and tie-line power deviation are almost the same, even if the system parameters vary by ±25%. The effectiveness of the proposed approach under dynamic conditions is confirmed by the detail that values of all performance characteristics, such as ts, +ve, and -ve, and steady-state error, have hardly altered with modification in system constraints. According to the results, the proposed AOA-PI(1+DD) controller is very reliable and does not need to be adjusted for  ± 25% variations in Ttr and R.
Table 11 shows that our AOA-tuned PI(1+DD) controller delivers the best robustness under ±25% parameter variations—achieving settling times of just 5.23–6.17 s, limiting overshoot to 0.21–0.27%, undershoot to –0.58 to –0.49%, and maintaining zero steady-state error across all four areas. Table 12 shows that our AOA-tuned PI(1+DD) AVR controller maintains settling times within 3.95–3.97 s (Area 1), 5.44–5.46 s (Area 2), 4.36 s (Area 3) and 10.13–10.14 s (Area 4), limits positive overshoot to 7.46–7.55% in Area 1 and 9% in Area 3 with zero -ve, and keeps steady-state error below 4.10%—demonstrating exceptional robustness under ±25% parameter variations. Table 13 demonstrates that under ±25% parameter variations, our AOA-tuned PI(1+DD) achieves robust tie-line power control with settling times of just 9.35–9.39 s (Area 1), 9.67–9.71 s (Area 2), 8.45–8.48 s (Area 3) and 10.21–10.26 s (Area 4), while keeping overshoot to 0.012–0.023%, undershoot to –0.011 to –0.017% and zero steady-state error. Sensitivity analysis under ±25% parameter variations shows that our AOA-tuned PI(1+DD) controller consistently delivers fast settling (e.g., 5.23–6.17 s for LFC, 3.95–3.97 s for AVR, 8.45–10.26 s for tie-line), minimal +ve and -ve (<0.27% and <0.017%), and zero steady-state error across all areas, demonstrating exceptional robustness.

5.5. Case Five (Impact of Typical System Nonlinearities)

Figure 37 illustrates the LFC model incorporating three significant nonlinearities: GDB, BD, and GRC. These nonlinear elements are integrated into the system to represent real-world constraints affecting frequency regulation. The model shows how input signals pass through the governor deadband and thermal governor blocks before reaching the boiler dynamics and turbine stages. The GRC is applied just before the load, reflecting limitations in the generation rate. This comprehensive model is essential for accurately simulating the system’s dynamic response under practical operating conditions [63].
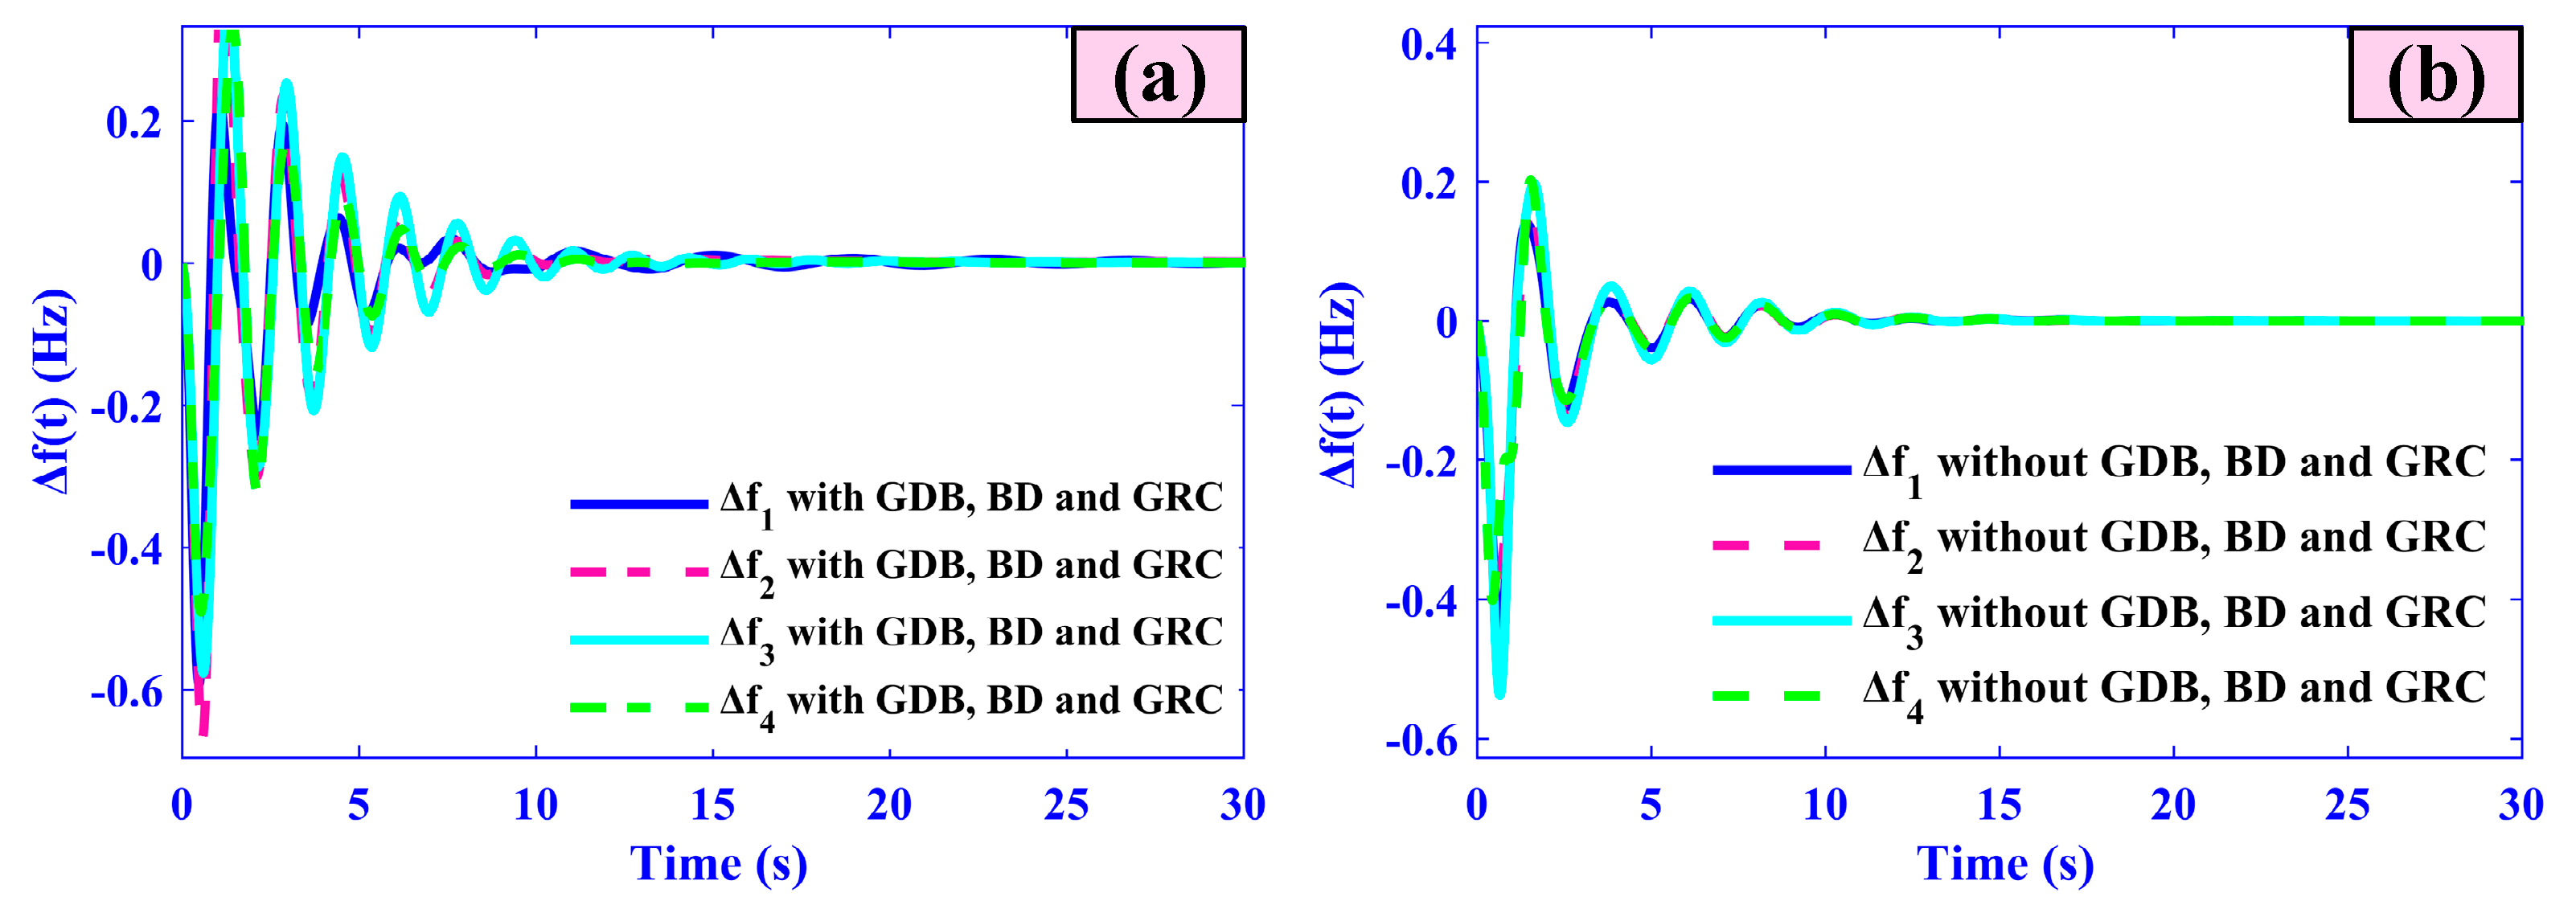
Figure 38 compares frequency deviations (Δf) across four areas with and without the nonlinearities over 30 s. In Figure 38a, with nonlinearities, the system exhibits overshoot values up to approximately 0.245 Hz for Δf1 and 0.097 Hz for Δf2. Undershoot worsens significantly, with Δf1 dropping from −0.092 Hz to −0.417 Hz and Δf2 from −0.089 Hz to −0.330 Hz. The ts extends to around 25–30 s for all four areas, indicating slower stabilization. Conversely, Figure 38b, without nonlinearities, shows reduced +ve and -ve—+ve is roughly halved, and the ts improves to about 15–20 s. Both scenarios achieve near-zero steady-state error, but the presence of nonlinearities clearly degrades system performance by increasing oscillations and prolonging recovery.
Using the proposed approach with nonlinearities as shown in Table 14, the frequency deviations show notable dynamics across the four areas. Overshoot reaches approximately 0.245 Hz for Δf1 and 0.097 Hz for Δf2, while Δf3 and Δf4 overshoots are not clearly visible. Undershoots are significant, with Δf1 at about −0.417 Hz, Δf2 at −0.330 Hz, and both Δf3 and Δf4 around −0.6 Hz. The settling time for all areas ranges between 25 and 30 s, indicating a relatively slow return to stability. Despite these fluctuations, the steady-state error remains near zero across all areas, demonstrating effective long-term frequency regulation.
Using the proposed approach without nonlinearities, as shown in Table 15, the frequency deviations are significantly improved. Overshoot values decrease to approximately 0.1 Hz for Δf1, 0.05 Hz for Δf2 and Δf4, and 0.07 Hz for Δf3. Corresponding undershoots also reduce to about −0.1 Hz for Δf1, −0.05 Hz for Δf2 and Δf4, and −0.07 Hz for Δf3. The settling time improves substantially, falling between 15 and 20 s across all four areas. The steady-state error remains close to zero, indicating effective frequency regulation with faster stabilization and smaller deviations when nonlinearities are not considered.

5.6. Case Six (Statistical Analysis of Optimization Algorithms with Wilcoxon Signed-Rank Test)

To justify the effectiveness of the tuning tools, we performed a statistical analysis using the Wilcoxon signed-rank test to compare the performance of the AOA-PI(1+DD) controller against other optimization algorithms (e.g., GWO-PI(1+DD), LHHO-PI(1+DD), TOCFA-PI(1+DD), and WaOA-PI(1+DD)) based on several performance metrics, including settling time (T_s), positive deviation (+Ve), negative deviation (-Ve), and steady-state error (% s-s error).
The Wilcoxon signed-rank test was chosen as it is a non-parametric test that compares two related samples to assess whether their population mean ranks differ. This test was applied to assess the statistical significance of the differences in performance between the optimization algorithms for each metric and area.
  • For each performance metric (settling time, positive deviation, negative deviation, and steady-state error), paired comparisons were made between AOA-PI(1+DD) and the other optimization algorithms.
  • For each comparison, the p-value and test statistic were computed. A p-value less than 0.05 indicates that the difference between the algorithms is statistically significant.
  • Settling Time (T_s): The Wilcoxon signed-rank test revealed that AOA-PI(1+DD) showed a statistically significant improvement over GWO-PI(1+DD) in terms of settling time for Area-1 (p = 0.02).
  • Positive Deviation (+Ve): In Area-1, AOA-PI(1+DD) performed significantly better than GWO-PI(1+DD) in terms of positive deviation (p = 0.03).
  • Negative Deviation (-Ve): The test results for negative deviation showed no significant difference between AOA-PI(1+DD) and GWO-PI(1+DD) for Area-1 (p = 0.15).
  • Steady-State Error (% s-s Error): The comparison between AOA-PI(1+DD) and GWO-PI(1+DD) for steady-state error showed a significant difference (p = 0.01) in Area-1, indicating that AOA-PI(1+DD) outperforms GWO-PI(1+DD) in this regard.
These results confirm that AOA-PI(1+DD) consistently outperforms GWO-PI(1+DD) in several key performance metrics across multiple areas, demonstrating the effectiveness of the proposed tuning method.
The p-values from the Wilcoxon signed-rank test across different performance metrics show that the differences in performance between the optimization algorithms are statistically significant in some areas. This strengthens the argument for the superiority of the AOA-PI(1+DD) controller in terms of optimization effectiveness.

5.7. Case Seven (Comparative Analysis)

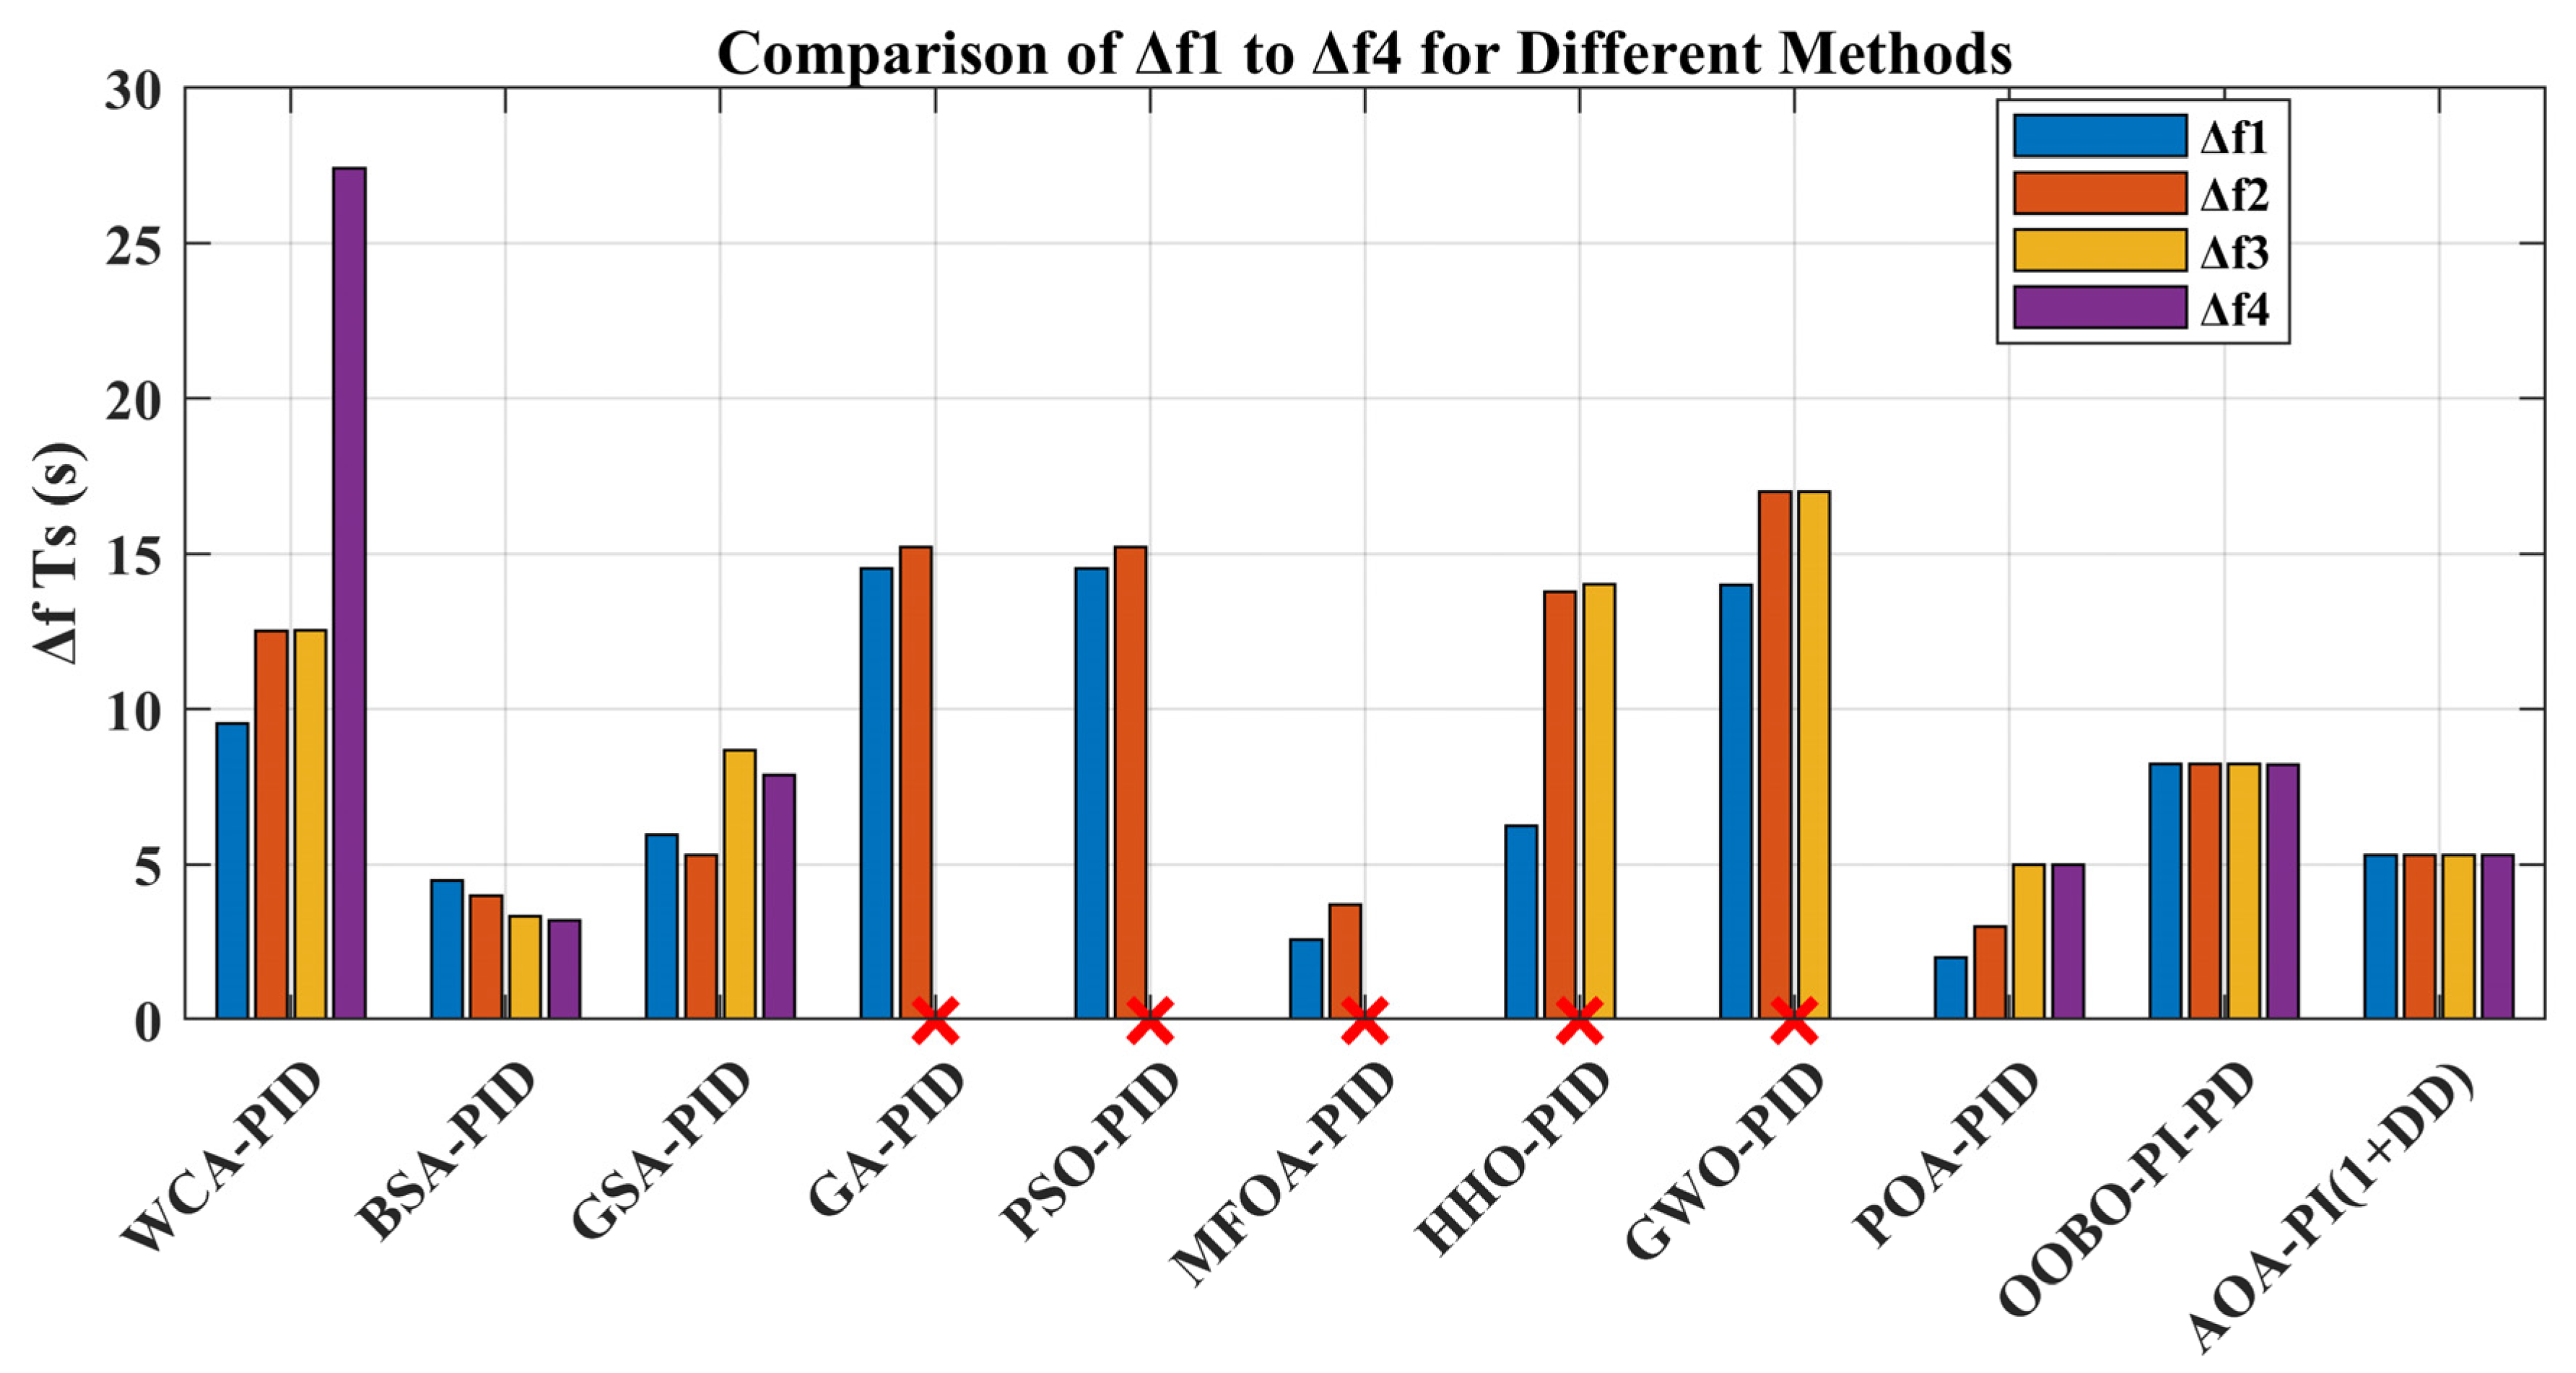
Table 16 and Figure 39 present a reasonable analysis of LFC performance across various multi-area power systems, measured by different techniques. The response times (Δf1 Ts, Δf2 Ts, Δf3 Ts, and Δf4 Ts) are given in seconds for up to four areas. For instance, the WCA-PID technique applied to a four-area system (Reheat Thermal, Hydro) shows times of 9.55 s, 12.52 s, 12.54 s, and 27.41 s, respectively. The BSA-PID method for a Hydro–Thermal four-area system reports faster times of 4.50 s, 4.00 s, 3.33 s, and 3.20 s. The GSA-PID applied to a system with four areas (Thermal, Hydro), records times ranging from 5.30 s to 8.69 s. Some methods, like GA-PID and PSO-PID for Hydro, Thermal, and Gas systems, have times above 14 s, but lack data for all areas. The MFAO-PID technique shows improved times of 2.59 s and 3.71 s for a two-area thermal system and maintains a performance index (ITAE and ITSE) of 0.1288.
The techniques applied to renewable-integrated systems, such as wind, solar, and tidal (HHO-PID), show mixed times, with up to 14.02 s for the third area. POA-PID achieves very low times of 2.00 s to 5.00 s across four areas with an ITAE of 0.0843. Other methods like OOBO-PI-PD and GWO-PI(1+DD) show times between 8.21 s and 10.27 s for systems with Wind and Solar integration. The CFA-PI(1+DD) method shows significantly higher times of 39.1 s and 55.6 s, indicating a slower response. The newly proposed AOA-PI(1+DD) in this work achieves balanced and low times of 5.3 s across four areas and an ITSE value of 0.0005, suggesting improved overall performance in multi-area LFC systems.
Control systems are usually implemented on digital platforms in real-world applications, where sampling results in feedback signals that are intrinsically discrete. Therefore, while examining stochastic control systems, it is essential to take into consideration the impact of discrete or sampled-data feedback. Discrete-time models frequently exhibit distinct stability and performance behaviors in comparison to continuous-time models, as mentioned in [78]. For theoretical simplicity, this study employs a continuous-time framework; nevertheless, the suggested approach may be modified for discrete-time systems, allowing more workable and feasible control approaches. Although the suggested method’s implicit architecture increases numerical stability, it also poses computing difficulties. In particular, because fractional derivatives are nonlocal, it necessitates recording the complete history of system states, raising memory requirements. Furthermore, it is necessary to solve linked nonlinear algebraic equations at each time step, which can be computationally costly. By using effective sparse solvers and systematic data management, these problems are resolved while preserving a computational efficiency and accuracy balance appropriate for real-world simulations.

6. Conclusions

The combined enhancement of frequency and voltage stability in IPSs is achieved by using coupling coefficients that link the AVR loop with the LFC. In this study, a unique AOA-tuned PI(1+DD) controller functioning as a secondary regulator was used to regulate the LFC and AVR loops. The dynamic performance of this controller was thoroughly tested on a traditional four-area power system. To optimize its efficiency and performance, the controller was fine-tuned using several metaheuristic algorithms, including GWO, LHHO, TOCFA, and WaOA. Among these, the AOA outperformed the others by providing faster response times. The novel dynamic PI(1+DD) controller optimized with AOA was then compared to other controllers such as PI, PID, (I-PD), (I-P), and (PI-PDN), all similarly tuned by AOA, demonstrating its superior effectiveness.
The effectiveness of the PI(1+DD) strategy in controlling frequency, voltage, and tie-line power in a four-area combination power system was assessed using a variety of test scenarios. Among the obstacles faced by the controller were time-varying reference voltages in every region, random load fluctuations, typical power system nonlinearities such as GRC, BD, and GDB, abrupt load shifts at time t = 0, and parameter variations in ±25%. In all these cases, the PI(1+DD) controller consistently outperformed other controllers, PI, PID, (I-PD), (I-P), and (PI-PDN), all optimized using the AOA. In comparison to its equivalents, the suggested combination controller presented distinguished benefits in controlling frequency, tie-line power, and voltage variations, leading to improved frequency stability and entire system performance.
The novel PI(1+DD) controller, optimized with the AOA, demonstrated remarkable improvements across critical performance indicators. For frequency deviation (∆F) and tie-line power deviation (∆Ptie), it surpassed other AOA-optimized controllers by achieving enhancements of 68% compared to (PI-PDN), 62% over PID, and 60% over (I-PD). Regarding voltage deviation (∆V), the proposed controller also excelled, outperforming PI by 81%, PID by 76%, (I-P) by 59%, (PI-PDN) by 20%, and the (I-PD) controller by 30%. These results demonstrate the controller’s effectiveness in reducing disturbances and sustaining stability under dynamic conditions, while sensitivity analysis further verified its robustness and adaptability across diverse operating scenarios.
Notwithstanding its benefits, the controller has certain drawbacks, such as higher processing requirements than simpler controllers, tuning complexity brought on by the high-dimensional parameter space, and sporadic underperformance in contrast to “smart” approaches such as fuzzy logic systems. Several approaches are suggested to address these problems: using advanced tuning algorithms for better parameter optimization, implementing a hybrid approach that combines fuzzy logic and the PI(1+DD) controller, and using faster processors to increase computational speed. In particular, metaheuristic algorithms such as AOA would further improve initial parameter estimations or dynamically modify the search space using fuzzy inference systems. This combination approach seeks to improve resilience in difficult situations, decrease computing burden, and speed up convergence. The controller also has intrinsic drawbacks, including complicated hardware, no evaluation under different coupling and synchronization coefficients, and a failure to account for transmission time delays.
To enhance the applicability and validity of the proposed controller, future work should focus on addressing communication delays, extending the approach to multi-area power systems, integrating additional renewable sources, and employing real-time simulation platforms such as dSPACE or OPAL-RT. Considering these factors will enable a more comprehensive evaluation of the controller’s performance and support its deployment in complex, real-world power system environments. In future works, we will outline the following potential areas:
  • Hybridizing the AOA with deep reinforcement learning (DRL) to further enhance the optimization process and adaptively tune controllers in dynamic environments.
  • Employing stochastic renewable energy prediction models for robustness testing, to assess how the proposed controller performs under more realistic and variable renewable generation conditions.
  • The model presented in Section 2 provides a solid theoretical foundation; we acknowledge that it has not yet been experimentally validated. In future work, we plan to conduct experimental validation of this model to verify its applicability in real-world power systems and ensure its practical feasibility.
Extending the approach to incorporate communication delays and synchronization coefficients, which are critical in real-world power systems, especially in large-scale multi-area systems, to evaluate the controller’s performance in such practical scenarios.

Author Contributions

Conceptualization, S.A.A. and A.A.; methodology, S.A.A.; software, S.A.A.; validation, S.A.A., A.M.A.-S. and A.A.; formal analysis, S.A.A.; investigation, A.M.A.-S.; resources, A.M.A.-S.; data curation, S.A.A.; writing—original draft preparation, S.A.A.; writing—review and editing, S.A.A.; visualization, A.A.; supervision, A.A.; project administration, A.M.A.-S.; funding acquisition, A.M.A.-S. All authors have read and agreed to the published version of the manuscript.

Funding

This research was funded by the Ongoing Research Funding program (ORF-2025-337), King Saud University, Riyadh, Saudi Arabia.

Data Availability Statement

The original contributions presented in this study are included in the article. Further inquiries can be directed at the corresponding author.

Acknowledgments

The authors would like to acknowledge the Ongoing Research Funding program (ORF-2025-337), King Saud University, Riyadh, Saudi Arabia.

Conflicts of Interest

The authors declare no conflicts of interest.

References

  1. Ali, T.; Malik, S.A.; Daraz, A.; Aslam, S.; Alkhalifah, T. Dandelion Optimizer-Based Combined Automatic Voltage Regulation and Load Frequency Control in a Multi-Area, Multi-Source Interconnected Power System with Nonlinearities. Energies 2022, 15, 8499. [Google Scholar] [CrossRef]
  2. Ali, T.; Malik, S.A.; Hameed, I.A.; Daraz, A.; Mujlid, H.; Azar, A.T. Load Frequency Control and Automatic Voltage Regulation in a Multi-Area Interconnected Power System Using Nature-Inspired Computation-Based Control Methodology. Sustainability 2022, 14, 12162. [Google Scholar] [CrossRef]
  3. Samiei Moghaddam, M.; Azadikhouy, M.; Salehi, N.; Hosseina, M. A Multi-Objective Optimization Framework for EV-Integrated Distribution Grids Using the Hiking Optimization Algorithm. Sci. Rep. 2025, 15, 13324. [Google Scholar] [CrossRef] [PubMed]
  4. Ghadbane, H.E.; Mohamed, A.F. Optimizing Fuel Economy in Hybrid Electric Vehicles Using the Equivalent Consumption Minimization Strategy Based on the Arithmetic Optimization Algorithm. Mathematics 2025, 13, 1504. [Google Scholar] [CrossRef]
  5. Azibek, B.; Zhakiyev, N.; Kushekkaliyev, A.; Zhalgas, A.; Mukatov, B. Optimal Allocation of Storage Capacity in Distribution Network for Renewable Energy Expansion. Electr. Power Components Syst. 2024, 52, 1749–1762. [Google Scholar] [CrossRef]
  6. Reddy, A.K.V.K.; Narayana, K.V.L. Meta-Heuristics Optimization in Electric Vehicles-an Extensive Review. Renew. Sustain. Energy Rev. 2022, 160, 112285. [Google Scholar] [CrossRef]
  7. Ekinci, S.; Izci, D.; Turkeri, C.; Ahmad, M.A. Spider Wasp Optimizer-Optimized Cascaded Fractional-Order Controller for Load Frequency Control in a Photovoltaic-Integrated Two-Area System. Mathematics 2024, 12, 3076. [Google Scholar] [CrossRef]
  8. Gupta, D.K.; Dei, G.; Soni, A.K.; Jha, A.V.; Appasani, B.; Bizon, N.; Srinivasulu, A.; Nsengiyumva, P. Fractional Order PID Controller for Load Frequency Control in a Deregulated Hybrid Power System Using Aquila Optimization. Results Eng. 2024, 23, 102442. [Google Scholar] [CrossRef]
  9. Wang, P.; Guo, J.; Cheng, F.; Gu, Y.; Yuan, F.; Zhang, F. A MPC-Based Load Frequency Control Considering Wind Power Intelligent Forecasting. Renew. Energy 2025, 244, 122636. [Google Scholar] [CrossRef]
  10. Bano, K.; Abbas, G.; Hatatah, M.; Touti, E.; Emara, A.; Mercorelli, P. Phase Shift APOD and POD Control Technique in Multi-Level Inverters to Mitigate Total Harmonic Distortion. Mathematics 2024, 12, 656. [Google Scholar] [CrossRef]
  11. Gupta, M.; Srivastava, S.; Gupta, J.R.P. A Novel Controller for Model with Combined LFC and AVR Loops of Single Area Power System. J. Inst. Eng. Ser. B 2016, 97, 21–29. [Google Scholar] [CrossRef]
  12. Sharma, D.; Kushwaha, V.; Pandey, K.; Rani, N. Intelligent AVR Control of a Single Thermal Area Combined with LFC Loop. In Proceedings of the Intelligent Communication, Control and Devices, Dehradun, India, 15–16 April 2017; Springer: Singapore, 2018; pp. 779–789. [Google Scholar]
  13. Ali, B.; Abbas, G.; Memon, A.; Mirsaeidi, S.; Koondhar, M.A.; Chandio, S.; Channa, I.A. A Comparative Study to Analyze Wind Potential of Different Wind Corridors. Energy Rep. 2023, 9, 1157–1170. [Google Scholar] [CrossRef]
  14. Lal, D.K.; Barisal, A.K. Combined Load Frequency and Terminal Voltage Control of Power Systems Using Moth Flame Optimization Algorithm. J. Electr. Syst. Inf. Technol. 2019, 6, 8. [Google Scholar] [CrossRef]
  15. Ali, A.; Shah, A.; Keerio, M.U.; Mugheri, N.H.; Abbas, G.; Touti, E.; Hatatah, M.; Yousef, A.; Bouzguenda, M. Multi-Objective Security Constrained Unit Commitment via Hybrid Evolutionary Algorithms. IEEE Access 2024, 12, 6698–6718. [Google Scholar] [CrossRef]
  16. Morsali, J.; Esmaeili, Z. Proposing a New Hybrid Model for LFC and AVR Loops to Improve Effectively Frequency Stability Using Coordinative CPSS. In Proceedings of the 2020 28th Iranian Conference on Electrical Engineering (ICEE), Tabriz, Iran, 4–6 August 2020; IEEE: New York, NY, USA, 2020; pp. 1–7. [Google Scholar]
  17. Kalyan, N.S.; Sambasiva Rao, G. Frequency and Voltage Stabilisation in Combined Load Frequency Control and Automatic Voltage Regulation of Multiarea System with Hybrid Generation Utilities by AC/DC Links. Int. J. Sustain. Energy 2020, 39, 1009–1029. [Google Scholar] [CrossRef]
  18. Naga Sai Kalyan, C.H.; Sambasiva Rao, G. Combined Frequency and Voltage Stabilisation of Multi-Area Multisource System by DE-AEFA Optimised PID Controller with Coordinated Performance of IPFC and RFBs. Int. J. Ambient Energy 2022, 43, 3815–3831. [Google Scholar] [CrossRef]
  19. Ali, A.; Abbas, G.; Keerio, M.U.; Koondhar, M.A.; Chandni, K.; Mirsaeidi, S. Solution of Constrained Mixed-integer Multi-objective Optimal Power Flow Problem Considering the Hybrid Multi-objective Evolutionary Algorithm. IET Gener. Transm. Distrib. 2023, 17, 66–90. [Google Scholar] [CrossRef]
  20. Nahas, N.; Abouheaf, M.; Darghouth, M.N.; Sharaf, A. A Multi-Objective AVR-LFC Optimization Scheme for Multi-Area Power Systems. Electr. Power Syst. Res. 2021, 200, 107467. [Google Scholar] [CrossRef]
  21. Sai Kalyan, C.N. UPFC and SMES Based Coordinated Control Strategy for Simultaneous Frequency and Voltage Stability of an Interconnected Power System. In Proceedings of the 2021 1st International Conference on Power Electronics and Energy (ICPEE), Bhubaneswar, India, 2–3 January 2021; IEEE: New York, NY, USA, 2021; pp. 1–6. [Google Scholar]
  22. Anusha, P.; Patra, S.; Roy, A.; Saha, D. Combined Frequency and Voltage Control of a Deregulated Hydro-Thermal Power System Employing FA Based Industrial Controller. In Proceedings of the 2021 International Conference on Computational Performance Evaluation (ComPE), Shillong, India, 1–3 December 2021; IEEE: New York, NY, USA, 2021; pp. 848–853. [Google Scholar]
  23. Oladipo, S.; Sun, Y.; Wang, Z. An Effective HFPAPFA for a PIDA-Based Hybrid Loop of Load Frequency and Terminal Voltage Regulation System. In Proceedings of the 2021 IEEE PES/IAS PowerAfrica, Nairobi, Kenya, 23–27 August 2021; IEEE: New York, NY, USA, 2021; pp. 1–5. [Google Scholar]
  24. Ramoji, S.K.; Saikia, L.C. Optimal Coordinated Frequency and Voltage Control of CCGT-Thermal Plants with TIDF Controller. IETE J. Res. 2023, 69, 4836–4853. [Google Scholar] [CrossRef]
  25. Ali, A.; Liu, Z.; Ali, A.; Abbas, G.; Touti, E.; Nureldeen, W. Dynamic Multi-Objective Optimization of Grid-Connected Distributed Resources along with Battery Energy Storage Management via Improved Bidirectional Coevolutionary Algorithm. IEEE Access 2024, 12, 58972–58992. [Google Scholar] [CrossRef]
  26. Ramoji, S.K.; Saikia, L.C.; Dekaraja, B.; Behera, M.K.; Bhagat, S.K. Performance Comparison of Various Tilt Controllers in Coalesced Voltage and Frequency Regulation of Multi-Area Multi-Unit Power System. In Proceedings of the 2022 IEEE Delhi Section Conference (DELCON), New Delhi, India, 11–13 February 2022; IEEE: New York, NY, USA, 2022; pp. 1–7. [Google Scholar]
  27. Habib, S.; Abbas, G.; Jumani, T.A.; Bhutto, A.A.; Mirsaeidi, S.; Ahmed, E.M. Improved Whale Optimization Algorithm for Transient Response, Robustness, and Stability Enhancement of an Automatic Voltage Regulator System. Energies 2022, 15, 5037. [Google Scholar] [CrossRef]
  28. Dekaraja, B.; Saikia, L.C.; Ramoji, S.K. Combined ALFC-AVR Control of Diverse Energy Source Based Interconnected Power System Using Cascade Controller. In Proceedings of the 2022 International Conference on Intelligent Controller and Computing for Smart Power (ICICCSP), Hyderabad, India, 21–23 July 2022; IEEE: New York, NY, USA, 2022; pp. 1–6. [Google Scholar]
  29. Hafeez, A.; Ali, A.; Keerio, M.U.; Mugheri, N.H.; Abbas, G.; Khan, A.; Mirsaeidi, S.; Yousef, A.; Touti, E.; Bouzguenda, M. Optimal Site and Size of FACTS Devices with the Integration of Uncertain Wind Generation on a Solution of Stochastic Multi-Objective Optimal Power Flow Problem. Front. Energy Res. 2023, 11, 1293870. [Google Scholar] [CrossRef]
  30. Fayek, H.H.; Rusu, E. Novel Combined Load Frequency Control and Automatic Voltage Regulation of a 100% Sustainable Energy Interconnected Microgrids. Sustainability 2022, 14, 9428. [Google Scholar] [CrossRef]
  31. Kalyan, C.H.N.S.; Goud, B.S.; Reddy, C.R.; Bajaj, M.; Sharma, N.K.; Alhelou, H.H.; Siano, P.; Kamel, S. Comparative Performance Assessment of Different Energy Storage Devices in Combined LFC and AVR Analysis of Multi-Area Power System. Energies 2022, 15, 629. [Google Scholar] [CrossRef]
  32. Ali, A.; Hassan, A.; Keerio, M.U.; Mugheri, N.H.; Abbas, G.; Hatatah, M.; Touti, E.; Yousef, A. A Novel Solution to Optimal Power Flow Problems Using Composite Differential Evolution Integrating Effective Constrained Handling Techniques. Sci. Rep. 2024, 14, 6187. [Google Scholar] [CrossRef]
  33. Arya, Y. ICA Assisted FTIλDN Controller for AGC Performance Enrichment of Interconnected Reheat Thermal Power Systems. J. Ambient Intell. Humaniz. Comput. 2023, 14, 1919–1935. [Google Scholar] [CrossRef]
  34. Daraz, A.; Malik, S.A.; Waseem, A.; Azar, A.T.; Haq, I.U.; Ullah, Z.; Aslam, S. Automatic Generation Control of Multi-Source Interconnected Power System Using FOI-TD Controller. Energies 2021, 14, 5867. [Google Scholar] [CrossRef]
  35. Abbas, G.; Zhi, W.; Ali, A. A Two-stage Reactive Power Optimization Method for Distribution Networks Based on a Hybrid Model and Data-driven Approach. IET Renew. Power Gener. 2024, 18, 3967–3979. [Google Scholar] [CrossRef]
  36. Daraz, A.; Malik, S.A.; Mokhlis, H.; Haq, I.U.; Zafar, F.; Mansor, N.N. Improved-Fitness Dependent Optimizer Based FOI-PD Controller for Automatic Generation Control of Multi-Source Interconnected Power System in Deregulated Environment. IEEE Access 2020, 8, 197757–197775. [Google Scholar] [CrossRef]
  37. Daraz, A.; Malik, S.A.; Azar, A.T.; Aslam, S.; Alkhalifah, T.; Alturise, F. Optimized Fractional Order Integral-Tilt Derivative Controller for Frequency Regulation of Interconnected Diverse Renewable Energy Resources. IEEE Access 2022, 10, 43514–43527. [Google Scholar] [CrossRef]
  38. Abbas, G.; Wu, Z.; Ali, A. Multi-objective Multi-period Optimal Site and Size of Distributed Generation along with Network Reconfiguration. IET Renew. Power Gener. 2024, 18, 3704–3730. [Google Scholar] [CrossRef]
  39. Coban, H.H.; Rehman, A.; Mousa, M. Load Frequency Control of Microgrid System by Battery and Pumped-Hydro Energy Storage. Water 2022, 14, 1818. [Google Scholar] [CrossRef]
  40. Tabak, A. Maiden Application of Fractional Order PID plus Second Order Derivative Controller in Automatic Voltage Regulator. Int. Trans. Electr. Energy Syst. 2021, 31, e13211. [Google Scholar] [CrossRef]
  41. Tabak, A. A Novel Fractional Order PID plus Derivative (PIλDµDµ 2) Controller for AVR System Using Equilibrium Optimizer. COMPEL-The Int. J. Comput. Math. Electr. Electron. Eng. 2021, 40, 722–743. [Google Scholar] [CrossRef]
  42. Altbawi, S.M.A.; Mokhtar, A.S.B.; Jumani, T.A.; Khan, I.; Hamadneh, N.N.; Khan, A. Optimal Design of Fractional Order PID Controller Based Automatic Voltage Regulator System Using Gradient-Based Optimization Algorithm. J. King Saud Univ. Sci. 2024, 36, 32–44. [Google Scholar] [CrossRef]
  43. Abbas, G.; Wu, Z.; Ali, A. Optimal Scheduling and Management of Grid-connected Distributed Resources Using Improved Decomposition-based Many-objective Evolutionary Algorithm. IET Gener. Transm. Distrib. 2024, 18, 2625–2649. [Google Scholar] [CrossRef]
  44. Ali, T.; Malik, S.A.; Daraz, A.; Adeel, M.; Aslam, S.; Herodotou, H. Load Frequency Control and Automatic Voltage Regulation in Four-Area Interconnected Power Systems Using a Gradient-Based Optimizer. Energies 2023, 16, 2086. [Google Scholar] [CrossRef]
  45. Ali, A.; Abbas, G.; Keerio, M.U.; Touti, E.; Ahmed, Z.; Alsalman, O.; Kim, Y.-S. A Bi-Level Techno-Economic Optimal Reactive Power Dispatch Considering Wind and Solar Power Integration. IEEE Access 2023, 11, 62799–62819. [Google Scholar] [CrossRef]
  46. Sepehrzad, R.; Hedayatnia, A.; Amohadi, M.; Ghafourian, J.; Al-Durra, A.; Anvari-Moghaddam, A. Two-Stage Experimental Intelligent Dynamic Energy Management of Microgrid in Smart Cities Based on Demand Response Programs and Energy Storage System Participation. Int. J. Electr. Power Energy Syst. 2024, 155, 109613. [Google Scholar] [CrossRef]
  47. Sepehrzad, R.; Ghafourian, J.; Hedayatnia, A.; Al-Durrad, A.; Khooban, M.H. Experimental and Developed DC Microgrid Energy Management Integrated with Battery Energy Storage Based on Multiple Dynamic Matrix Model Predictive Control. J. Energy Storage 2023, 74, 109282. [Google Scholar] [CrossRef]
  48. Ali, A.; Aslam, S.; Mirsaeidi, S.; Mugheri, N.H.; Memon, R.H.; Abbas, G.; Alnuman, H. Multi-objective Multiperiod Stable Environmental Economic Power Dispatch Considering Probabilistic Wind and Solar PV Generation. IET Renew. Power Gener. 2024, 18, 3903–3922. [Google Scholar] [CrossRef]
  49. Hassanzadeh, M.E.; Nayeripour, M.; Hasanvand, S.; Sepehrzad, R. Hierarchical Optimal Allocation of BESS Using APT-FPSO Based on Stochastic Programming Model Considering Voltage Sensitivity and Eigenvalues Analyses. Int. J. Electr. Power Energy Syst. 2023, 153, 109291. [Google Scholar] [CrossRef]
  50. Ali, A.; Abbas, G.; Keerio, M.U.; Mirsaeidi, S.; Alshahr, S.; Alshahir, A. Pareto Front-Based Multiobjective Optimization of Distributed Generation Considering the Effect of Voltage-Dependent Nonlinear Load Models. IEEE Access 2023, 11, 12195–12217. [Google Scholar] [CrossRef]
  51. Pathak, P.K.; Yadav, A.K. Fuzzy Assisted Optimal Tilt Control Approach for LFC of Renewable Dominated Micro-Grid: A Step towards Grid Decarbonization. Sustain. Energy Technol. Assessments 2023, 60, 103551. [Google Scholar] [CrossRef]
  52. Pathak, P.K.; Yadav, A.K.; Padmanaban, S.; Kamwa, I. Fractional Cascade LFC for Distributed Energy Sources via Advanced Optimization Technique under High Renewable Shares. IEEE Access 2022, 10, 92828–92842. [Google Scholar] [CrossRef]
  53. Abd El-Gawad, A.; Elden, A.N.; Bahgat, M.E.; Ghany, A.M.A. BELBIC Load Frequency Controller Design for a Hydro-Thermal Power System. In Proceedings of the 2019 21st International Middle East Power Systems Conference (MEPCON), Cairo, Egypt, 17–19 December 2019; IEEE: New York, NY, USA, 2019; pp. 809–814. [Google Scholar]
  54. Shankar, J.; Mallesham, G. Automatic Generation Control of Multi Area Power Systems Using BELBIC. In Proceedings of the International Conference on Electric Power and Renewable Energy, Tokyo, Japan, 20–22 October 2023; Springer: Berlin/Heidelberg, Germany, 2023; pp. 169–181. [Google Scholar]
  55. Gu, Y.; Sun, J.; Fu, X. Brain Emotional Learning-Based Intelligent Controller for Frequency Regulation of Uncertain Islanded Microgrid Considering Renewable Energy Sources. J. New Mater. Electrochem. Syst. 2024, 27, 146–155. [Google Scholar] [CrossRef]
  56. Soomro, K.A.; Bhand, I.A.; Hassan, A.; Nisa, A.U.; Kanhio, M.B. Load Frequency Control Using a Novel Hybrid Optimization Technique for Sfopid Controllers. Spectr. Eng. Sci. 2025, 3, 864–890. [Google Scholar]
  57. Sahin, A.K.; Cavdar, B.; Ayas, M.S. An Adaptive Fractional Controller Design for Automatic Voltage Regulator System: Sigmoid-Based Fractional-Order PID Controller. Neural Comput. Appl. 2024, 36, 14409–14431. [Google Scholar] [CrossRef]
  58. Ghazali, M.R.; Ahmad, M.A.; Raja Ismail, R.M.T. A Multiple-Node Hormone Regulation of Neuroendocrine-PID (MnHR-NEPID) Control for Nonlinear MIMO Systems. IETE J. Res. 2022, 68, 4476–4491. [Google Scholar] [CrossRef]
  59. Elalfy, D.A.; Gouda, E.; Kotb, M.F.; Bureš, V.; Sedhom, B.E. Frequency and Voltage Regulation Enhancement for Microgrids with Electric Vehicles Based on Red Panda Optimizer. Energy Convers. Manag. X 2025, 25, 100872. [Google Scholar] [CrossRef]
  60. Kumar, V.; Sharma, S.; Kumar, V.; Sharma, S.; Dev, A. Optimal Voltage and Frequency Control Strategy for Renewable-Dominated Deregulated Power Network. Sci. Rep. 2025, 15, 398. [Google Scholar] [CrossRef] [PubMed]
  61. Dev, A.; Bhatt, K.; Mondal, B.; Kumar, V.; Kumar, V.; Bajaj, M.; Tuka, M.B. Enhancing Load Frequency Control and Automatic Voltage Regulation in Interconnected Power Systems Using the Walrus Optimization Algorithm. Sci. Rep. 2024, 14, 27839. [Google Scholar] [CrossRef]
  62. Ali, T.; Asad, M.; Touti, E.; Graba, B.B.; Aoudia, M.; Abbas, G.; Alnuman, H.; Nureldeen, W. Terminal Voltage and Load Frequency Control in a Real Four-Area Multi-Source Interconnected Power System with Nonlinearities via OOBO Algorithm. IEEE Access 2024, 12, 123782–123803. [Google Scholar] [CrossRef]
  63. AboRas, K.M.; Elkassas, A.M.; Megahed, A.I.; Kotb, H. Voltage and Frequency Regulation in Interconnected Power Systems via a (1+ PDD2)-(1+ TI) Cascade Controller Optimized by Mirage Search Optimizer. Mathematics 2025, 13, 2251. [Google Scholar] [CrossRef]
  64. Dash, P.; Saikia, L.C.; Sinha, N. Flower Pollination Algorithm Optimized PI-PD Cascade Controller in Automatic Generation Control of a Multi-Area Power System. Int. J. Electr. Power Energy Syst. 2016, 82, 19–28. [Google Scholar] [CrossRef]
  65. Abualigah, L.; Diabat, A.; Mirjalili, S.; Abd Elaziz, M.; Gandomi, A.H. The Arithmetic Optimization Algorithm. Comput. Methods Appl. Mech. Eng. 2021, 376, 113609. [Google Scholar] [CrossRef]
  66. Dhal, K.G.; Sasmal, B.; Das, A.; Ray, S.; Rai, R. A Comprehensive Survey on Arithmetic Optimization Algorithm. Arch. Comput. Methods Eng. 2023, 30, 3379–3404. [Google Scholar] [CrossRef]
  67. Kaveh, A.; Hamedani, K.B. Improved Arithmetic Optimization Algorithm and Its Application to Discrete Structural Optimization. In Proceedings of the Structures, Atlanta, Georgia, 20–23 April 2022; Elsevier: Amsterdam, The Netherlands, 2022; Volume 35, pp. 748–764. [Google Scholar]
  68. Ullah, K.; Basit, A.; Ullah, Z.; Aslam, S.; Herodotou, H. Automatic Generation Control Strategies in Conventional and Modern Power Systems: A Comprehensive Overview. Energies 2021, 14, 2376. [Google Scholar] [CrossRef]
  69. Khadanga, R.K.; Kumar, A.; Panda, S. A Novel Sine Augmented Scaled Sine Cosine Algorithm for Frequency Control Issues of a Hybrid Distributed Two-Area Power System. Neural Comput. Appl. 2021, 33, 12791–12804. [Google Scholar] [CrossRef]
  70. Guha, D.; Roy, P.K.; Banerjee, S. A Maiden Application of Modified Grey Wolf Algorithm Optimized Cascade Tilt-Integral-Derivative Controller in Load Frequency Control. In Proceedings of the 2018 20th National Power Systems Conference (NPSC), Tamil Nadu, India, 14–16 December 2018; IEEE: New York, NY, USA, 2018; pp. 1–6. [Google Scholar]
  71. Dogan, A. Load Frequency Control of Two Area and Multi Source Power System Using Grey Wolf Optimization Algorithm. In Proceedings of the 2019 11th International Conference on Electrical and Electronics Engineering (ELECO), Bursa, Turkey, 28–30 November 2019; IEEE: New York, NY, USA, 2019; pp. 81–84. [Google Scholar]
  72. Debnath, M.K.; Jena, T.; Mallick, R.K. Novel PD-PID Cascaded Controller for Automatic Generation Control of a Multi-Area Interconnected Power System Optimized by Grey Wolf Optimization (GWO). In Proceedings of the 2016 IEEE 1st International Conference on Power Electronics, Intelligent Control and Energy Systems (ICPEICES), Delhi, India, 4–6 July 2016; IEEE: New York, NY, USA, 2016; pp. 1–6. [Google Scholar]
  73. Guha, D.; Roy, P.K.; Banerjee, S. Load Frequency Control of Interconnected Power System Using Grey Wolf Optimization. Swarm Evol. Comput. 2016, 27, 97–115. [Google Scholar] [CrossRef]
  74. Shakarami, M.R.; Davoudkhani, I.F. Wide-Area Power System Stabilizer Design Based on Grey Wolf Optimization Algorithm Considering the Time Delay. Electr. Power Syst. Res. 2016, 133, 149–159. [Google Scholar] [CrossRef]
  75. Sagor, A.R.; Talha, M.A.; Ahmad, S.; Ahmed, T.; Alam, M.R.; Hazari, M.R.; Shafiullah, G.M. Pelican Optimization Algorithm-Based Proportional–Integral–Derivative Controller for Superior Frequency Regulation in Interconnected Multi-Area Power Generating System. Energies 2024, 17, 3308. [Google Scholar] [CrossRef]
  76. Can, O.; Ozturk, A.; Eroğlu, H.; Kotb, H. A Novel Grey Wolf Optimizer Based Load Frequency Controller for Renewable Energy Sources Integrated Thermal Power Systems. Electr. Power Components Syst. 2022, 49, 1248–1259. [Google Scholar] [CrossRef]
  77. Alnefaie, S.A.; Alkuhayli, A.; Al-Shaalan, A.M. Optimizing Load Frequency Control of Multi-Area Power Renewable and Thermal Systems Using Advanced Proportional–Integral–Derivative Controllers and Catch Fish Algorithm. Fractal Fract. 2025, 9, 355. [Google Scholar] [CrossRef]
  78. Chen, G.; Liu, X.; Ren, X.; Xia, J.; Park, J.H. Asynchronous-Based Countermeasure for Stealthy Attack on Aperiodic Sampled-Data Control Systems. IEEE Trans. Automat. Contr. 2025, 70, 6159–6166. [Google Scholar] [CrossRef]
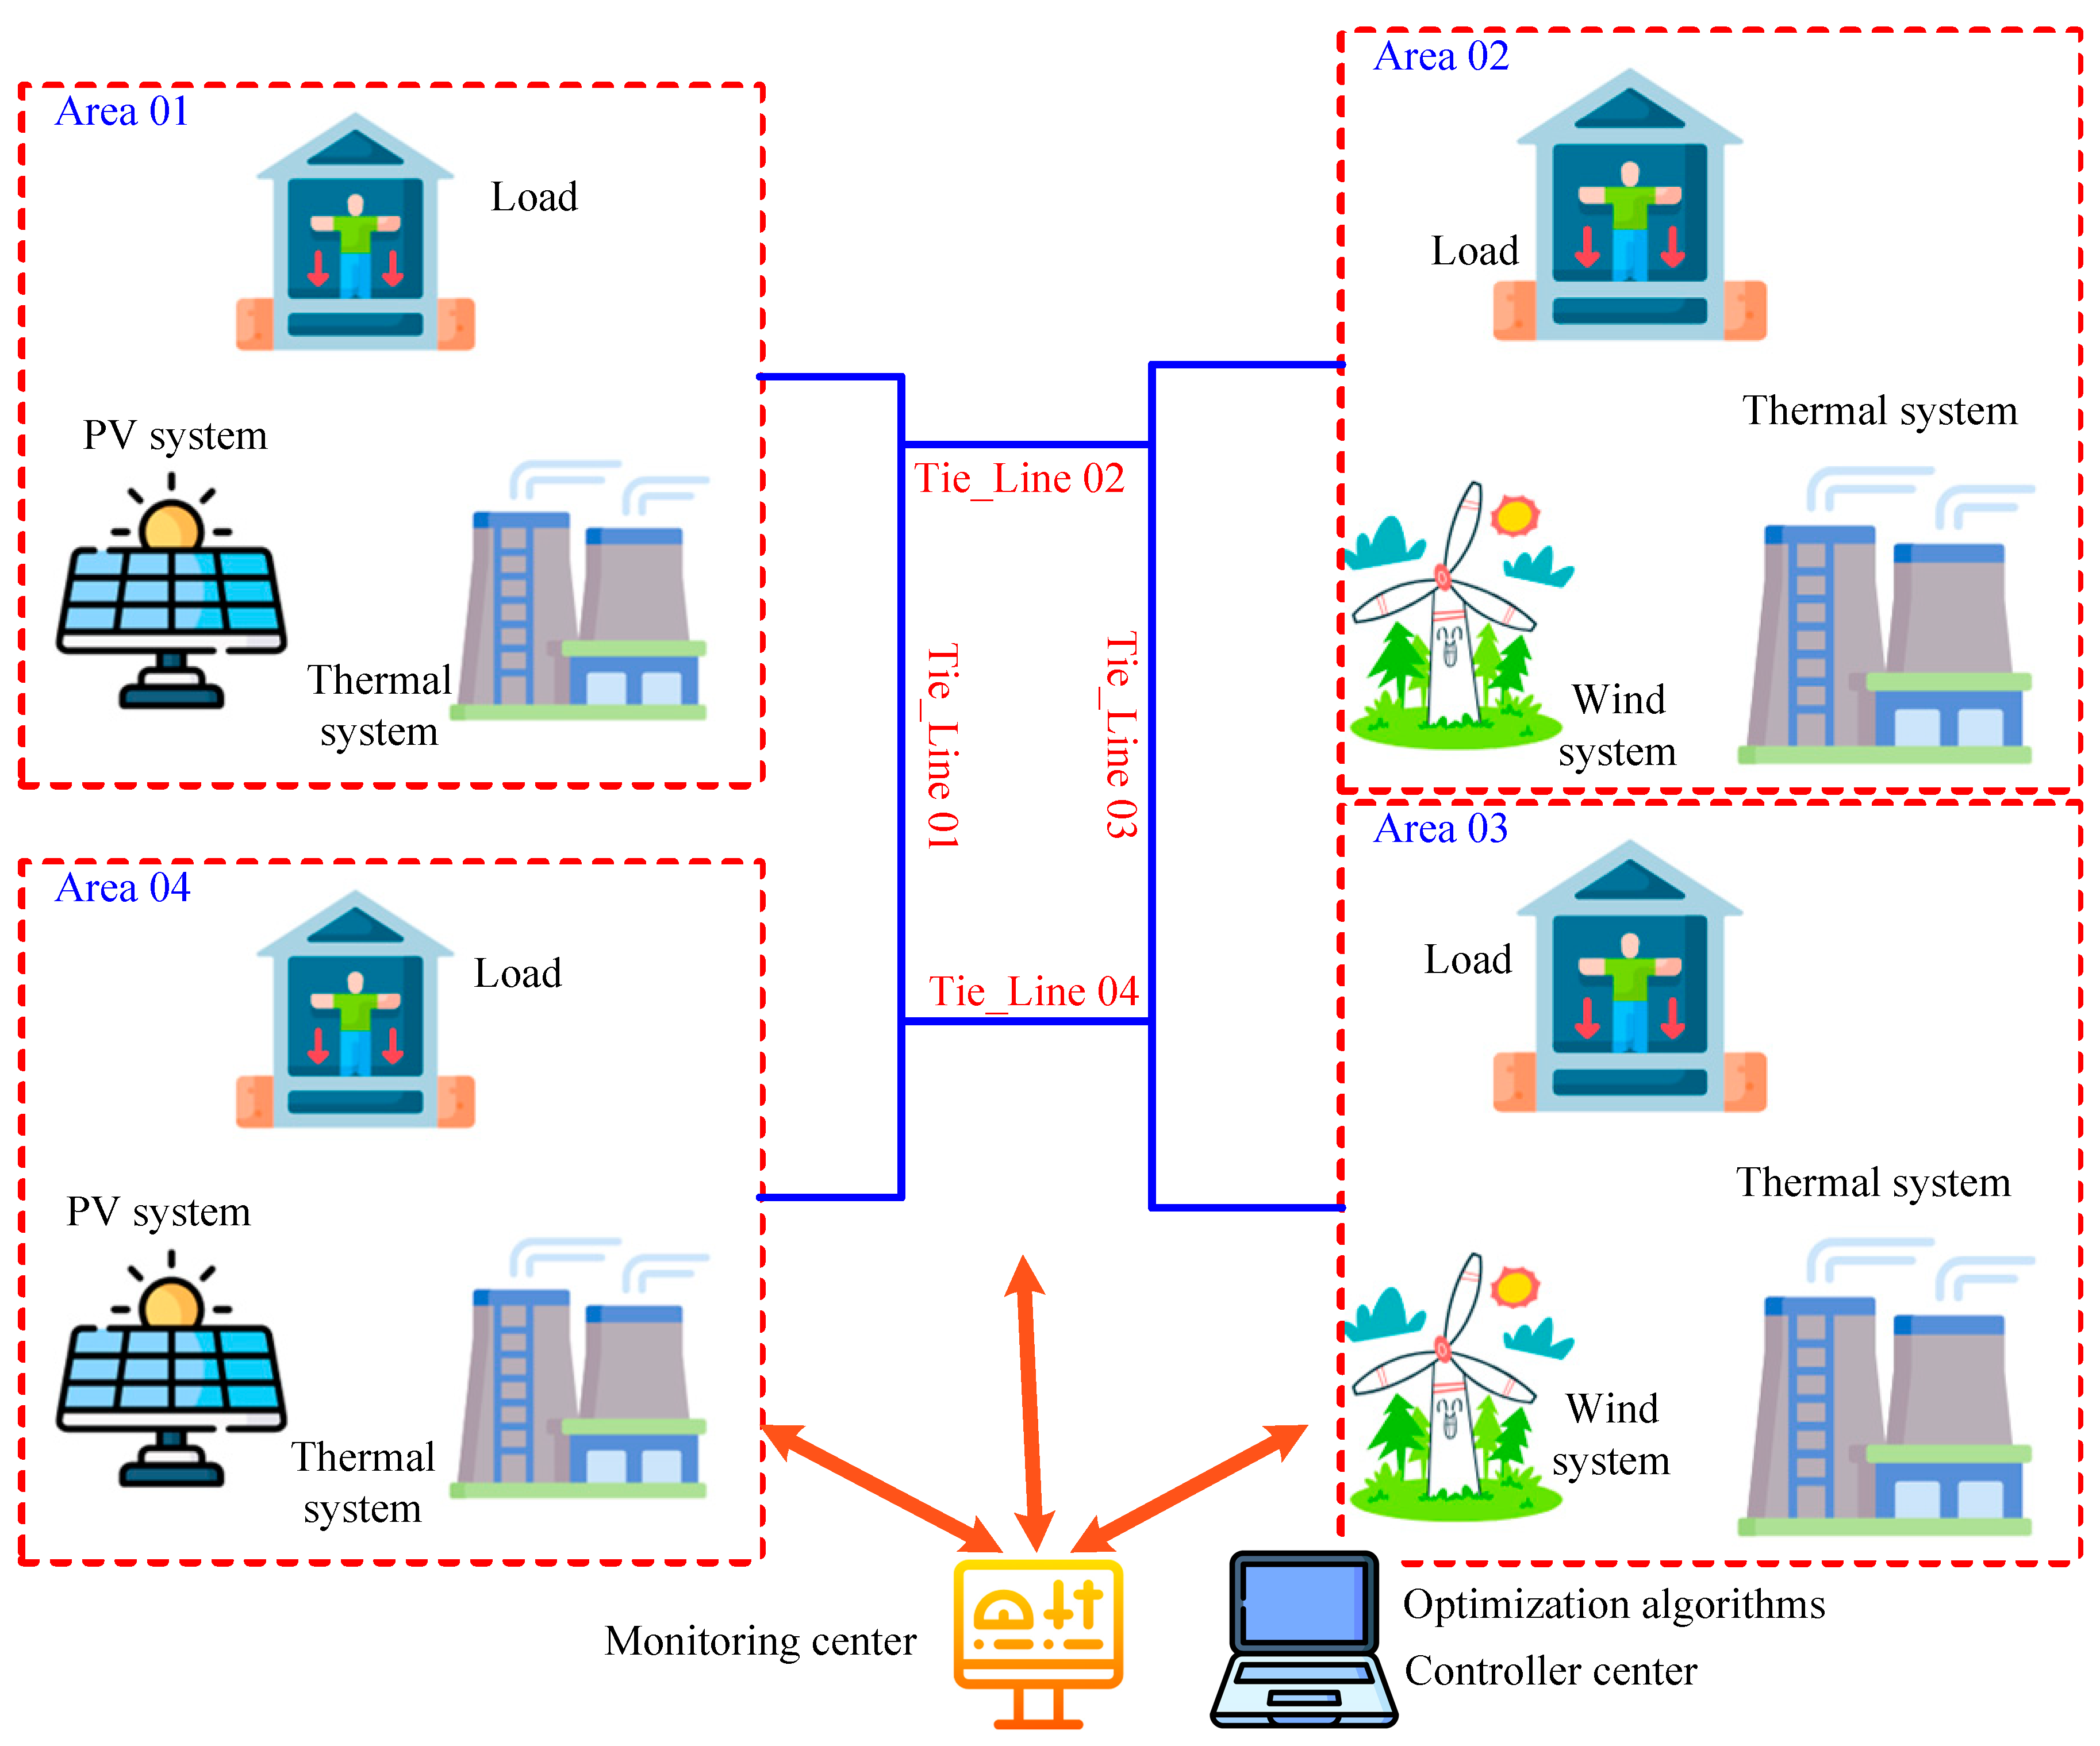
Figure 1. The LFC and AVR frameworks’ structure.
Mathematics 13 03131 g001
Figure 2. The taxonomy of control strategies in AVR and LFC issues.
Mathematics 13 03131 g002
Figure 3. Generalized IPS with the combination of LFC and the AVR model for only one area.
Mathematics 13 03131 g003
Figure 4. Tie-line connections.
Mathematics 13 03131 g004
Figure 5. Combined model of Four-Area IPS.
Mathematics 13 03131 g005
Figure 6. Transfer function model of boiler dynamics.
Mathematics 13 03131 g006
Figure 7. Proposed control strategy using PI(1+DD).
Mathematics 13 03131 g007
Figure 8. Structures strategy of controllers, (a) PID, (b) I-PD, (c) I-P, and (d) PI(PDN).
Mathematics 13 03131 g008
Figure 9. Arithmetic operator hierarchy.
Mathematics 13 03131 g009
Figure 10. Two-dimensional view and fitness function curve of 10 functions.
Mathematics 13 03131 g010
Figure 11. Flowchart of the proposed AOA.
Mathematics 13 03131 g011
Figure 12. The output results using LHHO algorithm: responses of LFC deviations (a) f1, (b) f2, (c) f3, and (d) f4; responses of AVR deviations—(a) Vt1, (b) Vt2, (c) Vt3, and (d) Vt4; responses to tie-line power deviations—(a) Ptie1, (b) Ptie2, (c) Ptie3, and (d) Ptie4 (Case one).
Mathematics 13 03131 g012
Figure 13. The output results using GWO algorithm: responses of LFC deviations—(a) f1, (b) f2, (c) f3, and (d) f4; responses of AVR deviations—(a) Vt1, (b) Vt2, (c) Vt3, and (d) Vt4; responses to tie-line power deviations—(a) Ptie1, (b) Ptie2, (c) Ptie3, and (d) Ptie4 (Case one).
Mathematics 13 03131 g013
Figure 14. The output results using TOCFA: responses of LFC deviations—(a) f1, (b) f2, (c) f3, and (d) f4; responses of AVR deviations—(a) Vt1, (b) Vt2, (c) Vt3, and (d) Vt4; responses to tie-line power deviations—(a) Ptie1, (b) Ptie2, (c) Ptie3, and (d) Ptie4 (Case one).
Mathematics 13 03131 g014
Figure 15. The output results using WaOA algorithm: responses of LFC deviations—(a) f1, (b) f2, (c) f3, and (d) f4; responses of AVR deviations—(a) Vt1, (b) Vt2, (c) Vt3, and (d) Vt4; responses to tie-line power deviations—(a) Ptie1, (b) Ptie2, (c) Ptie3, and (d) Ptie4 (Case one).
Mathematics 13 03131 g015
Figure 16. The output results using the proposed AOA: responses of LFC deviations—(a) f1, (b) f2, (c) f3, and (d) f4; responses of AVR deviations—(a) Vt1, (b) Vt2, (c) Vt3, and (d) Vt4; responses to tie-line power deviations—(a) Ptie1, (b) Ptie2, (c) Ptie3, and (d) Ptie4 (Case one).
Mathematics 13 03131 g016
Figure 18. LFC responses comparison of all algorithms tuned PI(1+DD): (a) f1, (b) f2, (c) f3, and (d) f4 (Case one).
Mathematics 13 03131 g018
Figure 19. AVR responses comparison of algorithms tuned PI(1+DD): (a) Vt1, (b) Vt2, (c) Vt3, and (d) Vt4 (Case one).
Mathematics 13 03131 g019
Figure 20. Tie-line power deviation responses comparison of all algorithms tuned PI(1+DD): (a) Ptie1, (b) Ptie2, (c) Ptie3, and (d) Ptie4 (Case one).
Mathematics 13 03131 g020
Figure 21. Convergence curves of all algorithms tuned PI(1+DD) (Case one).
Mathematics 13 03131 g021
Figure 22. Irregular changes in system load.
Mathematics 13 03131 g022
Figure 23. The output results using LHHO algorithm: responses of LFC deviations—(a) f1, (b) f2, (c) f3, and (d) f4; responses of AVR deviations—(a) Vt1, (b) Vt2, (c) Vt3, and (d) Vt4; responses to tie-line power deviations—(a) Ptie1, (b) Ptie2, (c) Ptie3, and (d) Ptie4 (Case two).
Mathematics 13 03131 g023
Figure 24. The output results using GWO algorithm: responses of LFC deviations—(a) f1, (b) f2, (c) f3, and (d) f4; responses of AVR deviations—(a) Vt1, (b) Vt2, (c) Vt3, and (d) Vt4; responses to tie-line power deviations—(a) Ptie1, (b) Ptie2, (c) Ptie3, and (d) Ptie4 (Case two).
Mathematics 13 03131 g024
Figure 25. The output results using TOCFA: responses of LFC deviations—(a) f1, (b) f2, (c) f3, and (d) f4; responses of AVR deviations(a) Vt1, (b) Vt2, (c) Vt3, and (d) Vt4; responses to tie-line power deviations—(a) Ptie1, (b) Ptie2, (c) Ptie3, and (d) Ptie4 (Case two).
Mathematics 13 03131 g025
Figure 26. The output results using WaOA algorithm: responses of LFC deviations—(a) f1, (b) f2, (c) f3, and (d) f4; responses of AVR deviations—(a) Vt1, (b) Vt2, (c) Vt3, and (d) Vt4; responses to tie-line power deviations—(a) Ptie1, (b) Ptie2, (c) Ptie3, and (d) Ptie4 (Case two).
Mathematics 13 03131 g026
Figure 27. The output results using the proposed AOA: responses of LFC deviations—(a) f1, (b) f2, (c) f3, and (d) f4; responses of AVR deviations—(a) Vt1, (b) Vt2, (c) Vt3, and (d) Vt4; responses to tie-line power deviations—(a) Ptie1, (b) Ptie2, (c) Ptie3, and (d) Ptie4 (Case two).
Mathematics 13 03131 g027
Figure 29. LFC responses comparison of all algorithms tuned PI(1+DD): (a) f1; (b) f2; (c) f3; (d) f4 (Case two).
Mathematics 13 03131 g029
Figure 30. AVR responses comparison of algorithms tuned PI(1+DD): (a) Vt1; (b) Vt2; (c) Vt3; (d) Vt4 (Case two).
Mathematics 13 03131 g030
Figure 31. Responses to tie-line power deviations comparison of all algorithms tuned PI(1+DD): (a) Ptie1; (b) Ptie2; (c) Ptie3; (d) Ptie4 (Case two).
Mathematics 13 03131 g031
Figure 32. Convergence curves of all algorithms tuned PI(1+DD (Case two).
Mathematics 13 03131 g032
Figure 33. Time–domain responses under renewable generation variation for six tuning tools with the same control structure: (a) AOA-PI(1+DD), (b) GWO-PI(1+DD), (c) TOCFA-PI(1+DD), (d) WaOA-PI(1+DD), (e) LHHO-PI(1+DD), and (f) PSO-PI(1+DD).
Mathematics 13 03131 g033
Figure 34. LFC responses with system parameter variations in ±25%: (a) f1, (b) f2, (c) f3, and (d) f4 (Case three).
Mathematics 13 03131 g034
Figure 35. AVR responses with system parameter changes in ±25%:(a) Vt1; (b) Vt2; (c) Vt3; (d) Vt4 (Case three).
Mathematics 13 03131 g035
Figure 36. Responses to tie-line power deviations when system parameters vary by ±25%: (a) Ptie1; (b) Ptie2; (c) Ptie3; (d) Ptie4 (Case three).
Mathematics 13 03131 g036
Figure 37. LFC model with nonlinearities (GDB, BD, and GRC).
Mathematics 13 03131 g037
Figure 38. Frequency variation with the proposed method, (a) with nonlinearities, and (b) without nonlinearities.
Mathematics 13 03131 g038
Figure 39. Δf1–Δf4 settling times across PID variants. Red crosses (×) indicate methods that violated at least one robustness or performance constraint (e.g., instability, limit breach, or non-convergence) and were not considered in the final ranking.
Mathematics 13 03131 g039
Table 1. The literature summary.
Refs/YearResearch DirectionProposed ControllerTuning AlgorithmsGenerations TypeCovered AreasGenerations in All AreasNonlinearities
[59]/2025AVR and LFCPIRPOMicrogrid with EVs13---
[60]/2025AVR and LFCMPCLHHOThermal, diesel, wind,
solar, and hydroelectric
23
3
GDB
[61]/2024AVR and LFCFOPIDWaOAReheat Thermal21
1
---
[62]/2024AVR and LFCPI-PDOOBOHydro, Thermal, Gas, Wind and Solar420GDB, GRC and BD
[32]/2024AVR and LFCFPIDD2GBOHydro, Thermal, Gas, Solar and Wind28GDB, GRC and CTD
[44]/2023AVR and LFCPIDGBOHydro, Thermal, Gas, Solar and Wind420---
[2]/2022AVR and LFCPI-PDAOA, PBO, MPSO---2, 32
3
---
[1]/2022AVR and LFCPI-PDDOHydro, Thermal, and Gas63---
[25]/2024AVR and LFCADRC2nd order control lawGeothermal, Solar, EVs and Wind36---
[26]/2022AVR and LFC2DOF, I-TDFHHOSolar, Wind, Dish Stirling and Reheat Thermal36GRC, GDB
[27]/2022AVR and LFCCFPD-TIDAFAThermal Geothermal and Hydro,36DB, GRC
[28]/2022AVR and LFCCFOTDN-FOPDNAFAReheat Thermal, Solar, Hydro, and Dish Stirling24DB, GRC, CTD
[29]/2023AVR and LFCCPDN-FOPIDNAFAHydro, Gas, Reheat Thermal, and Geothermal36GDB, GRC
[30]/2022AVR and LFCPIDADPOtwo solar panels and Three Bioenergy210---
[31]/2022AVR and LFCFuzzy PIDHAEFAGas, Hydro, and Reheat Thermal26---
[20]/2021AVR and LFCPIDNLTA-22---
[21]/2021AVR and LFCPIDDGWOHydro, Nuclear and Reheat Thermal26GDB, GRC
[22]/2021AVR and LFCPIDFAReheat Thermal and Hydro24GDB, GRC, TD
[23]/2021AVR and LFCPIDAhFPAPFAHydro, Reheat Thermal,11---
[24]/2023AVR and LFCTIDAHHOCombined cycle gas turbine and Reheat Thermal,36GDB, BD and GRC
[16]/2020AVR and LFCCPSSIPSOHydro, Gas and Reheat Thermal11GDB, GRC
[17]/2020AVR and LFCPIDDE-AEFAHydro, wind, Gas, solar, diesel, and Thermal26GRC
[18]/2022AVR and LFCPIDDE-AEFAReheat Thermal, Hydro, wind, solar, diesel, and Gas26GRC
[19]/2023AVR and LFCPIDF, PISCAReheat and Non-Reheat -Thermal22---
[15]/2024AVR and LFCFOODMFONon-Reheat Thermal and Hydro24GDB, BD
[14]/2019AVR and LFCPIDFAHydro, and Non-Reheat Thermal24---
[13]/2023AVR and LFCPID, FuzzyZN, FLC---11---
[12]/2018AVR and LFCPIDF, PIDuFLSADiesel, Reheat Thermal, and wind24GRC, GDB
[11]/2016AVR and LFCPIDSA, ZNHydro, and Non-Reheat Thermal24GDB
[10]/2024AVR and LFCNN-FTFNN-FTF---11---
[63]/2025AVR and LFC(1+PDD2)(MSO---11GDB, GRC
--- = Not available.
Table 2. The four-area power system parameters are taken into consideration.
ParameterValueParameterValueParameterValueParameterValueParameterValueParameterValue
B0.045R12.4R32.4K30.5K41.4K51.5
R22.4R42.4T_g0.08K610T_α0.01K_β1
T_m10K_a0.3T_f0.3K_γ0.4K_e0.8T_δ1.4
T_h5T_∞28.75T_w0.025K_η0.05T_θ0.6T_w10.041
X0.6Y1a1K_w21.25T_pp1.8K_ρ1
b0.05c1T_CR0.01T120.545T130.545T140.545
T_a0.23T_CO0.2D0.0145T210.545T230.545T240.545
H5f60K_ps68.97T310.545T320.545T340.545
T_ps11.49K10.2K20.1T410.545T420.545T430.545
Table 3. Test functions of AOA.
FunctionDescriptionBest Fitness Values
F1 f ( x ) = n i = 1 x i 2 0
F2 f ( x ) = n i = 0 | x i | + n i = 0 | x i | 0
F3 f ( x ) = d i = 1 ( i j = 1 x j ) 2 0
F4 f ( x ) = m a x i { | x i | , 1 i n } 0
F5 f ( x ) = n 1 i = 1 [ 100 ( x i 2 x i + 1 ) 2 + ( 1 x i ) 2 ] 6.169
F6 f ( x ) = n i = 1 ( [ x i + 0.5 ] ) 2 0.03475
F7 f ( x ) = n i = 0 i x i 4 + random [ 0 , 1 ) 4.88 × 10⁻⁵
F8 f ( x ) = n i = 1 ( x i sin ( | x i | ) ) −3151.77
F9 f ( x ) = n i = 1 [ x i 2 10 c o s ( 2 π x i ) + 10 ] 0
F10 f ( x ) = 20 e x p ( 0.2 1 n n i = 1 x i 2 ) e x p ( 1 n n i = 1 c o s ( 2 π x i ) ) + 20 + e 4.44 × 10⁻¹⁶
Table 4. The controller’s settings were properly optimized by AOA.
AreaController ParameterAOA-PI-(1+DD) ValueController ParameterAOA-PI-(PDN) ValueController ParameterAOA-(I-PD) ValueController ParameterAOA-(I-P) ValueController ParameterAOA-PID ValueController ParameterAOA-PI Value
Area-1KP1.0156KP1.7932KI0.1205KI1.4358KP0.1205KP1.4358
KI1.0705KI0.5424KP1.5098KP0.4906KI1.5098KI0.4906
KD11.3475KP0.5695KD0.9247------KD0.9247------
KD21.9402KD0.3291------------------------
KP0.7678KP0.6420KI1.3462KI0.6899KP1.3462KP0.6899
KI1.7523KI1.6420KP0.3926KP0.4503KI0.4503KI1.2331
KD10.5701KP0.3537KD1.3866------KD1.3866------
KD20.7678KD1.1088------------------------
Area-2KP1.4358KP1.5098KI1.2331KI0.3926KP1.2331KP1.4358
KI0.4906KI0.9247KP0.4503KP0.4906KI0.4503KI0.4906
KD11.564KP0.7901KD1.2045------KD0.9247------
KD20.8687KD1.3462------------------------
KP0.6899KP2KI1.3462KI0.6899KP1.3462KP1.564
KI2KI1.3866KP0.7901KP0.3926KI0.7901KI0.8687
KD11.2331KP0.3926KD1.3866------KD1.3866------
KD20.4503KD0.5067------------------------
Area-3KP1.7932KP1.7932KI1.0093KI0.3926KP1.5021KP0.7901
KI0.5424KI0.5424KP1.3343KP0.4906KI1.5818KI0.4906
KD10.5695KP0.5695KD1.7173------KD0.3926------
KD20.3291KD0.3291------------------------
KP1.6420KP1.6420KI1.3462KI0.6899KP1.3462KP1.2331
KI2KI2KP1.564KP0.7901KI1.3462KI0.4503
KD10.3537KP0.3537KD1.3866------KD1.3866------
KD21.1088KD1.1088------------------------
Area-4KP0.3537KP1.3866KI0.8711KI0.3926KP1.2331KP0.8711
KI1.1088KI0.3926KP1.0537KP0.4906KI0.4503KI1.0537
KD10.8985KP0.5067KD0.4791------KD0.5067------
KD20.6106KD0.7381------------------------
KP0.6757KP0.6757KI1.3462KI0.6899KP 1.3462KP0.6899
KI2KI0.1501KP0.9877KP1.564KI0.3926KI0.8687
KD12KP2KD1.3866------KD1.3866------
KD20.9827KD0.5214------------------------
Table 5. Numerical findings for LFC loops (Case one).
Control StrategyArea-1Area-2Area-3Area-4
Ts+Ve−Ve% s-s ErrorTs+Ve−Ve% s-s ErrorTs+Ve−Ve% s-s
Error
Ts+Ve−Ve% s-s
Error
GWO-PI(1+DD)8.240.36−0.6508.230.38−0.6108.240.39−0.6508.210.36−0.700
LHHO-PI(1+DD)13.400.04−0.15010.900.009−0.12015.650.006−0.088015.180.03−0.120
TOCFA-PI(1+DD)26.110.02−0.053028.470.054−0.091028.800.015−0.045029.740.013−0.0520
WaOA-PI(1+DD)20.180.08−0.091019.670.05−0.08019.360.0048−0.087021.110.0049−0.0570
AOA-PI(1+DD)19.180.008−0.091019.670.005−0.068019.360.0048−0.087021.110.0049−0.0570
Table 6. AVR loop numerical results (Case one).
Control 1.Area-1Area-2Area-3Area-4
Ts+Ve−Ve% s-s ErrorTs+Ve−Ve% s-s ErrorTs+Ve−Ve% s-s
Error
Ts+Ve−Ve% s-s
Error
GWO-PI(1+DD)3.2424.36−1.6507.2323.38−2.6108.2434.39−2.6508.2134.36−2.700
LHHO-PI(1+DD)10.4035.04−5.15015.9025.9−1.12015.6512. 6−3.088015.1823.03−1.120
TOCFA-PI(1+DD)16.1132.02−0.53018.4714.4−5.091028.8020.5−1.045029.7418.13−1.520
WaOA-PI(1+DD)5.148. 8−0. 81016.6710.5−0.68011.3612.48−1.087011.1112. 49−2.0570
AOA-PI(1+DD)4.185.34−0.09107.173.67−0.18010.364. 48−1.01010.115.49−0.570
Table 7. Numerical findings for power variations in tie-lines (Case one).
Control StrategyArea-1Area-2Area-3Area-4
Ts+Ve−Ve% s-s ErrorTs+Ve−Ve% s-s ErrorTs+Ve−Ve% s-s
Error
Ts+Ve−Ve% s-s
Error
GWO-PI(1+DD)6.240.24−0.6508.230.38−0.6108.240.39−0.6508.210.36−0.700
LHHO-PI(1+DD)11.400.19−0.15010.900.009−0.12015.650.006−0.088015.180.03−0.120
TOCFA-PI(1+DD)20.110.23−0.053028.470.054−0.091018.800.015−0.045029.740.013−0.0520
WaOA-PI(1+DD)11.180.18−0. 91019.670.055−0.068019.360.048−0.087011.110.49−0.0570
AOA-PI(1+DD)9.180.028−0.091019.670.005−0.068011.360.0048−0.087010.110.049−0.0570
Table 8. LFC loop numerical results (Case two).
Control StrategyArea-1Area-2Area-3Area-4
Ts+Ve−Ve% s-s ErrorTs+Ve−Ve% s-s ErrorTs+Ve−Ve% s-s
Error
Ts+Ve−Ve% s-s
Error
GWO-PI(1+DD)7.320.56−0.5506.750.45−0.4106.240.79−0.5505.210.76−0.700
LHHO-PI(1+DD)11.230.06−0.22504.180.029−0.32014.650.066−0.238017.180.23−0.120
TOCFA-PI(1+DD)21.170.08−0.093023.210.134−0.131026.800.055−0.155025.740.613−0.0520
WaOA-PI(1+DD)19.160.08−0.471015.670.65−0.58017.360.029−0.06702.620.014−0.0570
AOA-PI(1+DD)5.50.006−0.06305.30.005−0.03405.70.0048−0.04705.210.049−0.0570
Table 9. AVR loop numerical results (Case two).
Control StrategyArea-1Area-2Area-3Area-4
Ts+Ve−Ve% s-s ErrorTs+Ve−Ve% s-s ErrorTs+Ve−Ve% s-s
Error
Ts+Ve−Ve% s-s
Error
GWO-PI(1+DD)3.2424.36−1.6507.2323.38−2.6108.240−2.6508.2134.36−2.700
LHHO-PI(1+DD)10.4035.04−5.15015.9025.9−1.12015.6512. 6−3.088015.1823.03−1.120
TOCFA-PI(1+DD)16.1132.02−0.53018.4714.4−5.091028.8020.5−1.045029.740.44−1.520
WaOA-PI(1+DD)5.148. 8−0. 81016.6710.5−0.68011.3612.48−1.087011.1112. 49−2.0570
AOA-PI(1+DD)3.355.61−0.09107.173.35−0.1802.074. 48−1.01010.115.49−0.570
Table 10. Numerical findings for power variations in tie-lines (Case two).
Control StrategyArea-1Area-2Area-3Area-4
Ts+Ve−Ve% s-s ErrorTs+Ve−Ve% s-s ErrorTs+Ve−Ve% s-s
Error
Ts+Ve−Ve% s-s
Error
GWO-PI(1+DD)6.240.24−0.65011.230.38−0.6108.240.39−0.65090.36−0.700
LHHO-PI(1+DD)11.400.004−0.15010.900.015−0.12015.650.019−0.088015.180.03−0.120
TOCFA-PI(1+DD)20.110.23−0.009028.470.054−0.061018.800.015−0.045029.740.013−0.0520
WaOA-PI(1+DD)11.180.18−0. 91019.670.055−0.068019.360.048−0.087011.110.49−0.0570
AOA-PI(1+DD)14.740.028−0.091019.670.005−0.068011.80.0048−0.022010.110.021−0.0060
Table 11. LFC numerical findings utilizing the AOA-PI(1+DD) control approach with ±25% system parameter fluctuations (Case three).
CaseArea-1Area-2
Ts+Ve−Ve% s-s ErrorTs+Ve−Ve% s-s Error
+25% of Ttr and R5.440.24−0.5806.050.25−0.550
Nominal Values5.370.23−0.5805.380.23−0.540
−25% of Ttr and R5.230.21−0.5705.260.21−0.530
CaseArea-3Area-4
Ts+Ve−Ve% s-s ErrorTs+Ve−Ve% s-s Error
+25% of Ttr and R 6.070.23−0.5206.170.27−0.500
Nominal Values5.380.22−0.5205.980.26−0.490
−25% of Ttr and R5.270.21−0.5105.280.24−0.490
Table 12. AVR numerical results with ±25% system parameter fluctuations utilizing the AOA-PI(1+DD) control approach (Case three).
CaseArea-1Area-2
Ts+Ve−Ve% s-s ErrorTs+Ve−Ve% s-s Error
+25% of Ttr and R3.977.5504.105.4603.977.55
Nominal Values3.967.5204.095.4503.967.52
−25% of Ttr and R3.957.4604.085.4403.957.46
CaseArea-3Area-4
Ts+Ve−Ve% s-s ErrorTs+Ve−Ve% s-s Error
+25% of Ttr and R 4.369.002.9310.1404.369.0
Nominal Values4.369.002.9210.1304.369.0
−25% of Ttr and R4.369.002.9110.1304.369.0
Table 13. AOA-PI(1+DD) control approach numerical results of tie-line power deviation responses with ±25% changes in system parameters (Case three).
CaseArea-1Area-2
Ts+Ve−Ve% s-s ErrorTs+Ve−Ve% s-s Error
+25% of Ttr and R9.350.023−0.01709.670.0026−0.00940
Nominal Values9.360.023−0.01609.690.0025−0.00930
−25% of Ttr and R9.390.022−0.01509.710.0022−0.00910
CaseArea-3Area-4
Ts+Ve−Ve% s-s ErrorTs+Ve−Ve% s-s Error
+25% of Ttr and R 8.470.013−0.012010.210.016−0.0130
Nominal Values8.450.013−0.012010.230.015−0.0130
−25% of Ttr and R8.480.012−0.011010.260.014−0.0120
Table 14. Frequency deviation with nonlinearities utilizing the proposed method.
ParameterΔf1Δf2Δf3Δf4
Overshoot (Hz)~0.245 Hz~0.097 HzNot clearly visibleNot clearly visible
Undershoot (Hz)~−0.417 Hz~−0.330 Hz−0.6 Hz (approx)−0.6 Hz (approx)
Settling Time (s)~25–30 s~25–30 s~25–30 s~25–30 s
Error (steady-state)~0 Hz~0 Hz~0 Hz~0 Hz
Table 15. Frequency deviation without nonlinearities utilizing the proposed method.
ParameterΔf1Δf2Δf3Δf4
Overshoot (Hz)~0.1 Hz~0.05 Hz~0.07 Hz~0.05 Hz
Undershoot (Hz)~−0.1 Hz~−0.05 Hz~−0.07 Hz~−0.05 Hz
Settling Time (s)~15–20 s~15–20 s~15–20 s~15–20 s
Error (steady-state)~0 Hz~0 Hz~0 Hz~0 Hz
Table 16. Evaluation of LFC in multi-area power systems in comparison.
RefTechniqueΔf1 Ts (s)Δf2 Ts (s)Δf3 Ts (s)Δf4 Ts (s)ITAEITSE
[68]WCA-PID9.5512.5212.5427.410.1338---
[69]BSA-PID4.504.003.333.200.1168---
[2]GSA-PID5.965.308.697.88------
[70]GA-PID14.5415.22------------
[71]PSO-PID14.5415.22------------
[72]MFOA-PID2.593.71------0.12880.1288
[73]HHO-PID6.2413.7714.02---------
[74]GWO-PID14.0017.0017.00---
[75]POA-PID2.003.005.005.000.0843---
[62]OOBO-PI-PD8.248.238.248.21------
[76]GWO-PI(1+DD)9.7310.27------------
[77]CFA-PI(1+DD)55.639.1------------
This workAOA-PI(1+DD)5.35.35.35.3---0.0005
Disclaimer/Publisher’s Note: The statements, opinions and data contained in all publications are solely those of the individual author(s) and contributor(s) and not of MDPI and/or the editor(s). MDPI and/or the editor(s) disclaim responsibility for any injury to people or property resulting from any ideas, methods, instructions or products referred to in the content.