Article

Truncated M-Fractional Exact Solutions, Stability Analysis, and Modulation Instability of the Classical Lonngren Wave Model

by
Haitham Qawaqneh
1 and
Abdulaziz Khalid Alsharidi
2,*
1
Department of Mathematics, Faculty of Science and Information Technology, Al-Zaytoonah University of Jordan, Amman 11733, Jordan
2
Department of Mathematics and Statistics, College of Science, King Faisal University, Al-Hasa 31982, Saudi Arabia
*
Author to whom correspondence should be addressed.
Mathematics 2025, 13(19), 3107; https://doi.org/10.3390/math13193107
Submission received: 28 August 2025 / Revised: 12 September 2025 / Accepted: 16 September 2025 / Published: 28 September 2025

Abstract

Many types of exact solutions to the truncated M-fractional classical Lonngren wave model are explored in this paper. The classical Lonngren wave model is a significant electronics equation. This model is used to explain the electronic signals within semiconductor materials, especially tunnel diodes. Through the application of a modified ( G / G 2 ) -expansion technique and an extended sinh-Gordon equation expansion (EShGEE) method, we obtained various wave solutions, including periodic, kink, singular, dark, bright, and dark–bright types, among others. To ensure that the solutions in question are stable, linear stability analysis is also carried out. Moreover, the stationary solutions of the concerning equation are studied through modulation instability. The obtained results are useful in various areas, including electronic physics, soliton physics, plasma physics, nonlinear optics, acoustics, etc. Both techniques are useful for solving nonlinear partial fractional differential equations. Both techniques provide exact solutions, which can be important for understanding complex phenomena. Both techniques are reliable and yield distinct types of exact soliton solutions.

1. Introduction

Fractional differential equations are used in many fields of science and engineering. Various fractional differential models have been developed, including the fractional stochastic Biswas–Arshed equation [1], the fractional Van der Waals equation [2], the fractional single-joint robot arm model [3], the fractional generalized Pochhammer–Chree equation [4], the fractional Boussinesq–Burgers system [5], the fractional Pareto probability distribution model [6], the fractional Riemann wave equation [7], the fractional coupled Konno–Onno equation [8], the Sharma–Tasso–Olver equation [9], the fractional advection diffusion equations [10], the fractional Boussinesq–Burgers system [11], the fractional Schrödinger–Hirota equation [12], the fractional Westervelt model [13], etc. There are many methods to obtain the exact wave solitons and other solutions, including the Sardar sub-equation method [14], the Moser iterative method [15], the unified method [16], the new extended direct algebraic method [17], the Crank–Nicolson finite difference method [18], the Fourier-Jacobi Polynomials method [19], the Hirota bilinear method [20], etc.
The model we focus on is the classical Lonngren wave model, which is given as follows [21]:
( v x x θ v + κ v 2 ) t t + v x x = 0 .
Here, v is a real-valued function. Symbols θ and κ are the arbitrary constants. Equation (1) has its physical basis in the behavior of electrical signals within Sony’s tunnel diode, which falls under the category of semiconductor materials [22]. Moreover, Equation (1) has applications in elucidating the propagation of electrical signals through materials exhibiting semiconductor properties and mechanisms underlying energy storage in circuits featuring electrical charge. Various methods are used to obtain the different types of solutions of Equation (1), including the Sine–Gordon expansion method [23], the auxiliary equation method [24], the ( 1 / G ) -expansion method [25], Lie group analysis [26], etc.
In this paper, the authors utilized the EShGEE technique and the modified ( G / G 2 ) -expansion technique. The proposed methods are used for many models. Specifically, the EShGEE method is applied to the Biswas–Arshed equation [27], the hyperbolic and cubic-quintic non-linear Schrödinger models [28], the generalized non-linear Schrödinger model [29], and the Kundu–Eckhaus model [30]. The modified ( G / G 2 ) -expansion technique is utilized for multiple models, as discussed in [31,32,33], etc.
The aim of this work was to obtain novel exact wave solitons of the classical Lonngren wave model with a truncated M-fractional derivative. Moreover, we performed qualitative analysis to describe the accuracy and stability of the obtained results.
The motivation for our research is to explore the different types of exact soliton solutions of the classical Lonngren wave model in the truncated M-fractional derivative form. The truncated M-fractional derivative shares properties of both the fractional derivatives and integer-order derivatives. This definition of a fractional derivative provides solutions that are close to the numerical solutions of the model. The techniques employed here provide multiple kinds of exact soliton solutions. These techniques have not yet been applied to the classical Lonngren wave model. The applied techniques are also applicable for other nonlinear partial fractional differential equations. Additionally, the effect of the truncated M-fractional derivative on the obtained solutions is also discussed through two-dimensional graphs. Moreover, stability and modulation instability analyses are utilized for the first time for the classical Lonngren wave model.
This paper comprises multiple sections: a description of the EShGEE scheme and modified ( G / G 2 ) -expansion method in Section 2; mathematical analysis and exact wave solutions in Section 3; a graphical explanation in Section 4; qualitative analysis in Section 5; and the conclusion in Section 6.
Definition 1.
Suppose w ( y ) : [ 0 , ) , so TMFD of w of order ϵ [34]
D M , t ϵ , ϱ w ( t ) = lim ϵ 0 w ( t E ϱ ( ϵ t 1 ϵ ) ) w ( t ) ϵ , ϵ ( 0 , 1 ] , ϱ > 0 ,
here E ϱ ( . ) denotes TML profile [35]
E ϱ ( z ) = j = 0 i z j Γ ( ϱ j + 1 ) , ϱ > 0 and z C .
Theorem 1.
Suppose a,b and g , f are ϵ differentiable for t > 0 . The following property is taken from [34]:
( a ) D M , t ϵ , ϱ ( a g ( t ) + b f ( t ) ) = a D M , t ϵ , ϱ g ( t ) + b D M , t ϵ , ϱ f ( t ) .
To prove the linearity property, we will use the definition of the fractional derivative operator D M , t ϵ , ϱ .
  • Step 1: Apply the definition to the linear combination. Let us consider D M , t ϵ , ϱ ( a g ( t ) + b f ( t ) ) using the given definition:
    D M , t ϵ , ϱ ( a g ( t ) + b f ( t ) ) = lim ϵ 0 ( a g ( t E ϱ ( ϵ t 1 ϵ ) ) + b f ( t E ϱ ( ϵ t 1 ϵ ) ) ) ( a g ( t ) + b f ( t ) ) ϵ
  • Step 2: Distribute the limit. D M , t ϵ , ϱ ( a g ( t ) + b f ( t ) ) = lim ϵ 0 a g ( t E ϱ ( ϵ t 1 ϵ ) ) + b f ( t E ϱ ( ϵ t 1 ϵ ) ) a g ( t ) b f ( t ) ϵ
  • Step 3: Separate the terms. D M , t ϵ , ϱ ( a g ( t ) + b f ( t ) ) = lim ϵ 0 a ( g ( t E ϱ ( ϵ t 1 ϵ ) ) g ( t ) ) + b ( f ( t E ϱ ( ϵ t 1 ϵ ) ) f ( t ) ) ϵ
  • Step 4: Factor out constants. D M , t ϵ , ϱ ( a g ( t ) + b f ( t ) ) = lim ϵ 0 a g ( t E ϱ ( ϵ t 1 ϵ ) ) g ( t ) ϵ + lim ϵ 0 b f ( t E ϱ ( ϵ t 1 ϵ ) ) f ( t ) ϵ
  • Step 5: Apply the definition of the fractional derivative. D M , t ϵ , ϱ ( a g ( t ) + b f ( t ) ) = a D M , t ϵ , ϱ g ( t ) + b D M , t ϵ , ϱ f ( t )
    The final answer is a D M , t ϵ , ϱ g ( t ) + b D M , t ϵ , ϱ f ( t )
Similarly, we can prove the following theorems.
( b ) D M , t ϵ , ϱ ( g ( t ) · f ( t ) ) = g ( t ) D M , t ϵ , ϱ f ( t ) + f ( t ) D M , t ϵ , ϱ g ( t ) .
( c ) D M , t ϵ , ϱ ( g ( t ) f ( t ) ) = f ( t ) D M , t ϵ , ϱ g ( t ) g ( t ) D M , t ϵ , ϱ f ( t ) ( f ( t ) ) 2
( d ) D M , t ϵ , ϱ ( C ) = 0 , where C is a constant .
( e ) D M , t ϵ , ϱ g ( t ) = t 1 ϵ Γ ( ϱ + 1 ) d g ( t ) d t .
The truncated M-fractional derivative has several physical justifications and mathematical advantages:
(i) It captures the memory effect of the system, which is essential in modeling complex phenomena. (ii) It accounts for non-local interactions, allowing for a more accurate representation of physical systems. (iii) It provides flexibility in modeling various physical systems, including those with different types of nonlinearities. (iv) It is a generalized form that encompasses various fractional derivatives, including the Riemann–Liouville and Caputo derivatives. (v) It converges to the classical derivative when the fractional order approaches an integer value. (vi) It allows for the derivation of analytical solutions for certain types of differential equations. (vii) It can be implemented numerically, providing an efficient way to solve complex problems.
Remark 1.
For ϵ 1 , the term t 1 ϵ approaches t 0 = 1 . Thus, ϵ t 1 ϵ approaches ϵ. The function E ϱ ( ϵ t 1 ϵ ) would approach E ϱ ( ϵ ) .
Given the specific form of the limit definition and without the exact form of E ϱ , we can hypothesize that as ϵ 1 , the operator might approach a form consistent with classical differentiation if E ϱ ( ϵ t 1 ϵ ) behaves in a manner that reduces the fractional nature of the derivative to an integer-order derivative.

2. Description of Techniques

2.1. Description of EShGEE Scheme

Now, we explain the phases of the proposed scheme.
  • Phase 1:
    Consider an FNLPD equation
    F ( g , D M , t ε , ϱ g 2 , g 2 D M , x ε , ϱ g , D M , x ε , ϱ g , ) = 0 .
    where g denotes the profile.
    Applying the given transformation in [36] within the framework of the truncated M-fractional derivative, we obtain the following:
    g = G ( Ω ) , Ω = Γ ( 1 + ϱ ) ( x ε ε λ t ε ε ) .
    Inserting Equation (3) in Equation (2) yields
    H ( G , G 2 G , G , ) = 0 .
  • Phase 2:
    Assume the solution of Equation (4) takes the form
    G ( f ) = α 0 + j = 1 m ( β j sinh ( f ) + α j cosh ( f ) ) j .
    Here, α 0 , α j , β j ( j = 1 , 2 , 3 , , m ) are unknowns. A novel function f of Ω satisfies the following:
    d f d Ω = sinh ( f ) .
    Positive integer “m” is obtained through utilizing the homogenous balance rule. Equation (6) is obtained by applying the following:
    q x t = κ sinh ( v ) .
    By using [37], we obtain a solution of Equation (7) in the form
    sinh f ( Ω ) = ± csch ( Ω ) O R cosh f ( Ω ) = ± coth ( Ω ) .
    and
    sinh f ( Ω ) = ± ι sech ( Ω ) O R cosh f ( Ω ) = ± tanh ( Ω ) .
    ι 2 = 1 .
  • Phase 3:
    Using Equations (5) and (6) in Equation (4) yields the following set of equations.
  • Phase 4:
    Simplifying the obtained set yields undetermined values. Using the obtained results, Equations (8) and (9) give the results for Equation (4) in the form
    G ( Ω ) = α 0 + j = 1 m ( ± β j csch ( Ω ) ± α j coth ( Ω ) ) j
    and
    G ( Ω ) = α 0 + j = 1 m ( ± ι β j sech ( Ω ) ± α j tanh ( Ω ) ) j .

2.2. Description of Modified ( G / G 2 ) Expansion Scheme

Here, basic steps of the scheme are presented [38].
  • Step 1:
    Consider Equations (2)–(4).
  • Step 2:
    Consider the solution of Equation (4) in the form
    Q ( Ω ) = i = 0 m α i ( G G 2 ) i .
    Here, α i ( i = 0 , 1 , 2 , 3 , , m ) are unknowns where α i 0 . A new auxiliary function G = G ( Ω ) satisfies
    ( G G 2 ) = a + b ( G G 2 ) 2 .
    Here, a and b represent the parameters. The results obtained by the authors for Equation (13) depend on a, as follows:
    • Case 1:  a b < 0 yields
      ( G G 2 ) = | a b | b + | a b | 2 ( C 1 sinh ( a b Ω ) + C 2 cosh ( a b Ω ) C 1 cosh ( a b Ω ) + C 2 sinh ( a b Ω ) ) ,
    • Case 2: if a b > 0 , then
      ( G G 2 ) = a b ( C 1 cos ( a b Ω ) + C 2 sin ( a b Ω ) C 1 sin ( a b Ω ) C 2 sin ( a b Ω ) ) ,
    • Case 3: if a = 0 and b 0 , then
      ( G G 2 ) = C 1 b ( C 1 Ω + C 2 ) .
      Here, C 1 and C 2 are constants.
  • Step 3:
    Put Equation (12) into the Equation (4) with Equation (13) and collect the coefficients of each power of ( G G 2 ) i equal to zero, then solve the obtained set having α i , a , b , ν .
  • Step 4:
    By substituting α i , ν , and the other parameters obtained in Step 3 from Equation (12) into Equation (4), one can derive the results of Equation (2).

3. Mathematical Analysis

Equation (1) in the form of a fractional derivative is given as follows:
D M , t ε , 2 ϱ ( D M , x ε , 2 ϱ v θ v + κ v 2 ) + D M , x ε , 2 ϱ v = 0 .
Consider the following wave transformation:
v ( x , t ) = V ( Ω ) , Ω = Γ ( 1 + ϱ ) ε ( x ε ρ t ε ) .
Here, ρ represents the soliton velocity.
D M , x ε , ϱ v = V , D M , x ε , 2 ϱ v = V .
D M , t ε , ϱ v = ρ V , D M , t ε , 2 ϱ v = ρ 2 V .
D M , t ε , ϱ v 2 = 2 ρ V V , D M , t ε , 2 ϱ v 2 = 2 ρ 2 ( V V + ( V ) 2 ) .
D M , t ε , ϱ ( D M , x ε , 2 ϱ v ) = ρ V , D M , t ε , 2 ϱ ( D M , x ε , 2 ϱ v ) = ρ 2 V ( 4 ) .
By substituting Equations (19)–(22) into Equation (17), we get
ρ 2 V ( 4 ) + 1 θ ρ 2 V + 2 κ ρ 2 V V + 2 κ ρ 2 V 2 = 0 .
By using the homogenous balance technique and balancing the terms V 4 and V V , we find that the value of m is two.

3.1. Exact Wave Solutions Through the EShGEE Technique

Equation (5) reduces to the following for m = 2 :
V ( Ω ) = α 0 + α 1 cosh ( f ( Ω ) ) + β 1 sinh ( f ( Ω ) ) + ( α 2 cosh ( f ( Ω ) ) + β 2 sinh ( f ( Ω ) ) ) 2 .
Using Equation (24) in Equation (23) along with Equation (6), we obtain a system containing α 0 , α 1 , β 1 , λ , and other parameters. Solving the system with the use of Mathematica software, provides the following sets:
  • Set 1;
    α 0 = ( θ + 8 ) ρ 2 1 2 κ ρ 2 , α 1 = 0 , α 2 = ± 6 κ , β 1 = 0 , β 2 = 0 .
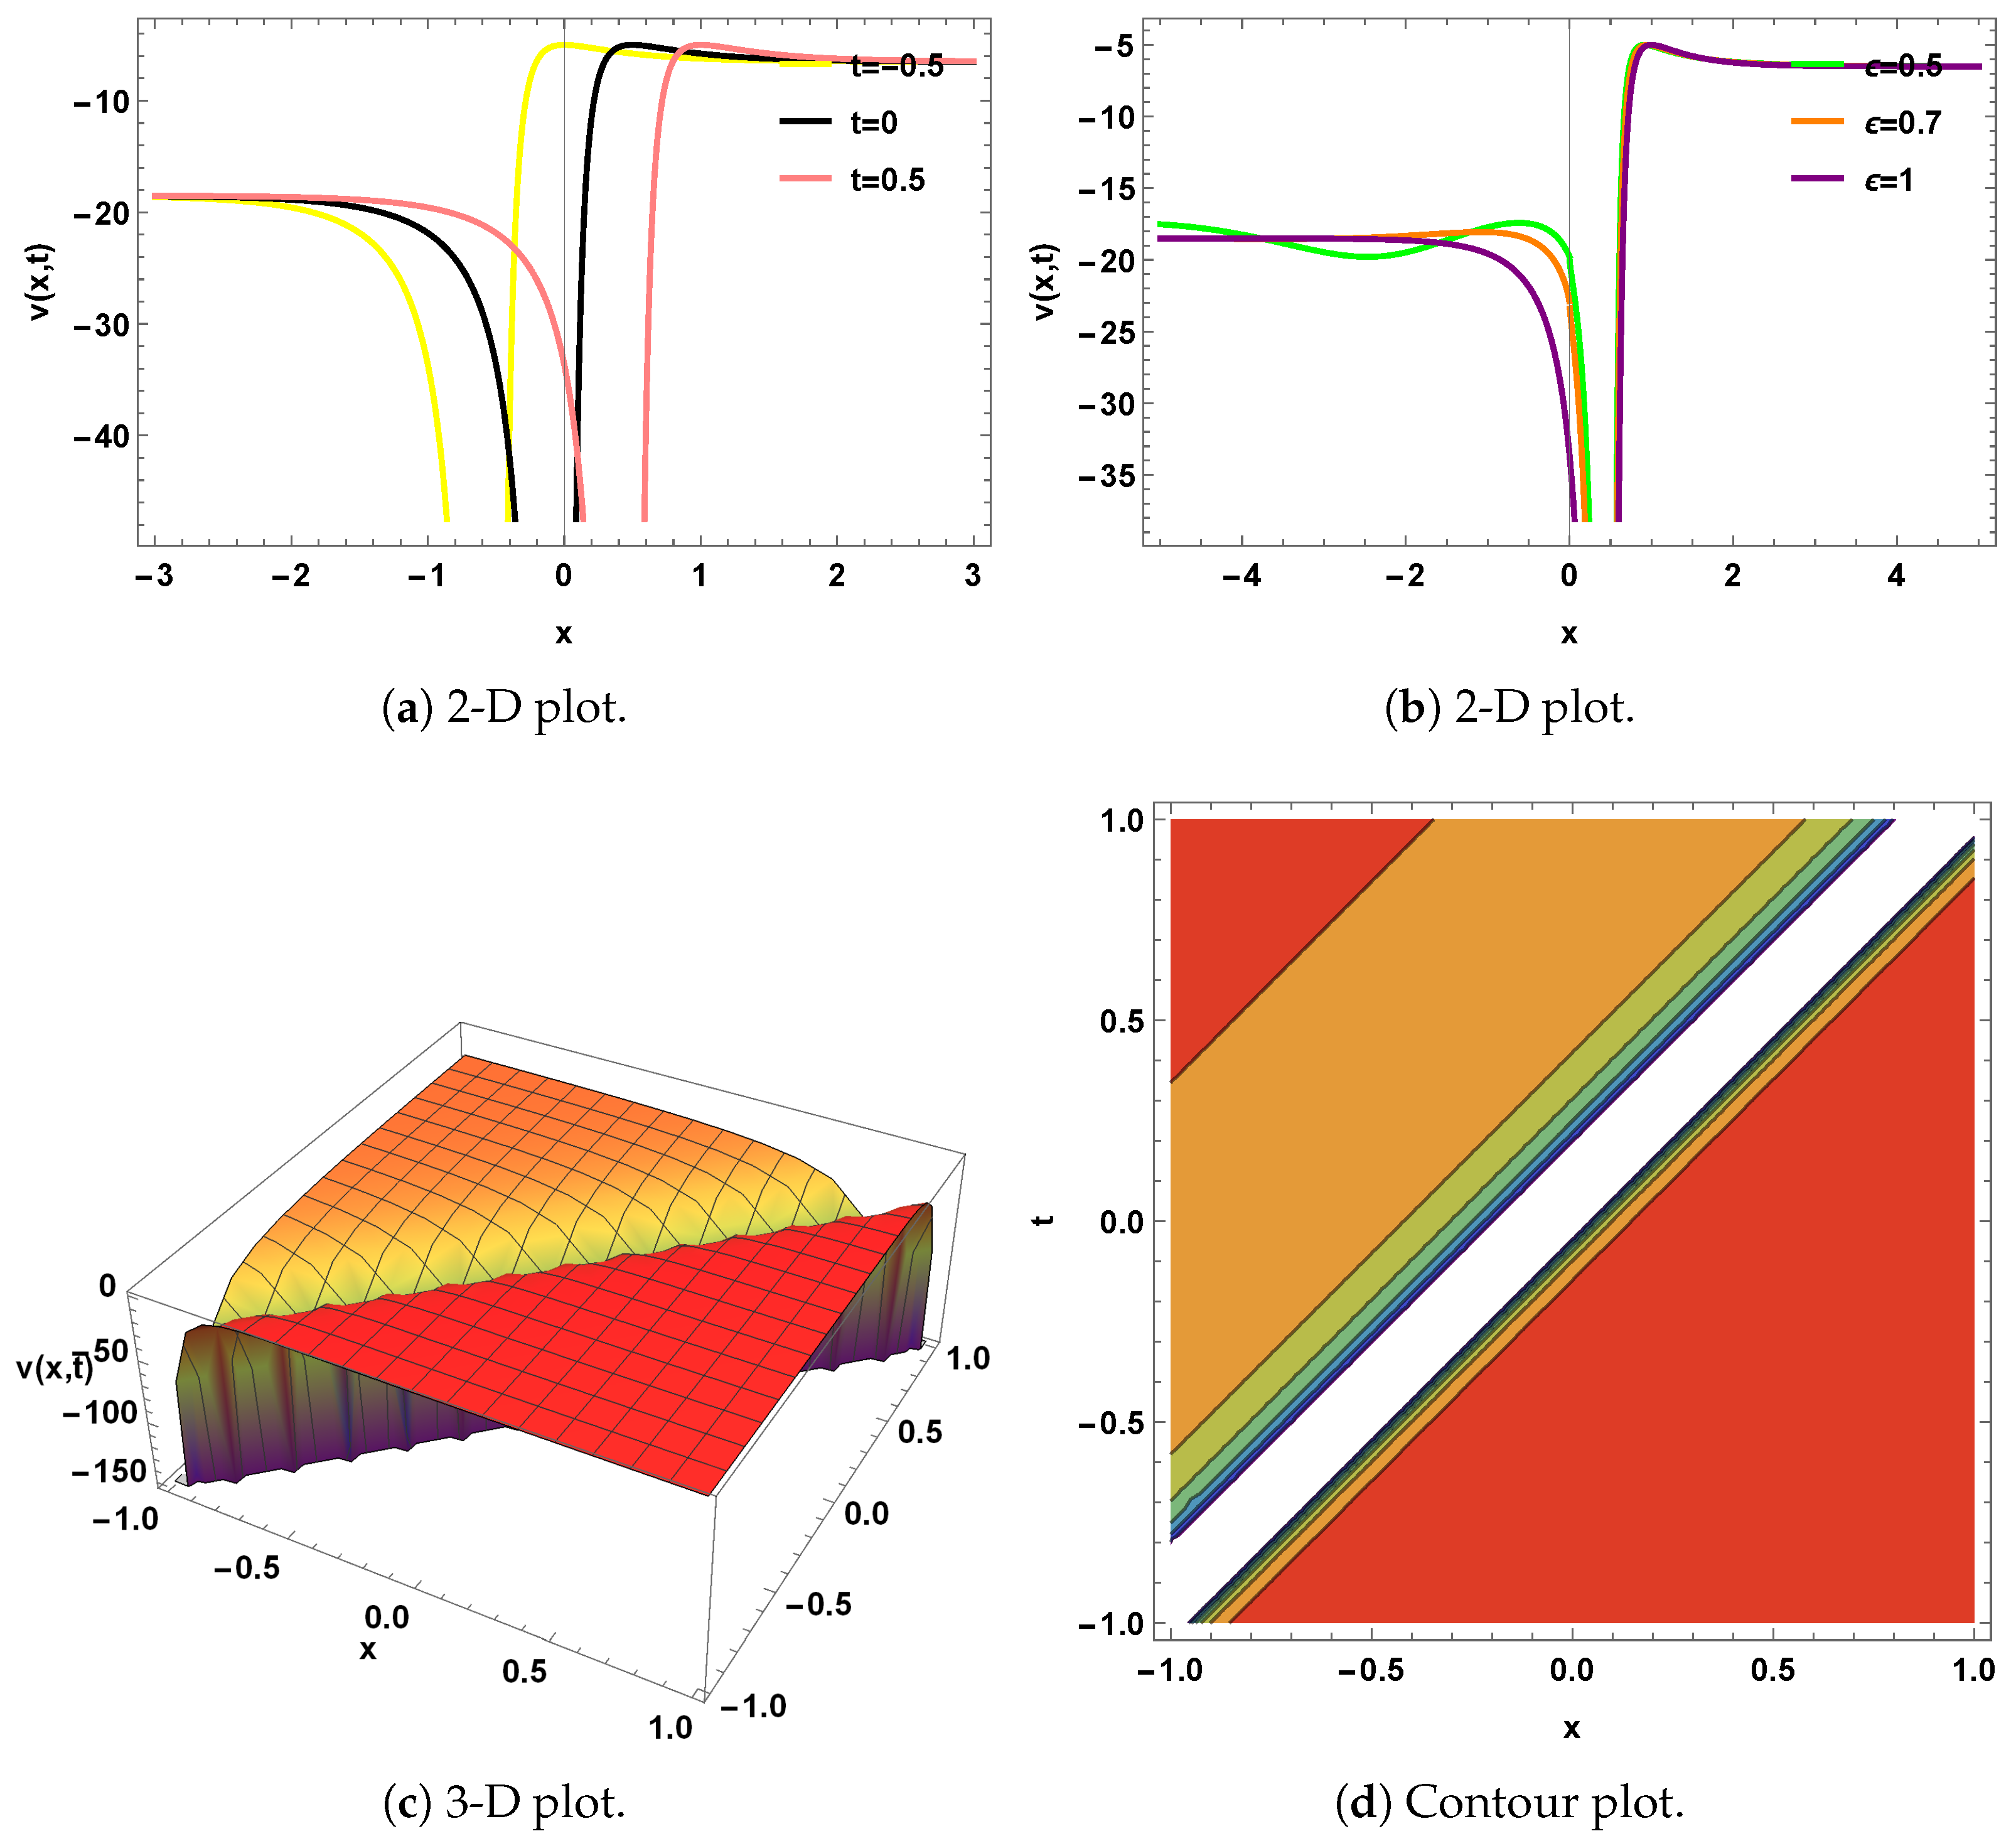
    v ( x , t ) = ( θ + 8 ) ρ 2 1 2 κ ρ 2 6 κ coth 2 ( Γ ( 1 + ϱ ) ε ( x ε ρ t ε ) ) . ρ , κ > 0
    v ( x , t ) = ( θ + 8 ) ρ 2 1 2 κ ρ 2 6 κ tanh 2 ( Γ ( 1 + ϱ ) ε ( x ε ρ t ε ) ) . ρ , κ > 0
  • Set 2;
    α 0 = ( θ + 2 ) ρ 2 1 2 κ ρ 2 , α 1 = 0 , α 2 = ± 3 2 κ , β 1 = 0 , β 2 = 3 2 κ .
    v ( x , t ) = ( θ + 2 ) ρ 2 1 2 κ ρ 2 3 2 κ ( coth ( Γ ( 1 + ϱ ) ε ( x ε ρ t ε ) ) csch ( Γ ( 1 + ϱ ) ε ( x ε ρ t ε ) ) ) 2 . ρ , κ > 0
    v ( x , t ) = ( θ + 2 ) ρ 2 1 2 κ ρ 2 3 2 κ ( tanh ( Γ ( 1 + ϱ ) ε ( x ε ρ t ε ) ) ι sech ( Γ ( 1 + ϱ ) ε ( x ε ρ t ε ) ) ) 2 . ρ , κ > 0
  • Set 3;
    α 0 = ( θ 4 ) ρ 2 1 2 κ ρ 2 , α 1 = 0 , α 2 = 0 , β 1 = 0 , β 2 = ± 6 κ .
    v ( x , t ) = ( θ 4 ) ρ 2 1 2 κ ρ 2 6 κ csch 2 ( Γ ( 1 + ϱ ) ε ( x ε ρ t ε ) ) . ρ , κ < 0
    v ( x , t ) = ( θ 4 ) ρ 2 1 2 κ ρ 2 + 6 κ sech 2 ( Γ ( 1 + ϱ ) ε ( x ε ρ t ε ) ) . ρ < 0 , κ > 0

3.2. Exact Wave Solutions Through Modified ( G / G 2 ) Expansion Technique

In our case, Equation (12) transforms to
Q ( Ω ) = α 0 + α 1 G ( Ω ) G 2 ( Ω ) + α 2 G ( Ω ) G 2 ( Ω ) 2 .
Here, α 0 , α 1 , and α 2 are unknowns. Substituting Equations (13) and (34) into Equation (23) and solving the equation the help of Mathematica software yields the following set:
  • Set:
α 0 = 8 a b ρ 2 + θ ρ 2 1 2 κ ρ 2 , α 1 = 0 , α 2 = 6 b 2 κ .
  • Case 1: If a b < 0 ,
    v ( x , t ) = 8 a b ρ 2 + θ ρ 2 1 2 κ ρ 2 6 b 2 κ ( | a b | b + | a b | 2 ( C 1 sinh ( a b Γ ( 1 + ϱ ) ε ( x ε ρ t ε ) ) + C 2 cosh ( a b Γ ( 1 + ϱ ) ε ( x ε ρ t ε ) ) C 1 cosh ( a b Γ ( 1 + ϱ ) ε ( x ε ρ t ε ) ) + C 2 sinh ( a b Γ ( 1 + ϱ ) ε ( x ε ρ t ε ) ) ) ) 2 . ρ , κ < 0
  • Case 2: If a b > 0 ,
    v ( x , t ) = 8 a b ρ 2 + θ ρ 2 1 2 κ ρ 2 6 a b κ ( C 1 cos ( a b Γ ( 1 + ϱ ) ε ( x ε ρ t ε ) ) + C 2 sin ( a b Γ ( 1 + ϱ ) ε ( x ε ρ t ε ) ) C 1 sin ( a b Γ ( 1 + ϱ ) ε ( x ε ρ t ε ) ) C 2 sin ( a b Γ ( 1 + ϱ ) ε ( x ε ρ t ε ) ) ) 2 . ρ , κ < 0
  • Case 3: If a = 0 and b 0 ,
    v ( x , t ) = θ ρ 2 1 2 κ ρ 2 6 κ C 1 ( C 1 Γ ( 1 + ϱ ) ε ( x ε ρ t ε ) + C 2 ) 2 . ρ , κ < 0

4. Graphical Representation

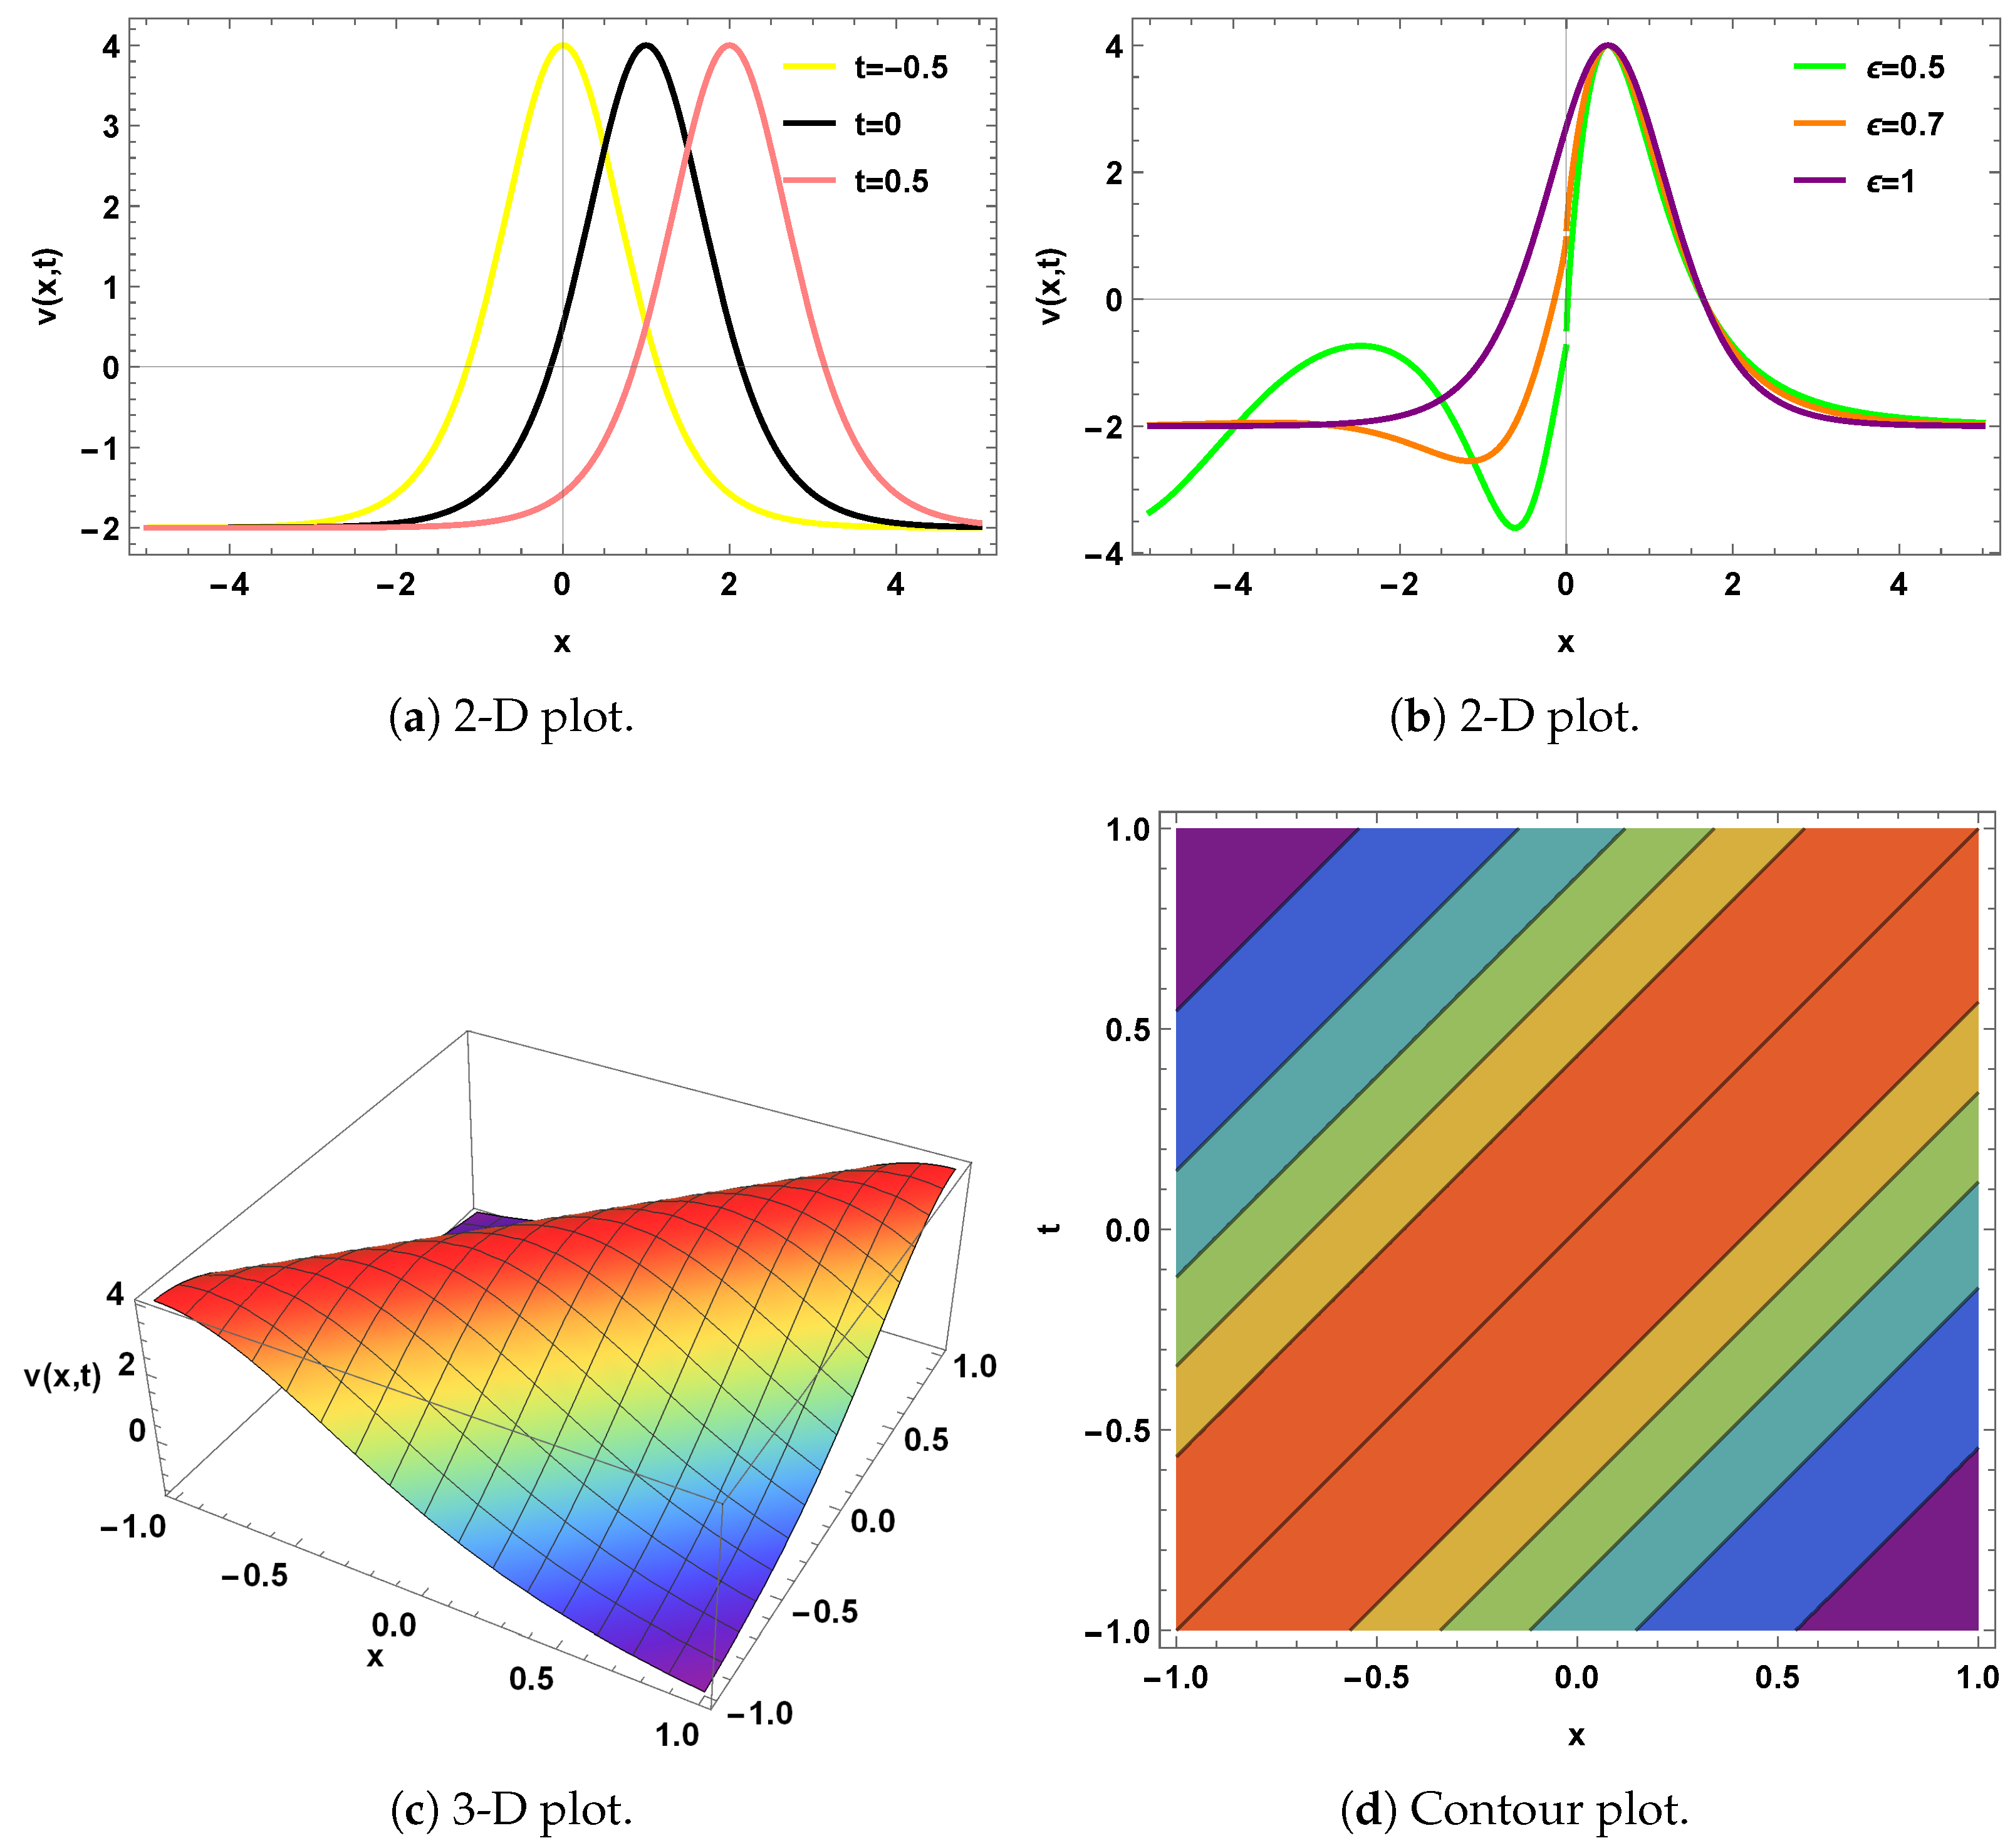
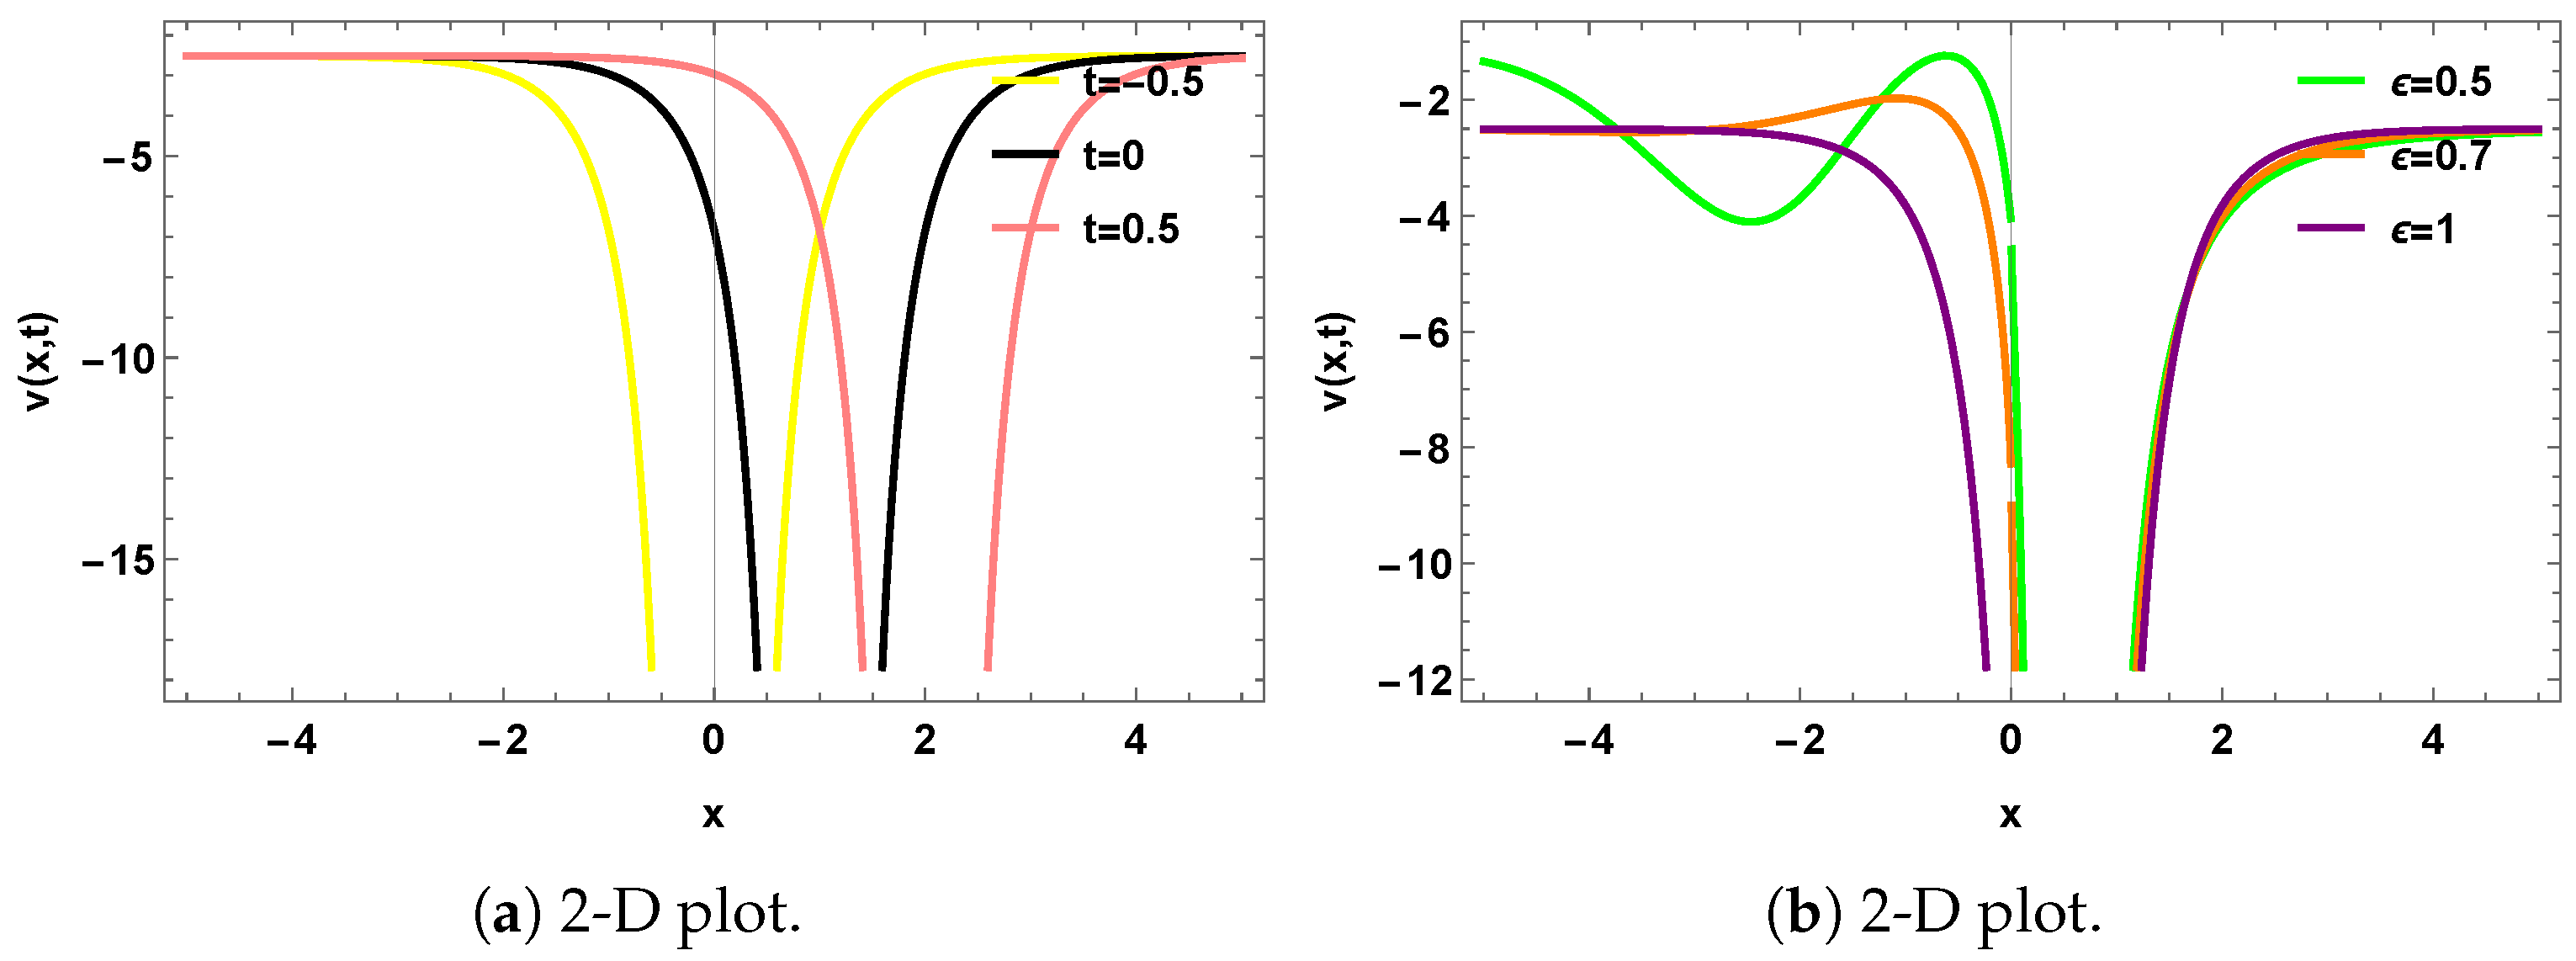
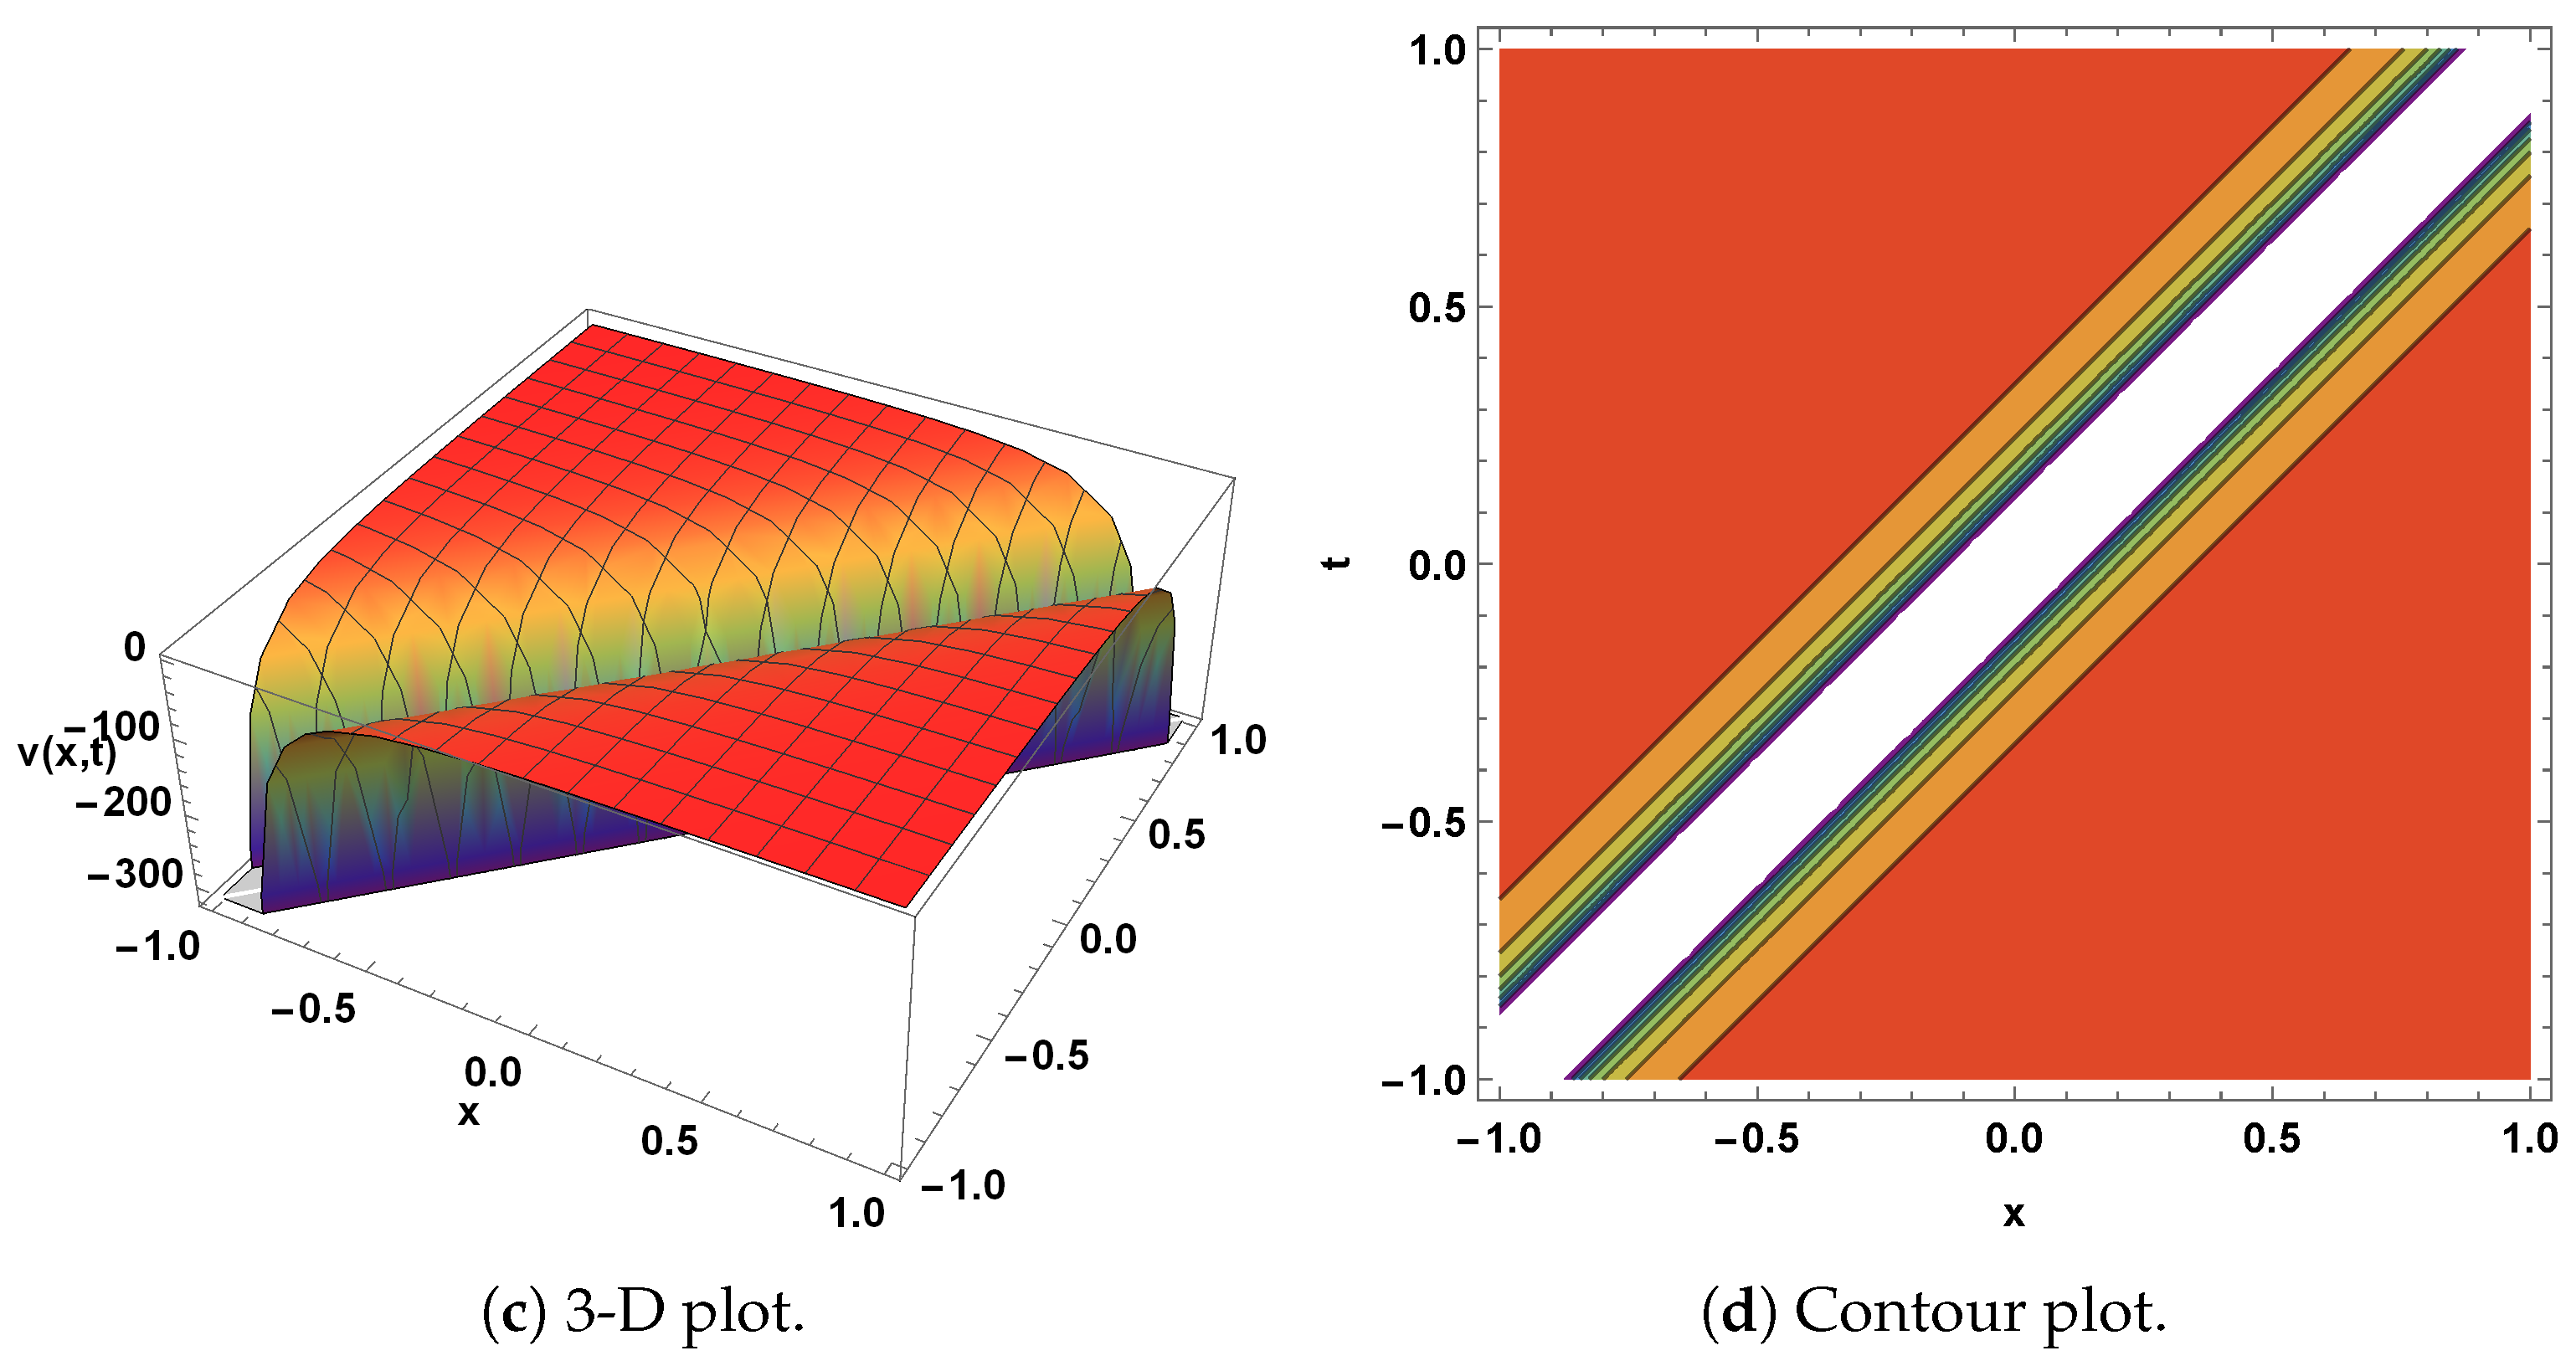
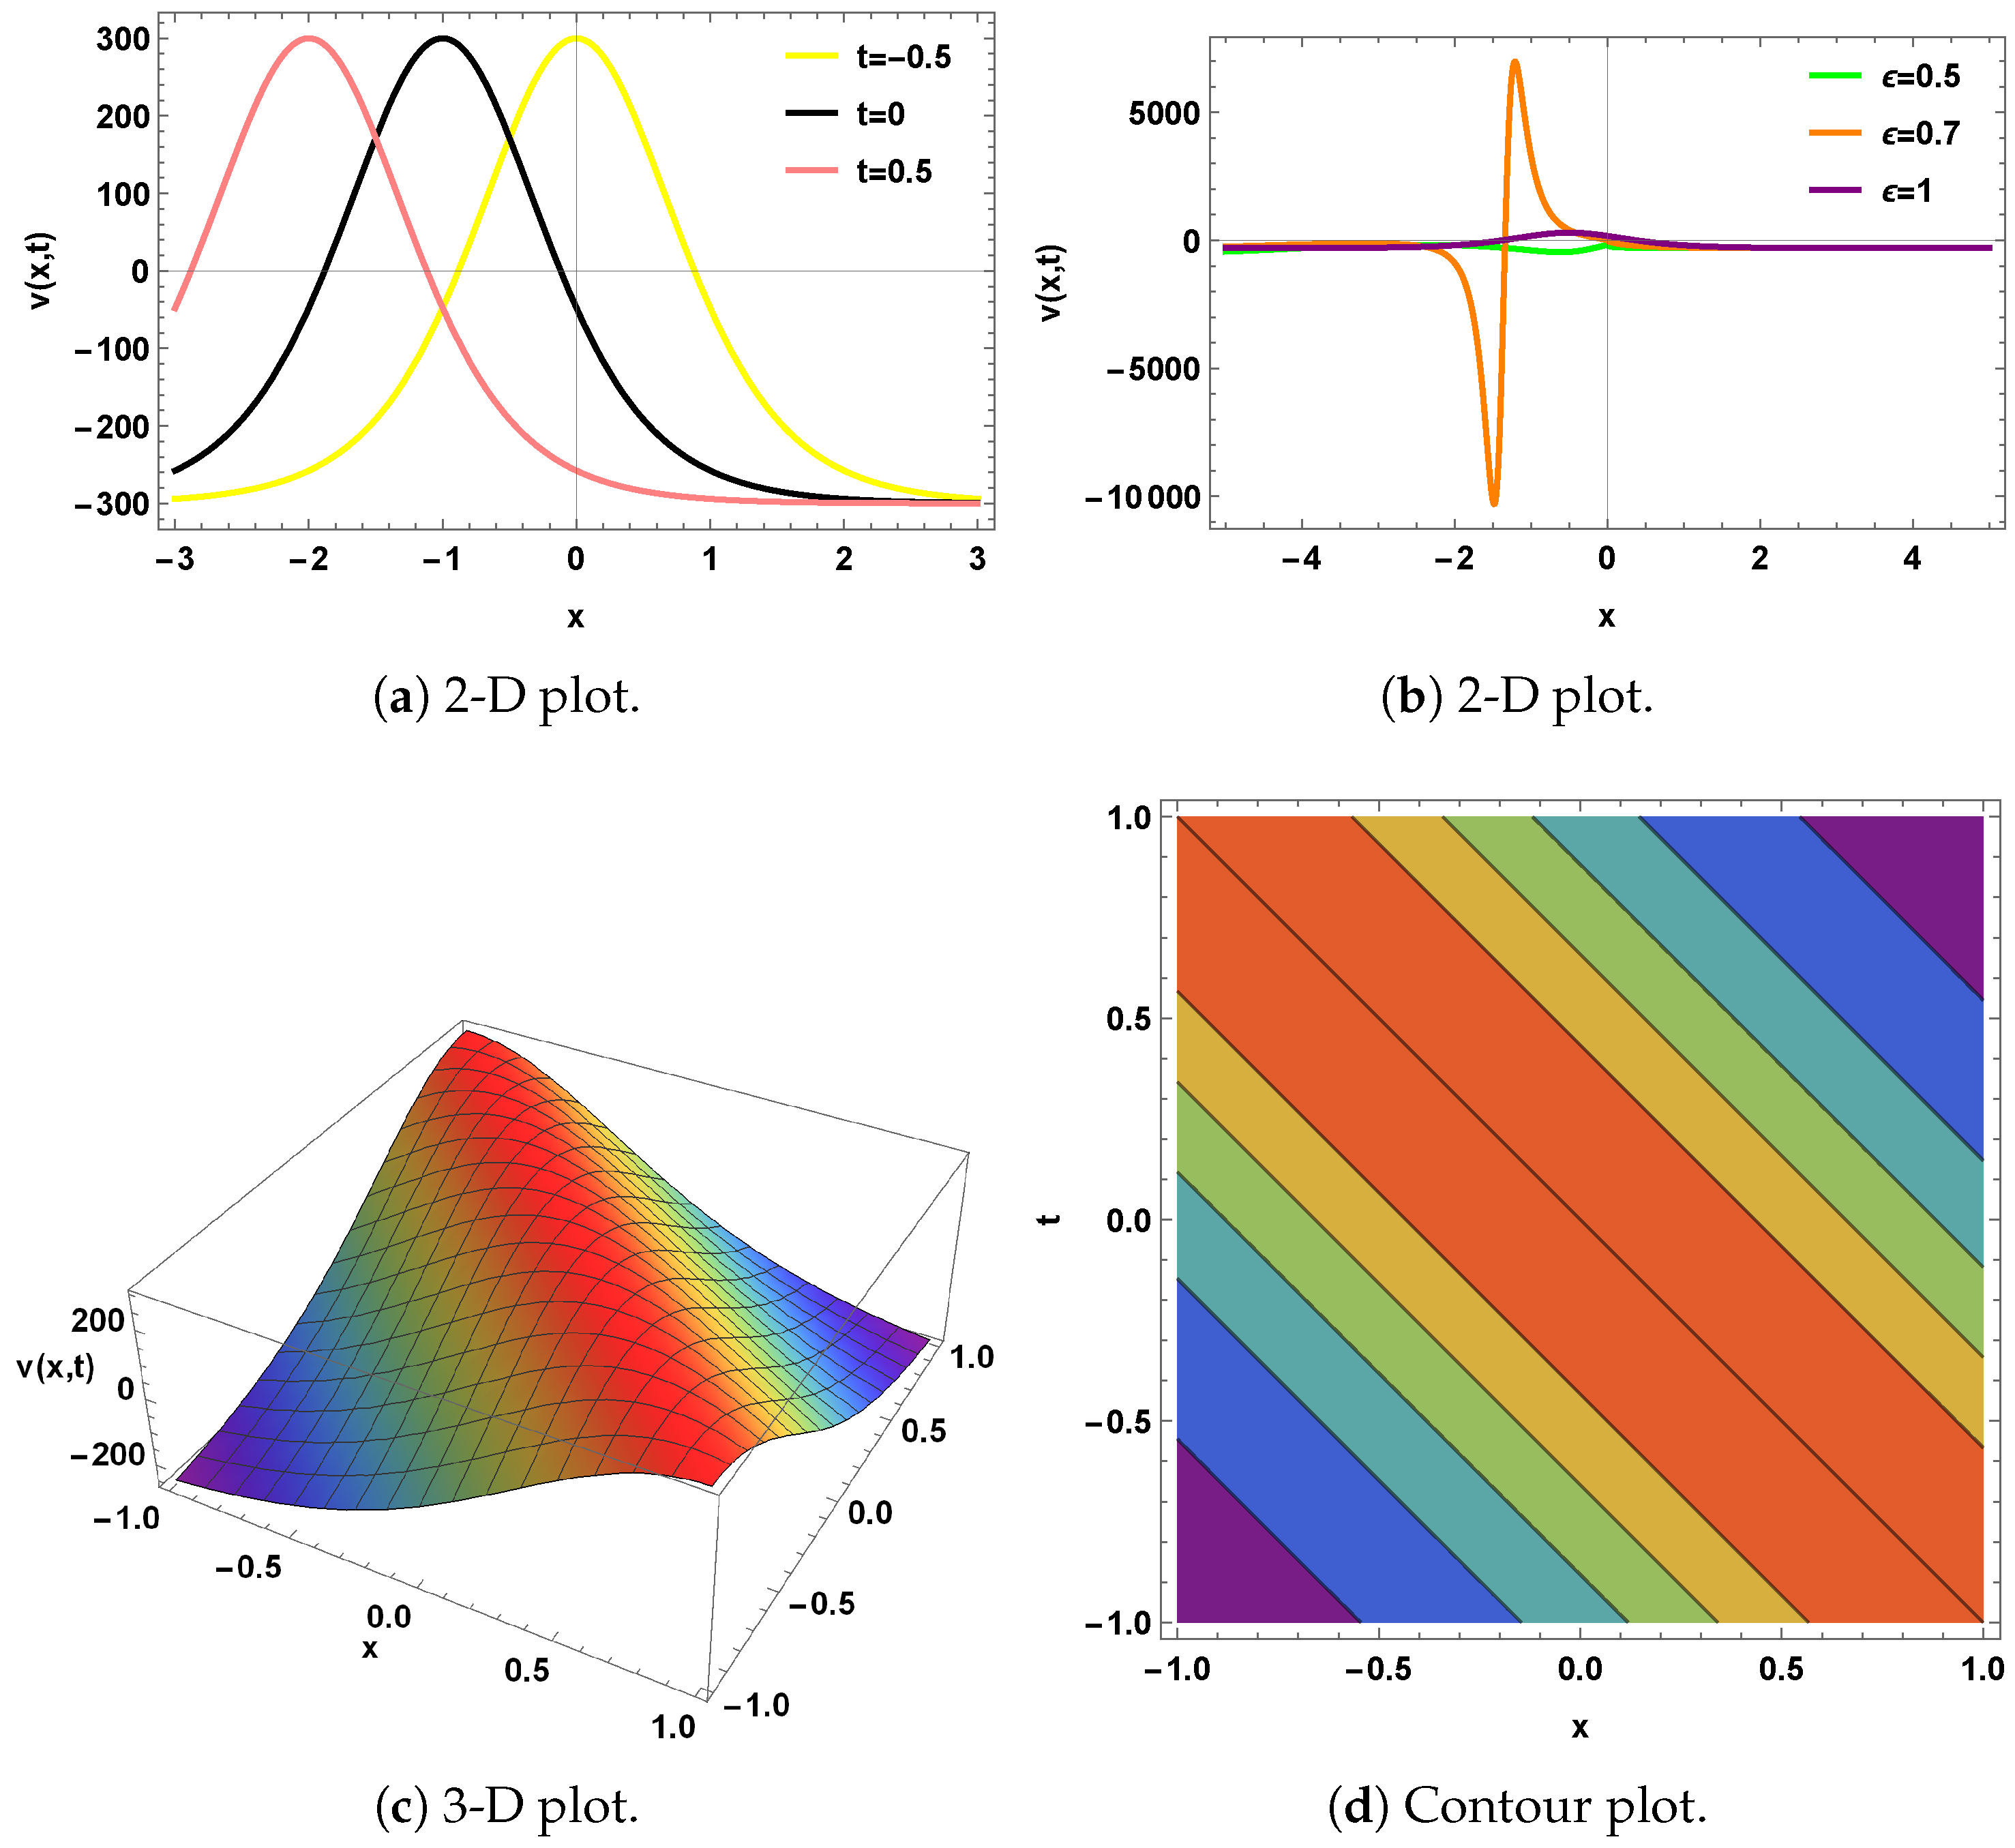
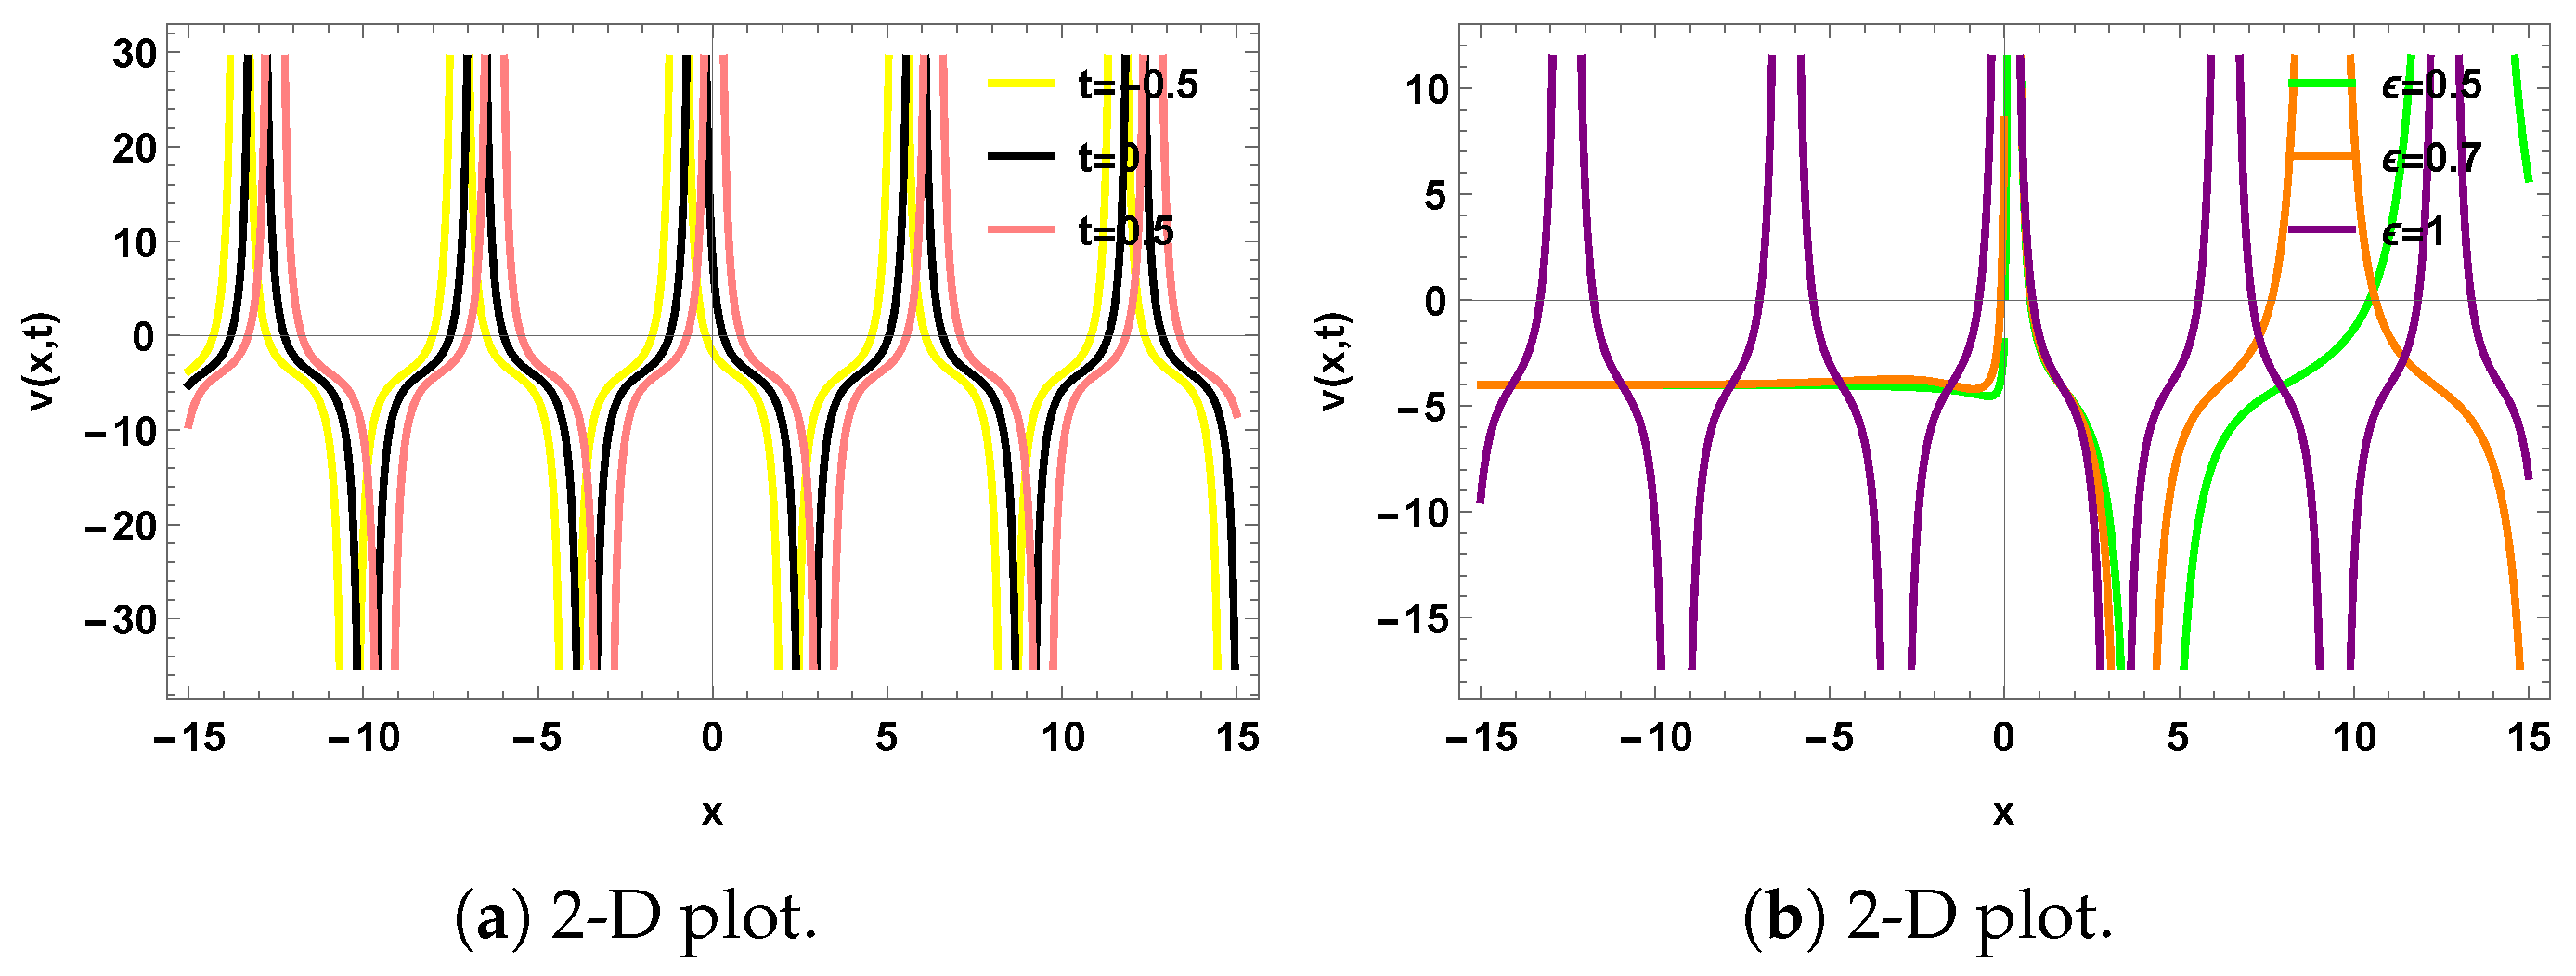
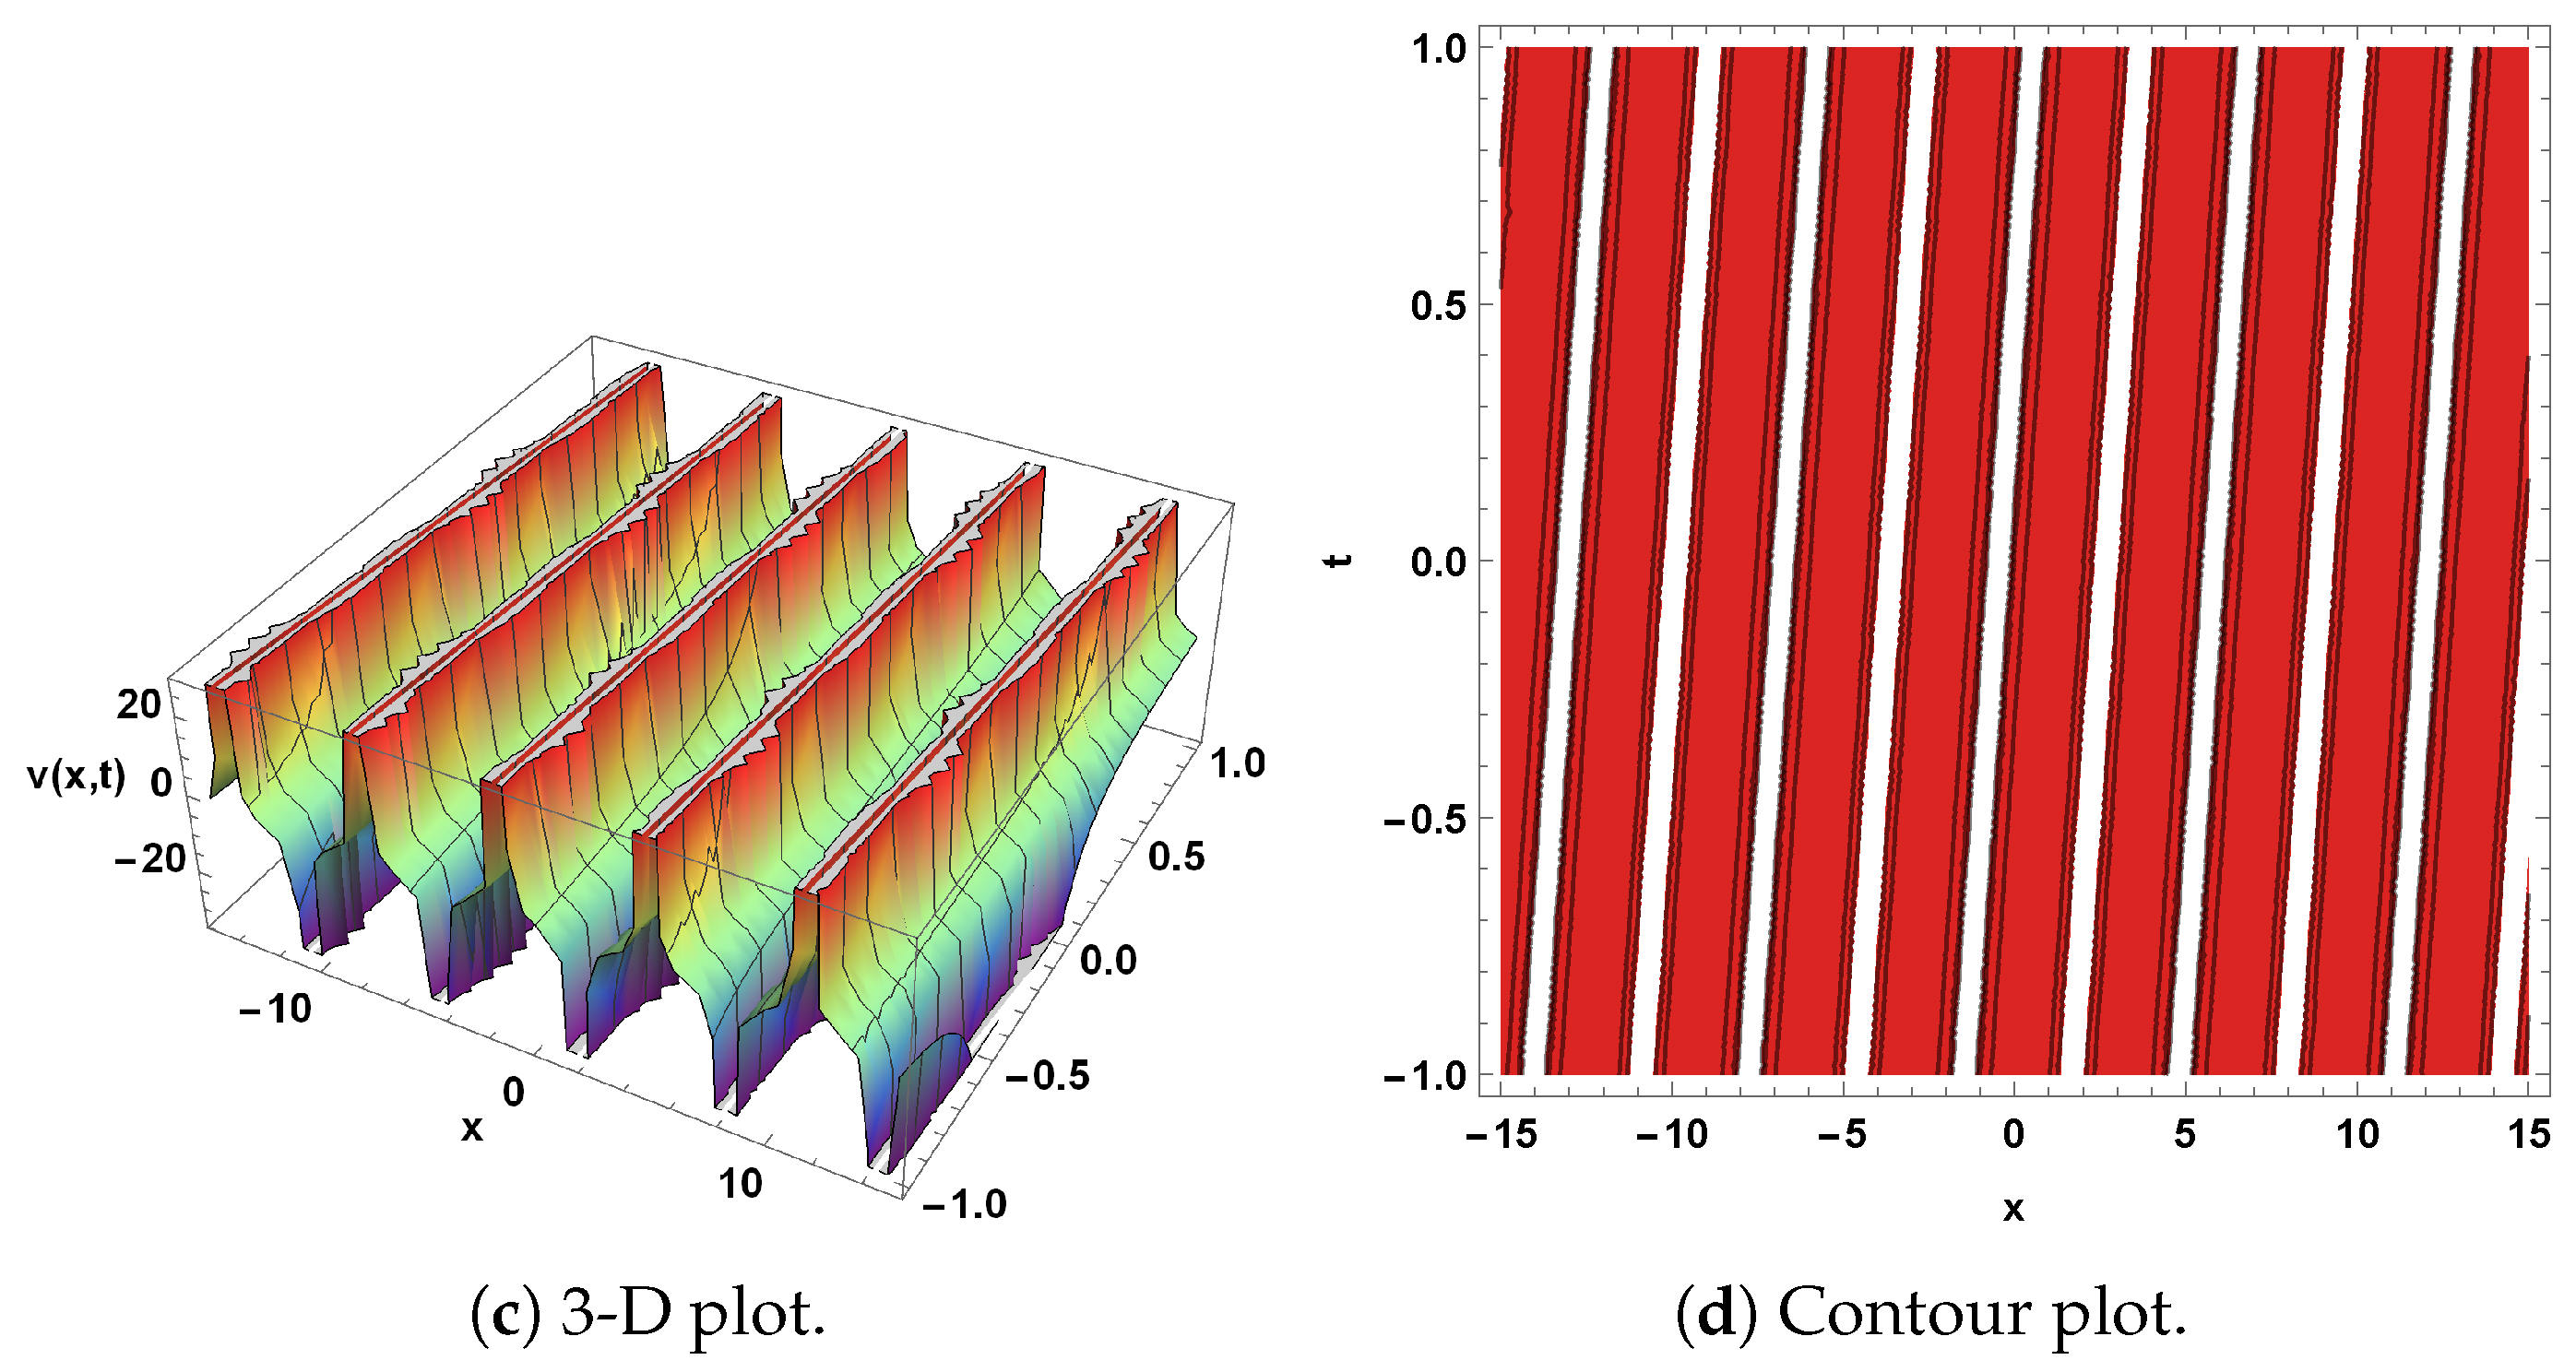
Graphical representations of the obtained solutions of the truncated M-fractional classical Lonngren wave model will be explained in this section. The authors use contour, three-dimensional, and two-dimensional plots to illustrate the results in this section. Graphs for ϵ = 0.5 , 0.7 , 1 are also used to illustrate the effect of the fractional derivative. The following graphs were drawn using Mathematica software 11.0

5. Qualitative Analysis

5.1. Stability Analysis

Stability analysis is employed to describe how the system reacts over time and how it acts in response to outside influences. To describe the stability of the governing equation in applications, stability analysis is carried out by testing some of the obtained solutions, applying the characteristics of the Hamiltonian system. The stability analysis of various models has been covered in the literature, including by [39,40].
By performing stability analysis on the classical Lonngren wave model, we can gain valuable insights into the behavior of waves in various physical systems that can ultimately lead to improved designs and applications. We consider the energy-like functional for stability
S = 1 2 v 2 d x .
Here, v ( x , t ) is the field variable and S denotes the energy-like L 2 functional. We now present a prerequisite for stable soliton solutions.
S ρ > 0 ,
Here, ρ indicates the wave speed. Substituting Equation (26) into Equation (39) yields
S = 1 2 2 2 ( ( θ + 8 ) ρ 2 1 2 κ ρ 2 6 κ coth 2 ( Γ ( 1 + ϱ ) ε ( x ε ρ t ε ) ) ) 2 d x ,
and by applying the condition described by Equation (40), one obtains
1 4 κ 2 ρ 5 ( 8 θ ρ 2 32 ρ 2 12 θ ρ 5 t csch 2 ( ρ t + 2 ) + 12 θ ρ 5 t csch 2 ( 2 ρ t ) + θ ρ 2 log ( sinh ( ρ t ) + cosh ( ρ t ) ) 2 θ ρ 2 log ( sinh ( 2 ρ t ) cosh ( 2 ρ t ) ) 24 ρ 5 t csch 2 ( ρ t + 2 ) + 24 ρ 5 t csch 2 ( 2 ρ t ) + 72 ρ 5 t coth 2 ( ρ t + 2 ) csch 2 ( ρ t + 2 ) 72 ρ 5 t coth 2 ( 2 ρ t ) csch 2 ( 2 ρ t ) + 12 ρ 3 t csch 2 ( ρ t + 2 ) 12 ρ 3 t csch 2 ( 2 ρ t ) + 24 ρ 2 coth ( ρ t + 2 ) + 24 ρ 2 coth ( 2 ρ t ) 4 ρ 2 log ( sinh ( ρ t ) + cosh ( ρ t ) ) 2 + 4 ρ 2 log ( sinh ( 2 ρ t ) cosh ( 2 ρ t ) ) log ( sinh ( ρ t ) + cosh ( ρ t ) ) 2 + log ( sinh ( 2 ρ t ) cosh ( 2 ρ t ) ) 8 ) > 0 .
Hence, Equation (26) shows the stable solution. Similarly, the stability of the other solutions can be checked.

5.2. Modulation Instability (MI) Analysis

An equation to examine a steady-state method for solving the classical Lonngren wave model is given below [41,42]:
v ( x , t ) = V ( x , t ) + τ e ι τ t .
The anstaz given in Equation (43) is used to study the stability of a continuous wave solution.
Here, τ indicates the optical normalizing power.
Substitute Equation (43) into Equation (1). By linearization, one gets
θ τ 5 / 2 + θ τ 2 2 θ ι τ V t θ V tt τ 2 V xx + V xx + 2 ι τ V xxt + V xxtt = 0 .
Supposing the solution of Equation (44) mentioned as:
V ( x , t ) = A 1 e ι ( p x q t ) + A 2 e ι ( p x q t ) .
Here, q and p are the parameters that represent the growth rate and wave number, respectively. Equation (45) is substituted into Equation (44). After solving the determinant of the coefficient matrix, the authors obtain the dispersion relation by adding the coefficients of e ι ( p x q t ) and e ι ( p x q t ) .
p 4 q 4 2 p 4 q 2 τ 2 2 p 4 q 2 + p 4 τ 4 2 p 4 τ 2 + p 4 + 2 θ p 2 q 4 6 θ p 2 q 2 τ 2 2 θ p 2 q 2 + θ 2 q 4 4 θ 2 q 2 τ 2 = 0 .
The dispersion relation can be found from Equation (46) for q, with the following results:
q = ± τ ± θ 2 τ 2 + p 4 + θ p 2 τ 2 + θ p 2 θ + p 2 .
The solution in the steady state is unstable when
θ 2 τ 2 + p 4 + θ p 2 τ 2 + θ p 2 < 0 .
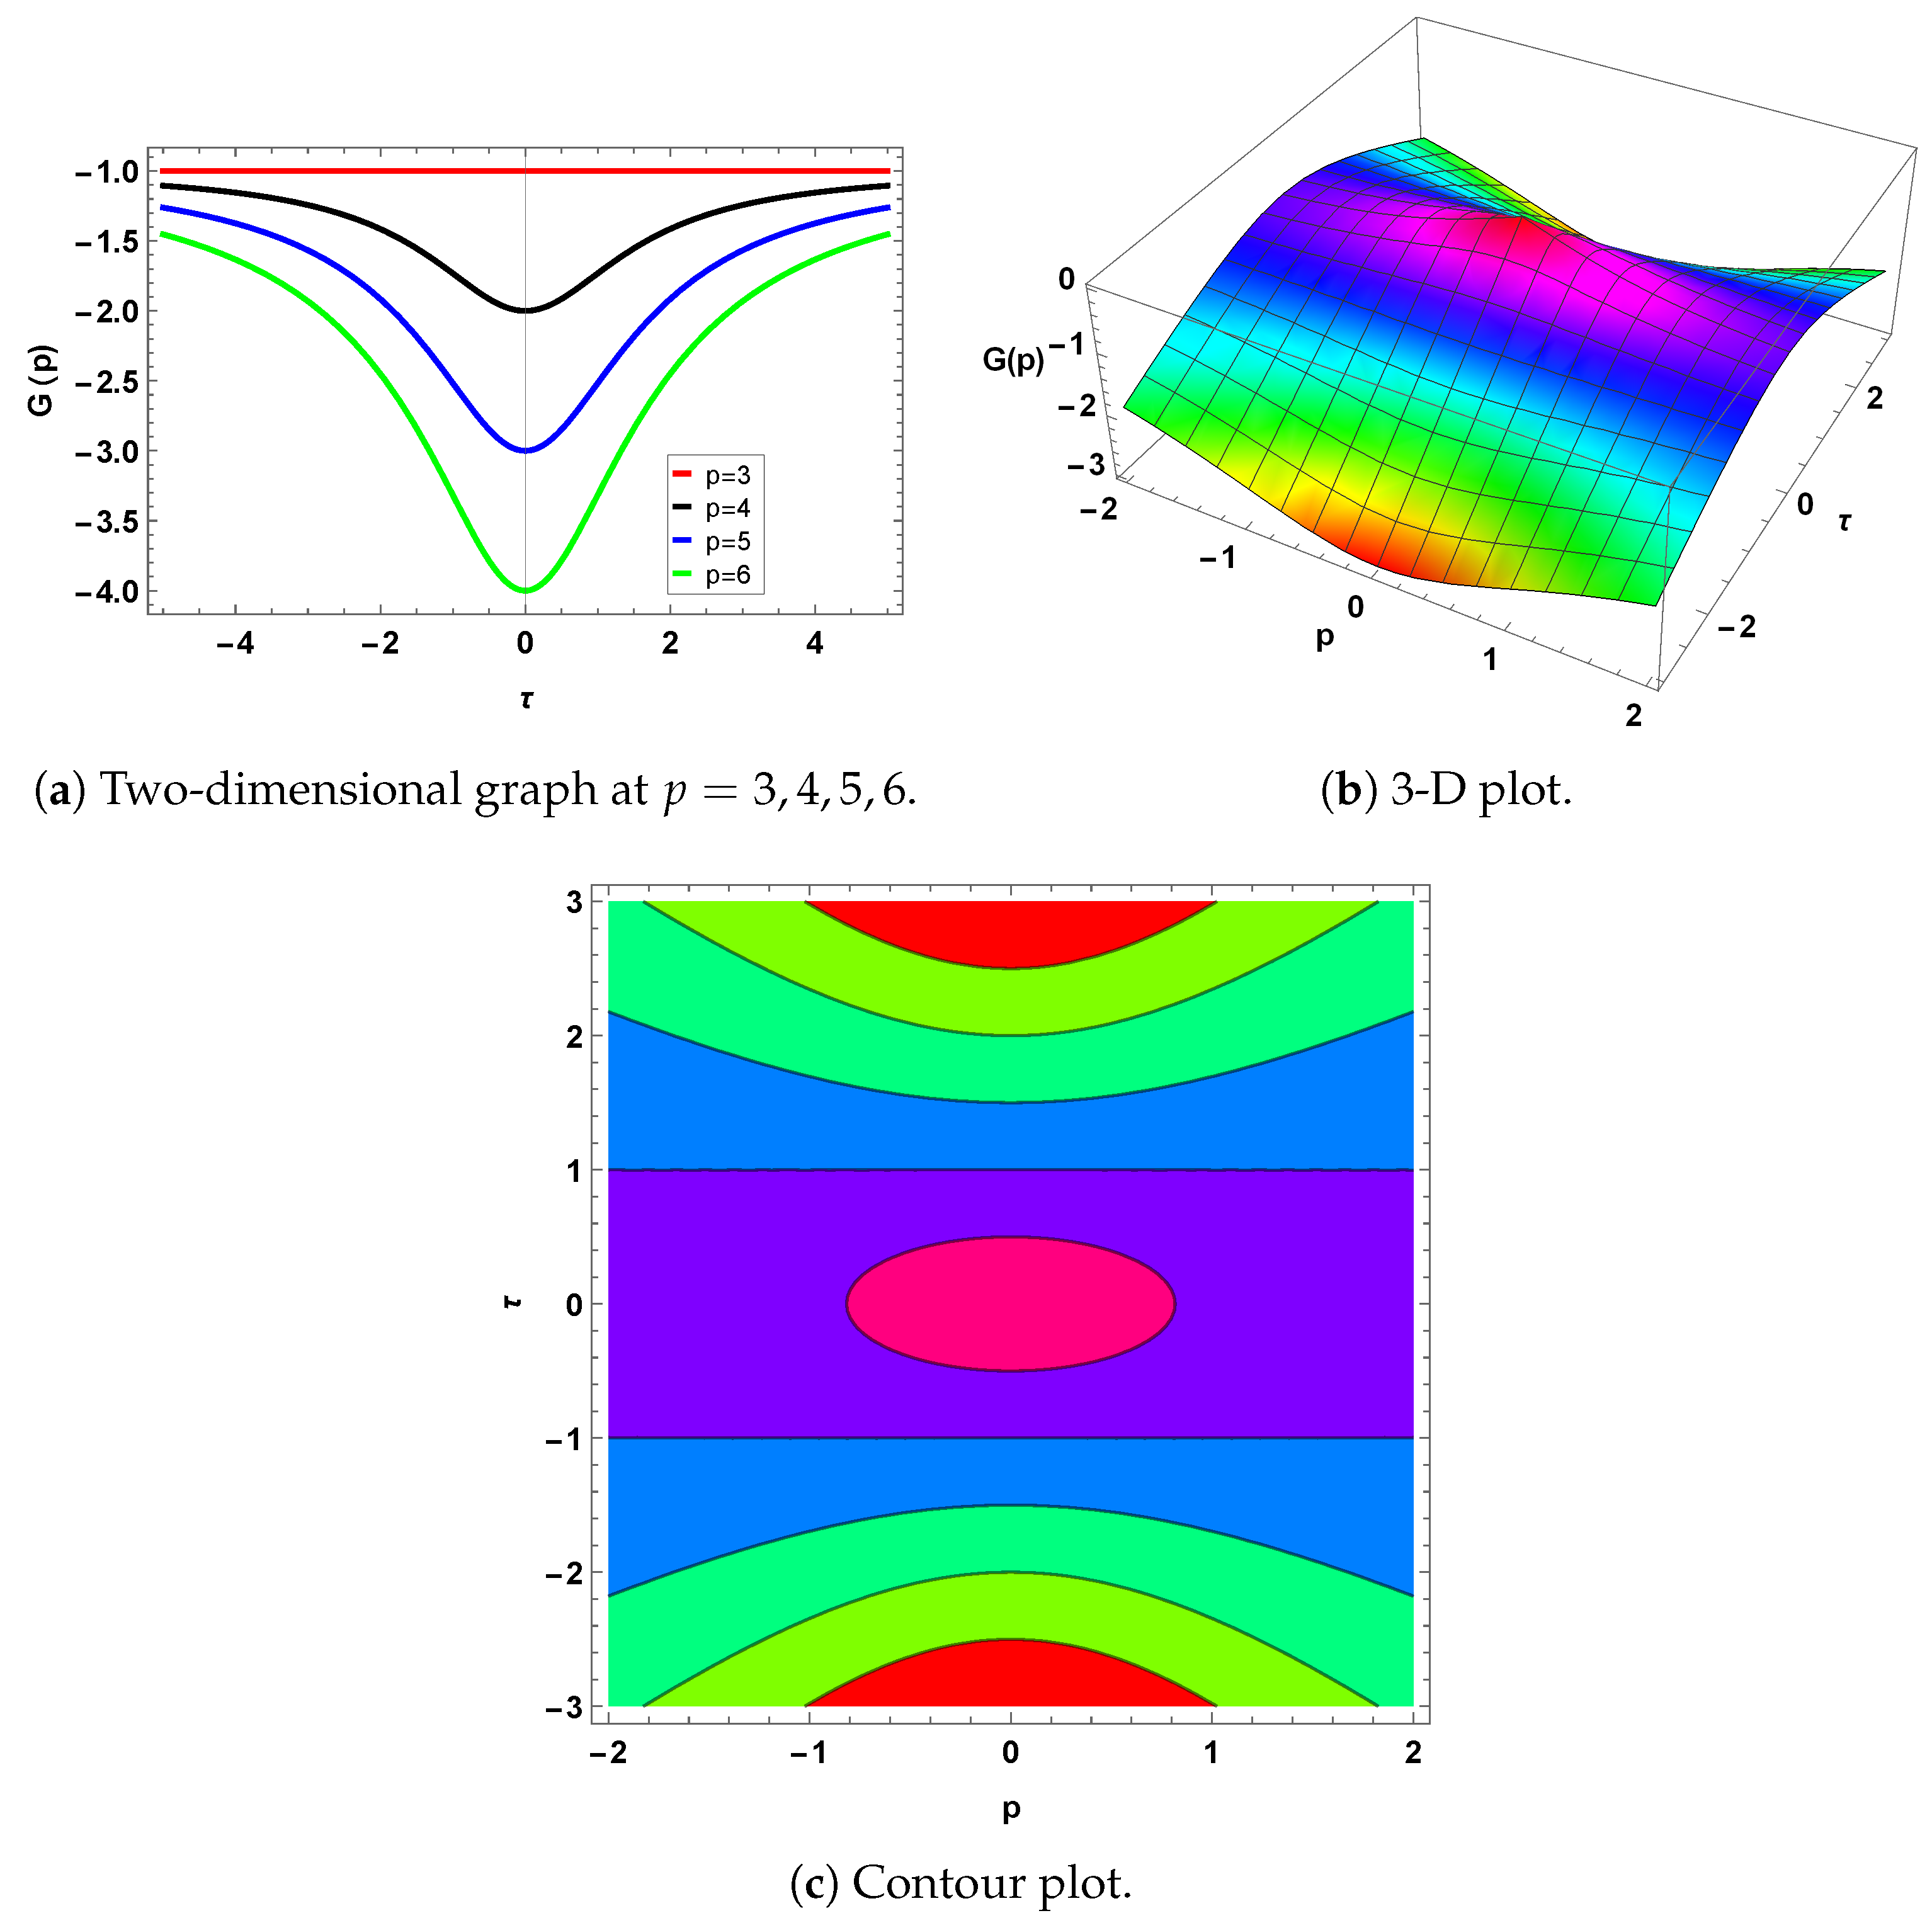
Instability arises when I m q > 0 . It is possible to obtain the modulation instability (MI) gain spectrum G ( p ) as follows:
G ( p ) = 2 I m ( q ) = ± τ ± θ 2 τ 2 + p 4 + θ p 2 τ 2 + θ p 2 θ + p 2 .

6. Conclusions

Several types of exact waves of the non-linear classical Lonngren wave model with the TMFD were presented in this paper. By utilizing the modified ( G / G 2 ) -expansion technique and the EShGEE method, the authors obtained novel types of exact solitons. The obtained results were also explained through 2D, 3D, and contour graphs, as shown in Figure 1, Figure 2, Figure 3, Figure 4, Figure 5, Figure 6 and Figure 7. To ensure that the obtained solutions were stable, stability analysis was carried out. Modulation instability was also checked and explained through Figure 8. The obtained results may be useful in various fields, including fluid dynamics, plasma physics, soliton physics, etc. In the future, bifurcation analysis and sensitivity analysis, as well as analysis of quasi-periodic, periodic, and chaotic behavior can be studied for the concerned model. Moreover, the obtained soliton solutions can be compared with the numerical solutions of the governing model in the future.

Author Contributions

H.Q.: Writing—review and editing, Conceptualization, Methodology, Project administration; A.K.A.: Funding, Conceptualization, Methodology, Formal Analysis; Supervision. All authors have read and agreed to the published version of the manuscript.

Funding

This work was supported by the Deanship of Scientific Research, Vice Presidency for Graduate Studies and Scientific Research, King Faisal University, Saudi Arabia [Grant No. KFU253149].

Data Availability Statement

The original contributions presented in this study are included in the article. Further inquiries can be directed to the corresponding author.

Conflicts of Interest

The authors declare no conflicts of interest.

References

  1. Ahmad, J.; Akram, S.; Rehman, S.U.; Turki, N.B.; Shah, N.A. Description of Soliton and Lump Solutions to M-Truncated Stochastic Biswas–Arshed Model in Optical Communication. Results Phys. 2024, 51, 106719. [Google Scholar] [CrossRef]
  2. Qawaqneh, H.; Manafian, J.; Alharthi, M.; Alrashedi, Y. Stability Analysis, Modulation Instability, and Beta-Time Fractional Exact Soliton Solutions to the Van der Waals Equation. Mathematics 2024, 12, 2144. [Google Scholar] [CrossRef]
  3. Batiha, I.M.; Njadat, S.A.; Batyha, R.M.; Zraiqat, A.; Dababneh, A.; Momani, S. Design Fractional-Order PID Controllers for Single-Joint Robot Arm Model. Int. J. Adv. Soft Comput. Appl. 2022, 14, 96–114. [Google Scholar] [CrossRef]
  4. Liu, C. The Traveling Wave Solution and Dynamics Analysis of the Fractional Order Generalized Pochhammer–Chree Equation. AIMS Math. 2024, 9, 33956–33972. [Google Scholar] [CrossRef]
  5. Qawaqneh, H.; Jari, H.A.; Altalbe, A.; Bekir, A. Stability Analysis, Modulation Instability, and the Analytical Wave Solitons to the Fractional Boussinesq-Burgers System. Phys. Scr. 2024, 99, 125235. [Google Scholar] [CrossRef]
  6. Judeh, D.A.; Hammad, M.A. Applications of Conformable Fractional Pareto Probability Distribution. Int. J. Adv. Soft Comput. Appl. 2022, 14, 115–124. [Google Scholar]
  7. Mohammed, W.W.; Cesarano, C.; Iqbal, N.; Sidaoui, R.; Ali, E.E. The Exact Solutions for the Fractional Riemann Wave Equation in Quantum Mechanics and Optics. Phys. Scr. 2024, 99, 085245. [Google Scholar] [CrossRef]
  8. Chahlaoui, Y.; Ali, A.; Ahmad, J.; Javed, S. Dynamical Behavior of Chaos, Bifurcation Analysis and Soliton Solutions to a Konno-Onno Model. PLoS ONE 2023, 18, e0291197. [Google Scholar] [CrossRef]
  9. Mehdi, K.B.; Mehdi, Z.; Samreen, S.; Siddique, I.; Elmandouh, A.A.; Elbrolosy, M.E.; Osman, M.S. Novel Exact Traveling Wave Solutions of the Space-Time Fractional Sharma–Tasso–Olver Equation via Three Reliable Methods. Partial Differ. Equ. Appl. Math. 2024, 11, 100784. [Google Scholar] [CrossRef]
  10. Ahmed, S.; Jahan, S.; Nisar, K.S. Haar Wavelet Based Numerical Technique for the Solutions of Fractional Advection Diffusion Equations. J. Math. Comput. Sci. 2024, 34, 217–233. [Google Scholar] [CrossRef]
  11. Altaf, S.; Alderremy, A.A.; Mahmoud, E.E. Exact Wave Solutions of Truncated M-Fractional Boussinesq-Burgers System via an Effective Method. Phys. Scr. 2024, 99, 095263. [Google Scholar]
  12. Akram, S.; Ahmad, J.; Rehman, S.U.; Younas, T. Stability Analysis and Dispersive Optical Solitons of Fractional Schrödinger–Hirota Equation. Opt. Quantum Electron. 2023, 55, 664. [Google Scholar] [CrossRef]
  13. Qawaqneh, H.; Zafar, A.; Raheel, M.; Zaagan, A.A.; Zahran, E.H.; Cevikel, A.; Bekir, A. New Soliton Solutions of M-Fractional Westervelt Model in Ultrasound Imaging via Two Analytical Techniques. Opt. Quantum Electron. 2024, 56, 737. [Google Scholar] [CrossRef]
  14. Mahmood, T.; Alhawael, G.; Akram, S.; Rahman, M.U. Exploring the Lie Symmetries, Conservation Laws, Bifurcation Analysis and Dynamical Waveform Patterns of Diverse Exact Solution to the Klein–Gordon Equation. Opt. Quantum Electron. 2024, 56, 1978. [Google Scholar] [CrossRef]
  15. Al Oweidi, K.F.; Aal-Rkhais, H.A. Existence Results for a Nonlinear Degenerate Parabolic Equation Involving p-Laplacian Type Diffusion Process. Iraqi J. Sci. 2024, 65, 5081–5094. [Google Scholar] [CrossRef]
  16. Akram, S.; Ahmad, J.; Alkarni, S.; Shah, N.A. Exploration of Solitary Wave Solutions of Highly Nonlinear KDV–KP Equation Arise in Water Wave and Stability Analysis. Results Phys. 2023, 54, 107054. [Google Scholar] [CrossRef]
  17. Alqahtani, A.; Akram, S.; Alosaimi, M. Study of Bifurcations, Chaotic Structures with Sensitivity Analysis and Novel Soliton Solutions of Non-Linear Dynamical Model. J. Taibah Univ. Sci. 2024, 18, 2399870. [Google Scholar] [CrossRef]
  18. Luo, M.; Qiu, W.; Nikan, O.; Avazzadeh, Z. Second-Order Accurate, Robust and Efficient ADI Galerkin Technique for the Three-Dimensional Nonlocal Heat Model Arising in Viscoelasticity. Appl. Math. Comput. 2023, 440, 127655. [Google Scholar] [CrossRef]
  19. Aal-Rkhais, H.A.; Kamil, A.H.; Al Oweidi, K.F. The Approximation of Weighted Hölder Functions by Fourier-Jacobi Polynomials to the Singular Sturm-Liouville Operator. Baghdad Sci. J. 2022, 19, 2636. [Google Scholar] [CrossRef]
  20. El-Shorbagy, M.A.; Akram, S.; Rahman, M.U.; Nabwey, H.A. Analysis of Bifurcation, Chaotic Structures, Lump and M-W-Shape Soliton Solutions to (2+1) Complex Modified Korteweg-de-Vries System. AIMS Math. 2024, 9, 16116–16145. [Google Scholar] [CrossRef]
  21. Lephoko, M.Y.T.; Khalique, C.M. A Study of the Exact Solutions and Conservation Laws of the Classical Lonngren Wave Equation for Communication Signals. Malays. J. Math. Sci. 2024, 18, 209–226. [Google Scholar] [CrossRef]
  22. Lonngren, K.E.; Hsuan, H.C.S.; Ames, W.F. On the Soliton, Invariant, and Shock Solutions of a Fourth-Order Nonlinear Equation. J. Math. Anal. Appl. 1975, 52, 538–545. [Google Scholar] [CrossRef]
  23. Baskonus, H.M.; Bulut, H.; Sulaiman, T.A. New Complex Hyperbolic Structures to the Lonngren-Wave Equation by Using Sine-Gordon Expansion Method. Appl. Math. Nonlinear Sci. 2019, 4, 129–138. [Google Scholar] [CrossRef]
  24. Yokuş, A. Simulation of Bright–Dark Soliton Solutions of the Lonngren Wave Equation Arising the Model of Transmission Lines. Mod. Phys. Lett. B 2021, 35, 2150484. [Google Scholar] [CrossRef]
  25. Duran, S. Travelling Wave Solutions and Simulation of the Lonngren Wave Equation for Tunnel Diode. Opt. Quantum Electron. 2021, 53, 458. [Google Scholar] [CrossRef]
  26. Hussain, A.; Usman, M.; Zaman, F.D.; Almalki, Y. Lie Group Analysis for Obtaining the Abundant Group Invariant Solutions and Dynamics of Solitons for the Lonngren-Wave Equation. Chin. J. Phys. 2023, 86, 447–457. [Google Scholar] [CrossRef]
  27. Zafar, A.; Bekir, A.; Raheel, M.; Razzaq, W. Optical Soliton Solutions to Biswas–Arshed Model with Truncated M-Fractional Derivative. Optik 2020, 222, 165355. [Google Scholar] [CrossRef]
  28. Seadawy, A.R.; Kumar, D.; Chakrabarty, A.K. Dispersive Optical Soliton Solutions for the Hyperbolic and Cubic-Quintic Nonlinear Schrödinger Equations via the Extended Sinh-Gordon Equation Expansion Method. Eur. Phys. J. Plus 2018, 133, 182. [Google Scholar] [CrossRef]
  29. Bezgabadi, A.S.; Bolorizadeh, M.A. Analytic Combined Bright-Dark, Bright and Dark Solitons Solutions of Generalized Nonlinear Schrödinger Equation Using Extended Sinh-Gordon Equation Expansion Method. Results Phys. 2021, 30, 104852. [Google Scholar] [CrossRef]
  30. Kumar, D.; Manafian, J.; Hawlader, F.; Ranjbaran, A. New Closed Form Soliton and Other Solutions of the Kundu–Eckhaus Equation via the Extended Sinh-Gordon Equation Expansion Method. Optik 2018, 160, 159–167. [Google Scholar] [CrossRef]
  31. Behera, S.; Behera, D. Nonlinear Wave Dynamics of (1+1)-Dimensional Conformable Coupled Nonlinear Higgs Equation Using Modified (G′/G2)-Expansion Method. Phys. Scr. 2025; in press. [Google Scholar]
  32. Saboor, A.; Shakeel, M.; Liu, X.; Zafar, A.; Ashraf, M. A Comparative Study of Two Fractional Nonlinear Optical Model via Modified (G′/G2)-Expansion Method. Opt. Quantum Electron. 2024, 56, 259. [Google Scholar] [CrossRef]
  33. Aljahdaly, N.H. Some Applications of the Modified (G′/G2)-Expansion Method in Mathematical Physics. Results Phys. 2019, 13, 102272. [Google Scholar] [CrossRef]
  34. Sulaiman, T.A.; Yel, G.; Bulut, H. M-Fractional Solitons and Periodic Wave Solutions to the Hirota-Maccari System. Mod. Phys. Lett. B 2019, 33, 1950052. [Google Scholar] [CrossRef]
  35. Sousa, J.V.D.A.C.; Oliveira, E.C.D. A New Truncated M-Fractional Derivative Type Unifying Some Fractional Derivative Types with Classical Properties. Int. J. Anal. Appl. 2018, 16, 83–96. [Google Scholar] [CrossRef]
  36. Lu, J. New Exact Solutions for Kudryashov–Sinelshchikov Equation. Adv. Differ. Equ. 2018, 2018, 374. [Google Scholar] [CrossRef]
  37. Yang, X.L.; Tang, J.S. Travelling wave solutions for Konopelchenko-Dubrovsky equation using an extended sinh-Gordon equation expansion method. Commun. Theor. Phys. 2008, 50, 1047. [Google Scholar]
  38. Zhang, Y.; Zhang, L.; Pang, J. Application of (G′/G2) Expansion Method for Solving Schrödinger’s Equation with Three-Order Dispersion. Adv. Appl. Math. 2017, 6, 212–217. [Google Scholar] [CrossRef]
  39. Qawaqneh, H.; Alrashedi, Y. Mathematical and Physical Analysis of Fractional Estevez–Mansfield–Clarkson Equation. Fractal Fract. 2024, 8, 467. [Google Scholar] [CrossRef]
  40. Tariq, K.U.; Wazwaz, A.-M.; Javed, R. Construction of Different Wave Structures, Stability Analysis and Modulation Instability of the Coupled Nonlinear Drinfel’d–Sokolov–Wilson Model. Chaos Solitons Fractals 2023, 166, 112903. [Google Scholar] [CrossRef]
  41. Rehman, S.U.; Ahmad, J. Modulation Instability Analysis and Optical Solitons in Birefringent Fibers to RKL Equation without Four Wave Mixing. Alex. Eng. J. 2021, 60, 1339–1354. [Google Scholar] [CrossRef]
  42. Qawaqneh, H.; Manafian, J.; Alsubaie, A.S.; Ahmad, H. Investigation of Exact Solitons to the Quartic Rosenau-Kawahara-Regularized-Long-Wave Fluid Model with Fractional Derivative and Qualitative Analysis. Phys. Scr. 2024, 100, 015270. [Google Scholar] [CrossRef]
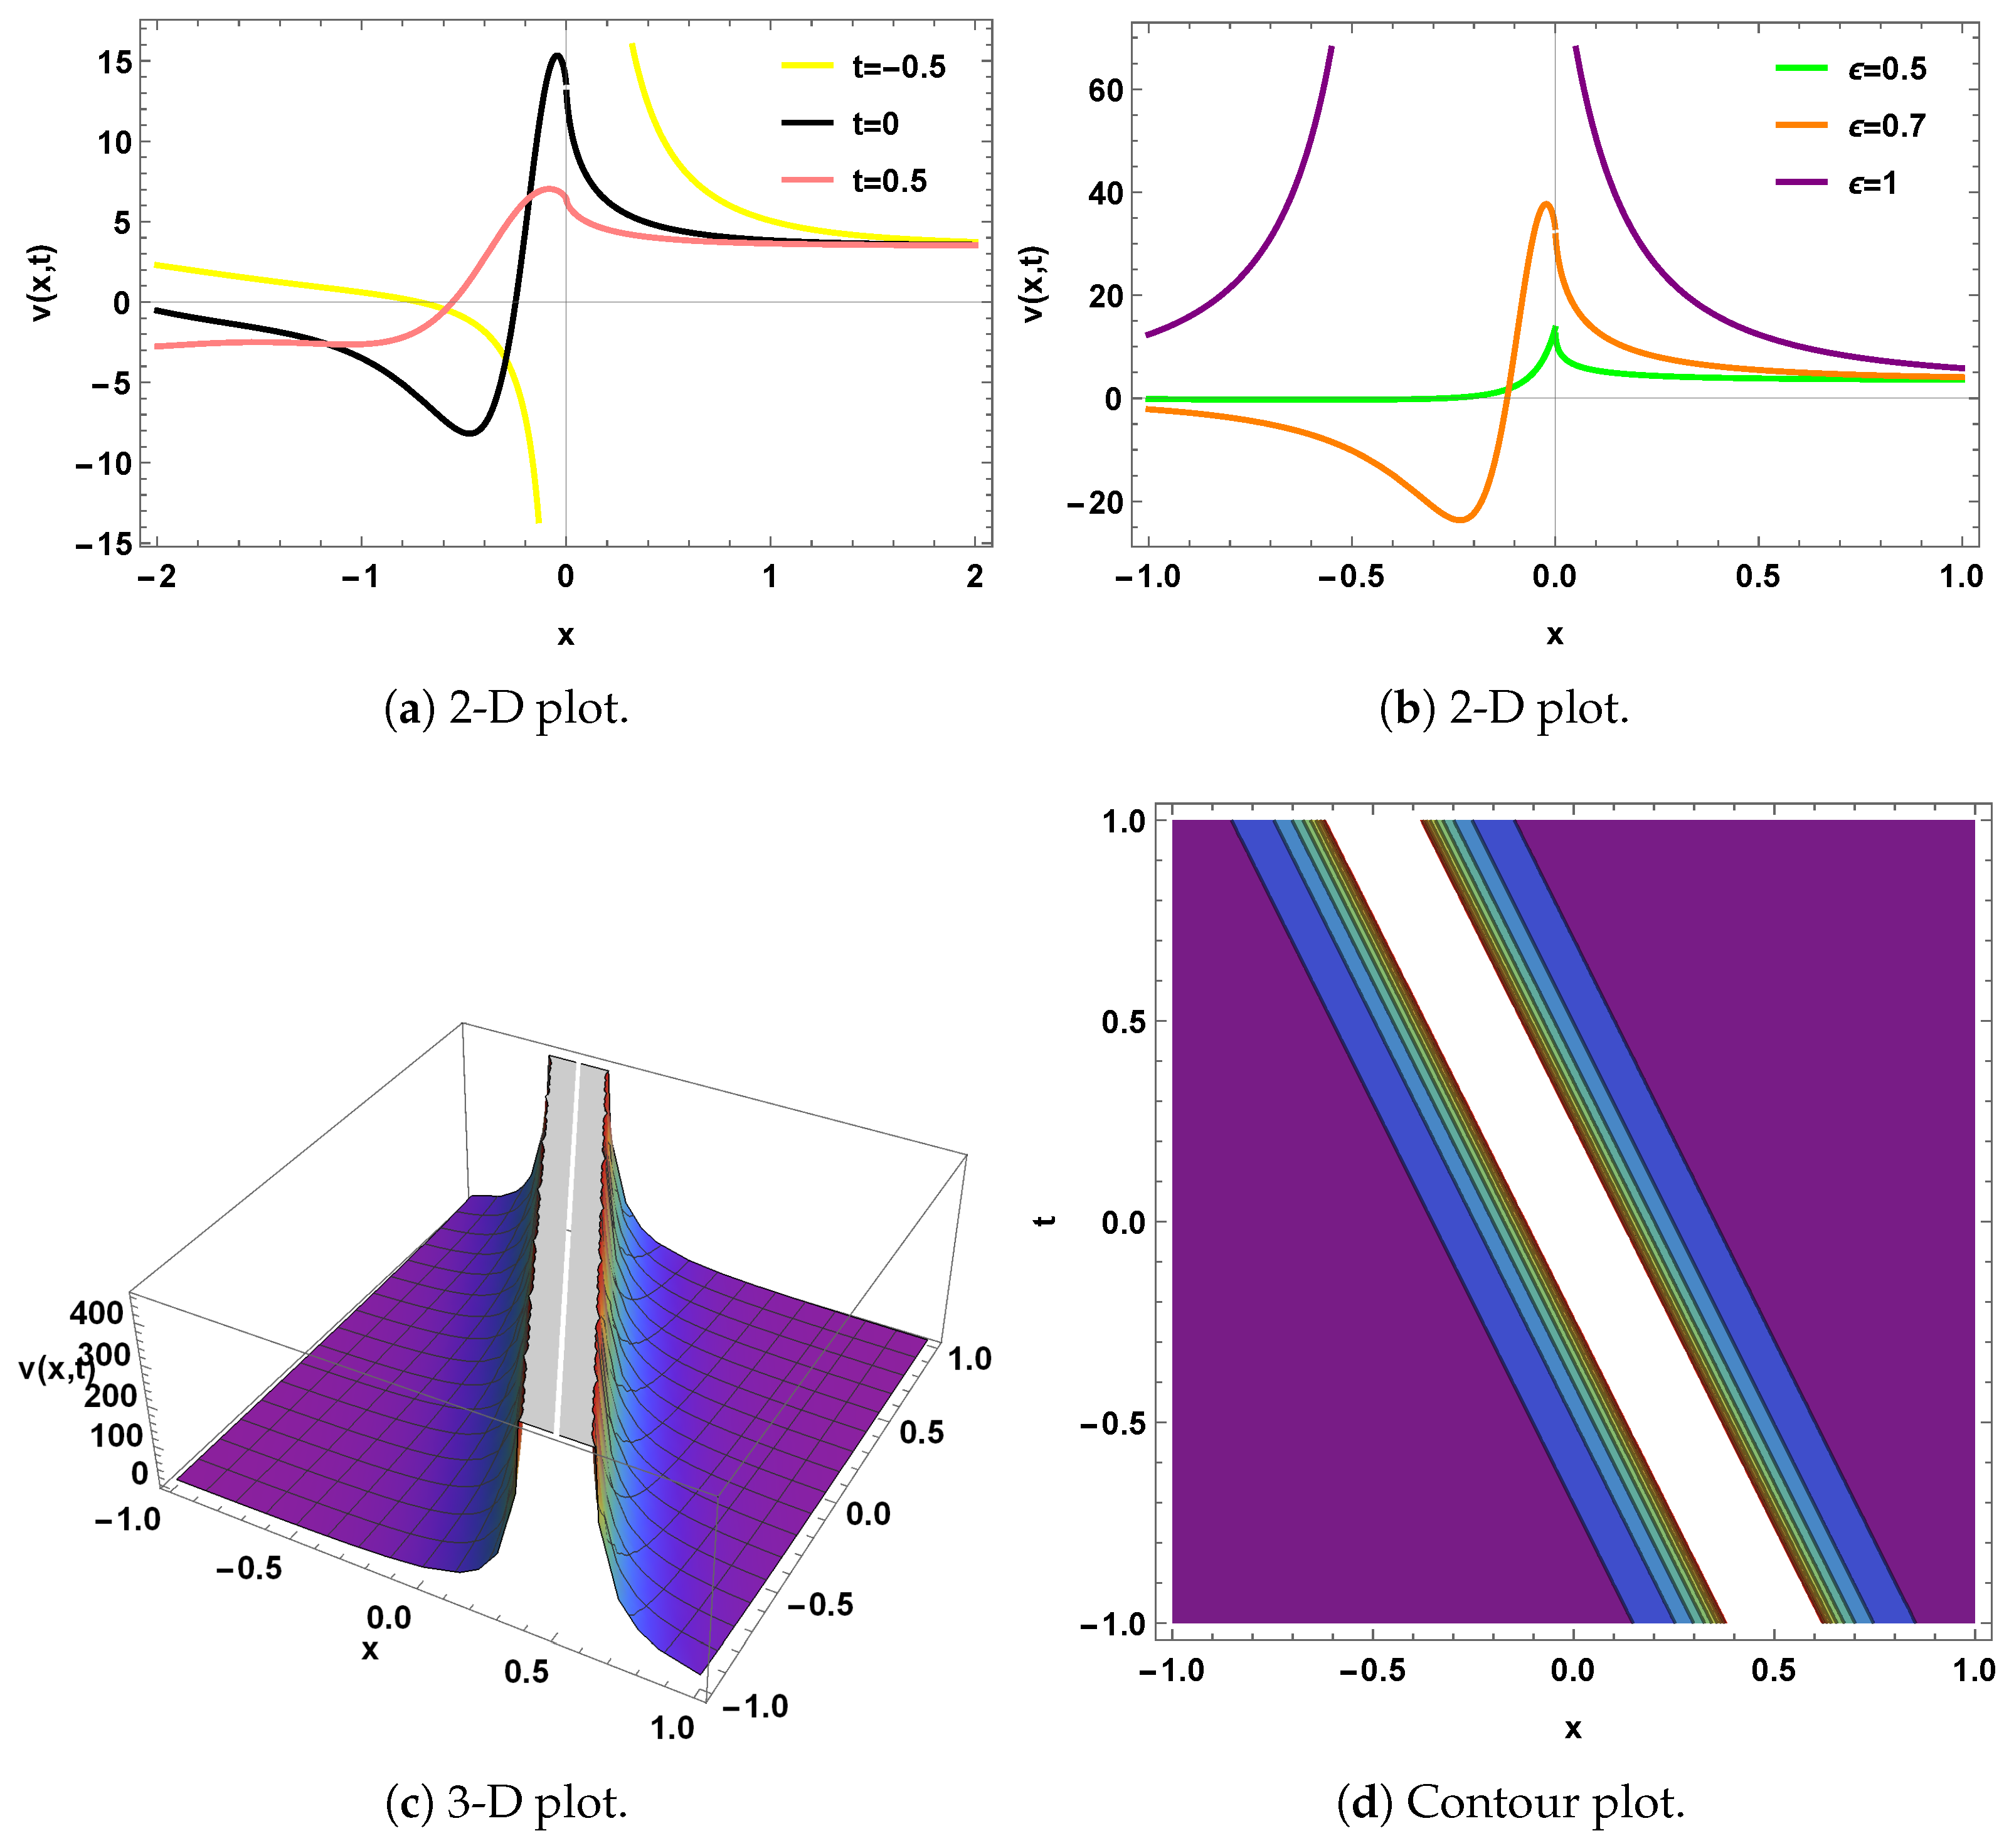
Figure 1. Graphs of v ( x , t ) for Equation (26) for θ = 1 , ρ = 0.5 , κ = 1 , and ϱ = 1 . (a) is the two-dimensional plot if 2 < x < 2 and ε = 0.7 ; the yellow shape represents values if t = 0.5 ; the black shape represents values if t = 0 ; the pink shape represents values if t = 0.5 . (b) is the two-dimensional plot if 1 < x < 1 and t = 0.5 ; the green shape represents values if ϵ = 0.5 ; the orange shape represents values if ϵ = 0.7 ; the purple shape represents values if ϵ = 1 . (c) is a 3-D graph for 1 < x < 1 and ϵ = 1 with 1 < t < 1 . (d) represents the contour graph when 1 < x < 1 and ϵ = 1 for t ( 1 , 1 ) .
Mathematics 13 03107 g001
Figure 2. Graph of v ( x , t ) in Equation (27) for θ = 1 , ρ = 1 , κ = 1 , and ϱ = 1 . (a) is the two-dimensional plot if 5 < x < 5 and ε = 1 ; the yellow shape represents values if t = 0.5 ; the black shape represents values if t = 0 ; the pink shape represents values if t = 0.5 . (b) is the two-dimensional plot if 5 < x < 5 and t = 0.5 ; the green shape represents values if ϵ = 0.5 ; the orange shape represents values if ϵ = 0.7 ; the purple shape represents values if ϵ = 1 . (c) is a 3-D graph for 1 < x < 1 and ϵ = 1 with 1 < t < 1 . (d) represents the contour graph when 1 < x < 1 and ϵ = 1 for t ( 1 , 1 ) .
Mathematics 13 03107 g002
Figure 3. Graph for v ( x , t ) is denoted through Equation (32) for; θ = 0.01 , ρ = 1 , κ = 1 , and ϱ = 1 . (a) is the two-dimensional plot if 3 < x < 3 and ε = 1 ; the yellow shape represents values if t = 0.5 ; the black shape represents values if t = 0 ; the pink shape represents values if t = 0.5 . (b) is the two-dimensional plot if 5 < x < 5 and t = 0.5 ; the green shape represents values if ϵ = 0.5 ; the orange shape represents values if ϵ = 0.7 ; the purple shape represents values if ϵ = 1 . (c) is a 3-D graph for 5 < x < 5 and ϵ = 1 with 1 < t < 1 . (d) represents the contour graph when 1 < x < 1 and ϵ = 1 for t ( 1 , 1 ) .
Mathematics 13 03107 g003aMathematics 13 03107 g003b
Figure 4. Graph for v ( x , t ) is denoted through Equation (33) for; θ = 1 , ρ = 1 , κ = 0.01 , and ϱ = 1 . (a) is the two-dimensional plot if 3 < x < 3 and ε = 1 ; the yellow shape represents values if t = 0.5 ; the black shape represents values if t = 0 ; the pink shape represents values if t = 0.5 . (b) is the two-dimensional plot if 5 < x < 5 and t = 0.5 ; the green shape represents values if ϵ = 0.5 ; the orange shape represents values if ϵ = 0.7 ; the purple shape represents values if ϵ = 1 . (c) is a 3-D graph for 1 < x < 1 and ϵ = 1 with 1 < t < 1 . (d) represents the contour graph when 1 < x < 1 and ϵ = 1 for t ( 1 , 1 ) .
Mathematics 13 03107 g004
Figure 5. A graph of v ( x , t ) in Equation (36) for θ = 1 , ρ = 1 , κ = 1 , a = 1 , b = 1 , C 1 = 0.005 , C 2 = 0.1 , and ϱ = 1 . (a) is the two-dimensional plot if 3 < x < 3 and ε = 1 ; the yellow shape represents values if t = 0.5 ; the black shape represents values if t = 0 ; the pink shape represents values if t = 0.5 . (b) is the two-dimensional plot if 5 < x < 5 and t = 0.5 ; the green shape represents values if ϵ = 0.5 ; the orange shape represents values if ϵ = 0.7 ; the purple shape represents values if ϵ = 1 . (c) is a 3-D graph for 1 < x < 1 and ϵ = 1 with 1 < t < 1 . (d) represents the contour graph when 1 < x < 1 and ϵ = 1 for t ( 1 , 1 ) .
Mathematics 13 03107 g005
Figure 6. A graph of v ( x , t ) in Equation (37) for θ = 1 , ρ = 1 , κ = 1 , a = 1 , b = 1 , C 1 = 2 , C 2 = 1 , and ϱ = 1 . (a) is the two-dimensional plot if 15 < x < 15 and ε = 1 ; the yellow shape represents values if t = 0.5 ; the black shape represents values if t = 0 ; the pink shape represents values if t = 0.5 . (b) is the two-dimensional plot if 15 < x < 15 and t = 0.5 ; the green shape represents values if ϵ = 0.5 ; the orange shape represents values if ϵ = 0.7 ; the purple shape represents values if ϵ = 1 . (c) is a 3-D graph for 15 < x < 15 and ϵ = 1 with 1 < t < 1 . (d) represents the contour graph when 15 < x < 15 and ϵ = 1 for t ( 1 , 1 ) .
Mathematics 13 03107 g006aMathematics 13 03107 g006b
Figure 7. A graph of v ( x , t ) in Equation (38) for θ = 1 , ρ = 1 , κ = 1 , a = 1 , b = 1 , C 1 = 2 , C 2 = 1 , and ϱ = 1 . (a) is the two-dimensional plot if 10 < x < 10 and ε = 1 ; the yellow shape represents values if t = 0.5 ; the black shape represents values if t = 0 ; the pink shape represents values if t = 0.5 . (b) is the two-dimensional plot if 10 < x < 10 and t = 0.5 ; the green shape represents values if ϵ = 0.5 ; the orange shape represents values if ϵ = 0.7 ; the purple shape represents values if ϵ = 1 . (c) is a 3-D graph for 10 < x < 10 and ϵ = 1 with 1 < t < 1 . (d) represents the contour graph when 10 < x < 10 and ϵ = 1 for t ( 1 , 1 ) .
Mathematics 13 03107 g007
Figure 8. MI gain spectrum for the values θ = 2 and p = 3 , 4 , 5 , 6 . (a) represents the two-dimensional graph when 5 < τ < 5 and p = 3 , 4 , 5 , 6 . (b) shows the three-dimensional graph when 3 < τ < 3 and 2 < p < 2 . (c) represents the contour graph when 3 < τ < 3 and 2 < p < 2 .
Mathematics 13 03107 g008
Disclaimer/Publisher’s Note: The statements, opinions and data contained in all publications are solely those of the individual author(s) and contributor(s) and not of MDPI and/or the editor(s). MDPI and/or the editor(s) disclaim responsibility for any injury to people or property resulting from any ideas, methods, instructions or products referred to in the content.