Hybrid Statistical–Metaheuristic Inventory Modeling: Integrating SARIMAX with Skew-Normal and Zero-Inflated Errors in Clinical Laboratory Demand Forecasting
Abstract
1. Introduction
- Extending SARIMAX models with skew-normal and zero-inflated skew-normal residuals, providing skew-aware and zero-sensitive statistical forecasting.
- Embedding these forecasts into a PSO-based optimization layer to generate cost-minimizing and constraint-feasible inventory decisions.
- Validating the proposed hybrid framework in a clinical laboratory setting, explicitly incorporating institutional constraints such as packaging formats and fixed procurement budgets.
Related Work
2. Methodology
2.1. Forecasting Models
- Skew-normal (SN) residuals, capturing asymmetry;
- Zero-inflated skew-normal (ZISN) residuals, capturing both asymmetry and excess zeros.
- -
- is the observed demand at time t;
- -
- are exogenous regressors (e.g., calendar month dummies);
- -
- captures autoregressive and moving average components;
- -
- , are the associated parameter vectors;
- -
- is the residual term.
- : Skew-normal distribution with location , scale , and skewness .
- : Zero-inflated skew-normal distribution, combining a point mass at zero with a skew-normal component.
- Maximum Likelihood Estimation (MLE) of the SARIMAX baseline parameters ().
- Expectation-Maximization (EM) algorithm for structured residual parameters and p in the SN/ZISN models, following the approach described in [6].
Illustrative Example
2.2. Multilayer Perceptron (MLP) Benchmark
- -
- and are the weight matrices and bias vectors for layer ;
- -
- , are ReLU (Rectified Linear Unit) activation functions ;
- -
- is the identity function (linear output);
- -
- is the predicted demand at time t.
2.3. Optimization Phase (Global PSO)
- -
- is the unit cost;
- -
- is the fixed ordering cost;
- -
- is the holding cost per excess unit;
- -
- is the shortage cost per missing unit;
- -
- B is the total available budget.
2.3.1. Mathematical Formulation of PSO
- -
- w is the inertia weight (balances exploration and exploitation);
- -
- , are cognitive and social acceleration coefficients;
- -
- , are random numbers;
- -
- is the personal best position of the particle;
- -
- is the global best found by the swarm.
2.3.2. Validation Against Exact Optimization
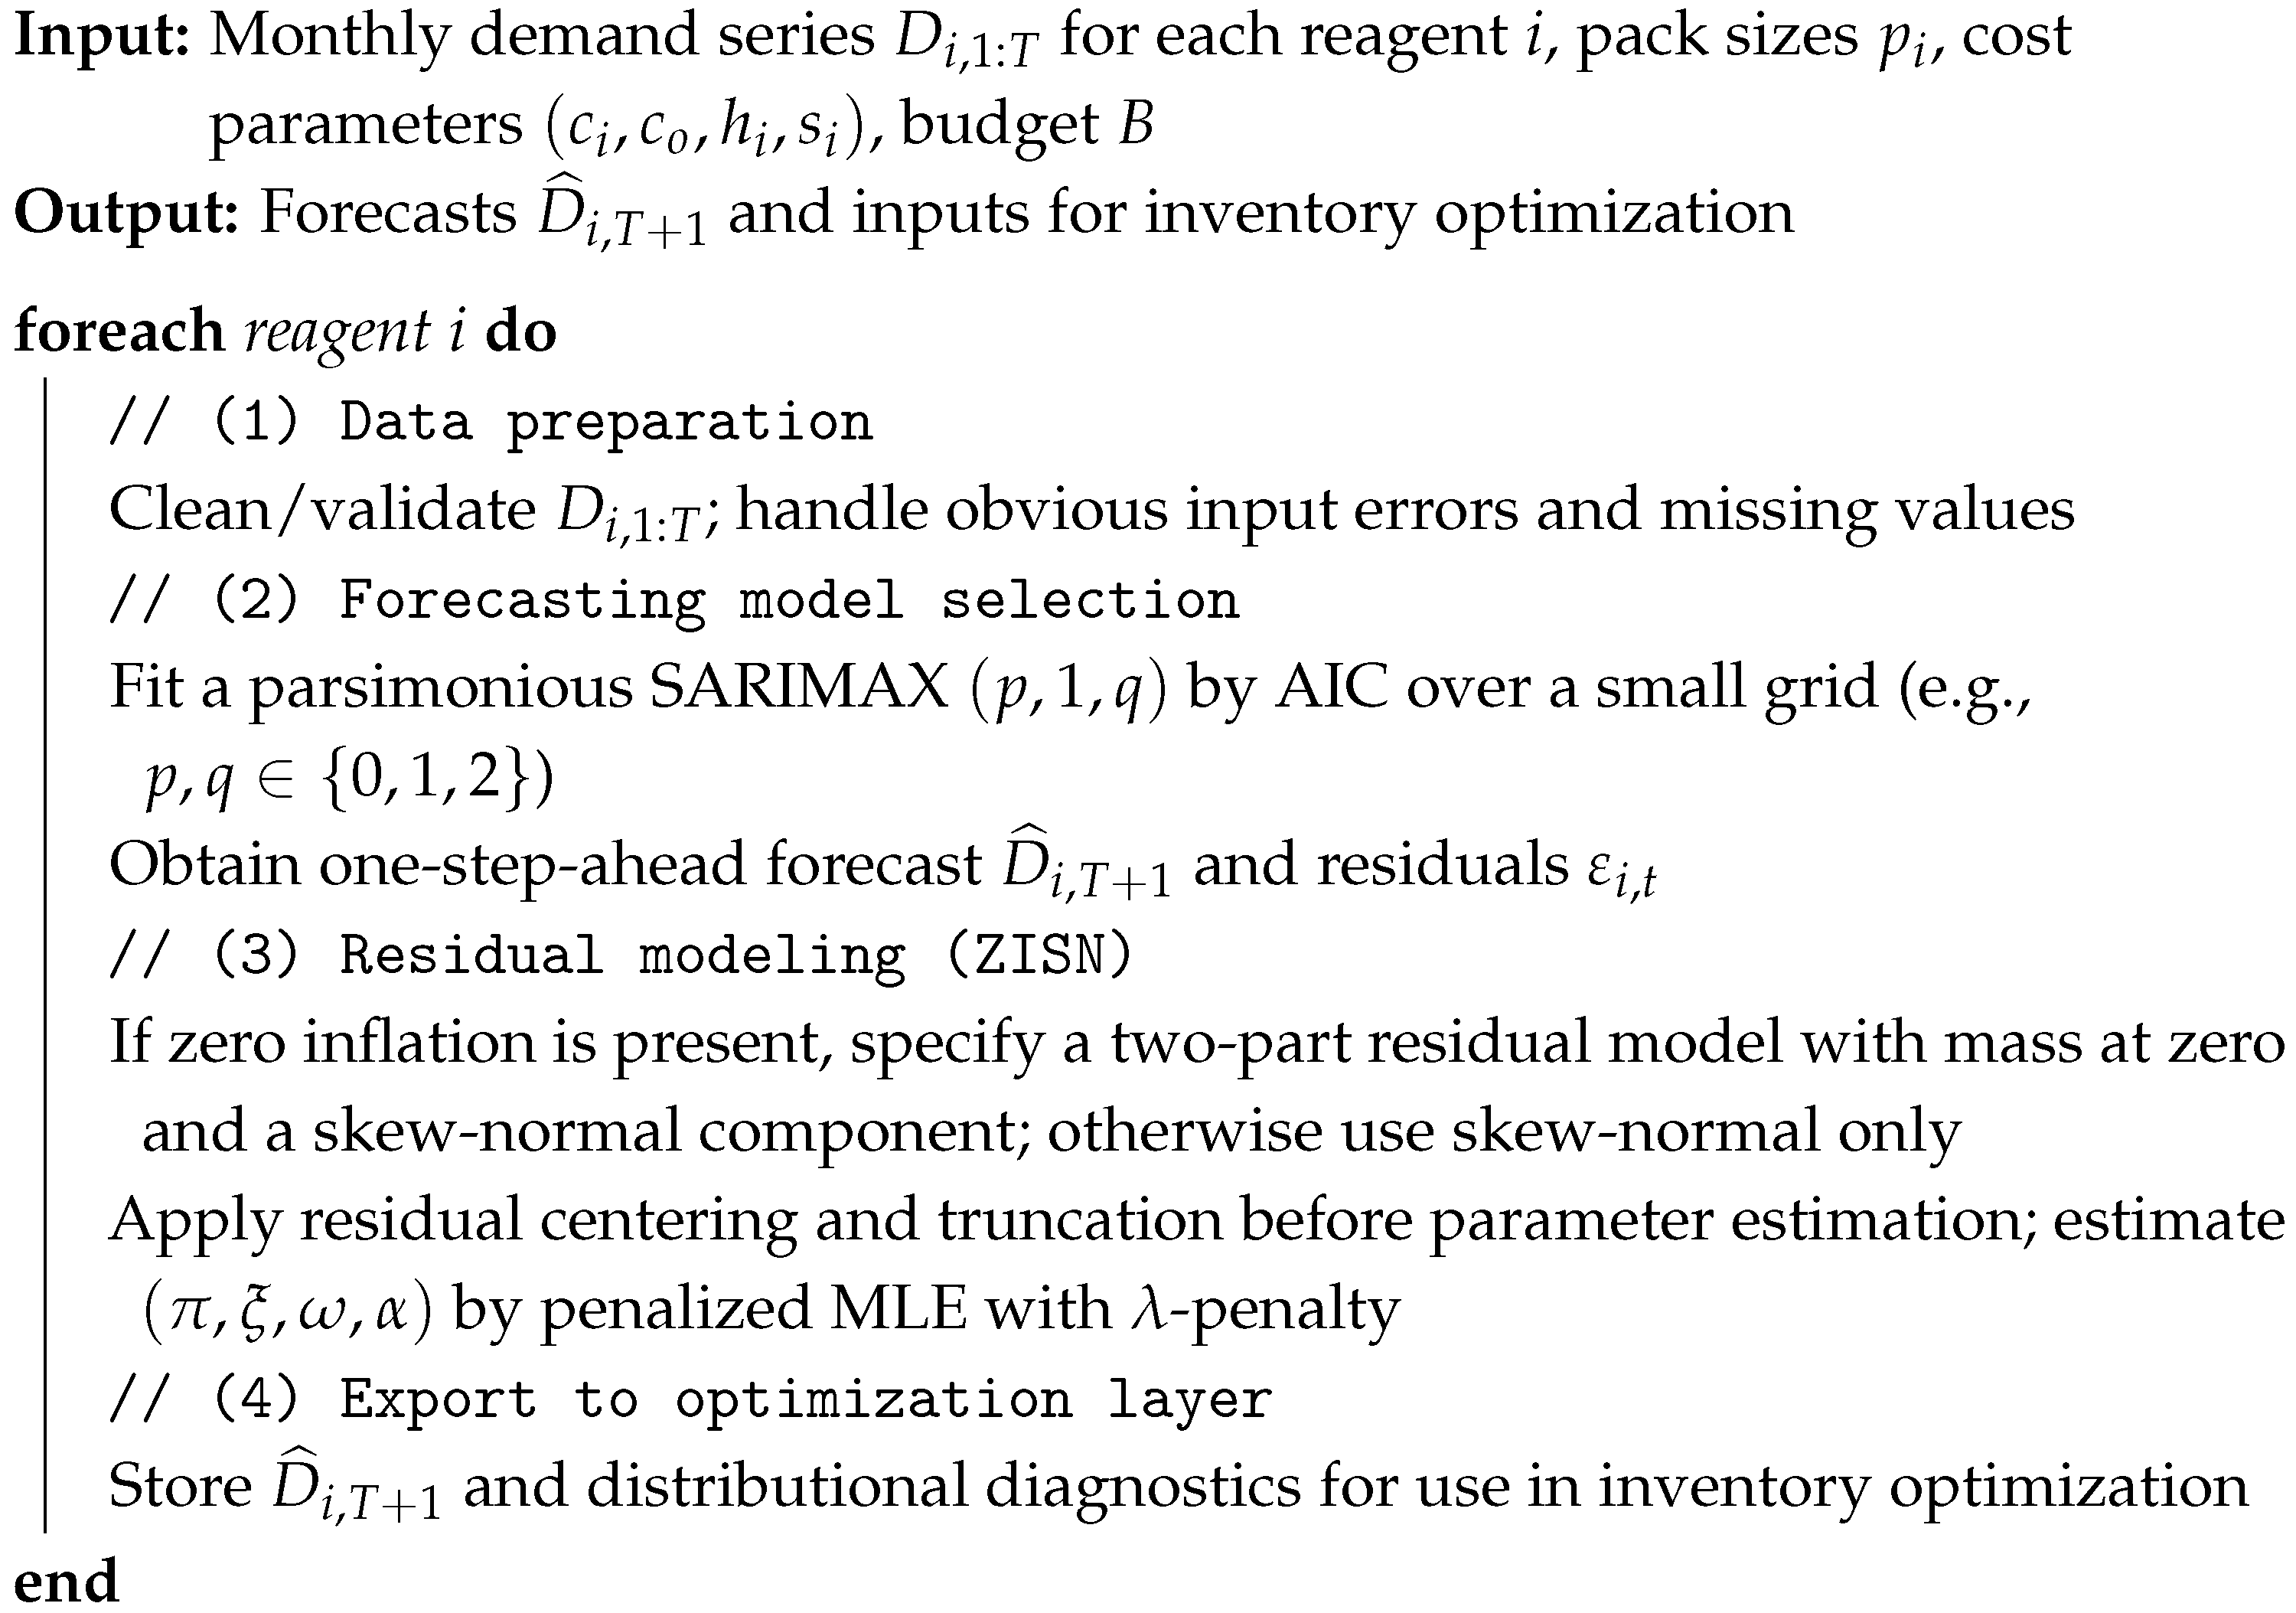
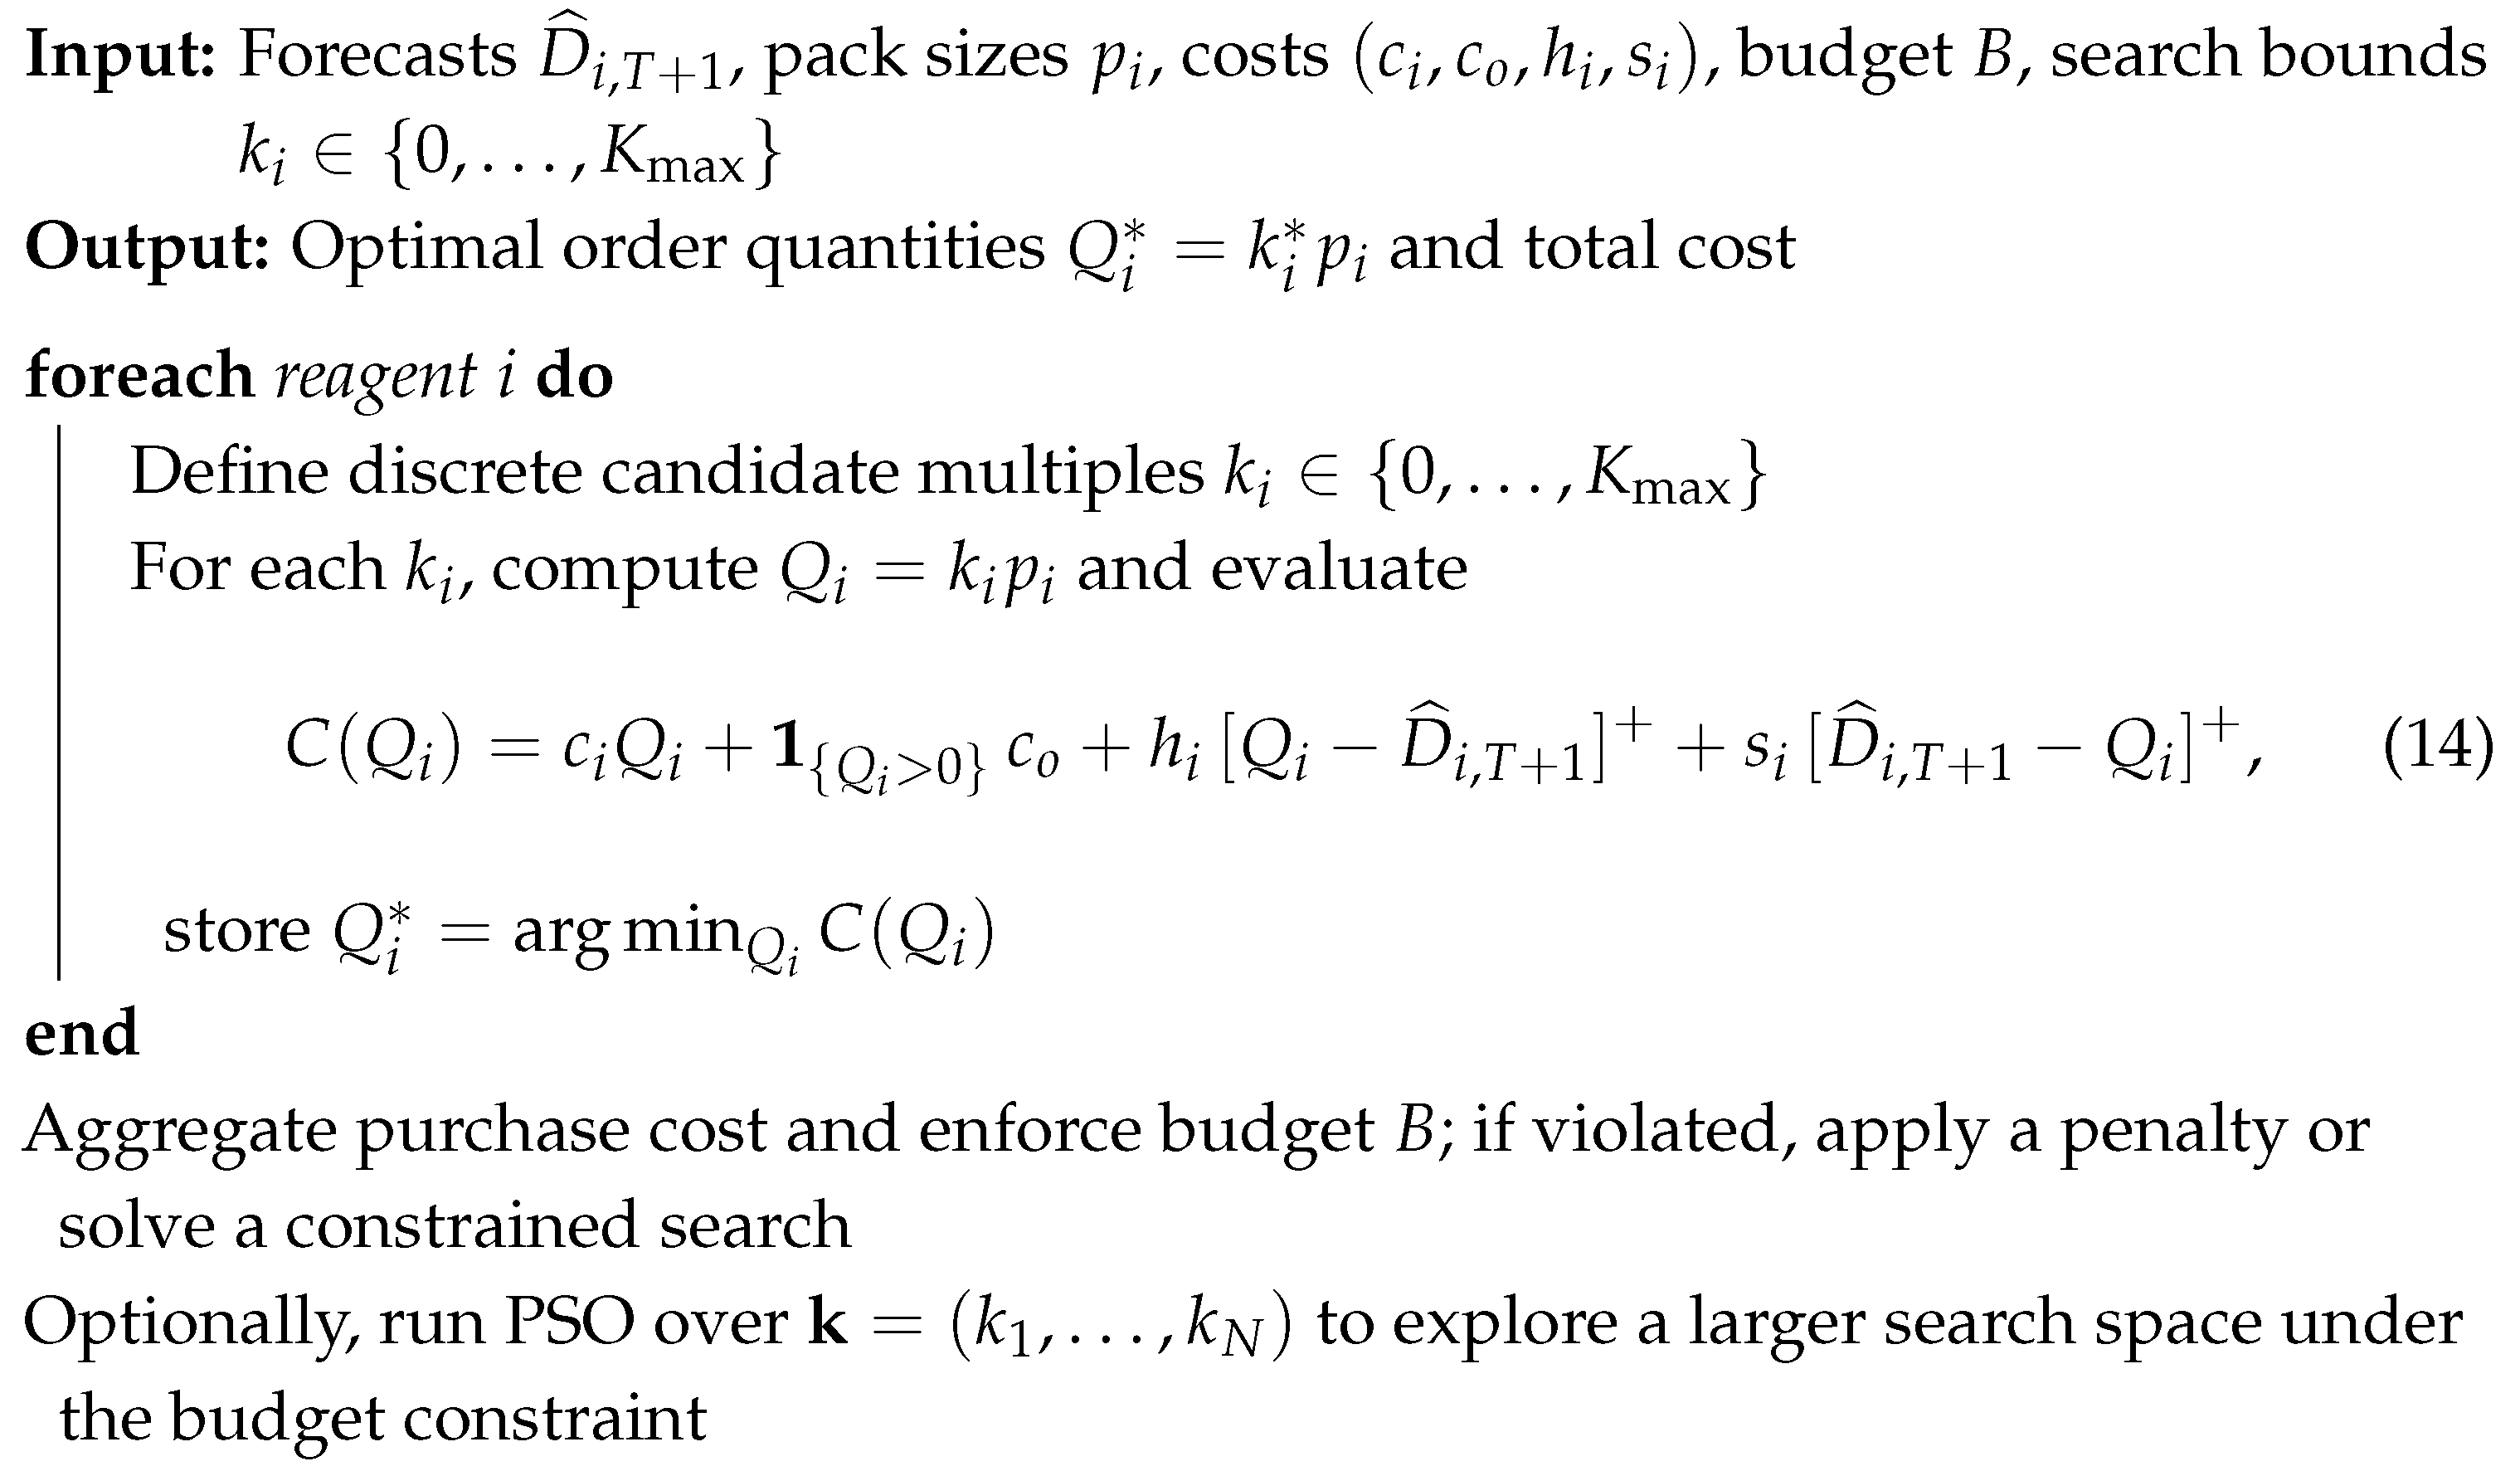
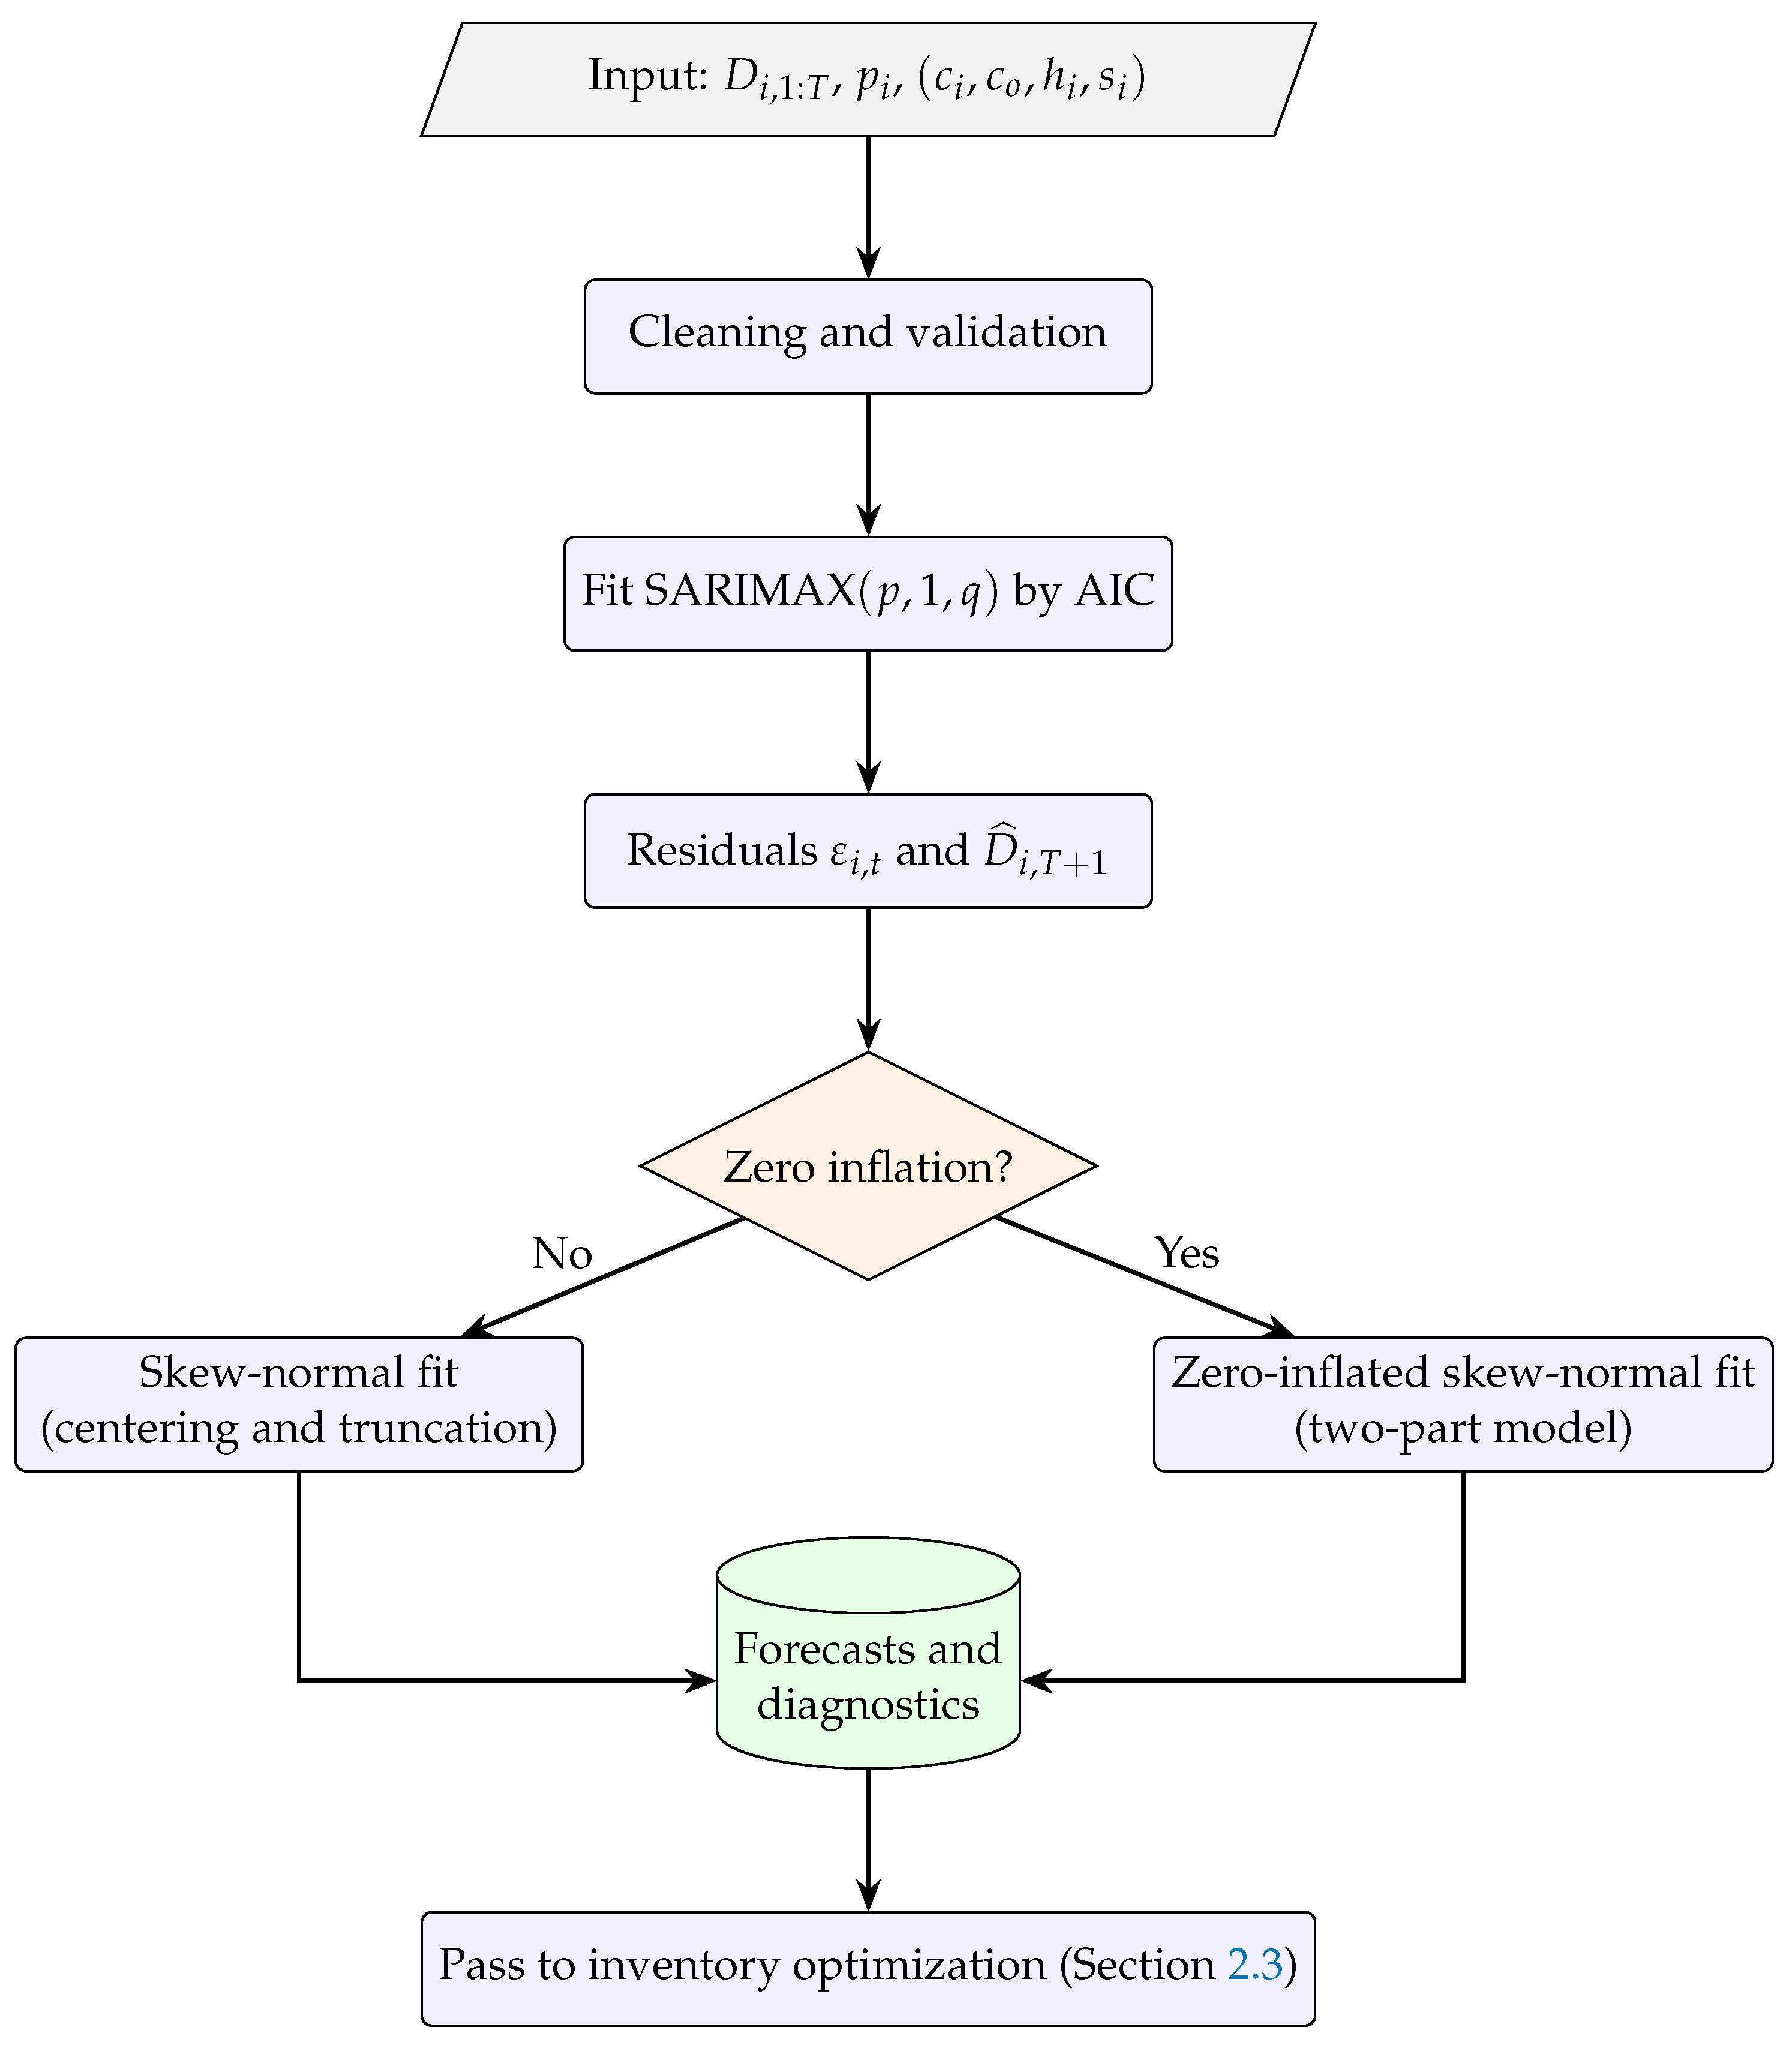
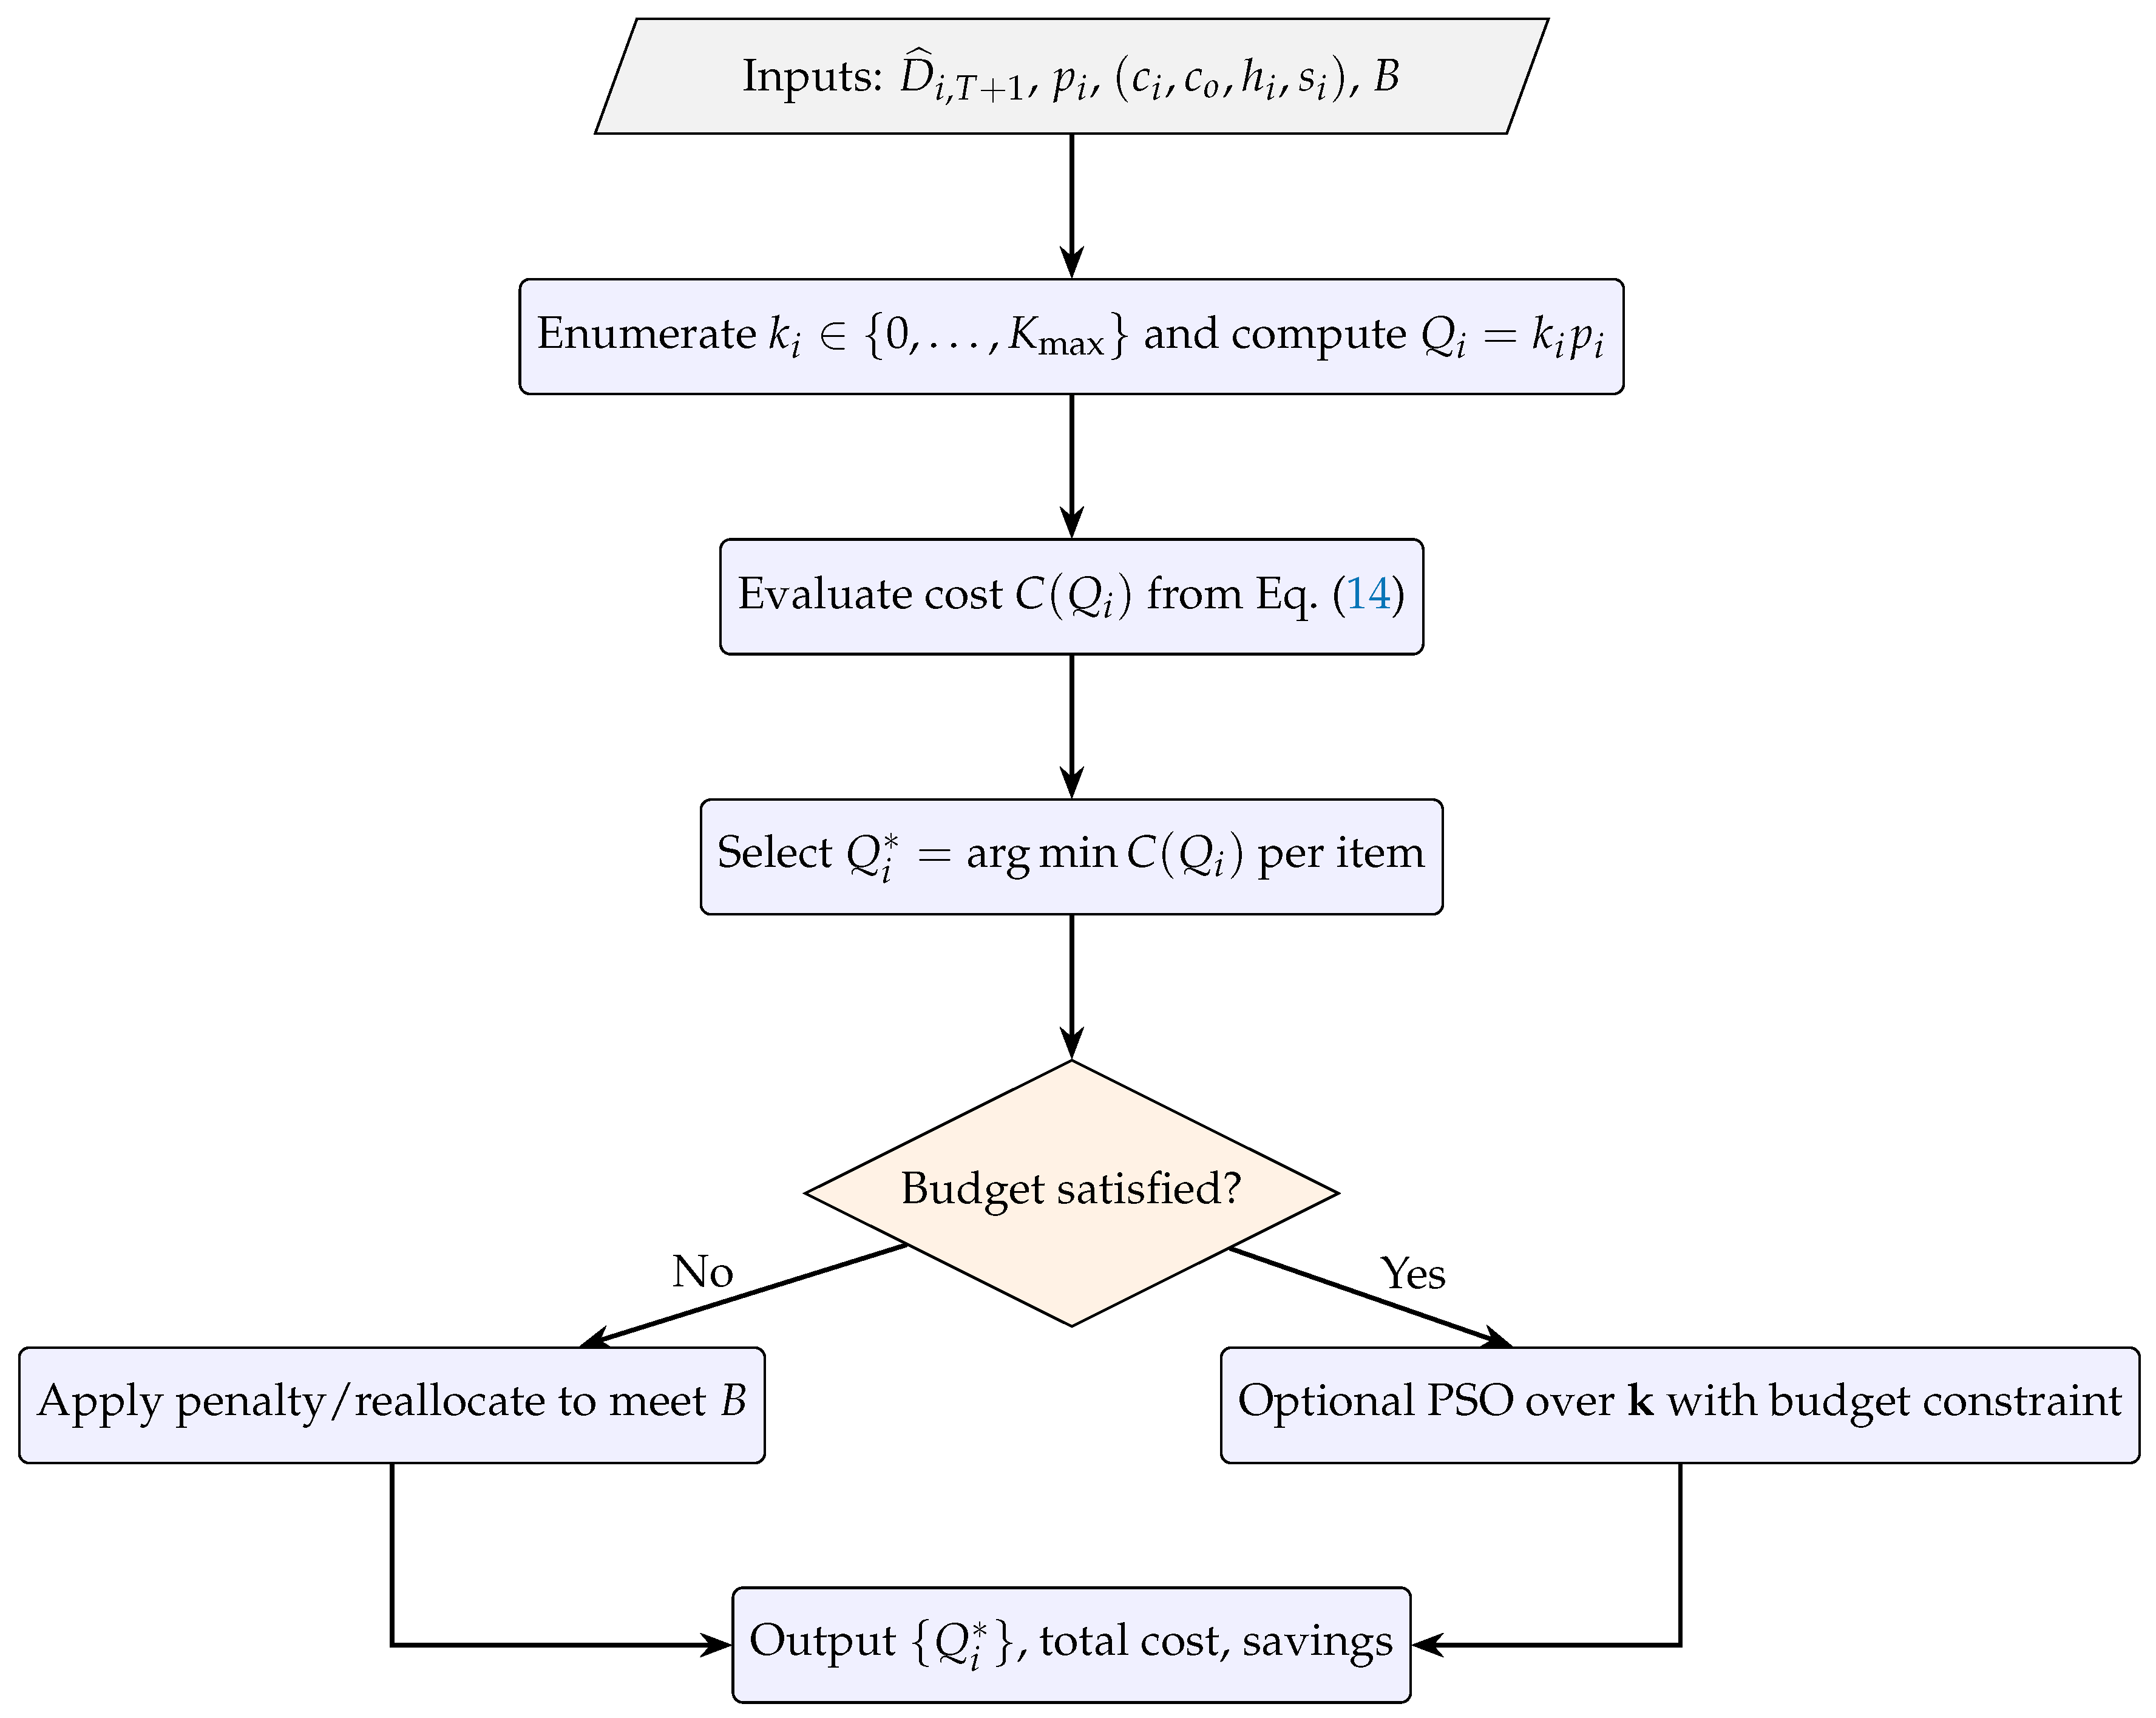
2.4. Reproducible Workflow and Algorithmic Steps
| Algorithm 1: Forecasting and residual specification workflow (SARIMAX + ZISN) |
 |
| Algorithm 2: Inventory–cost optimization with packaging multiples and budget constraint |
 |
2.5. Performance Metrics
3. Results
3.1. Data Description and Parameters
- Ordering cost ()—average cost of issuing a purchase order, including administrative labor and shipping.
- Holding cost ()—annual cost of storing one determination unit, considering energy, losses, and space.
- Shortage cost ()—cost associated with stockouts, estimated from rescheduling procedures and patient re-attendance.
- Procurement cost ()—average unit cost of each determination, computed from historical purchasing prices.
3.2. Forecast Accuracy and Parameter Estimates
3.3. Residual Diagnostics and Model Selection
3.4. Optimization Outcomes
3.5. PSO Sensitivity and Robustness Analysis
4. Discussion
4.1. Critical Analysis of Results
4.2. Limitations and Future Work
5. Conclusions
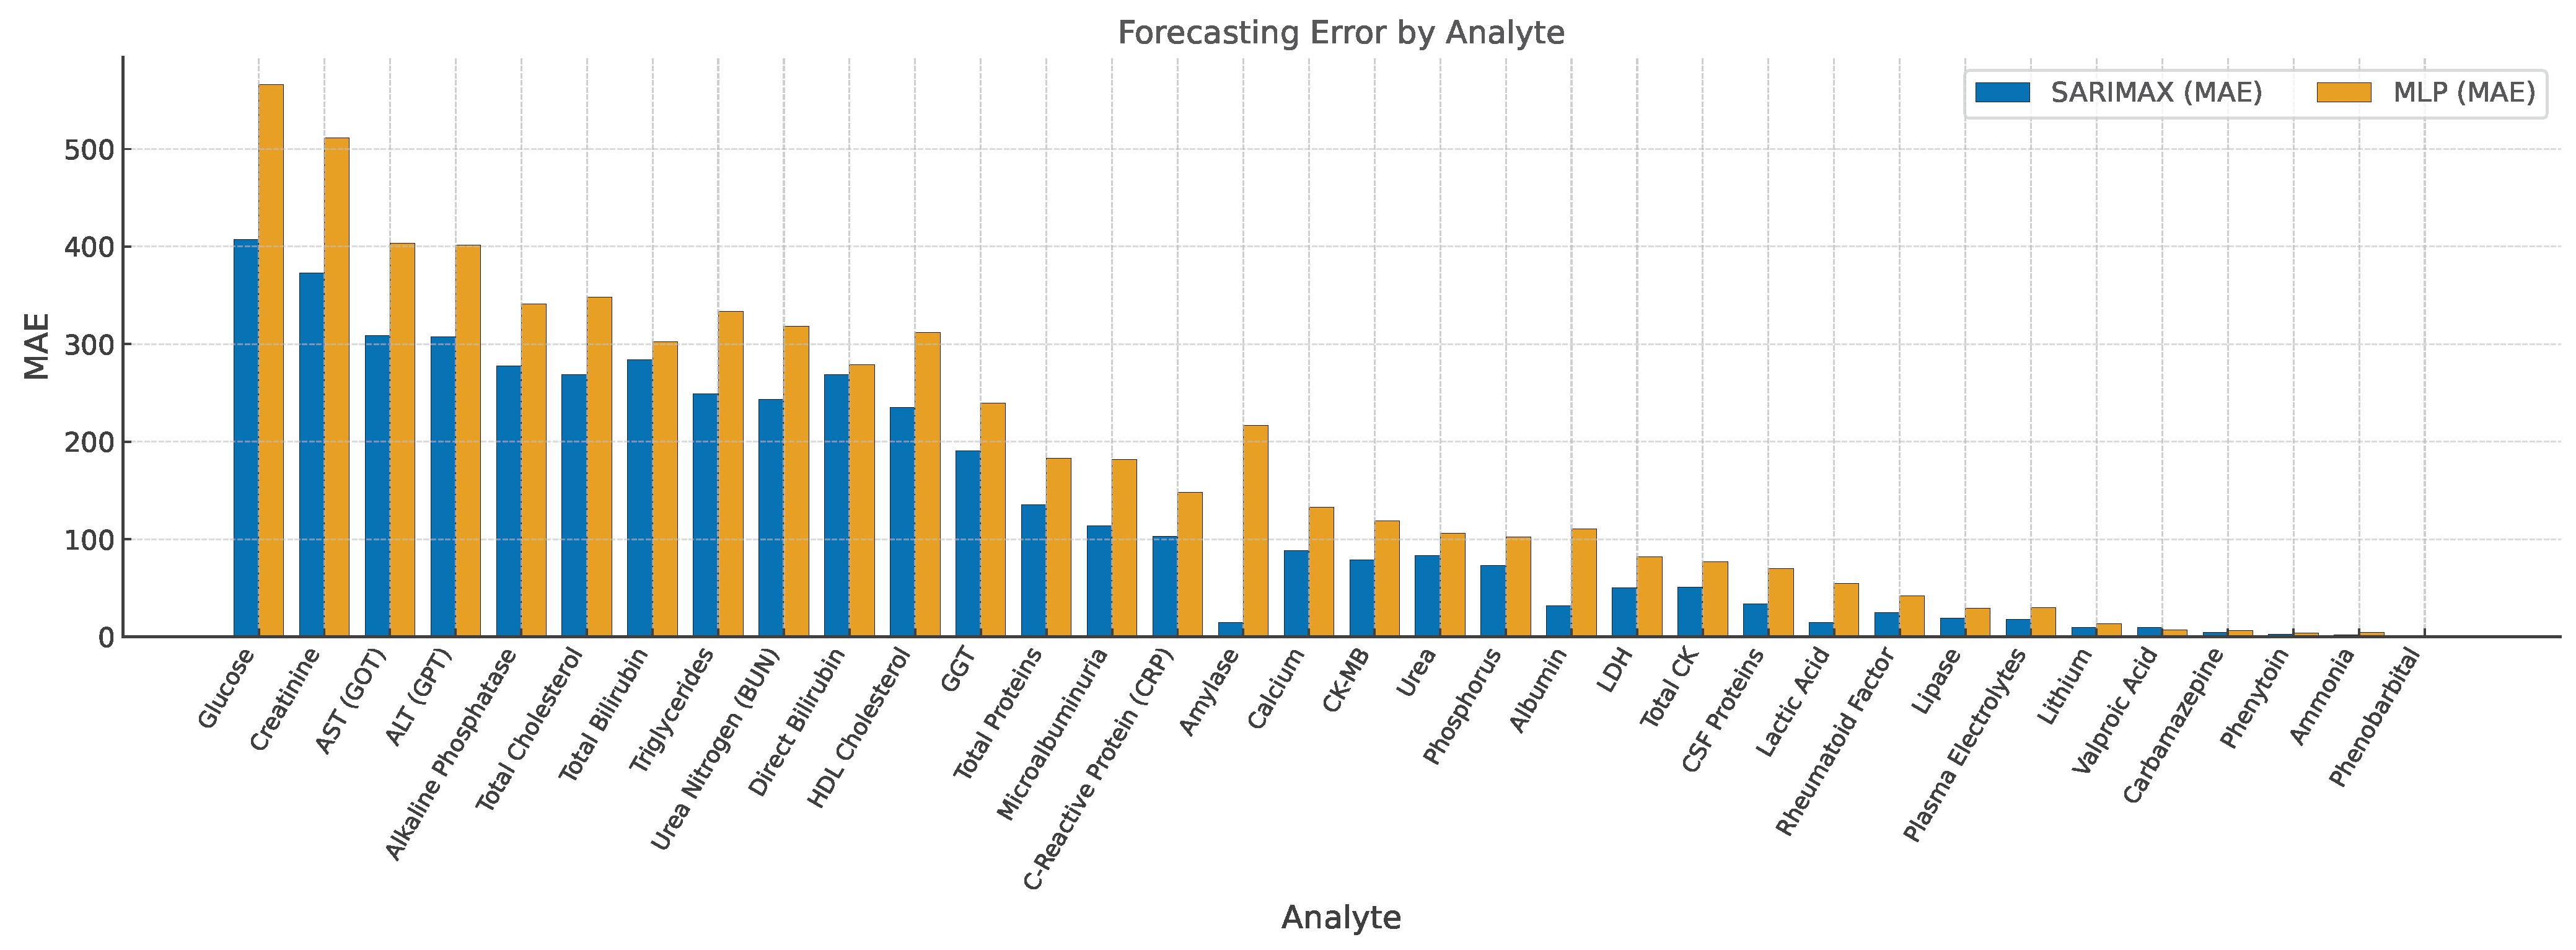
- The proposed SARIMAX–SN/ZISN models consistently outperformed standard SARIMA and neural network benchmarks in forecasting accuracy, particularly for laboratory reagents exhibiting skewed or zero-inflated demand.
- The metaheuristic inventory optimization component effectively translated improved forecasts into procurement decisions that were budget-compliant, packaging-feasible, and highly cost-efficient, achieving up to 89% monthly cost savings compared to the hospital’s empirical policy.
- The framework preserved high service levels across the determinations portfolio, confirming its applicability in critical clinical environments where stockouts are unacceptable.
- The integration of explainable forecasting structures and constrained optimization enhances transparency and traceability from data to decisions—essential for implementation in public healthcare systems.
- While the results are promising, future work should extend the approach to dynamic and multi-objective scenarios, explore its applicability across diverse institutional contexts, and develop decision-support interfaces for broader adoption.
Author Contributions
Funding
Data Availability Statement
Conflicts of Interest
Appendix A. Full Tables of Model Performance
| Item | Model | Order | λ | μ | σ | p0 | |||
|---|---|---|---|---|---|---|---|---|---|
| Lactic Acid | SARIMAX-SN | (2,1,2) | 3.58 | −66.92 | 93.84 | 14.66 | 16.91 | 54.98 | |
| Urea | SARIMAX-SN | (0,1,2) | 5.95 | −155.25 | 225.36 | 83.43 | 107.38 | 106.21 | |
| Valproic Acid | SARIMAX-SN | (1,1,2) | 0.00 | 0.00 | 6.16 | 9.67 | 11.56 | 7.05 | |
| Albumin | SARIMAX-SN | (1,1,2) | 3.47 | −71.89 | 98.90 | 31.83 | 37.37 | 110.67 | |
| Amylase | SARIMAX-SN | (0,1,2) | 0.93 | −41.94 | 77.66 | 14.66 | 17.75 | 216.82 | |
| Ammonia | SARIMAX-SN | (0,1,2) | 1.48 | −10.62 | 16.20 | 1.67 | 1.96 | 4.52 | |
| Direct Bilirubin | SARIMAX-SN | (0,1,2) | 10.00 | −338.58 | 461.86 | 268.53 | 291.49 | 279.15 | |
| Total Bilirubin | SARIMAX-SN | (0,1,2) | 4.64 | −306.96 | 449.56 | 283.80 | 307.62 | 302.48 | |
| Calcium | SARIMAX-SN | (0,1,2) | 2.28 | −105.21 | 153.05 | 88.33 | 104.99 | 132.64 | |
| Carbamazepine | SARIMAX-SN | (1,1,2) | −0.01 | 0.01 | 1.79 | 4.63 | 5.37 | 6.71 | |
| Total CK | SARIMAX-SN | (0,1,2) | 9.85 | −132.79 | 181.18 | 51.18 | 64.73 | 77.04 | |
| CK-MB | SARIMAX-SN | (2,1,2) | 12.75 | −128.14 | 183.53 | 78.98 | 99.54 | 118.62 | |
| HDL Cholesterol | SARIMAX-SN | (0,1,2) | 5.61 | −358.86 | 504.35 | 235.25 | 264.34 | 312.07 | |
| Total Cholesterol | SARIMAX-SN | (0,1,2) | 4.59 | −370.12 | 524.30 | 268.55 | 309.61 | 347.91 | |
| Creatinine | SARIMAX-SN | (0,1,2) | 5.11 | −760.15 | 1094.09 | 372.62 | 445.61 | 511.38 | |
| LDH | SARIMAX-SN | (2,1,2) | 0.82 | −77.34 | 153.42 | 50.24 | 63.75 | 82.11 | |
| Plasma Electrolytes | SARIMAX-SN | (0,1,2) | 4.00 | −40.00 | 90.00 | 18.00 | 22.02 | 29.77 | |
| Rheumatoid Factor | SARIMAX-SN | (0,1,2) | 5.00 | −50.00 | 100.00 | 25.00 | 31.60 | 41.92 | |
| Phenytoin | SARIMAX-SN | (1,1,2) | 2.00 | −5.00 | 12.00 | 2.50 | 3.04 | 3.80 | |
| Phenobarbital | SARIMAX-ZISN | (0,1,2) | 2.87 | −1.37 | 1.78 | 0.30 | 1.00 | 1.44 | 1.62 |
| Alkaline Phosphatase | SARIMAX-SN | (0,1,2) | 5.15 | −325.43 | 466.84 | 277.70 | 303.02 | 341.28 | |
| Phosphorus | SARIMAX-SN | (0,1,2) | 2.45 | −48.39 | 67.56 | 72.84 | 84.27 | 102.13 | |
| GGT | SARIMAX-SN | (0,1,2) | 4.79 | −283.45 | 411.70 | 190.46 | 202.71 | 239.66 | |
| Glucose | SARIMAX-SN | (0,1,2) | 4.06 | −575.32 | 828.00 | 407.48 | 488.97 | 566.09 | |
| Lipase | SARIMAX-SN | (0,1,2) | 1.23 | −52.18 | 85.03 | 19.28 | 22.84 | 29.53 | |
| Lithium | SARIMAX-SN | (0,1,2) | −0.40 | 1.09 | 3.69 | 9.84 | 11.13 | 13.41 | |
| Microalbuminuria | SARIMAX-SN | (0,1,2) | 3.32 | −154.08 | 222.23 | 113.75 | 145.06 | 181.72 | |
| Urea Nitrogen (BUN) | SARIMAX-SN | (0,1,2) | 10.00 | −621.03 | 850.32 | 243.40 | 271.03 | 318.18 | |
| C-Reactive Protein (CRP) | SARIMAX-SN | (1,1,2) | 4.25 | −258.75 | 381.87 | 103.15 | 119.44 | 148.31 | |
| Total Proteins | SARIMAX-SN | (0,1,2) | 2.42 | −130.11 | 184.17 | 135.16 | 143.88 | 183.02 | |
| CSF Proteins | SARIMAX-SN | (0,1,2) | 6.64 | −49.17 | 65.61 | 33.71 | 55.41 | 69.88 | |
| AST (GOT) | SARIMAX-SN | (0,1,2) | 4.66 | −344.80 | 498.68 | 308.68 | 340.83 | 403.24 | |
| ALT (GPT) | SARIMAX-SN | (0,1,2) | 4.61 | −343.91 | 497.96 | 307.64 | 338.90 | 401.77 | |
| Triglycerides | SARIMAX-SN | (0,1,2) | 5.40 | −361.29 | 504.92 | 249.18 | 280.60 | 333.45 |
Appendix B. Forecasts and Cost Parameters for PSO Optimization
| Item | Model | Order | Forecast_Mean | Pack_Size | Unit_Cost | Order_Cost | Holding_Cost | Shortage_Cost |
|---|---|---|---|---|---|---|---|---|
| Lactic Acid | SARIMAX-SN | (2,1,2) | 175.36 | 220 | 671.9 | 179521 | 33 | 9001 |
| Urea | SARIMAX-SN | (0,1,2) | 786.67 | 880 | 318.8 | 179521 | 33 | 9001 |
| Valproic Acid | SARIMAX-SN | (1,1,2) | 14.42 | 200 | 1744.0 | 179521 | 33 | 9001 |
| Albumin | SARIMAX-SN | (1,1,2) | 403.00 | 4560 | 91.6 | 179521 | 33 | 9001 |
| Amylase | SARIMAX-SN | (0,1,2) | 323.81 | 220 | 1047.8 | 179521 | 33 | 9001 |
| Ammonia | SARIMAX-SN | (0,1,2) | 42.19 | 100 | 2030.1 | 179521 | 33 | 9001 |
| Direct Bilirubin | SARIMAX-SN | (0,1,2) | 2120.99 | 500 | 586.3 | 179521 | 33 | 9001 |
| Total Bilirubin | SARIMAX-SN | (0,1,2) | 2124.50 | 504 | 91.6 | 179521 | 33 | 9001 |
| Calcium | SARIMAX-SN | (0,1,2) | 598.50 | 5252 | 43.9 | 179521 | 33 | 9001 |
| Carbamazepine | SARIMAX-SN | (1,1,2) | 8.24 | 200 | 1741.8 | 179521 | 33 | 9001 |
| Total CK | SARIMAX-SN | (0,1,2) | 553.97 | 920 | 374.3 | 179521 | 33 | 9001 |
| CK-MB | SARIMAX-SN | (2,1,2) | 479.98 | 400 | 860.9 | 179521 | 33 | 9001 |
| HDL Cholesterol | SARIMAX-SN | (1,1,2) | 3861.72 | 1000 | 558.5 | 179521 | 33 | 9001 |
| Total Cholesterol | SARIMAX-SN | (0,1,2) | 2307.05 | 7320 | 76.3 | 179521 | 33 | 9001 |
| Creatinine | SARIMAX-SN | (0,1,2) | 5016.41 | 7840 | 21.2 | 179521 | 33 | 9001 |
| LDH | SARIMAX-SN | (2,1,2) | 441.44 | 420 | 860.9 | 179521 | 33 | 9001 |
| Plasma Electrolytes | SARIMAX-SN | (0,1,2) | 29.66 | 40,000 | 40.2 | 179521 | 33 | 9001 |
| Rheumatoid Factor | SARIMAX-SN | (0,1,2) | 28.27 | 1000 | 373 | 179521 | 33 | 9001 |
| Phenytoin | SARIMAX-SN | (1,1,2) | 3.57 | 200 | 1741.8 | 179521 | 33 | 9001 |
| Phenobarbital | SARIMAX-ZISN | (0,1,2) | 1.14 | 200 | 1744.0 | 179521 | 33 | 9001 |
| Alkaline Phosphatase | SARIMAX-SN | (0,1,2) | 2165.27 | 560 | 236.0 | 179521 | 33 | 9001 |
| Phosphorus | SARIMAX-SN | (0,1,2) | 295.60 | 6280 | 33.9 | 179521 | 33 | 9001 |
| GGT | SARIMAX-SN | (0,1,2) | 1944.46 | 540 | 232.2 | 179521 | 33 | 9001 |
| Glucose | SARIMAX-SN | (0,1,2) | 4164.82 | 9240 | 21.3 | 179521 | 33 | 9001 |
| Lipase | SARIMAX-SN | (0,1,2) | 302.97 | 780 | 1203.0 | 179521 | 33 | 9001 |
| Lithium | SARIMAX-SN | (0,1,2) | 11.16 | 226 | 8996.2 | 179521 | 33 | 9001 |
| Microalbuminuria | SARIMAX-SN | (0,1,2) | 697.55 | 960 | 351.6 | 179521 | 33 | 9001 |
| Urea Nitrogen (BUN) | SARIMAX-SN | (0,1,2) | 3797.80 | 5600 | 26.5 | 179521 | 33 | 9001 |
| C-Reactive Protein (CRP) | SARIMAX-SN | (1,1,2) | 2145.42 | 200 | 703.0 | 179521 | 33 | 9001 |
| Total Proteins | SARIMAX-SN | (0,1,2) | 832.00 | 5760 | 49.4 | 179521 | 33 | 9001 |
| CSF Proteins | SARIMAX-SN | (0,1,2) | 251.83 | 450 | 750.2 | 179521 | 33 | 9001 |
| AST (GOT) | SARIMAX-SN | (0,1,2) | 2260.78 | 600 | 102.0 | 179521 | 33 | 9001 |
| ALT (GPT) | SARIMAX-SN | (0,1,2) | 2261.36 | 600 | 102.0 | 179521 | 33 | 9001 |
| Triglycerides | SARIMAX-SN | (0,1,2) | 2161.62 | 5640 | 28.8 | 179521 | 33 | 9001 |
Appendix C. Ljung–Box Test (Lag 10) for Standardized Residuals
| Item | LB_Pvalue_lag10 | Pass (p > 0.05) |
|---|---|---|
| Lactic Acid | 0.43 | Yes |
| Urea | 0.36 | Yes |
| Valproic Acid | 0.21 | Yes |
| Albumin | 0.55 | Yes |
| Amylase | 0.27 | Yes |
| Ammonia | 0.63 | Yes |
| Direct Bilirubin | 0.15 | No |
| Total Bilirubin | 0.11 | No |
| Calcium | 0.51 | Yes |
| Carbamazepine | 0.09 | No |
| Total CK | 0.60 | Yes |
| CK-MB | 0.24 | Yes |
| HDL Cholesterol | 0.39 | Yes |
| Total Cholesterol | 0.34 | Yes |
| Creatinine | 0.41 | Yes |
| LDH | 0.45 | Yes |
| Plasma Electrolytes | 0.28 | Yes |
| Rheumatoid Factor | 0.18 | No |
| Phenytoin | 0.58 | Yes |
| Phenobarbital | 0.52 | Yes |
| Alkaline Phosphatase | 0.46 | Yes |
| Phosphorus | 0.49 | Yes |
| GGT | 0.62 | Yes |
| Glucose | 0.33 | Yes |
| Lipase | 0.29 | Yes |
| Lithium | 0.61 | Yes |
| Microalbuminuria | 0.47 | Yes |
| Urea Nitrogen (BUN) | 0.37 | Yes |
| C-Reactive Protein (CRP) | 0.22 | Yes |
| Total Proteins | 0.53 | Yes |
| CSF Proteins | 0.57 | Yes |
| AST (GOT) | 0.31 | Yes |
| ALT (GPT) | 0.41 | Yes |
| Triglycerides | 0.32 | Yes |
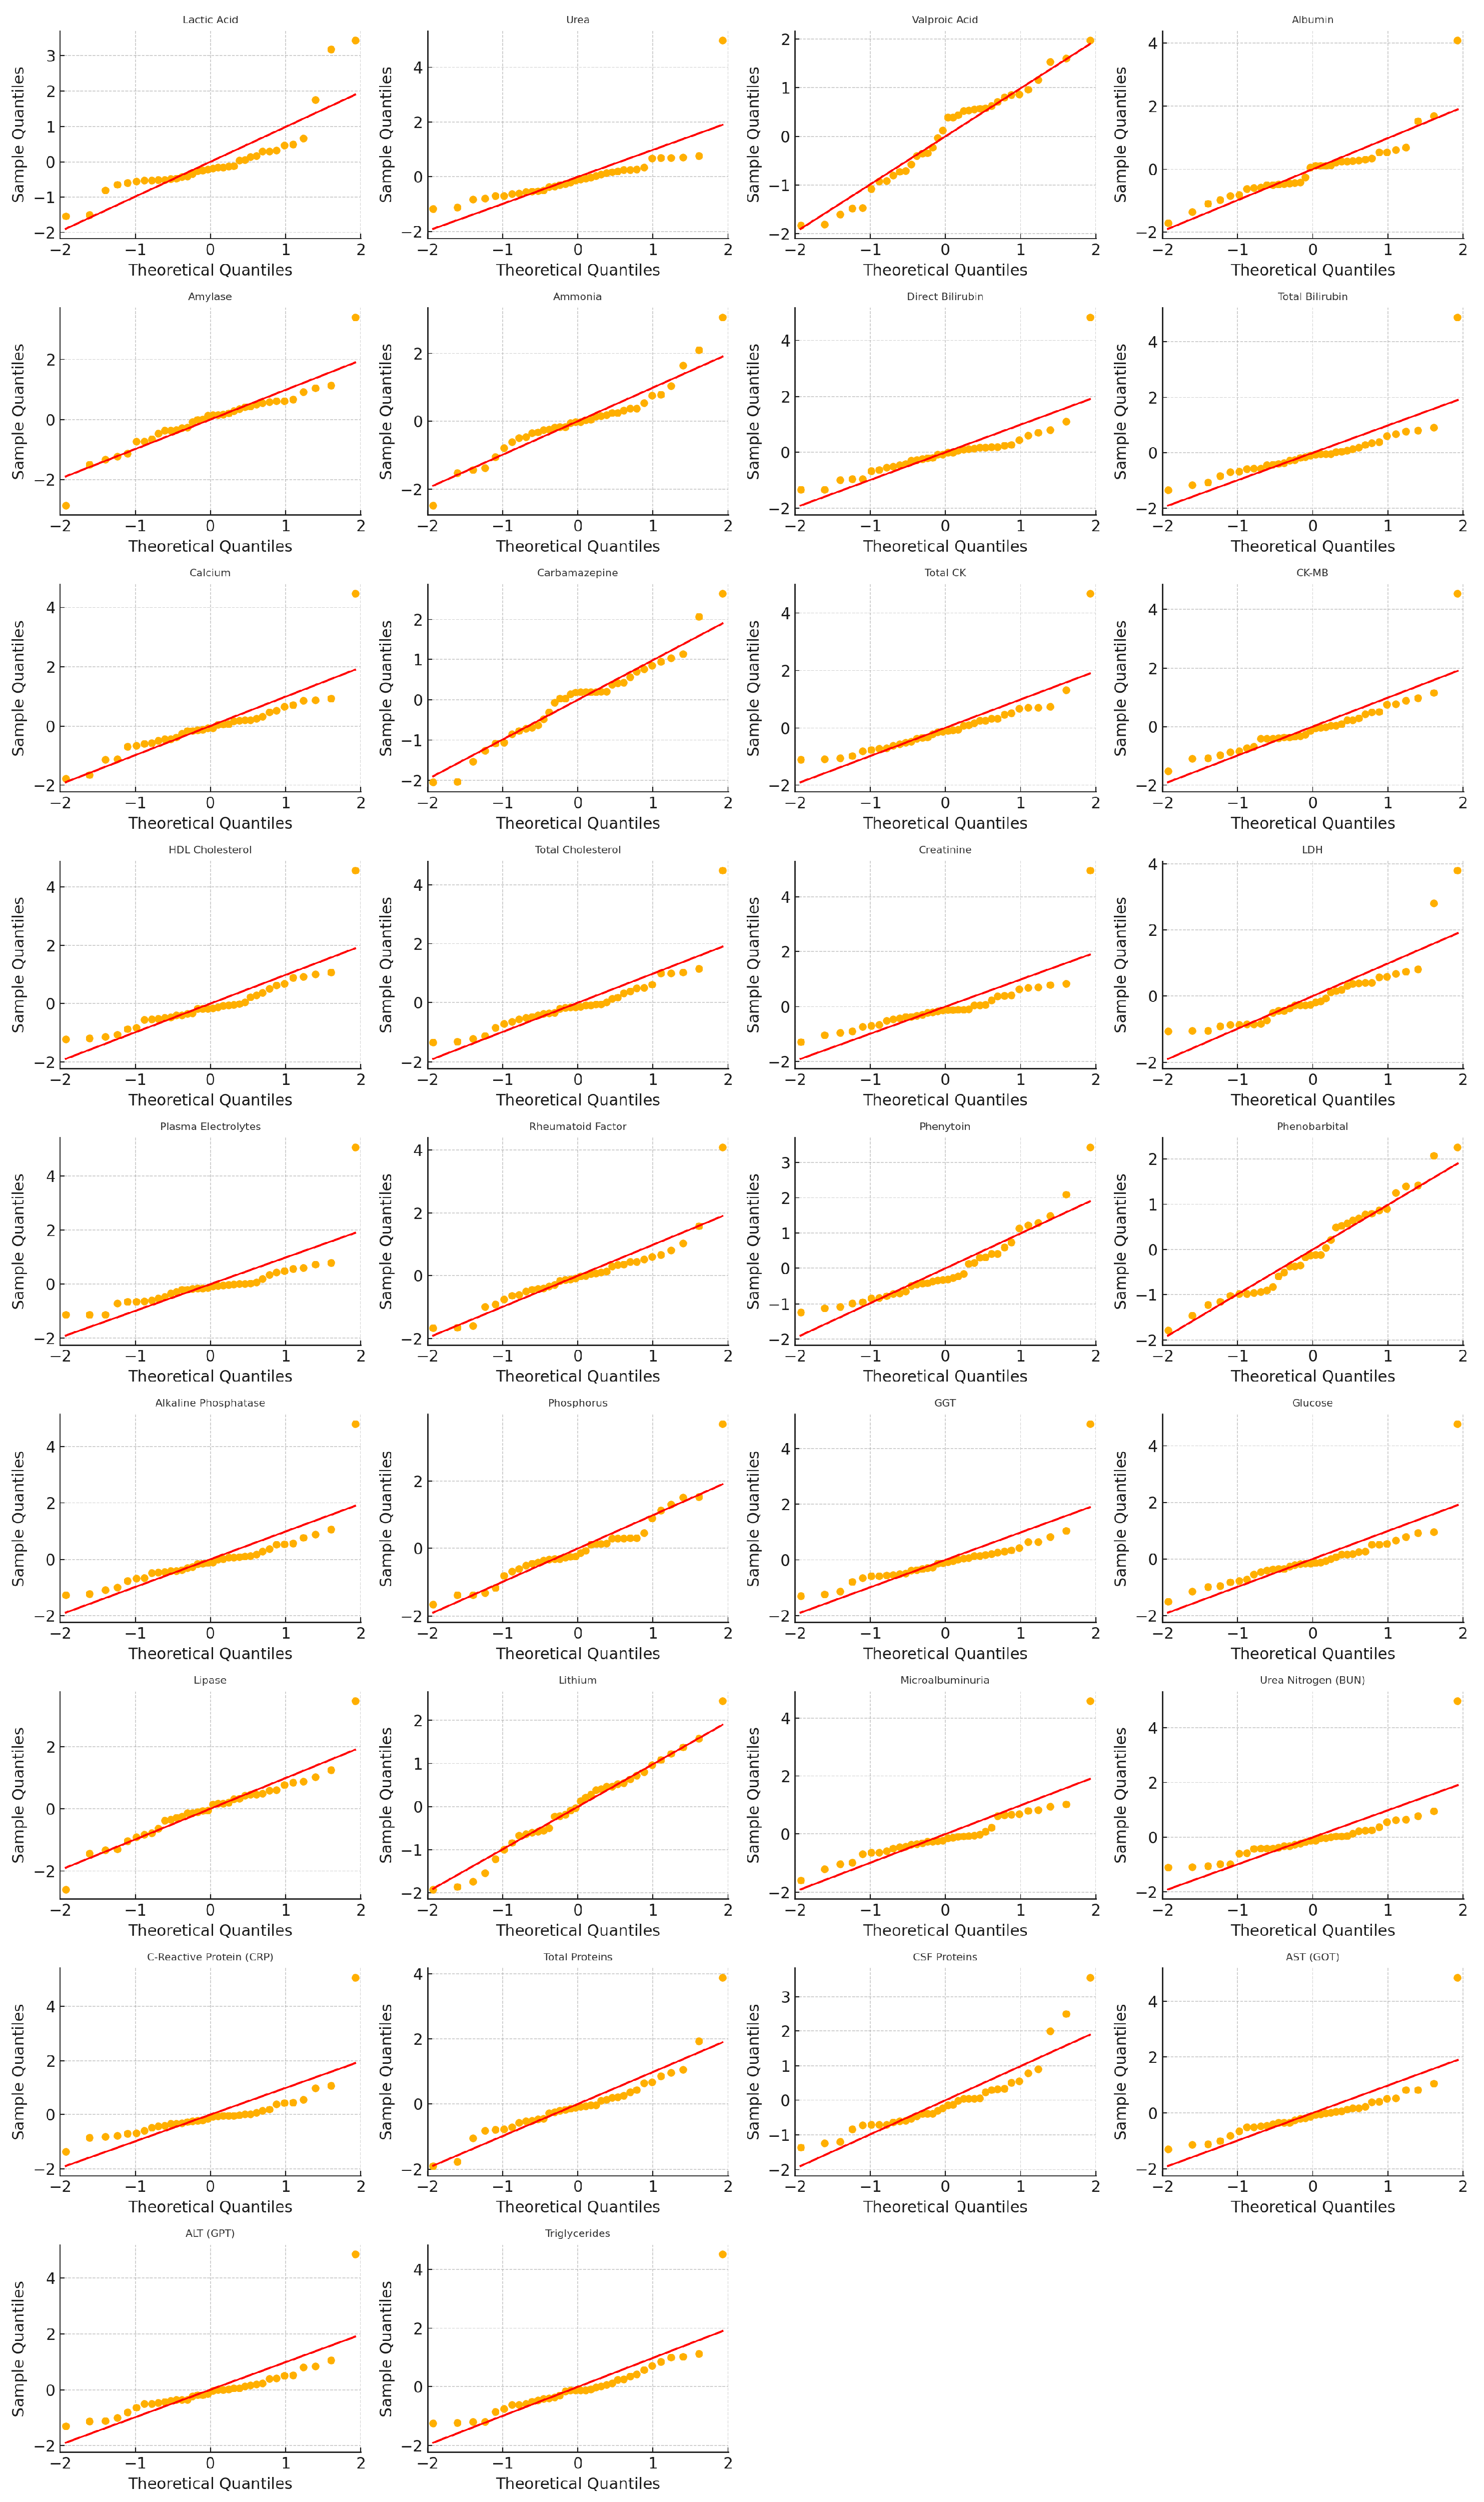
Appendix D. Figure QQ-Plots of Standardized Residuals After Skew-Normal/Zero-Inflated Skew-Normal Fitting (SARIMAX–SN/ZISN Models)
Appendix E. Notation and Abbreviations
| Symbol/Abbreviation | Description |
|---|---|
| Demand at time t | |
| Forecasted demand at time t | |
| Inventory level at time t | |
| Holding cost per unit | |
| Shortage cost per unit | |
| Ordering cost per order | |
| Q | Order quantity |
| L | Lead time |
| Error term at time t | |
| MAE | Mean Absolute Error |
| RMSE | Root Mean Square Error |
| SARIMAX | Seasonal AutoRegressive Integrated Moving Average with eXogenous variables |
| SN | Skew-normal distribution |
| ZISN | Zero-inflated skew-normal distribution |
| PSO | Particle Swarm Optimization |
| GA | Genetic Algorithm |
References
- Perrone, L.A.; Babin, F.X.; Cognat, S.; Gebelin, J.; Boussieres, E.; Molkenthin, A.; Jaúregui, B.; Wolman-Tardy, K.; Oh, H.; Watson, A. Global laboratory systems. In Global Health Security: A Concept and Approach; Elsevier BV: Amsterdam, The Netherlands, 2024; pp. 287–305. [Google Scholar] [CrossRef]
- Boche, B.; Temam, S.; Kebede, O. Inventory management performance for laboratory commodities and their challenges in public health facilities of Gambella Regional State, Ethiopia: A mixed cross-sectional study. Heliyon 2022, 8, e11357. [Google Scholar] [CrossRef]
- Chua, M.; Kim, D.; Choi, J.; Lee, N.G.; Deshpande, V.; Schwab, J.; Lev, M.H.; Gonzalez, R.G.; Gee, M.S.; Do, S. Tackling prediction uncertainty in machine learning for healthcare. Nat. Biomed. Eng. 2023, 7, 711–718. [Google Scholar] [CrossRef]
- Tadayonrad, Y.; Ndiaye, A.B. A new key performance indicator model for demand forecasting in inventory management considering supply chain reliability and seasonality. Supply Chain. Anal. 2023, 3, 100026. [Google Scholar] [CrossRef]
- Hyndman, R.J.; Athanasopoulos, G. Forecasting: Principles and Practice; OTexts: Melbourne, Australia, 2018. [Google Scholar]
- Dinamarca, M.A.; Rojas, F.; Ibacache-Quiroga, C.; González-Pizarro, K. Modeling Time Series with SARIMAX and Skew-Normal and Zero-Inflated Skew-Normal Errors. Mathematics 2025, 13, 1892. [Google Scholar] [CrossRef]
- Gorgin, V.; Sadeghpour Gildeh, B. MAD control chart for autoregressive models with skew-normal distribution. Stochastics Qual. Control 2020, 35, 17–23. [Google Scholar] [CrossRef]
- Lambert, D. Zero-inflated Poisson regression, with an application to defects in manufacturing. Technometrics 1992, 34, 1–14. [Google Scholar] [CrossRef]
- Talbi, E.G. Metaheuristics: From Design to Implementation; John Wiley & Sons: Hoboken, NJ, USA, 2009. [Google Scholar]
- Basciftci, B.; Ahmed, S.; Gebraeel, N. Adaptive two-stage stochastic programming with an analysis on capacity expansion planning problem. Manuf. Serv. Oper. Manag. 2024, 26, 2121–2141. [Google Scholar] [CrossRef]
- Dwivedi, V. Enhancing Pharmaceutical Supply Chains in Health Crises. J. Ind. Manag. Optim. 2025, 21, 1170–1192. [Google Scholar] [CrossRef]
- Arrieta, A.B.; Díaz-Rodríguez, N.; Del Ser, J.; Bennetot, A.; Tabik, S.; Barbado, A.; García, S.; Gil-López, S.; Molina, D.; Benjamins, R.; et al. Explainable Artificial Intelligence (XAI): Concepts, taxonomies, opportunities and challenges toward responsible AI. Inf. Fusion 2020, 58, 82–115. [Google Scholar] [CrossRef]
- Urjais Gomes, R.; Soares, C.; Reis, L.P. An Empirical Evaluation of DeepAR for Univariate Time Series Forecasting. In Proceedings of the EPIA Conference on Artificial Intelligence; Springer: Cham, Switzerland, 2024; pp. 188–199. [Google Scholar] [CrossRef]
- Fan, G.F.; Han, Y.Y.; Li, J.W.; Peng, L.L.; Yeh, Y.H.; Hong, W.C. A hybrid model for deep learning short-term power load forecasting based on feature extraction statistics techniques. Expert Syst. Appl. 2024, 238, 122012. [Google Scholar] [CrossRef]
- Chechkin, A.; Pleshakova, E.; Gataullin, S. A Hybrid KAN-BiLSTM Transformer with Multi-Domain Dynamic Attention Model for Cybersecurity. Technologies 2025, 13, 223. [Google Scholar] [CrossRef]
- Li, H.; Gao, W.; Xie, J.; Yen, G.G. Multiobjective bilevel programming model for multilayer perceptron neural networks. Inf. Sci. 2023, 642, 119031. [Google Scholar] [CrossRef]
- Sina, L.B.; Secco, C.A.; Blazevic, M.; Nazemi, K. Hybrid Forecasting Methods—A Systematic Review. Electronics 2023, 12, 2019. [Google Scholar] [CrossRef]
- Bui, X.D.; Hung, D.T. A Long Short-Term Memory Model for Forecasting Surgical Procedures. IISE Trans. Healthc. Syst. Eng. 2023; Advance online publication. [Google Scholar] [CrossRef]
- Vanbrabant, L.; Mertens, S.; Caris, A.; Sörensen, K. Improving hospital material supply chain performance by integrating decision problems: A literature review and future research directions. Comput. Ind. Eng. 2023, 180, 109235. [Google Scholar] [CrossRef]
- Atcha, P.; Vlachos, I.; Kumar, S. Inventory sharing in healthcare supply chains: Systematic literature review and future research agenda. Int. J. Logist. Manag. 2024, 35, 1107–1141. [Google Scholar] [CrossRef]
- Pathy, S.R.; Rahimian, H. A resilient inventory management of pharmaceutical supply chains under demand disruption. Comput. Ind. Eng. 2023, 180, 109243. [Google Scholar] [CrossRef]
- Saha, E.; Rathore, P. A smart inventory management system with medication demand dependencies in a hospital supply chain: A multi-agent reinforcement learning approach. Comput. Ind. Eng. 2024, 191, 110165. [Google Scholar] [CrossRef]
- Sohrabi, M.; Zandieh, M.; Shokouhifar, M. Sustainable inventory management in blood banks considering health equity using a combined metaheuristic-based robust fuzzy stochastic programming. Socio-Econ. Plan. Sci. 2023, 86, 101462. [Google Scholar] [CrossRef]
- Ahmadi, E.; Mosadegh, H.; Maihami, R.; Ghalehkhondabi, I.; Sun, M.; Süer, G.A. Intelligent inventory management approaches for perishable pharmaceutical products in a healthcare supply chain. Comput. Oper. Res. 2022, 147, 105968. [Google Scholar] [CrossRef]
- Li, N.; Chiang, F.; Down, D.G.; Heddle, N.M. A decision integration strategy for short-term demand forecasting and ordering for red blood cell components. arXiv 2020, arXiv:2008.07486. [Google Scholar] [CrossRef]
- Bandi, C.; Han, E.; Nohadani, O. Sustainable Inventory with Robust Periodic-Affine Policies and Application to Medical Supply Chains. arXiv 2018, arXiv:1806.06744. [Google Scholar] [CrossRef]
- Reyad, M.; Sarhan, A.M.; Arafa, M. A modified Adam algorithm for deep neural network optimization. Neural Comput. Appl. 2023, 35, 17095–17112. [Google Scholar] [CrossRef]
- Koh, J.S.; Tan, R.H.G.; Lim, W.H.; Tan, N.M.L. A Modified Particle Swarm Optimization for Efficient Maximum Power Point Tracking Under Partial Shading Condition. IEEE Trans. Sustain. Energy 2023, 14, 1822–1834. [Google Scholar] [CrossRef]
- Gad, A.G. Particle Swarm Optimization Algorithm and Its Applications: A Systematic Review. Arch. Comput. Methods Eng. 2022, 29, 2831–2867. [Google Scholar] [CrossRef]
- Zhou, Y. The overall framework design of automatic logistics system using a hybrid ANN-PSO model. Eng. Comput. 2022, 38, 2515–2531. [Google Scholar] [CrossRef]
- Rojas, F. Hybrid SARIMAX–PSO Framework with Skew-Normal Residuals: Inventory Optimization in Clinical Laboratories. 2025. Available online: https://zenodo.org/records/16905668 (accessed on 11 September 2025).
- Robeson, S.M.; Willmott, C.J. Decomposition of the mean absolute error (MAE) into systematic and unsystematic components. PLoS ONE 2023, 18, e0279774. [Google Scholar] [CrossRef]
- Rahman, M.M.; Joha, M.I.; Nazim, M.S.; Jang, Y.M. Enhancing IoT-Based Environmental Monitoring and Power Forecasting: A Comparative Analysis of AI Models for Real-Time Applications. Appl. Sci. 2024, 14, 11970. [Google Scholar] [CrossRef]
- Mishra, V.; Sharma, P.; Khound, K. Global Supply Chain Shocks and Trade Resilience: A Review Post-Covid and Ukraine Crisis. J. Mark. Soc. Res. 2025, 2, 336–348. [Google Scholar] [CrossRef]
- Dare, J.; Patrick, A.O.; Oyewola, D.O. Comparison of stationarity on Ljung box test statistics for forecasting. Earthline J. Math. Sci. 2022, 8, 325–336. [Google Scholar] [CrossRef]
- Razghandi, M.; Khamehchi, E. Application of Particle Swarm Optimization and Genetic Algorithms to Oilfield Operational Optimization. J. Pet. Sci. Eng. 2021, 205, 108901. [Google Scholar] [CrossRef]
- Tani, L.; Veelken, C. Comparison of Bayesian and Particle Swarm Algorithms for Hyperparameter Optimization in High-Energy Physics Applications. Comput. Phys. Commun. 2022, 277, 108382. [Google Scholar] [CrossRef]
- Verma, P.; Chaturvedi, B.K. Comprehensive Analysis and Review of Particle Swarm Optimization Techniques and Inventory System. Int. J. Future Revolut. Comput. Sci. Commun. Eng. 2022, 8, 41–50. [Google Scholar] [CrossRef]
- Wang, H.; Li, Y.; Zhou, X. A Comparative Study of GA, PSO and SCE Algorithms for Pyrolysis Kinetics Modeling. Energy Mater. Sustain. Technol. 2023, 2, 9. [Google Scholar] [CrossRef]
- Knezevic, C.E.; Das, B.; El-Khoury, J.M.; Jannetto, P.J.; Lacbawan, F.; Winter, W.E. Rising to the Challenge: Shortages in Laboratory Medicine. Clin. Chem. 2022, 68, 1486–1492. [Google Scholar] [CrossRef] [PubMed]
- Tabish, S.A. Procurement Management in Health Care Systems. In Health Care Management: Principles and Practice; Springer: Singapore, 2024. [Google Scholar] [CrossRef]


| Study | Approach | Domain | Limitations |
|---|---|---|---|
| Tadayonrad & Ndiaye (2023) [4] | Forecasting with reliability and seasonality indicators | Supply chain analytics | No integration with metaheuristics; assumes Gaussian residuals |
| Basciftci et al. (2024) [10] | Two-stage stochastic programming with forecasting inputs | Capacity expansion | Complex optimization but limited domain-specific statistical modeling |
| Dwivedi (2025) [11] | PSO and heuristic methods for supply chains in health crises | Pharmaceutical logistics | Optimization only, lacks structured residual modeling |
| Li et al. (2023) [16] | MLP-based neural forecasting models | General time series forecasting | Accuracy but poor interpretability; limited transparency in clinical domains |
| Urjais Gomes et al. (2024) [13] | DeepAR neural forecasting | Healthcare-related univariate time series | High accuracy but black-box nature, low explainability |
| Sina et al. (2023) [17] | Systematic review of hybrid forecasting methods (ARIMA–LSTM, ARIMA–XGBoost, etc.) | Cross-sector forecasting | Not specific to healthcare; little integration with inventory policies |
| Bui & Hung (2023) [18] | LSTM forecasting of surgical procedures to support planning | Hospital operating rooms | Machine learning only; not integrated with inventory decisions |
| Vanbrabant et al. (2023) [19] | Review of integrated decision problems in hospital supply chains | Hospital supply chain management | Focuses on integration, not on hybrid forecasting or metaheuristics |
| Atcha, Vlachos & Kumar (2024) [20] | Systematic review of inventory sharing in healthcare (39 studies) | Healthcare supply chains | Addresses sharing mechanisms only; no hybrid forecasting–inventory link |
| Pathy & Rahimian (2023) [21] | Resilient inventory optimization under demand disruptions | Pharmaceutical supply chains | Optimization only; no hybrid demand models |
| Saha & Rathore (2024) [22] | Multi-agent reinforcement learning for medicine inventory with demand dependencies | Hospital pharmacy | Black-box nature; lacks explainability and skew/zero modeling |
| Sohrabi et al. (2023) [23] | Robust fuzzy–stochastic programming with GA+SA metaheuristics for blood banks (equity considerations) | Blood supply chain | Case-specific; no explicit demand forecasting |
| Ahmadi et al. (2022) [24] | Reinforcement learning (Q-learning, DQN) and GA for perishable pharmaceutical products | Healthcare supply chains | Simulation-based; no statistical–metaheuristic hybrid residual modeling |
| Li et al. (2020) [25] | Integrated strategy: hybrid forecasting + multi-period ordering for red blood cells | Blood banks | Preprint; limited clinical validation; no PSO or skew/zero residuals |
| Bandi, Han & Nohadani (2018) [26] | Robust periodic-affine policies for uncertain demand (applied to pharma retail) | Retail pharmaceutical supply | Not metaheuristic; older; no healthcare-specific hybrid forecasting |
| Item | Model | MAE | RMSE | MAEMLP |
|---|---|---|---|---|
| Lactic Acid | SARIMAX–SN | 14.66 | 16.91 | 54.98 |
| Urea | SARIMAX–SN | 83.43 | 107.38 | 106.21 |
| Valproic Acid | SARIMAX–SN | 9.67 | 11.56 | 7.05 |
| Albumin | SARIMAX–SN | 31.83 | 37.37 | 110.67 |
| Amylase | SARIMAX–SN | 14.66 | 17.75 | 216.82 |
| Ammonia | SARIMAX–SN | 1.67 | 1.96 | 4.52 |
| Direct Bilirubin | SARIMAX–SN | 268.53 | 291.49 | 279.15 |
| Total Bilirubin | SARIMAX–SN | 283.80 | 307.62 | 302.48 |
| Calcium | SARIMAX–SN | 88.33 | 104.99 | 132.64 |
| Carbamazepine | SARIMAX–SN | 4.63 | 5.37 | 6.71 |
| Total CK | SARIMAX–SN | 51.18 | 64.73 | 77.04 |
| CK-MB | SARIMAX–SN | 78.98 | 99.54 | 118.62 |
| HDL Cholesterol | SARIMAX–SN | 235.25 | 264.34 | 312.07 |
| Total Cholesterol | SARIMAX–SN | 268.55 | 309.61 | 347.91 |
| Creatinine | SARIMAX–SN | 372.62 | 445.61 | 511.38 |
| LDH | SARIMAX–SN | 50.24 | 63.75 | 82.11 |
| Plasma Electrolytes | SARIMAX–SN | 18.00 | 22.02 | 29.77 |
| Rheumatoid Factor | SARIMAX–SN | 25.00 | 31.60 | 41.92 |
| Phenytoin | SARIMAX–SN | 2.50 | 3.04 | 3.80 |
| Phenobarbital | SARIMAX–ZISN | 1.00 | 1.44 | 1.62 |
| Alkaline Phosphatase | SARIMAX–SN | 277.70 | 303.02 | 341.28 |
| Phosphorus | SARIMAX–SN | 72.84 | 84.27 | 102.13 |
| GGT | SARIMAX–SN | 190.46 | 202.71 | 239.66 |
| Glucose | SARIMAX–SN | 407.48 | 488.97 | 566.09 |
| Lipase | SARIMAX–SN | 19.28 | 22.84 | 29.53 |
| Lithium | SARIMAX–SN | 9.84 | 11.13 | 13.41 |
| Microalbuminuria | SARIMAX–SN | 113.75 | 145.06 | 181.72 |
| Urea Nitrogen (BUN) | SARIMAX–SN | 243.40 | 271.03 | 318.18 |
| C-Reactive Protein (CRP) | SARIMAX–SN | 103.15 | 119.44 | 148.31 |
| Total Proteins | SARIMAX–SN | 135.16 | 143.88 | 183.02 |
| CSF Proteins | SARIMAX–SN | 33.71 | 55.41 | 69.88 |
| AST (GOT) | SARIMAX–SN | 308.68 | 340.83 | 403.24 |
| ALT (GPT) | SARIMAX–SN | 307.64 | 338.90 | 401.77 |
| Triglycerides | SARIMAX–SN | 249.18 | 280.60 | 333.45 |
| Model | MAE | RMSE | Skew Sensitivity () |
|---|---|---|---|
| SARIMA (Gaussian residuals) | 126.3 | 151.7 | – |
| MLP (non-linear benchmark) | 136.25 | 156.31 | – |
| SARIMAX–SN/ZISN (ours) | 120.6 | 144.2 | 32 / 34 |
| Demand Level | MAE | RMSE |
|---|---|---|
| Low demand | 5.64 | 6.36 |
| Medium demand | 61.08 | 74.74 |
| High demand | 271.36 | 307.03 |
| Horizon | MAE | RMSE |
|---|---|---|
| 1 | 95.12 | 134.34 |
| 2 | 224.37 | 324.25 |
| 3 | 81.88 | 121.58 |
| 4 | 128.98 | 190.36 |
| 5 | 189.10 | 268.17 |
| 6 | 98.06 | 149.37 |
| Demand Level | MAPE (%) |
|---|---|
| Low demand | — |
| Medium demand | 10.99 |
| High demand | 9.34 |
| Item | |||
|---|---|---|---|
| Lactic Acid | 6 | 1320 | 1.1042 × 10⁶ |
| Urea | 12 | 10,560 | 3.8686 × 10⁶ |
| Valproic Acid | 0 | 0 | 1.2977 × 10⁵ |
| Albumin | 4 | 18,240 | 2.4389 × 10⁶ |
| Amylase | 19 | 4180 | 4.6866 × 10⁶ |
| Ammonia | 6 | 600 | 3.3714 × 10⁵ |
| Direct Bilirubin | 1 | 500 | 5.9327 × 10⁵ |
| Total Bilirubin | 4 | 2016 | 2.5705 × 10⁶ |
| Calcium | 6 | 31,512 | 5.9841 × 10⁶ |
| Carbamazepine | 0 | 0 | 2.0806 × 10⁵ |
| Total CK | 5 | 4600 | 1.6286 × 10⁶ |
| CK-MB | 2 | 800 | 5.0467 × 10⁵ |
| HDL Cholesterol | 6 | 6000 | 3.5444 × 10⁶ |
| Total Cholesterol | 7 | 51,240 | 8.5303 × 10⁶ |
| Creatinine | 8 | 62,720 | 8.6936 × 10⁶ |
| LDH | 7 | 2940 | 1.4554 × 10⁶ |
| Plasma Electrolytes | 5 | 200,000 | 1.5993 × 10⁷ |
| Rheumatoid Factor | 0 | 0 | 2.1741 × 10⁵ |
| Phenytoin | 0 | 0 | 1.3720 × 10⁵ |
| Phenobarbital | 1 | 200 | 1.0345 × 10⁵ |
| Alkaline Phosphatase | 7 | 3920 | 1.9445 × 10⁶ |
| Phosphorus | 5 | 31,400 | 7.4649 × 10⁶ |
| GGT | 5 | 2700 | 1.2014 × 10⁶ |
| Glucose | 8 | 73,920 | 1.9952 × 10⁷ |
| Lipase | 2 | 1560 | 2.3944 × 10⁶ |
| Lithium | 6 | 1356 | 1.6285 × 10⁷ |
| Microalbuminuria | 7 | 6720 | 5.5914 × 10⁶ |
| Urea Nitrogen (BUN) | 8 | 44,800 | 1.1041 × 10⁷ |
| C-Reactive Protein (CRP) | 3 | 600 | 7.6610 × 10⁵ |
| Total Proteins | 5 | 28,800 | 5.0090 × 10⁶ |
| CSF Proteins | 6 | 2700 | 2.4423 × 10⁶ |
| AST (GOT) | 7 | 4200 | 3.1010 × 10⁶ |
| ALT (GPT) | 7 | 4200 | 3.1197 × 10⁶ |
| Triglycerides | 6 | 33,840 | 7.6132 × 10⁶ |
| Policy | Average Monthly Cost (CLP million) |
|---|---|
| Empirical hospital policy | 179.5 |
| SARIMA baseline (Gaussian residuals) + PSO | 32.1 |
| Hybrid SARIMAX–SN/ZISN + PSO (proposed) | 19.6 |
| Particles | Iterations | w | c1c2 | PSO | Exact | Gap% | Feasible | L1 (k) | ShareQ | Time (s) |
|---|---|---|---|---|---|---|---|---|---|---|
| 20 | 100 | 0.90 | 1.20 | 5.03 | 11.38 | −55.80 | True | 19 | 0.20 | 0.06 |
| 20 | 300 | 0.90 | 1.20 | 5.03 | 11.38 | −55.80 | True | 19 | 0.20 | 0.17 |
| 50 | 100 | 0.90 | 1.20 | 5.03 | 11.38 | −55.80 | True | 19 | 0.20 | 0.14 |
| 50 | 300 | 0.90 | 1.20 | 5.03 | 11.38 | −55.80 | True | 19 | 0.20 | 0.34 |
| 100 | 100 | 0.90 | 1.20 | 5.03 | 11.38 | −55.80 | True | 19 | 0.20 | 0.28 |
| Particles | Iterations | w | c1c2 | PSO | Exact | Gap% | Feasible | L1 (k) | ShareQ | Time (s) |
|---|---|---|---|---|---|---|---|---|---|---|
| 20 | 100 | 0.50 | 1.80 | 11.38 | 11.38 | 0.00 | True | 0 | 1.00 | 0.06 |
| 20 | 300 | 0.50 | 1.80 | 11.38 | 11.38 | 0.00 | True | 0 | 1.00 | 0.17 |
| 50 | 100 | 0.50 | 1.80 | 11.38 | 11.38 | 0.00 | True | 0 | 1.00 | 0.14 |
| 50 | 300 | 0.50 | 1.80 | 11.38 | 11.38 | 0.00 | True | 0 | 1.00 | 0.34 |
| 100 | 100 | 0.50 | 1.80 | 11.38 | 11.38 | 0.00 | True | 0 | 1.00 | 0.28 |
Disclaimer/Publisher’s Note: The statements, opinions and data contained in all publications are solely those of the individual author(s) and contributor(s) and not of MDPI and/or the editor(s). MDPI and/or the editor(s) disclaim responsibility for any injury to people or property resulting from any ideas, methods, instructions or products referred to in the content. |
© 2025 by the authors. Licensee MDPI, Basel, Switzerland. This article is an open access article distributed under the terms and conditions of the Creative Commons Attribution (CC BY) license (https://creativecommons.org/licenses/by/4.0/).
Share and Cite
Rojas, F.; Yáñez, J.; Cortés, M. Hybrid Statistical–Metaheuristic Inventory Modeling: Integrating SARIMAX with Skew-Normal and Zero-Inflated Errors in Clinical Laboratory Demand Forecasting. Mathematics 2025, 13, 3001. https://doi.org/10.3390/math13183001
Rojas F, Yáñez J, Cortés M. Hybrid Statistical–Metaheuristic Inventory Modeling: Integrating SARIMAX with Skew-Normal and Zero-Inflated Errors in Clinical Laboratory Demand Forecasting. Mathematics. 2025; 13(18):3001. https://doi.org/10.3390/math13183001
Chicago/Turabian StyleRojas, Fernando, Jorge Yáñez, and Magdalena Cortés. 2025. "Hybrid Statistical–Metaheuristic Inventory Modeling: Integrating SARIMAX with Skew-Normal and Zero-Inflated Errors in Clinical Laboratory Demand Forecasting" Mathematics 13, no. 18: 3001. https://doi.org/10.3390/math13183001
APA StyleRojas, F., Yáñez, J., & Cortés, M. (2025). Hybrid Statistical–Metaheuristic Inventory Modeling: Integrating SARIMAX with Skew-Normal and Zero-Inflated Errors in Clinical Laboratory Demand Forecasting. Mathematics, 13(18), 3001. https://doi.org/10.3390/math13183001


