Abstract
This study developed and evaluated transformer-based models enhanced with inter-sentence attention (iAttention) mechanisms to improve the automatic grading of student responses to open-ended questions. Traditional transformer models emphasize intra-sentence relationships and often fail to capture complex semantic alignments needed for accurate assessment. To overcome this limitation, three iAttention mechanisms, including , and were proposed to enhance the model’s capacity to align key ideas between students and reference answers. This helps improve the model’s ability to capture important semantic relationships between words in two sentences. Unlike previous approaches that rely solely on aggregated sentence embeddings, the proposed method introduces inter-sentence attention layers that explicitly model semantic correspondence between individual sentences. This enables finer-grained matching of key concepts, reasoning, and logical structure which are crucial for fair and reliable assessment. The models were evaluated on multiple benchmark datasets, including Semantic Textual Similarity (STS), SemEval-2013 Beetle, SciEntsBank, Mohler, and a composite of university-level educational datasets (U-datasets). Experimental results demonstrated that integrating iAttention consistently outperforms baseline models, achieving higher Pearson and Spearman Correlation scores on STS, Mohler, and U-datasets, as well as superior Macro-F1, Weighted-F1, and Accuracy on the Beetle and SciEntsBank datasets. This approach contributes to the development of scalable, consistent, and fair automated grading systems by narrowing the gap between machine evaluation and human judgment, ultimately leading to more accurate and efficient assessment practices.
Keywords:
automated grading systems (AGS); attention mechanisms; machine learning in education; natural language processing (NLP) MSC:
68T07; 68T50
1. Introduction
Assessment plays a significant role in measuring the learning abilities of a student [1]. Academic examinations can be performed using many question types, including multiple-choice and free-response questions [2]. This study focuses on an automated free-response question grading system. A free-response question can be defined as a question that requires answers that allow the student to be more expressive. It can be a short or long answer, which can span from one phrase to one page. These answers are often given in natural language and also demonstrate knowledge gained from students’ understanding of the question and the subject [3]. Human assessment evaluations are predominantly used for free-response question tasks. One considerable challenge arises as the teacher-to-student ratio increases [4]; the manual assessment process becomes more complicated, leading to time-consuming issues since a single task must be repeated numerous times. This repetition may trigger the so-called “human factor”, particularly in assigning unequal notes/grades to the same answers from different students.
The educational system is shifting towards electronic learning (e-learning), which is web-supported, with computer-based exams and automatic evaluation playing a significant role. This e-learning is undeniably a rapidly developing area that goes beyond simple rule-based methods because a single question can receive more responses from students with different explanations. In automated free-response question grading, for every question given, student answers are compared to the reference answers, and a score is assigned using machine-learning techniques [5]. As assessment in the educational system is critical, it requires a more refined model, especially in terms of accuracy, because even a slight scoring error can have a big impact on the student(s) taking the assessment.
Many state-of-the-art deep-learning methods for automatic evaluation have been proposed with good scoring accuracy. This automatic evaluation is a crucial application related to the education domain that uses Natural Language Processing (NLP) and machine-learning techniques. The transformer model is one of the leading models to achieve a state-of-the-art result for automated free-response question grading using the idea of semantic textual similarity, but these approaches have predominantly focused on intra-sentence attention, which examines the relationships within a single sentence or document.
However, these approaches often fall short of capturing the semantic relationships between different sentences. In this study, a novel transformer-based model with a focus on inter-sentence attention mechanisms to guide the model in focusing on critical inter-sentence information, such as synonyms, hyponyms, metonyms, and antonyms, was proposed. This enhanced focus aims to improve the model’s accuracy in identifying semantic equivalences and differences between sentence pairs.
2. Related Works
The application of machine learning in educational settings has expanded to include the analysis of student behaviors and interactions [6]. Learning analytics play a crucial role in this domain by modeling student–staff engagement, offering insights to enhance educational practices [7]. The field of Automated Short Answer Grading (ASAG) has gained significant attention as an alternative to traditional manual grading, which is often time-consuming and prone to inconsistencies [8]. With advancements in NLP and deep learning, various automated approaches have been proposed, ranging from rule-based and statistical models to deep-learning architectures, such as Recurrent Neural Networks (RNNs), Long Short-Term Memory (LSTM) networks and Transformers [4,9,10].
Traditional ASAG systems primarily relied on lexical matching techniques and semantic similarity measures. Early studies utilized cosine similarity, Jaccard similarity, and latent semantic analysis (LSA) to compare student responses with reference answers [4]. However, these approaches struggled with synonymy, paraphrasing and deeper linguistic structures, leading to the development of more sophisticated techniques such as machine-learning and deep-learning models [10].
Recent advancements in NLP and deep-learning architectures have shown promising results in various tasks like machine translation, text summarization and text similarity tasks, particularly in applications such as Automatic Essay Scoring (AES) and ASAG. Transfer learning models have transformed ASAG performance, with models such as BERT, SBERT, RoBERTa, and XLNet showing state-of-the-art results in semantic similarity and grading [11,12]. These models employ self-attention mechanisms, allowing them to capture contextual relationships between words and sentences, leading to a more accurate assessment of student responses [2].
Transformer models, particularly Bidirectional Encoder Representations from Transformers (BERT) [13] and its variants have proven highly effective in ASAG. BERT’s self-attention mechanism allows it to process entire sequences bidirectionally, making it well-suited for sentence-pair regression tasks like semantic textual similarity (STS) and ASAG [14]. Several studies have explored fine-tuning pre-trained transformers for ASAG tasks.
Zhu et al. [11] proposed a four-stage framework for ASAG utilizing a pre-trained BERT model. In the first stage, BERT was used to encode both student responses and reference answers. Next, a Bi-directional Long Short-Term Memory (Bi-LSTM) network was applied to enhance semantic understanding from BERT’s outputs. In the third stage, the Semantic Fusion Layer combined these outputs with fine-grained token representations to enrich contextual meaning. Finally, in the prediction stage, a max-pooling technique was employed to generate the final grading scores. The study, conducted on the Mohler and SemEval datasets, demonstrated an accuracy of 76.5% for grading unseen answers, 69.2% for unseen domains, and 66.0% for unseen questions. Additionally, on the Mohler dataset, the model achieved a Root Mean Square Error (RMSE) of 0.248 and a Pearson Correlation Coefficient (R) of 0.89, indicating strong grading performance and reliability.
Sung et al. [15] focused on enhancing ASAG by developing contextual representations using BERT. The goal was to improve the efficiency of pre-trained BERT models by incorporating domain-specific resources. To achieve this, the work utilized textbooks from disciplines such as the physiology of behavior, American government, human development, and abnormal psychology to fine-tune BERT for the ASAG task. The empirical study demonstrated that task-specific fine-tuning significantly improved BERT’s performance, leading to more accurate and reliable grading results.
Lei and Meng [16] introduced a Bi-GRU Siamese architecture built on a pre-trained ALBERT model for improved text-similarity assessment. In this approach, input expressions were first converted into word vectors using ALBERT, which were then processed by a Gated Recurrent Unit (GRU) network. To enhance semantic understanding, the researchers incorporated an attention layer after the Bi-GRU network. Finally, the model’s output was normalized using a softmax function, transforming predictions into a probability distribution for better accuracy. These experimental results showed that the proposed model outperformed traditional approaches, achieving higher accuracy in text-similarity tasks.
Condor et al. [17] conducted a study comparing the effectiveness of Sentence-BERT (SBERT) with traditional techniques such as Word2Vec and Bag-of-Words. The findings revealed that SBERT-based models significantly outperformed those developed using older methods, demonstrating superior performance in capturing semantic meaning and improving automated grading accuracy.
Sayeed and Gupta [18] proposed a Siamese architecture for ASAG that evaluates descriptive answers by comparing student responses with reference answers. This method leverages RoBERTa bi-encoder-based Transformer models, designed to balance computational efficiency and grading accuracy. The model was trained on the SemEval-2013 two-way dataset and demonstrated either superior or equivalent performance compared to benchmark models, highlighting its effectiveness in ASAG tasks while remaining computationally feasible.
Bonthu et al. [19] proposed another method that involves using sentence transformers such as SBERT (Sentence-BERT), which modifies BERT to optimize semantic similarity tasks. This model fine-tunes sentence embedding and applies augmentation techniques such as random deletion, synonym replacement, and back translation to improve ASAG performance. This study demonstrated that combining text augmentation with fine-tuned SBERT led to a 4.91% accuracy improvement.
Wijanto et al. [3] present a novel approach to enhancing ASAG systems by integrating balanced datasets with advanced language models, specifically Sentence Transformers. The authors address the critical challenges of grading open-ended responses, emphasizing the importance of dataset balance to improve evaluation accuracy. Through comprehensive experimentation, the researchers demonstrated that their method significantly improves grading-performance metrics such as Pearson Correlation and RMSE while also maintaining computational efficiency. The findings indicate that combining simpler models with strategic data augmentation can achieve results comparable to more complex approaches, making ASAG systems more practical for educational settings. The study highlights future research directions, including exploring additional data augmentation techniques and addressing ethical considerations in model deployment. Overall, this work contributes valuable insights to the ASAG field, supporting the potential for broader implementation in educational assessments.
Kaya et al. [20] present a novel hybrid approach for ASAG by utilizing Bidirectional Encoder Representations from Transformers (BERT), combined with a customized multi-head attention mechanism and parallel Convolutional Neural Network (CNN) layers. The model addresses the challenges of grading short answers in distance education, demonstrating improved accuracy and meaningful understanding of student responses. The proposed system outperforms existing models evaluated on well-known datasets, showcasing its effectiveness in providing reliable and efficient assessments essential for modern educational environments.
Badry et al. [21] introduce an automatic Arabic grading system for short-answer questions and use NLP techniques to assess student responses, including text preprocessing, feature extraction, and semantic similarity analysis between student and model responses. The system is trained on a collected dataset, which differentiates it from studies using Kaggle data. The authors use machine-learning algorithms for grading and validate the system through experimental evaluation, although they successfully achieved a greater accuracy. The study advances Arabic-language automated assessment and opens the way for future deep-learning improvements.
Existing ASAG methods have primarily relied on single-sentence or document representations, limiting their ability to compare longer, more complex responses. Most Transformer-based grading models focus on self-attention within individual sentences (intra-sentence attention) but fail to establish relationships between multiple sentences within a student’s response. To address this gap, Inter-Sentence Attention (iAttention), a novel mechanism that extends attention beyond single-sentence representations, was proposed. Unlike conventional models that process each sentence independently, iAttention captures dependencies between multiple sentences or documents, improving grading accuracy in free-response evaluations. This technique enhances contextual understanding and better aligns to student responses with reference answers by considering relationships across the entire response rather than isolated sentences. The iAttention model incorporates hierarchical inter-sentence attention layers, ensuring that sentence-level coherence and interdependencies are captured before producing a final grading prediction. By integrating this mechanism, iAttention allows the model to understand discourse structure, improving grading accuracy over traditional BERT-based approaches.
3. Materials and Methods
3.1. Preliminaries-Formulation of the Problem
Given two sentences and , being the reference answers and student answers, respectively, the aim was to measure how related these two sentences are, which can be expressed as a function and can be treated as a regression task. So, can be written as and , where represents the token in both sentences and represent the length of the words in , respectively. According to Caciularu et al. [22], the model working on multiple documents concatenates all the documents into one long sequence of tokens and encodes them jointly. Similarly, in the STS task, models usually concatenate the two sentences together for processing with a specific token to form a final input of
represents the start token, and represents the separator. Following this problem formulation, this study explores the approach of integrating inter-sentence attention mechanisms within Transformer-based models. The idea uses a multi-head attention mechanism for the intra-sentence attention between and and introduces a novel inter-sentence attention mechanism to measure the relationship between the words of the two sentences. This approach leverages pre-trained models like BERT, RoBERTa [23], and Longformer [24], and the model was used for Automatic Essay Scoring.
3.2. An Overview of iAttention-Sentence Architectures
This model uses as it inputs into a pre-trained model to obtain its input embeddings for the model. The model uses both inter-sentence and intra-sentence attention mechanisms to improve the accuracy of identifying semantic equivalences and semantic differences between two sentences, as shown in Figure 1. The intra-sentence leverages the multi-head self-attention mechanisms, while for the inter-sentence attention, three methods to improve the weights between sentences and were proposed.
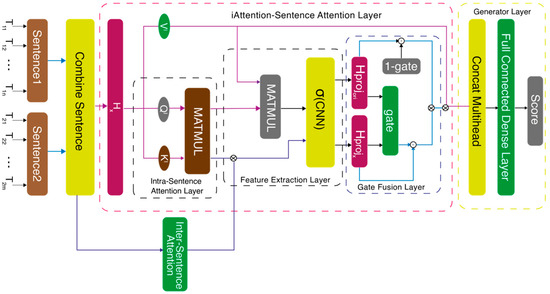
Figure 1.
iAttention-sentence transformer architectures.
3.3. Compute Self-Attention Scores
From the formulation of the problem, can be passed in a pre-trained model, which will be used to compute the intra-sentence attention scores. Let represent the output, which is the hidden states of the pre-trained model. So, following the standard computation process of the transformer model, can be projected into Query and Key using a linear transformation, which can be expressed as . The intra-sentence attention scores can be computed as
where , , and . , is the number of attention heads, and is the dimension of the word embedding.
3.4. Compute Inter-Sentence and Intra-Sentence Attention Scores
Three methods were proposed to give more weight between sentences. The first method used TF-IDF to design an attention score to show how relevant a word in a sentence is in another sentence [25] and the model is named . The second method used the WordNet database [26], which helps to calculate the strength of semantic relationships between words, and the model is named . The third method represents the semantic relationships in the second method as a graph in which the word is treated as a vertex and the semantic score as edge weights, and the model is named .
3.4.1. Attention Scores
The idea of Term Frequency-Inverse Document Frequency (TF-IDF) is used to enhance the intra-sentence attention score by giving each word more relevance to how important the word is in the sentence or document. In addition to the TF-IDF, a direct method of inter-sentence attention score was used to make the model learn more information about each sentence. was produced as shown in Figure 2a. The can be expressed as:
where are tokens from the two sentences . represents the term frequency-inverse document frequency weight between token and token . The value 2 was used to emphasize inter-sentence interactions, boosted the importance of repeated terms, and a default score of 1 was assigned for all other cases.
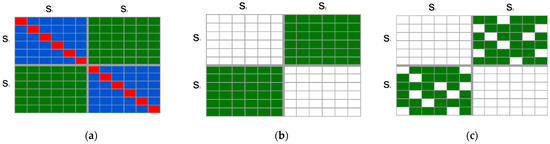
Figure 2.
Visualization of inter-sentence attention score matrices between two sentence groups, S1 and S2. (a) TF-IDF-based inter-sentence similarity (). (b) WordNet-based inter-sentence similarity (. (c) WordNet-based similarity with graph weighting (). Each matrix illustrates the degree of semantic alignment across sentence pairs, where denser regions indicate stronger similarity under each method.
Figure 2a shows TF-IDF-based inter-sentence similarity (), where the attention score in red color represents the TF-IDF of each token, the ones in green represent the inter-sentence attention score between sentences and or sentences and , and one blue color represents the intra-sentence attention of or . Furthermore, the weights are computed as follows:
where denotes element-wise multiplication and
3.4.2. Attention Scores
WordNet is a lexical database for word semantic similarity, accounting for over 100,000 English words. The idea is to measure the semantic relationships between some selected token pairs in which are semantically related and increase their attention weights to guide the model to pay more attention to the tokens strongly related by synonyms, hyponyms, metonyms, and antonyms. This algorithm considers the inter-sentence similarity between tokens in sentence 1 and sentence 2. and are semantically measured based on synonyms, antonyms, or if the two sentences are the same according to the WordNet database. So, the strength of their relationship ranges from 0 to 1, i.e., based on a method proposed by [25]. Following this, matrix was constructed as shown in Figure 2b which can be defined as
and represent the length of and , respectively; denotes the Least Common Subsumer of the two words; and and denote the number of paths between the concept of the term and the ontology root. The weights were computed as follows:
where denotes element-wise multiplication and
3.4.3. Attention Scores
This approach employs the introduced in Equation (8), where semantic similarities are used to construct a graph by treating each word as a vertex and the similarity scores as edge weights. The resulting graph is then interpreted as a spatial structure, as illustrated in Figure 3. To enhance the graph’s quality and to minimize noise, only strong and semantically meaningful connections are retained, while weaker connections, which may obscure more significant relationships, are pruned. Specifically, edges with similarity scores below a predefined threshold ε are discarded, as shown in Figure 2c. The threshold ε is a tunable hyperparameter, empirically set within the range 0 ≤ ε ≤ 0.9, based on experimental validation to balance sparsity and semantic richness. Closeness centrality is now used to analyze a network’s structural properties and patterns. The node centrality in the graph measures the node’s importance. Closeness centrality measures how close a node is to all other nodes in a graph. Closeness centrality of a node can be defined as
denotes the shortest path distance between , and is the number of nodes.
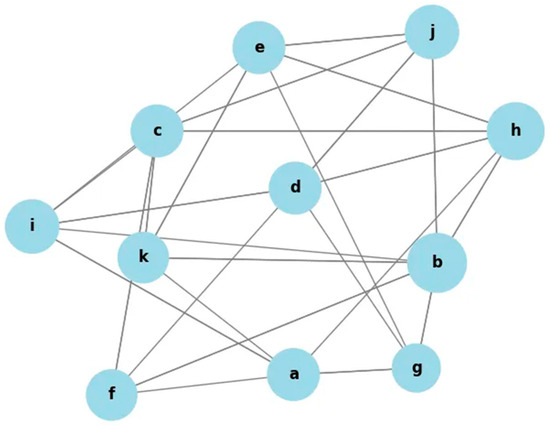
Figure 3.
Graph Representation Weights >= .
Now, the closeness centrality for each node in the graph is calculated. The next step is to calculate the which is given as
where denotes element-wise addition.
3.5. Feature Extraction Layer
In this layer, two modules were presented. One was the multi-head attention module for both original heads which is denoted as , and the other was the iAttention head denoted as . The second module was the convolutional neural network module for extracting meaningful information.
3.5.1. Compute Multi-Head Attention Mechanisms
The multi-head attention output can be obtained as follows:
where denotes one of the three inter-sentence attention scores (i.e., , , and ) and .
3.5.2. Convolutional Neural-Network Processing
The Convolutional Neural Network (CNN) helps in extracting essential features from the multi-head attention mechanism layer, specifically the outputs of which are passed through CNN layers. This step helps in capturing local patterns and interactions within the sequences. This can be represented mathematically as
denotes several filters across the sequence to extract higher-level features.
3.5.3. Gated Fusion
The output of the layers were projected:
A novel gated fusion mechanism was introduced to combine the features extracted from the CNN layers, learning to selectively emphasize certain features while suppressing others, based on their importance to the task. Let be the final fused output:
where denotes the sigmoid function, and are the weights and biases of the gated mechanism, denotes element-wise multiplication, and denotes element-wise addition. is the pooled layer of the pre-trained model. was concatenated and represented as
where represents the number of attention heads, and represents the parameters of the linear layer. Finally, was passed into a linear layer.
4. Experiment
4.1. System Overview
Figure 4 illustrates the automated grading pipeline employed in this study. The process begins with reference answers and student responses extracted from the training dataset. The choice of the pretrained model depends on the length of the dataset; for shorter responses, BERT or RoBERTa is used. In contrast, Longformer is preferred for longer responses because it can handle extended sequences efficiently. These models generate vector embedding, capturing the contextual relationships between reference and student responses. The embedding is then processed through an inter-sentence attention mechanism, enhancing semantic understanding and alignment. The generator layer subsequently predicts student scores based on the refined representations. To evaluate the model’s performance, various metrics, including Pearson Correlation (PC), Spearman Correlation (SC), Macro-F1, Weighted-F1, Accuracy, and Root Mean Square Error (RMSE), were employed, with the selection of metrics dependent on the specific dataset used.
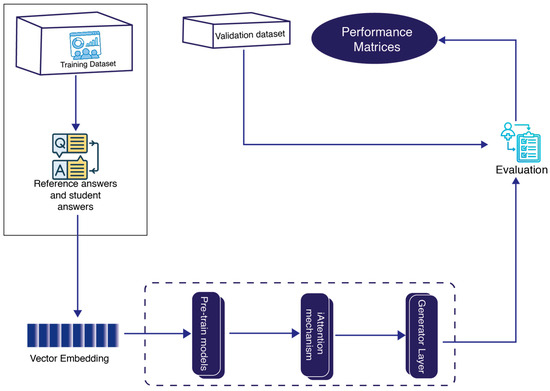
Figure 4.
Automated grading pipeline with inter-sentence attention mechanism.
4.1.1. Datasets
The dataset used in this study was grouped into two publicly available datasets, containing the STS, which is a benchmark dataset for STS tasks, SemEval-2013 Beetle, SciEntsBank, and Mohler datasets for an automated grading system. In contrast, the other group dataset was generated from the lecturer’s questions, mark guide, and students’ answers (U-datasets) for the automated grading system. The details about the datasets are presented in the following subsection.
4.1.2. Semantic Textual Similarity Dataset
Muennighoff [27] provides a comprehensive summary of benchmark datasets for text embedding, including STS datasets, which are sentence pairs that aim to determine their similarity. The labels for these datasets are continuous scores with higher numbers indicating that the sentences are more similar. Seven datasets named STS-12, STS-13, STS-14, STS-15, STS-16, STS-B, and SICK were selected and used for this study due to the language in which they are presented, which is English. The datasets are publicly available at “https://huggingface.co/datasets (accessed on 28 July 2024)”.
4.1.3. SemEval-2013 Beetle, SciEntsBank, and Mohler Datasets
The Beetle dataset was divided into training and test sets for both two-way and three-way classification. In the training set, there were 47 unique questions and a total of 3941 student answers. The test set was split into “Unseen Answers” and “Unseen Questions.” The “Unseen Answers” section includes 47 questions with 439 student answers, while the “Unseen Questions” section contains 9 new questions with 819 answers. There are 135 questions and 4969 answers in the train data set of SciEntsBank (two-way, three-way, and five-way) datasets. The test data set consists of three parts: “Unseen Answers”, “Unseen Domains”, and “Unseen Questions”. There are 135 questions and 540 answers in the “Unseen Answers” section; 46 questions and 4562 answers in the “Unseen Domains” section; and 15 questions and 733 answers in the “Unseen Questions” section. The Mohler dataset contains 79 questions and 2273 student answers. Two educators scored the answers between 0–5. In the data set, the averages of the two educators are available along with their grades. The datasets are publicly available at semeval-2013-task7/semeval-5way.zip at main myrosia/semeval-2013-task7.
4.1.4. U-Datasets
A comprehensive dataset that contains student answers to open-ended questions collected from students at Covenant University during the 2022/2023 academic session was provided by [28]. It includes responses from two courses: Management Information Systems (MIS221) and Project Management (MIS415). The dataset comprises approximately 3000 handwritten responses, with a sample shown in Figure 5a. These responses were scanned and transcribed into a structured digital format. Students provided handwritten responses to the open-ended questions, which were subsequently scanned using a high-resolution scanner. Data entry personnel ensured that each scanned answer was carefully transcribed into Microsoft Word documents. This meticulous transcription process was critical for accurately capturing student responses before structuring the dataset.
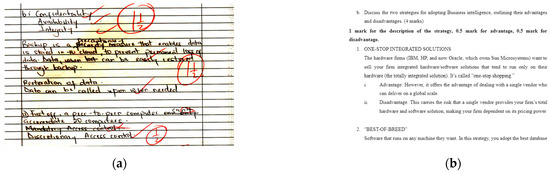
Figure 5.
Examples of raw materials used in model development and evaluation. (a) Handwritten student responses. (b) Marking guide with scoring criteria.
The responses were graded by experienced educators using the Question Marking Guide, with a sample shown in Figure 5b, to ensure a consistent and standardized assessment process. To further enhance grading objectivity, a vetting process involved a second reviewer who validated the scores assigned by the primary grader, reinforcing the reliability of the grading criteria. The token length across the dataset varies significantly among different components. In the MIS415 student answers, the token count ranges from 1 token (shortest) to 527 tokens (longest), while the MIS415 marking guide contains responses ranging from 1 token to 515 tokens. Similarly, the MIS221 student answers have a token count between 1 and 275 tokens, whereas the MIS221 marking guide ranges from 10 tokens (shortest) to 302 tokens (longest). Another outlet has accepted the full dataset description manuscript, which has not yet been published.
4.2. Base Model and Performance Metrics
This study leveraged pre-trained models, BERT-Base and RoBERTa-Base, by initializing their parameters to fine-tune the iAttention transformer for the STS, SemEval-2013 Beetle, SciEntsBank, and Mohler datasets, and it was compared to some baseline models. The Longformer pre-trained model was used as a base model for the iAttention transformer on U-datasets.
Performance Metrics
The proposed models were evaluated using different approaches depending on the datasets. Pearson Correlation (PC) and Spearman Correlation (SC) were the measurement metrics for the STS, U-dataset, and Mohler datasets. Macro-F1, Weighted-F1, and Accuracy were used for the SemEval-2013 Beetle and SciEntsBank datasets.
Pearson Correlation (PC): Pearson Correlation evaluates the linear relationship between two variables, typically predictions and true scores. Given a set of predictions and true scores , Pearson Correlation is defined as
where and are the means of and , respectively.
Spearman Correlation (SC): Spearman Correlation measures the monotonic relationship between two variables, evaluating rank rather than absolute differences. SC is defined as
where is the difference between the ranks of corresponding variables, and is the number of observations.
Macro F1 (M-F1): Macro-F1 averages F1 scores across all classes, treating each class equally. For a multi-class problem with classes, M-F1 is given as
Weighted-F1 (W-F1): Weighted-F1 considers the frequency of each class, balancing performance in imbalanced datasets. The formula is
where is the number of instances in the class , and is the total number of instances.
Accuracy (Acc): Accuracy measures the ratio of correct predictions over the total predictions.
Absolute score difference (ASD): This metric captures the absolute deviation of model predictions from true scores, giving insights into the degree of prediction error. Given predictions and true scores ,
4.3. Experimental Settings
All experiments were conducted on a machine with a 1 NVIDIA A10 Tensor Core graphics card (GPU), 32 vCPUs, 128GB of RAM, and Pytorch platforms. All experiments used an early stopping technique during training. Other hyperparameters used for training all the models are presented in Table 1.

Table 1.
Hyperparameters for iAttention-sentence transformer.
5. Results and Discussion
5.1. Benchmark Results
This section presents and discusses the experimental results obtained across five benchmark datasets: the STS benchmark, SciEntsBank, SemEval-2013 Beetle, Mohler, and U-datasets. The evaluation metrics vary based on task type and include Pearson Correlation (PC), Spearman Correlation (SC), Accuracy (Acc), Macro-F1 (M-F1), Weighted-F1 (W-F1), and Root Mean Square Error (RMSE). Five experiments were carried out on all datasets with the same hyperparameter settings, and their average was reported.
In the variant, the threshold parameter ε specifies the minimum semantic similarity score required to consider a pair of textual inputs semantically close. To determine an appropriate value, preliminary experiments were conducted, systematically varying ε within the range [0.1, 0.9]. The experimental results consistently indicated that ε = 0.4 achieved the most favorable performance across the development datasets, offering a balanced trade-off between strictness and tolerance. Based on these findings, ε was fixed at 0.4 for all experiments involving . This setting was used consistently throughout the subsequent evaluation and result reporting.
5.1.1. STS Benchmark Results
Table 2 reports the performance of seven STS datasets using both BERT-based and RoBERTa-based models. The proposed iAttention-enhanced variants substantially outperformed the existing baseline models. Within the BERT-based models, -BERT and -BERT (ε = 0.4) yielded the highest Pearson and Spearman Correlations across multiple datasets. For instance, -BERT achieved a Pearson Correlation of 92.58 and Spearman Correlation of 87.23 on STS12, while -BERT (ε = 0.4) attained 94.20 and 89.40 for STS-B, respectively, outperforming strong baselines like dictBERT, BERT-sim, and DisBERT.
Table 2.
Performance evaluation and comparisons for 7 STS dataset.
The RoBERTa-based iAttention models continued this trend, achieving new state-of-the-art results. -RoBERTa (ε = 0.4) reached the highest performance across nearly all datasets, with top scores such as PC = 94.20 for STS-B and PC = 91.23 for SICK. These results validate the ability of iAttention models to capture semantic alignments more effectively than conventional transformer architectures, offering improved generalization and robustness for semantic similarity tasks.
5.1.2. SciEntsBank Dataset Results
Performance on the SciEntsBank dataset was presented in Table 3 and evaluated under both two-way and three-way classification settings across the three types (UA, UQ, UD). The iAttention-based models demonstrated superior performance in all cases. With the two-way setting, -BERT achieved the highest Accuracy of 0.828 and a Macro-F1 of 0.823 for UA, outperforming all classical and transformer-based baselines. In the more challenging three-way classification setting, -BERT retained high performance with Accuracy of 0.690, a Macro-F1 of 0.662 and Weighted-F1 of 0.664 on the UD subset, surpassing existing methods including TF+SF, XLNet, and RoBERTa-lrg-vl.
Table 3.
Performance evaluation of Sci-EntBanks.
These findings indicate the robustness of the proposed inter-sentence attention mechanisms, particularly in handling varied and ambiguous student responses. The marginal performance drop under the three-way classification compared to the two-way setting, as seen in iAttention models, further highlights their stability and semantic sensitivity.
5.1.3. SemEval-2013 Beetle and Mohler Dataset Results
The results presented here were compared with Tf-Idf [9], Lesk [9,10,12,19], Mohler et al. [29], TF+SF [without question] [30], TF+SF [with question] [30], BERT Regressor + Similarity Score [31], XLNet [32], CoMeT [33], ETS [34], Roberta-large-vl [18], SoftCardinality [35], and UKP-BIU [20]. Table 4 present results on the SemEval-2013 Beetle dataset that reinforce the efficacy of the proposed models. Under the two-way classification setup, -BERT (ε = 0.4) achieved the best performance with Macro-F1 scores of 0.872 (UA) and 0.783 (UQ), outperforming [20] and other transformer-based models. Under the three-way classification, the iAttention models retained their advantage, with -BERT (ε = 0.4) again outperforming all other methods, achieving a Macro-F1 of 0.666 and Weighted-F1 of 0.657 on UQ, an area where traditional models like ETS and UKP-BIU show marked declines.
Table 4.
Performance evaluation of SemEval-2013 Beetle.
Table 5 presents results on the Mohler dataset, evaluated using Pearson Correlation and RMSE. The proposed -BERT achieved the highest correlation score (PC = 0.840) and the lowest RMSE (0.650), significantly outperforming strong models when compared to models presented in other iAttention variants, including -BERT and -BERT. It also surpassed all baseline methods, demonstrating the model’s capability to provide accurate numeric predictions aligned with human grading. These results confirm that the iAttention Transformer effectively captures meaningful semantic relationships essential for short-answer scoring.
Table 5.
Performance evaluation and comparisons on the Mohler dataset.
5.1.4. U-Datasets Results
This section presents the experimental results on the U-datasets, which include the Student Grade Dataset MIS221 (SGDM221), Student Grade Dataset MIS415 (SGDM415), and their combined version, Combined SGDM (CSGDM). The results represent the average performance over five independent experiments conducted under identical hyperparameter settings, as described in Table 1. The only modification was the maximum sequence length, which was set to 512 tokens for BERT and RoBERTa. Table 6 provides a comparative evaluation of the different models, demonstrating the effectiveness of iAttention-enhanced Longformer models for automated grading. The results indicate that Longformer-based models significantly outperform traditional transformer models, such as BERT, SBERT, and RoBERTa. For SGDM221, BERT achieved a Pearson Correlation (PC) of 51.06 and a Spearman Correlation (SC) of 52.78, while RoBERTa showed a slight improvement with 51.89 PC and 53.06 SC. SBERT, however, outperformed both, achieving 60.67 PC and 61.65 SC, indicating a stronger ability to capture sentence-level semantic relationships. Despite these improvements, Longformer exhibited a substantial performance boost, reaching 70.89 PC and 73.90 SC on SGDM221. Further enhancements were observed with iAttention-based Longformer models, which introduced attention mechanisms to improve contextual understanding. The -Longformer model achieved 75.29 PC and 78.50 SC on SGDM221, while the -Longformer further improved the results to 81.78 PC and 82.45 SC, demonstrating the effectiveness of word-level attention in refining predictions. The best overall performance was obtained using -Longformer (ε = 0.4), which achieved 81.00 PC and 81.60 SC for SGDM221. This model also performed exceptionally well for SGDM415, reaching 84.08 PC and 85.69 SC, and it maintained its superior performance for CSGDM, where it achieved 83.56 PC and 84.79 SC. These results reinforce the effectiveness of iAttention mechanisms, which improve the model’s ability to focus on key information and understand semantic relationships in student responses. By capturing inter-sentence dependencies, iAttention-enhanced Longformer models deliver more accurate and reliable grade predictions that closely align with human assessments. The superiority of Longformer-based models, particularly those incorporating iAttention, demonstrates their potential for advancing automated grading systems. The results for the SGDM221, SGDM415, and CSGDM datasets confirm the robustness of the proposed approach.
Table 6.
Performance evaluation and comparisons of U-datasets.
5.2. Statistical Significance Analysis
To assess the reliability of the proposed models, statistical significance tests were conducted to compare their performance against other competitive baseline models. The paired t-test was applied to determine whether the observed improvements obtained in the results in Section 5.1 were statistically meaningful. This test evaluates whether the mean difference between two paired samples is statistically significant, providing insights into the effectiveness of the proposed approach. Among the three proposed iAtttention variants, the -variant was selected as the primary model for comparison due to its consistent performance across datasets.
In Table 7, -RoBERTa is compared against a wide range of STS baselines across all seven tasks. The results indicate that improvements in the Pearson Correlation (PC) and Spearman Correlation (SC) are statistically significant in nearly all comparisons. For instance, p-values against strong baselines such as BERT (PC = 0.008179, SC = 0.000339) and SemBERT (PC = 0.000348, SC = 0.000223) fall well below the conventional 0.05 threshold, confirming the robustness of the observed performance gains. Even against other competitive variants like -RoBERTa, significance is retained in most cases, reinforcing the advantage of using iAttention with confidence weighting.
Table 7.
Statistical significance analysis for STS tasks.
Table 8 presents the t-test outcomes for the SciEntsBank dataset, comparing –BERT (ε = 0.4) with prior baselines in terms of Accuracy, Macro-F1, and Weighted-F1. Statistically significant differences were observed for all major models, including CoMET, ETS, and XLNet, with p-values consistently below 0.05. For example, the difference in Accuracy compared to CoMET is significant at p = 0.005173, and Macro-F1 compared to ETS yields p = 0.008321. Comparisons with other iAttention variants such as –BERT and –BERT also show significance in Macro- and Weighted-F1, indicating the impact of the iAttention model.
Table 8.
Statistical significance analysis for SciEntsBank.
In Table 9, the proposed –BERT (ε = 0.4) model is compared against various baselines of the SemEval-2013 Beetle dataset. The model consistently achieves statistically significant improvements in Macro-F1 across most baselines, including CELI (p = 0.005025), CNGL (p = 0.013998), and LIMSILES (p = 0.001275). Although the improvements in Weighted-F1 are not always statistically significant, for instance, p = 0.362140 against CoMET, both remain competitive and highlight the strength of the proposed model, particularly in terms of class-balanced metrics. Comparisons with other iAttention variants such as –BERT and –BERT show that –BERT (ε = 0.4) performs significantly better in terms of Macro-F1, confirming the value of iAttention.
Table 9.
Statistical significance analysis for SemEval-2013 Beetle.
Table 10 further substantiates these findings using the U-datasets (SGDM221, SGDM415, and CSGDM). The proposed –Longformer (ε = 0.4) outperforms all baselines with statistically significant differences in Pearson and Spearman Correlations.
Table 10.
Statistical significance analysis for U-Datasets.
For example, it achieves p = 0.000882 (PC) and p = 0.000029 (SC) against BERT, and similarly significant improvements against SBERT, RoBERTa, and Longformer, with all p-values under the 0.05 threshold. Even when compared with other strong attention variants such as –Longformer, the proposed model maintains a significant edge (PC: p = 0.011591). These results affirm that the performance gains reported throughout the experiments are not only consistent but also statistically robust, validating the practical effectiveness of inter-sentence attention mechanisms in automated grading and semantic similarity tasks.
5.3. Performance Analysis of Models
The results presented in the box plots and bar charts provide a comprehensive evaluation of various models across all experimental tasks, including STS, SciEntsBank, SemEval-2013 Beetle, Mohler Dataset, and U-Datasets. The primary focus is on the effectiveness of iAttention-enhanced models compared to traditional BERT, RoBERTa, and Longformer-based approaches.
The performance across the STS tasks, as shown in Figure 6 (PC Scores) and Figure 7 (SC Scores), reveals that iAttention-based models consistently achieve higher Pearson Correlation (PC) and Spearman Correlation (SC) scores compared to baseline transformer models. -RoBERTa (ε = 0.4) and -RoBERTa demonstrate superior semantic understanding, outperforming models such as BERT, unsup-SimCSE, and RoBERTa, which exhibit higher variability. The presence of lower quartiles and outliers in models like DisBERT and unsup-SimCSE indicates inconsistency in capturing textual relationships across datasets.
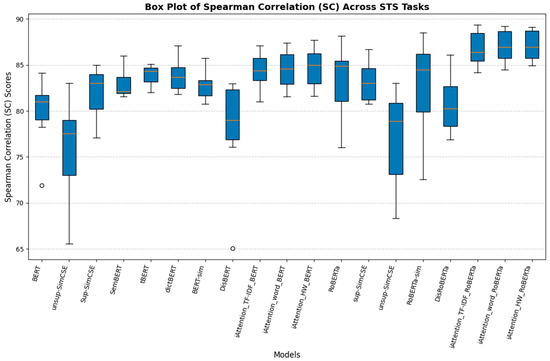
Figure 6.
Box plot of Pearson Correlation (PC) scores across STS tasks.
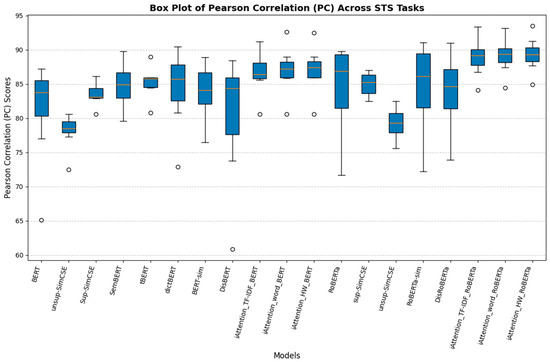
Figure 7.
Box plot of Spearman Correlation (SC) scores across STS tasks.
On the SciEntsBank dataset, the Accuracy, Macro-F1, and Weighted-F1 score distributions further validate the superiority of iAttention models. Figure 8 (Accuracy scores), Figure 9 (Macro-F1 scores), and Figure 10 (Weighted-F1 scores) illustrate that traditional models such as CoMeT, ETS, and SOFTCAR show considerable variance in grading consistency, while -BERT (ε = 0.4) and -BERT exhibit stability with consistently higher Accuracy and F1 scores. The ability to generalize effectively across various student responses demonstrates the robustness of iAttention-based approaches.
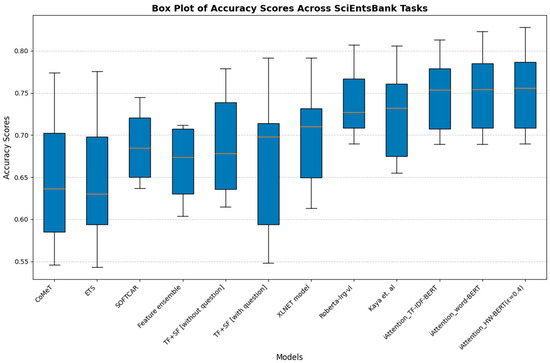
Figure 8.
Box plot of Accuracy scores across SciEntsBank tasks.
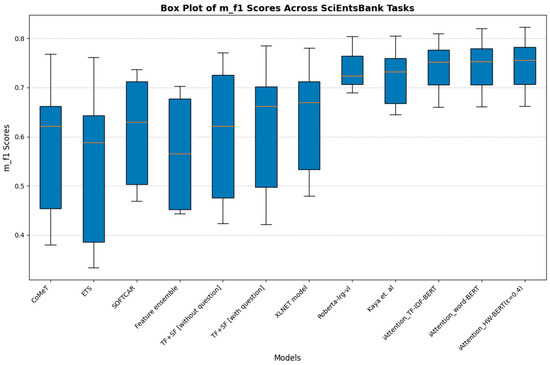
Figure 9.
Box plot of Macro-F1 scores across SciEntsBank tasks.
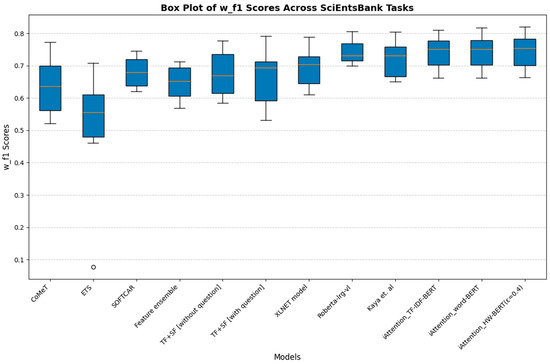
Figure 10.
Box plot of Weighted-F1 scores across SciEntsBank tasks.
The results from the SemEval-2013 Beetle dataset reinforce the trend observed in the SciEntsBank evaluation. Figure 11 (Weighted-F1 Scores) and Figure 12 (Macro-F1 Scores) indicate that traditional feature-based grading models, including CELI and CoMeT, struggle with grading consistency. Meanwhile, UKP-BIU and SoftCardinality show slight improvements, but they do not match the performance of the iAttention models. The lower variance and higher median values of -BERT and -RoBERTa confirm their effectiveness in automated short-answer grading.
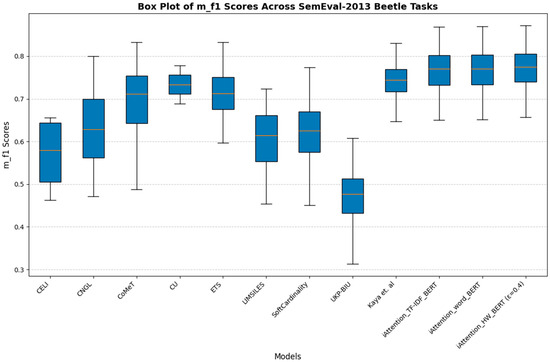
Figure 11.
Box plot of Weighted-F1 scores across SemEval-2013 Beetle tasks.
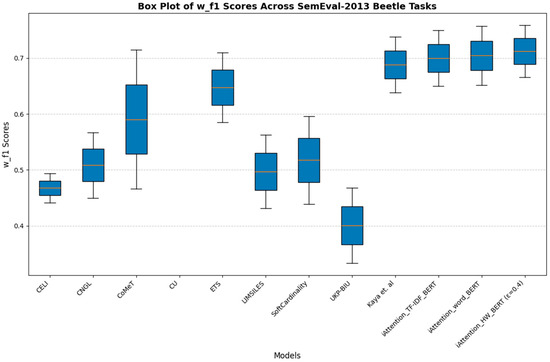
Figure 12.
Box plot of Macro-F1 scores across SemEval-2013 Beetle tasks.
The performance of the Mohler dataset, as depicted in Figure 13, shows that iAttention-based models achieve the highest Pearson Correlation scores while maintaining the lowest Root Mean Square Error (RMSE). Traditional methods such as TF-IDF, Lesk, and Mohler et al. exhibit lower correlation scores, indicating weaker semantic representation in grading. While BERT-based regressors improve upon these baselines, -BERT (ε = 0.4) delivers the best performance, highlighting the impact of hierarchical attention mechanisms.
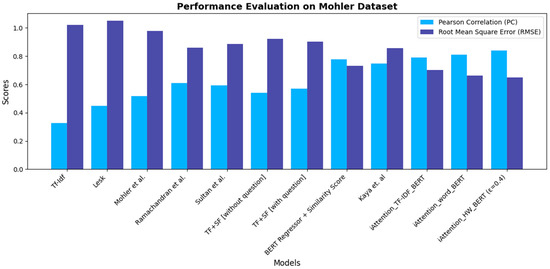
Figure 13.
Performance evaluation bar chart for Mohler dataset.
The evaluation on U-Datasets across SGDM221, SGDM415, and CSGDM confirms the advantages of iAttention models in handling complex textual data. Figure 14 presents a stacked bar chart comparing PC and SC scores across different models. Longformer-based models outperform BERT, SBERT, and RoBERTa, particularly when analyzing longer textual responses. The inclusion of hierarchical and word-level attention mechanisms in iAttention models further enhances performance, with -Longformer (ε = 0.4) achieving the highest correlation scores across all datasets. The results demonstrate that transformer-based grading approaches with enhanced attention mechanisms offer significant improvements compared to traditional models.
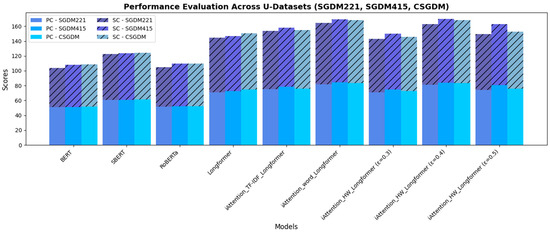
Figure 14.
Performance evaluation across U-Datasets.
Overall, iAttention-enhanced models consistently outperform standard transformer models across multiple benchmarks. The integration of hierarchical attention significantly improves grading Accuracy, particularly in long-form textual responses. STS, SciEntsBank, and SemEval-2013 Beetle evaluations confirm the superiority of iAttention-based approaches in capturing semantic relationships and improving automated grading performance. The results further indicate that Longformer-based models, particularly -Longformer (ε = 0.4), provide the best performance in student grading tasks, demonstrating their capability to handle complex answer structures.
The findings confirm that iAttention-based models are highly effective in automated grading, achieving higher correlation scores, reduced RMSE, and improved F1 scores across multiple benchmark datasets. These advancements reinforce the potential of attention-based architectures in enhancing automated grading systems, ensuring fair, consistent, and scalable assessment processes.
5.4. Comparison of Results with Expert Scores
Having been trained on the U-Dataset, the results of these iAttention-sentence Transformers must be evaluated to determine their usefulness in the real-world grading process. The evaluation process involves selecting two models to determine to what degree the score generated from the models best satisfies human intuitions. This section compares the results of the iAttention-sentence Transformers and experts’ opinions using Pearson Correlation (PC), Spearman Correlation (SC), and absolute score differences (ASD). To achieve this, about six (6) questions were given out to about three (3) students and were fed into the selected iAttention Transformers and were given out to human experts for grading. An example of this can be found in Appendix A. Table 11 presents the score generated by iAttention-sentence Transformers and the score of human experts.
Table 11.
Score generated by iAttention-sentence Transformers and the score of human experts.
Table 12 presents a comparative result of where the model’s performance is compared to the human expert grading. The model performance is moderately good for the Pearson Correlation (0.493–0.725) with the human expert, which closely aligns with the Expert 3 score by 0.73, and the Spearman Correlation shows a better performance ranging from 0.577 to 0.774. The absolute score differences suggest that aligns well with Expert 3, which is the lowest score (0.894). Furthermore, consistently has higher correlations with the human expert score when compared to the model, especially with Expert 3’s score (0.817 for Pearson correlation and 0.793 for Spearman). This indicates that there is a strong agreement between and Expert 3. also has lower absolute score differences overall, with 0.828 for Expert 3, which shows that and human Expert 3 closely match. To further evaluate the mean and median score of the human expert, the figure was taken, and the models show a moderately strong relationship. also outperforms the model, having a PC of 0.709 for the mean score of the human expert and 0.713 for the median score compared to the model’s scores, which are 0.618 and 0.633.
Table 12.
Comparative results of iAttention-sentence Transformers and the scores of human experts.
The models were also compared to the original scores from the dataset, which was not part of the training and testing process. Both models indicate strong correlations with the origin score for which the slightly outperforms . has a Pearson Correlation (0.835) and Spearman Correlation (0.871) with absolute score differences of 0.823. The expert scores correlate quite well with the original scores, with Expert 1 having the highest scores for Pearson Correlation (0.881) and Spearman Correlation (0.841) as well as absolute score differences of 0.861. As compared to the other human experts, Expert 1 has the most aligned scores with the original scores. Generally, the model seems to perform better across all comparisons, including both expert scores and original scores. This shows the model captures more meaningful aspects of the scoring process which leads to better alignment with human experts.
5.5. Computational Complexity Analysis
The efficiency of automated grading models is a crucial factor in real-world applications, where scalability and computational feasibility play significant roles. Table 13 presents a comparative analysis of the computational complexity of different iAttention-sentence variants, evaluating their training time per epoch, memory usage, and model size in terms of parameters. The baseline model for these evaluations was Longformer, ensuring a consistent benchmark for comparison. The results indicate that is the most computationally intensive model, requiring the longest training time (579 sec per epoch) and the highest memory consumption (10,579.04 MB). This increase is attributed to the hierarchical attention mechanism, which introduces additional computations to enhance the model’s ability to capture inter-sentence relationships. On the other hand, is the most efficient variant, with the shortest training time (331.7 sec per epoch) and lower memory consumption (10,461.05 MB). The reduction in computational cost can be explained by its reliance on TF-IDF embeddings, which provide a lightweight textual representation without requiring extensive deep-learning operations. The -model, which employs word-level attention, falls between the two in terms of complexity, requiring 567 sec per epoch and utilizing 10,476.04 MB of memory. The additional computations needed to refine word-level dependencies contribute to the increased training time and memory consumption compared to iAttention-TF-IDF. Overall, while offers the best grading accuracy, it comes at the cost of a higher computational overhead. The trade-off between efficiency and accuracy must be carefully considered, depending on the specific requirements of an automated grading system, particularly in resource-constrained environments.
Table 13.
Computational complexity of iAttention variants.
6. Conclusions
This study introduced the iAttention Transformer, an advanced approach for the automated grading of free-response questions using inter-sentence attention mechanisms. The proposed models were evaluated across multiple benchmark datasets, including STS tasks, SciEntsBank, SemEval-2013 Beetle, Mohler and U-datasets, demonstrating their effectiveness in accurately assessing student responses. The results consistently showed that iAttention-enhanced models outperformed traditional transformer-based grading models such as BERT, RoBERTa, and SBERT. A comprehensive statistical significance analysis was conducted using the paired t-test, confirming that the observed improvements were statistically meaningful. The based model achieved the highest grading accuracy, proving the effectiveness of hierarchical inter-sentence attention in capturing contextual relationships between student answers and reference responses. Additionally, a computational complexity analysis highlighted the trade-offs between model accuracy and efficiency, demonstrating the feasibility of deploying the proposed models in real-world educational systems.
7. Future Direction
While the iAttention-sentence Transformer models have shown strong performance in grading free-response answers, further research is required to enhance their robustness, scalability, and practical deployment. The most pressing future direction is the integration of multilingual support, as current experiments are limited to English. Planned work includes experimenting with multilingual transformers such as XLM-R and mBERT, along with cross-lingual sentence embeddings, to assess generalization across languages and educational contexts. A pilot setup is being considered using translated student responses in combination with fine-tuning for small domain-specific multilingual datasets. Fairness and bias mitigation represent another critical challenge. Future efforts will include bias auditing across demographic subgroups and the application of fairness-aware training techniques, such as sample reweighting or adversarial debiasing, particularly in datasets where scoring disparities are observed. Interpretability is also essential for user trust. Attention, weight visualization, and saliency mapping will be explored to trace how the model aligns response segments with reference answers. To support deployment at scale, computational efficiency must be improved. Proposed experiments include pruning iAttention layers, applying quantization methods, and testing lighter-weight encoders for inference on low-resource devices. Additionally, integrating OCR pipelines will extend model usability to handwritten student responses, a necessity in many classroom settings.
Finally, to ensure generalizability, future work will benchmark the model on broader datasets, including STEM-focused questions and code-based assessments. These directions aim to build more inclusive, explainable, and deployable grading systems, especially in under-resourced or linguistically diverse environments.
Author Contributions
Conceptualization, I.D.D., A.T.A. and I.A.O.; methodology, I.D.D., A.T.A. and I.A.O.; software, I.D.D. and A.T.A.; validation, I.D.D., A.T.A. and I.A.O.; formal analysis, I.D.D., A.T.A. and I.A.O.; investigation, I.D.D., A.T.A., I.A.O. and H.N.O.; resources, I.D.D., A.T.A., I.A.O. and H.N.O.; data curation, I.D.D. and T.-J.T.-A.; writing—original draft preparation, I.D.D.; writing—review and editing, I.D.D., A.T.A., I.A.O., H.N.O. and T.-J.T.-A.; visualization, I.D.D., A.T.A. and H.N.O.; supervision, A.T.A. and I.A.O. All authors have read and agreed to the published version of the manuscript.
Funding
This research did not receive any external funding. However, the publication cost was covered by Covenant University.
Data Availability Statement
Data is contained within the article.
Acknowledgments
The authors want to acknowledge God for the inspiration and grace to carry out this work. Also, we wish to acknowledge Covenant University for the publication support.
Conflicts of Interest
The authors declare no conflicts of interest.
Appendix A

References
- Janda, H.K.; Pawar, A.; Du, S.; Mago, V. Syntactic, semantic and sentiment analysis: The joint effect on automated essay evaluation. IEEE Access 2019, 7, 108486–108503. [Google Scholar] [CrossRef]
- Süzen, N.; Gorban, A.N.; Levesley, J.; Mirkes, E.M. Automatic short answer grading and feedback using text mining methods. Procedia Comput. Sci. 2020, 169, 726–743. [Google Scholar] [CrossRef]
- Wijanto, M.C.; Yong, H.S. Combining Balancing Dataset and SentenceTransformers to Improve Short Answer Grading Performance. Appl. Sci. 2024, 14, 4532. [Google Scholar] [CrossRef]
- Tulu, C.N.; Ozkaya, O.; Orhan, U. Automatic Short Answer Grading with SemSpace Sense Vectors, MaLSTM. IEEE Access 2021, 9, 19270–19280. [Google Scholar] [CrossRef]
- Ahmed, A.; Joorabchi, A.; Hayes, M.J. On Deep Learning Approaches to Automated Assessment: Strategies for Short Answer Grading. In Proceedings of the International Conference on Computer Supported Education, CSEDU—Proceedings, Virtual, 22–24 April 2022; pp. 85–94. [Google Scholar]
- Oladipupo, O.O.; Olugbara, O.O. Evaluation of data analytics based clustering algorithms for knowledge mining in a student engagement data. Intell. Data Anal. 2019, 23, 1055–1071. [Google Scholar] [CrossRef]
- Oladipupo, O.O.; Samuel, S. A Learning Analytic Approach to Modelling Student-Staff Interaction From Students’ Perception of Engagement Practices. IEEE Access 2024, 12, 10315–10333. [Google Scholar] [CrossRef]
- Burrows, S.; Gurevych, I.; Stein, B. The eras and trends of automatic short answer grading. Int. J. Artif. Intell. Educ. 2015, 25, 60–117. [Google Scholar] [CrossRef]
- Sultan, A.; Salazar, C.; Sumner, T. Fast and Easy Short Answer Grading with High Accuracy. In Proceedings of the 2016 Conference of the North American Chapter of the Association for Computational Linguistics: Human Language Technologies, San Diego, CA, USA, 12–17 June 2016; pp. 1070–1075. [Google Scholar]
- Lesk, M. Automatic Sense Disambiguation Using Machine Readable Dictionaries: How to Tell a Pine Cone from an Ice Cream Cone. In Proceedings of the 5th Annual International Conference on Systems Documentation, Toronto, ON, Canada, 8–11 June 1986; pp. 24–26. [Google Scholar]
- Zhu, X.; Wu, H.; Zhang, L. Automatic Short-Answer Grading via BERT-Based Deep Neural Networks. IEEE Trans. Learn. Technol. 2022, 15, 364–375. [Google Scholar] [CrossRef]
- Ramachandran, L.; Cheng, J.; Foltz, P. Identifying Patterns For Short Answer Scoring Using Graph-based Lexico-Semantic Text Matching. In Proceedings of the Tenth Workshop on Innovative Use of NLP for Building Educational Applications, Denver, CO, USA, 4 June 2015; pp. 97–106. [Google Scholar]
- Devlin, J.; Chang, M.-W.; Lee, K.; Toutanova, K. Pre-Training of Deep Bidirectional Transformers for Language Understanding. arXiv 2018, arXiv:1810.04805. [Google Scholar]
- Reimers, N.; Gurevych, I. Sentence-BERT: Sentence Embeddings using Siamese BERT-Networks. arXiv 2019, arXiv:1908.10084. [Google Scholar]
- Sung, C.; Saha, S.; Ma, T.; Reddy, V.; Arora, R. Pre-Training BERT on Domain Resources for Short Answer Grading. In Proceedings of the 2019 Conference on Empirical Methods in Natural Language Processing and the 9th International Joint Conference on Natural Language Processing, Hong Kong, China, 3–7 November 2019; pp. 6071–6075. [Google Scholar]
- Lei, W.; Meng, Z. Text similarity calculation method of Siamese network based on, ALBERT. In Proceedings of the 2022 International Conference on Machine Learning and Knowledge Engineering (MLKE), Guilin, China, 25–27 February 2022; pp. 251–255. [Google Scholar]
- Condor, A.; Litster, M.; Pardos, Z. Automatic short answer grading with SBERT on out-of-sample questions. In Proceedings of the 14th International Conference on Educational Data Mining (EDM 2021), Paris, France, 29 June–2 July 2021. [Google Scholar]
- Sayeed, M.A.; Gupta, D. Automate Descriptive Answer Grading using Reference based Models. In Proceedings of the 2022 OITS International Conference on Information Technology (OCIT), Bhubaneswar, India, 14–16 December 2022; pp. 262–267. [Google Scholar]
- Bonthu, S.; Rama Sree, S.; Krishna Prasad, M.H.M. Improving the performance of automatic short answer grading using transfer learning and augmentation. Eng. Appl. Artif. Intell. 2023, 123, 106292. [Google Scholar] [CrossRef]
- Kaya, M.; Cicekli, I. A Hybrid Approach for Automated Short Answer Grading. IEEE Access 2024, 12, 96332–96341. [Google Scholar] [CrossRef]
- Badry, R.M.; Ali, M.; Rslan, E.; Kaseb, M.R. Automatic Arabic Grading System for Short Answer Questions. IEEE Access 2023, 11, 39457–39465. [Google Scholar] [CrossRef]
- Caciularu, A.; Cohan, A.; Beltagy, I.; Peters, M.E.; Cattan, A.; Dagan, I. CDLM: Cross-Document Language Modeling. arXiv 2021, arXiv:2101.00406. [Google Scholar]
- Liu, Y.; Ott, M.; Goyal, N.; Du, J.; Joshi, M.; Chen, D.; Levy, O.; Lewis, M.; Zettlemoyer, L.; Stoyanov, V. RoBERTa: A Robustly Optimized BERT Pretraining Approach. arXiv 2019, arXiv:1907.11692. [Google Scholar]
- Beltagy, I.; Peters, M.E.; Cohan, A. Longformer: The Long-Document Transformer. arXiv 2020, arXiv:2004.05150. [Google Scholar]
- Ramos, J. Using TF-IDF to Determine Word Relevance in Document Queries. In Proceedings of the 1st Instructional Conference Machine Learning, Pisataway, NJ, USA, 3–8 December 2003; Volume 242, pp. 133–142. [Google Scholar]
- Miller, G.A. WordNet: A Lexical Database for English. Commun. ACM 1995, 38, 39–41. [Google Scholar] [CrossRef]
- Muennighoff, N.; Tazi, N.; Magne, L.; Reimers, N. MTEB: Massive Text Embedding Benchmark. In Proceedings of the 17th Conference of the European Chapter of the Association for Computational Linguistics, Dubrovnik, Croatia, 2–6 May 2022. [Google Scholar]
- Dada, I.D.; Akinwale, A.T.; Tunde-Adeleke, T.-J. A Structured Dataset for Automated Grading: From Raw Data to Processed Dataset. Data 2025, 10, 87. [Google Scholar] [CrossRef]
- Mohler, M.; Bunescu, R.; Mihalcea, R. Learning to Grade Short Answer Questions using Semantic Similarity Measures and Dependency Graph Alignments. In Proceedings of the 49th Annual Meeting of the Association for Computational Linguistics, Portland, OR, USA, 19–24 June 2011; pp. 752–762. [Google Scholar]
- Marvaniya, S.; Saha, S.; Dhamecha, T.I.; Foltz, P.; Sindhgatta, R.; Sengupta, B. Creating Scoring Rubric from Representative Student Answers for Improved Short Answer Grading. In Proceedings of the 27th ACM International Conference on Information and Knowledge Management, Torino, Italy, 22–26 October 2018; pp. 993–1002. [Google Scholar]
- Garg, J.; Papreja, J.; Apurva, K.; Jain, G. Domain-Specific Hybrid BERT based System for Automatic Short Answer Grading. In Proceedings of the 2022 2nd International Conference on Intelligent Technologies (CONIT), Hubli, India, 24–26 June 2022; pp. 1–6. [Google Scholar]
- Ghavidel, H.A.; Zouaq, A.; Desmarais, M.C. Using BERT and XLNET for the automatic short answer grading task. In Proceedings of the CSEDU 2020—12th International Conference on Computer Supported Education, Prague, Czech Republic, 2–4 May 2020; pp. 58–67. [Google Scholar]
- Ott, N.; Ziai, R.; Hahn Detmar, M.; Sonderforschungsbereich, M.; Karls, E. CoMeT: Integrating different levels of linguistic modeling for meaning assessment. In Proceedings of the Second Joint Conference on Lexical and Computational Semantics (*SEM), Atlanta, GA, USA, 14–15 June 2013; pp. 608–616. [Google Scholar]
- Heilman, M.; Madnani, N. ETS: Domain Adaptation and Stacking for Short Answer Scoring *. In Proceedings of the Second Joint Conference on Lexical and Computational Semantics (*SEM), Atlanta, GA, USA, 14–15 June 2013; pp. 275–279. [Google Scholar]
- Jimenez, S.; Becerra, C.; Gelbukh Cic-Ipn, A.; Dios Bátiz, A.J.; Mendizábal, A. SOFTCARDINALITY: Hierarchical Text Overlap for Student Response Analysis. In Proceedings of the Second Joint Conference on Lexical and Computational Semantics (*SEM), Atlanta, GA, USA, 14–15 June 2013; pp. 280–284. [Google Scholar]
Disclaimer/Publisher’s Note: The statements, opinions and data contained in all publications are solely those of the individual author(s) and contributor(s) and not of MDPI and/or the editor(s). MDPI and/or the editor(s) disclaim responsibility for any injury to people or property resulting from any ideas, methods, instructions or products referred to in the content. |
© 2025 by the authors. Licensee MDPI, Basel, Switzerland. This article is an open access article distributed under the terms and conditions of the Creative Commons Attribution (CC BY) license (https://creativecommons.org/licenses/by/4.0/).