Article

Assessing the Credibility of AIS-Calculated Risks in Busy Waterways: A Case Study of Hong Kong Waters

1
College of Transportation Engineering, Dalian Maritime University, Dalian 116026, China
2
Transportation Safety Research Center, China Academy of Transportation Science, Beijing 100029, China
3
Department of Logistics and Maritime Studies, The Hong Kong Polytechnic University, Hong Kong
4
Maritime Data and Sustainable Development Centre, The Hong Kong Polytechnic University, Hong Kong
*
Author to whom correspondence should be addressed.
These authors contributed equally to this work.
Mathematics 2025, 13(18), 2961; https://doi.org/10.3390/math13182961
Submission received: 25 July 2025 / Revised: 6 September 2025 / Accepted: 9 September 2025 / Published: 12 September 2025

Abstract

The increasing complexity of maritime traffic, driven by the expansion of international trade and growing shipping demand, has resulted in frequent ship collisions with significant consequences. This paper evaluates the credibility of the risk, calculated using the automatic identification system (AIS), in busy waterways and integrates AIS data with video surveillance data to comprehensively analyze the risk of ship collision. Specifically, this study utilizes the IALA Waterways Risk Assessment Program (IWRAP) tool to simulate maritime traffic flow and assess collision risk probabilities across various study areas and time periods. In addition, we analyze data from 2019 to 2022 to explore the impact of the COVID-19 pandemic on maritime traffic and find that the number of ship arrivals during the epidemic has decreased, resulting in a decrease in accident risk. We identify four traffic conflict areas in the real-world study area and point out that there are multi-directional ship interactions in these areas, but compliance with traffic rules can effectively reduce the risk of accidents. Additionally, simulations suggest that even a 13.5% increase in ocean-going vessel (OGV) traffic would raise collision risk by only 0.0247 incidents/year. To more accurately analyze the risk of waterways, we investigate the capture of dynamic information for ships in waterways by using the learning-driven detection model for real-time ship detection. These findings highlight the effectiveness of combining AIS and visual data for waterway risk assessment, offering critical insights for improving safety measures and informing policy development.

1. Introduction

Maritime transport constitutes the cornerstone of the global logistics framework, providing a cost-effective mode of freight transport that facilitates the global economy’s vast and complex cargo flows [1,2]. As the world economy has continued to evolve, the scale of international trade has undergone a significant expansion, causing a substantial surge in demand for cargo transportation [3,4]. Ship collisions occur frequently and have serious consequences, so it is essential to conduct a thorough risk assessment to develop more effective measures for enhancing waterway safety [5,6]. By prioritizing proactive risk mitigation, the maritime industry can effectively navigate the complexities of an increasingly interconnected world, thereby fostering the sustainable growth of global trade while protecting the environment and promoting economic development.

1.1. Hong Kong Maritime Accident Cases

One of the most devastating maritime disasters in recent Hong Kong history occurred near Lamma Island in 2012. The ferry Lamma IV, carrying over 120 passengers, collided with the high-speed boat Hai Tai, resulting in 39 fatalities and numerous injuries [7]. Between 2017 and 2021, Hong Kong recorded 47 maritime accidents among the 672,000 ships arriving in the region. Most accidents occurred near the Kwai Tsing Container Terminals, a hub characterized by intense industrial activity and heavy vessel traffic. Collisions are frequent in this area due to the high operational density. For example, a collision occurred between the Hong Kong container ship SEASPAN BELLWETHER and the Vietnamese bulk carrier ROYAL 18 at the junction of the Southwest Channel near Tsing Yi Island [8]. These tragedies sparked extensive discourse on maritime traffic management and safety measures in Hong Kong, prompting the government to strengthen regulatory frameworks and develop more robust systems.

1.2. Motivation and Contribution

Current research on ship collision risk assessment primarily relies on two types of data sources: automatic identification system (AIS) data [9,10] and video surveillance data [11,12]. The AIS, a navigational aid system, provides both dynamic positional and static vessel information and has been extensively employed for collision risk evaluation. However, the accuracy and completeness of AIS data can be compromised, as some inland vessels, such as fishing boats and small cargo ships, may disable their AIS equipment to engage in illicit activities [13], thereby hindering precise collision risk assessments. In contrast, although video surveillance technology [14,15,16] also faces some challenges, such as the inability to extract detailed static information for ships, thereby misjudging the risk of collision, its real-time and intuitive nature makes up for the shortcomings of AIS data [17]. Therefore, effective integration of AIS and visual data is essential to achieve a more comprehensive assessment of ship collision risks. The contributions of our work are summarized as follows:
  • We propose using traffic images of the study area to assess the feasibility and risk probability of a real-world waterway. Specifically, the IALA Waterway Risk Assessment Program (IWRAP) (https://www.iala.int/wiki/iwrap/index.php/Main_Page, accessed on 8 September 2025) was suggested to simulate the likelihood of a duty officer failing to respond in time during collisions with other vessels or grounding incidents.
  • We propose leveraging IWRAP and AIS data to reconstruct maritime traffic flows within the study area over the data coverage period. Subsequently, we analyze ship maneuvering patterns and behaviors through transverse distribution analysis and explore causal factors to assess collision risk probabilities across various points and regions within the study area.
The remainder of this paper is organized as follows: Section 2 briefly reviews recent research on ship risk assessment. In Section 3, the proposed method is described in detail. Section 4 implements extensive experiments. Finally, Section 5 summarizes the main contributions of this work.

2. Literature Review

In recent decades, the maritime industry’s approach to risk quantification has undergone significant evolution. Pate et al. [18] evaluated the safety of individual vessels by focusing on ship design and structural integrity. Subsequently, research on shipping operations and marine risk assessment has gained increasing attention, encompassing areas such as marine collisions, groundings, fires, explosions, and offshore operations. Studies on maritime transport risks have adopted various perspectives, including risk quantification [19], uncertainty analysis [20], and the identification of risk-influencing factors [21]. These investigations provide diverse perspectives and dimensions for analyzing maritime transport risk domains.
Since the 1990s, the rapid advancement of maritime safety analysis has been partly driven by the International Maritime Organization’s (IMO) adoption and endorsement of formal safety assessments. Grabowski et al. [22] investigated the challenges associated with risk modeling and proposed a framework for risk modeling methodologies. The authors concluded by addressing the limitations of these approaches and suggesting potential directions for future research. Soares et al. [23] recorded the early work on risk assessment of maritime transportation in detail. They reviewed earlier studies on the probability of loss from ship sinking and capsizing and discussed methods used to assess structural design risk. In addition, recent developments in the use of formal safety assessments to support international legislative decisions applicable to maritime transport were briefly mentioned. Merrick et al. [20], Hu et al. [24], and Hanninen et al. [25] investigated the influence of safety variables on the likelihood of ship collisions in San Francisco Bay, Shanghai Port, and the Gulf of Finland, respectively. Pedersen et al. [26] conducted a comprehensive review of predictive and analytical tools for assessing collision and grounding risks in the maritime sector. They proposed a probabilistic framework to guide the application of these tools in developing performance-based regulations aimed at minimizing the human, environmental, and economic impacts of such incidents. Their findings underscore the importance of identifying cost-effective risk control measures to enhance prevention and mitigation strategies. Leveraging an extensive database of failure incidents, Heij et al. [27] integrated quantitative risk analysis into ship inspection protocols to enhance their effectiveness. Research on ship collisions has increasingly emphasized probabilistic approaches, bolstered by uncertainty modeling techniques. Subsequently, Li et al. [19] conducted a comprehensive review and evaluation of various quantitative risk assessment models for marine waterways.
Goerlandt et al. [28] elaborated on the concept of risk, its theoretical perspectives, and its application to the maritime sector. Furthermore, they evaluated the reliability and validity of methods for analyzing ship collision risk, focusing on issues such as the sensitivity of model results to changes in parameter selection [29]. Later works such as [30,31] indicated that a limited number of methodologies predominate in the maritime risk analysis literature. These encompass statistical analysis of accident data, expert judgment incorporated through Bayesian networks, and the development of geometric route models or time-domain simulations. However, Laine et al. [32] found that these methods have some limitations that make them challenging and potentially flawed in the practical implementation of maritime risk assessment. To address these limitations, researchers have increasingly adopted quantitative risk assessment approaches to systematically evaluate the causal relationships between maritime accidents and their contributing factors. Maritime safety analysis fundamentally involves quantifying risks in a probabilistic manner using formal methodologies. Additionally, studies based on accident statistics [33] have significantly influenced safety management practices within the maritime industry. A variety of advanced techniques, including fuzzy logic [34], Bayesian networks [20], evidential reasoning [35], Monte Carlo simulation [36], Markov chains [37], and genetic algorithms [38], have been proposed to model risks in this dynamic and data-scarce domain. Subsequently, Tao et al. [39] investigated the application of probabilistic risk assessment methods in maritime transportation to address uncertainties. Quantitative risk assessment methodologies have been widely adopted within maritime transportation systems. Yin et al. [40] provided a detailed exploration of the use of statistical and mathematical models to identify and quantify risks. Dominguez et al. [41] examined risks associated with human operations and proposed strategies to mitigate errors. Salihoglu et al. [42] used the FRAM method to conduct a qualitative evaluation of risks associated with shipping operations. Nevertheless, qualitative assessment approaches are frequently criticized for their inability to quantify risks, raising concerns about their reliability and efficacy. In contrast, numerous quantitative risk assessment models have been developed and extensively applied within the domain of maritime safety. Goerlandt et al. [43] used modeling and simulation techniques to analyze risks in maritime transportation systems.
While the risk assessment process is fundamentally consistent, evaluating the risk associated with a specific entity often necessitates sophisticated integration of multiple risk assessment and analysis methodologies. Cozzani et al. [44] conducted a quantitative evaluation of risks arising from the domino effect, emphasizing the critical role of quantitative analysis in accurately assessing and managing risks associated with escalation scenarios. Subsequently, risk assessment methods have experienced unprecedented prosperity through event inference using methods such as fault trees [45] and Bayesian networks [46], and then through data practices combining fuzzy logic [45] and probabilistic statistical methods [47], machine learning [48], etc. Among them, the application of machine learning methods has received increasing attention in the field of maritime transportation [49], including path planning for autonomous ships [50], ship navigation anomaly detection [51], and fuel consumption and ship efficiency prediction based on images or sensors [52]. Many of these applications focus on the possibility of autonomous shipping in the future and the technical requirements needed to support the development of this concept. An emerging yet underexplored research domain is the application of machine learning algorithms to improve maritime safety [53]. An early example is presented by Hashemi et al. [54], who employed a basic neural network architecture to classify different types of accidents based on channel conditions, demonstrating superior performance compared to logistic regression. Since then, Kulkarni et al. [55] have discovered the broader discipline of maritime risk analysis, leading to more and more people entering this field of research. For example, the use of AIS data to assess the risk of collision on routes is an emerging field. Mou et al. [56] conducted an in-depth study on risk analysis using AIS data. Human error is an important factor in maritime accidents. Goerlandt et al. [43] focused on applying deep learning models to optimize route planning and minimize the risk of collisions in congested maritime routes. Yekeen et al. [57] discussed a hybrid framework that combines machine learning algorithms with traditional risk assessment methods to provide a comprehensive risk analysis. Kretschmann et al. [58] explored the application of big data analytics and machine learning to improve safety management systems within maritime environments.

3. The Proposed Method

We combine AIS data with advanced vision-based vessel detection technology to analyze maritime risks. The overall goal is to ensure data integrity, quantify navigational risks, and provide actionable insights for maritime safety management. To achieve this, this section is divided into three key components: AIS data cleaning, AIS-based risk analysis, and vision-based ship detection and tracking.

3.1. AIS Data Cleaning

The AIS data includes a substantial amount of anomalous information, necessitating thorough cleaning of the raw data to improve accuracy. To achieve this, we employ a multi-step approach. As shown in Figure 1, the Isolation Forest algorithm is used to identify and remove data with incorrect maritime mobile service identity, abnormal speed, and inaccurate location. The algorithm constructs a tree structure by randomly selecting features and splitting values to effectively detect outliers from the original data. The equation for path length is as follows:
h ( x ) = e + c ( T . s i z e ) ,
where h ( x ) denotes the path length for a data point x, e represents the number of edges from the root node to a leaf node (corresponding to the number of splits), and T . s i z e represents the number of data points sharing the same leaf node. The term c ( T . s i z e ) acts as a correction factor, representing the average path length for T . s i z e samples when constructing an isolation tree. The calculation of c ( n ) is as follows:
c ( n ) = 2 H ( n 1 ) 2 ( n 1 ) n , H ( n ) = i = 1 n 1 i ,
where H ( n ) is the n-th harmonic number. By combining these calculations, the algorithm determines whether a data point is an outlier based on its path length and a predefined anomaly threshold.
Next, we utilize timestamp analysis and the density-based spatial clustering of applications with noise (DBSCAN) to detect and remove ship records for ships that have been moored for long durations. DBSCAN efficiently filters out noisy data by identifying dense regions, ensuring that only relevant data points are preserved and maintaining spatial consistency between AIS and CCTV data during the subsequent fusion process.
After cleaning the data, ship trajectory points are extracted and reconstructed using linear interpolation and Kalman filtering techniques to ensure the continuity and accuracy of the trajectories. Cubic spline interpolation is employed to produce temporally consistent and spatially smooth trajectories. For each vessel, the longitude and latitude sequences are independently modeled using a cubic polynomial with respect to time:
f ( t ) = a 0 + a 1 ( t t 0 ) + a 2 ( t t 0 ) 2 + a 3 ( t t 0 ) 3 ,
where f ( t ) represents the interpolated position (longitude or latitude) at time t, and a 0 , a 1 , a 2 , and a 3 are the spline coefficients determined from the observed trajectory points. The parameter t 0 represents a reference time point and t t 0 indicates the relative time difference.
These methods enable us to generate a reliable and consistent dataset, significantly improving its overall quality. In the data processing and visualization stage, we utilize heat maps and trajectory maps to display the cleaned data, facilitating a clearer understanding of maritime traffic patterns. As shown in Figure 2, the processed data achieves more normal and interpretable visualization results, which effectively reflect the improvements brought about by the cleaning process. Specifically, abnormal data accounts for 16.8% of the total data on average before cleaning. By employing systematic data cleaning and analysis methods, we are able to significantly reduce the proportion of abnormal data, ensuring that the remaining dataset is both accurate and reliable. The improvement in data quality provides robust support for subsequent risk assessments, enabling a more precise analysis of channel risks. By ensuring the integrity and reliability of the dataset, potential risks can be identified more effectively, and targeted strategies for risk mitigation can be developed.

3.2. AIS-Based Risk Analysis

The IWRAP tool aims to provide users with a robust framework for quantifying risks associated with vessel traffic in designated geographical areas. By utilizing data on traffic intensity and composition, this tool facilitates efficient evaluation and estimation of the annual frequency of collisions and groundings within specified navigational regions. To ensure accurate risk assessment, rigorous criteria must be established for predicting and evaluating collision and grounding incidents, accompanied by a thorough analysis of their potential consequences. The application of IWRAPMK2SETUP_v6_7_1 enables the determination of collision and grounding frequencies for vessels navigating a given waterway. A significant advantage of this approach is its ability to support comparative assessments of various navigational route configurations by evaluating the relative frequencies of collisions and groundings. In the present application of IWRAP, a scenario-based methodology is employed, with the collision analysis procedure systematically depicted in Figure 3. The grounding analysis follows a similar conceptual framework. The procedure is outlined as follows:
  • First, the relevant navigation area is described, which includes the description of all traffic structures along the route and all the ground near the route.
  • Next, the vessel under consideration is defined as navigating a specific route within the designated navigational area. All potential striking vessels or grounding hazards, as depicted in Figure 3, are identified, and the probabilities of grounding and collision are calculated.
  • Subsequently, the identified grounding hazards or striking vessels may be further analyzed to compute damage statistics.
During the research, the collision frequency was quantitatively calculated using the IWRAP model:
Λ c o l = P c × N G .
The collision frequency is Λ c o l , where P c is the causation factor and N G is the geometric number. Ship collisions are categorized into head-on collisions and cross-traffic collisions. Head-on collisions occur along a straight segment of a channel, and their geometric number depends on the cross-traffic distribution along the route, i.e.,
N G head - on = L W i , j P G , i , j head - on V f V i ( 1 ) V j ( 2 ) Q i ( 1 ) Q j ( 2 ) ,
where N G head - on represents the geometric number of head-on collisions, which reflects the number of ship pairs that may collide; L W is the length of the channel segment; Q i and Q j represent the passing frequencies of ship types i and j on the channel, respectively; P G head - on is the probability of collision between two ships sailing in opposite directions; and V f is the relative speed between the two ships, i.e.,
P G = Φ B i j μ i j σ i j Φ B i j μ i j σ i j ,
where P G represents the probability of a collision between two ships; Φ ( x ) is the normal distribution function; B i j = B i + B j 2 is the average width of the two ships; σ i j = σ i 2 + σ j 2 is the standard deviation of the channel width; and μ i j = μ i + μ j represents the average distance between the two ships.
A crossing collision occurs when two routes intersect, merge, or bend within a channel. Unlike head-on collisions, its geometric number is unrelated to the traffic distribution, i.e.,
V f = V i ( 1 ) 2 + V j ( 2 ) 2 2 V i ( 1 ) V j ( 2 ) cos θ , N G crossing = i , j Q i ( 1 ) Q j ( 2 ) V i ( 1 ) V j ( 2 ) D i j V f 1 sin θ for 10 < | θ | < 170 ,
where N G crossing represents the geometric number of crossing collisions; D i j is the diameter of the collision area; V i and V j are the speeds of ships i and j, respectively; Q i and Q j are the passing frequencies of ships on each channel; and θ is the intersection angle between the two channels.

3.3. Vision-Based Ship Detection and Tracking

3.3.1. YOLOv7-Based Ship Detection

Firstly, we employ the advanced YOLOv7 [59] architecture for real-time detection and identification of vessels navigating waterways. YOLOv7, known for its efficient detection performance and lightweight design, is one of the most cutting-edge methods in object detection. To further enhance its accuracy and robustness for dynamic ship detection, we fine-tune the model using a carefully curated dataset of aerial images captured along Hong Kong’s waterways. During optimization, we not only configured the learning rate (initialized at 0.01), momentum (0.97), and decay coefficient (0.0005), but also introduced a dynamic learning rate scheduling mechanism to adapt to different training phases. This modification accelerates the model’s convergence while mitigating overfitting. The entire training process is completed in 80 epochs within 24 h, demonstrating both efficiency and high performance.
In the pre-processing phase, we extract and resize images to uniform dimensions to optimize detection speed and enable real-time processing [60]. Considering the significant variability in ship size, shape, and orientation, we introduced a multi-scale feature enhancement technique to improve the model’s robustness to scale variations. Specifically, we augmented the training dataset using an image pyramid technique, enabling the model to learn richer contextual features across different scales. Furthermore, the dataset underwent meticulous annotation by a team of five experts, who finely adjusted bounding boxes for moving ships. This high-precision annotation strategy significantly enhances the model’s ability to generalize during training.
During the training phase, the YOLOv7 backbone is fine-tuned via backpropagation to predict bounding boxes and class confidence for ships in motion. Each bounding box is defined by its center coordinates, width, and height. The results of ship detection are specified as follows:
V x p = σ ( p x p ) + b x , V y p = σ ( p y p ) + b y , V w p = α w b · σ ( p w p ) 2 , V h p = α h b · σ ( p h p ) 2 ,
where V x p and V y p indicate the center coordinates of the ship in the raw image along the x-axis and y-axis, respectively. Similarly, V w p and V h p denote the width and height of the detected ship. Here, σ ( · ) is a nonlinear activation function, b x and b y are bias terms, and α w b and α h b are scaling factors. These bounding boxes provide the spatial locations of ships, while the class confidence score indicates the likelihood of the detected object being a vessel.
To ensure computational efficiency while maintaining detection accuracy, the network utilizes downsampling, capturing low-level features and reducing complexity. During training, the model’s weights are iteratively updated using a loss function to minimize prediction errors and improve detection performance.
In the inference phase, the trained model processes previously unseen images, outputting bounding boxes and class probabilities. This phase tests the model’s ability to generalize to new data, a critical requirement for real-world applications. By leveraging our carefully fine-tuned YOLOv7 architecture and high-quality annotations, the model achieves over 95% detection accuracy, even across diverse scenarios. Post-processing is performed using a non-maximum suppression (NMS) algorithm, which eliminates redundant bounding boxes and retains only the most relevant detections. This further enhances detection precision by reducing false positives and refining output clarity, enabling the model to robustly detect ships in varying orientations. The high accuracy demonstrates the robustness and reliability of the proposed detection pipeline, making it highly suitable for real-world deployment.

3.3.2. DeepSORT-Based Ship Detection

For tracking ships across frames, the detection results from YOLOv7 are integrated with DeepSORT and an enhanced Kalman filter framework, forming a robust multi-stage tracking solution. The Kalman filter not only predicts and updates the ship’s position but is also optimized for handling the dynamic motion of ships in real-world waterways. The y coordinate in frame t is calculated as follows:
V ^ y p ( t ) = F · V y p ( t 1 ) , G ^ t = F · G t 1 · F T + Q , K t = G ^ t · H T · H · G ^ t · H T + R 1 , V y p ( t ) = V ^ y p ( t ) + K t · Z y t H · V ^ y p ( t ) , G t = I K t · H · G ^ t ,
where V ^ y p ( t ) is the predicted y coordinate of the ship in frame t before correction and V y p ( t ) is the updated (corrected) coordinate. F is the state transition matrix, H is the observation matrix, Q is the process noise covariance, and R is the measurement noise covariance. Z y t is the observed y coordinate in frame t, K t is the Kalman gain, and G t is the updated error covariance. The x coordinate is updated in the same manner as the y coordinate.
The association between detected and predicted positions is assessed using the Mahalanobis distance, calculated as
d ( i , j ) = d j p i T Σ i 1 d j p i ,
where Σ i 1 represents the inverse of the covariance matrix for the i-th prediction, and d j and p i denote the positions of the j-th detected bounding box and i-th predicted bounding box, respectively. The Mahalanobis distance metric ensures robust matching between detections and predictions across frames. To further improve matching accuracy, a temporal consistency metric is incorporated into the association process, penalizing abrupt identity switches and enhancing identity persistence over consecutive frames.
By combining YOLOv7, DeepSORT, and the enhanced Kalman filter, ships can be globally tracked across video frames with high accuracy and consistency. The cascade matching strategy ensures precise identity tracking, enabling the reconstruction of complete ship trajectories throughout the video sequence. Additionally, the system handles overlapping ships and occlusions effectively by leveraging motion priors from the Kalman filter and appearance embeddings from DeepSORT, ensuring robust tracking in challenging scenarios such as dense traffic or partial occlusions.

4. Experiments and Discussions Through a Case Study of Hong Kong Waters

Due to the seasonality of marine traffic, direct comparison of the four years’ data is inappropriate and is quoted for reference only. We selected two representative time periods for pathogenic factors to understand the impact of COVID-19: May to October 2019 (non-COVID-19 period) and September 2020 to December 2021 (COVID-19 period). Vessel data in the study area were obtained from the AIS. IWRAP evaluates the likelihood that the officer on watch fails to respond promptly when a vessel is on a collision course with another ship or at risk of grounding. The use of IWRAP and AIS data allows for the reconstruction of traffic flows in the study area during the data coverage period, the analysis of vessel maneuvering patterns and behaviors through lateral distribution, and the analysis of causal factors to illustrate the risk probability of various points and areas in the study area. And CCTV cameras were set up at key locations to capture more than six weeks of visual data on the traffic situation in the study area.

4.1. Risk Analysis of Traffic Records

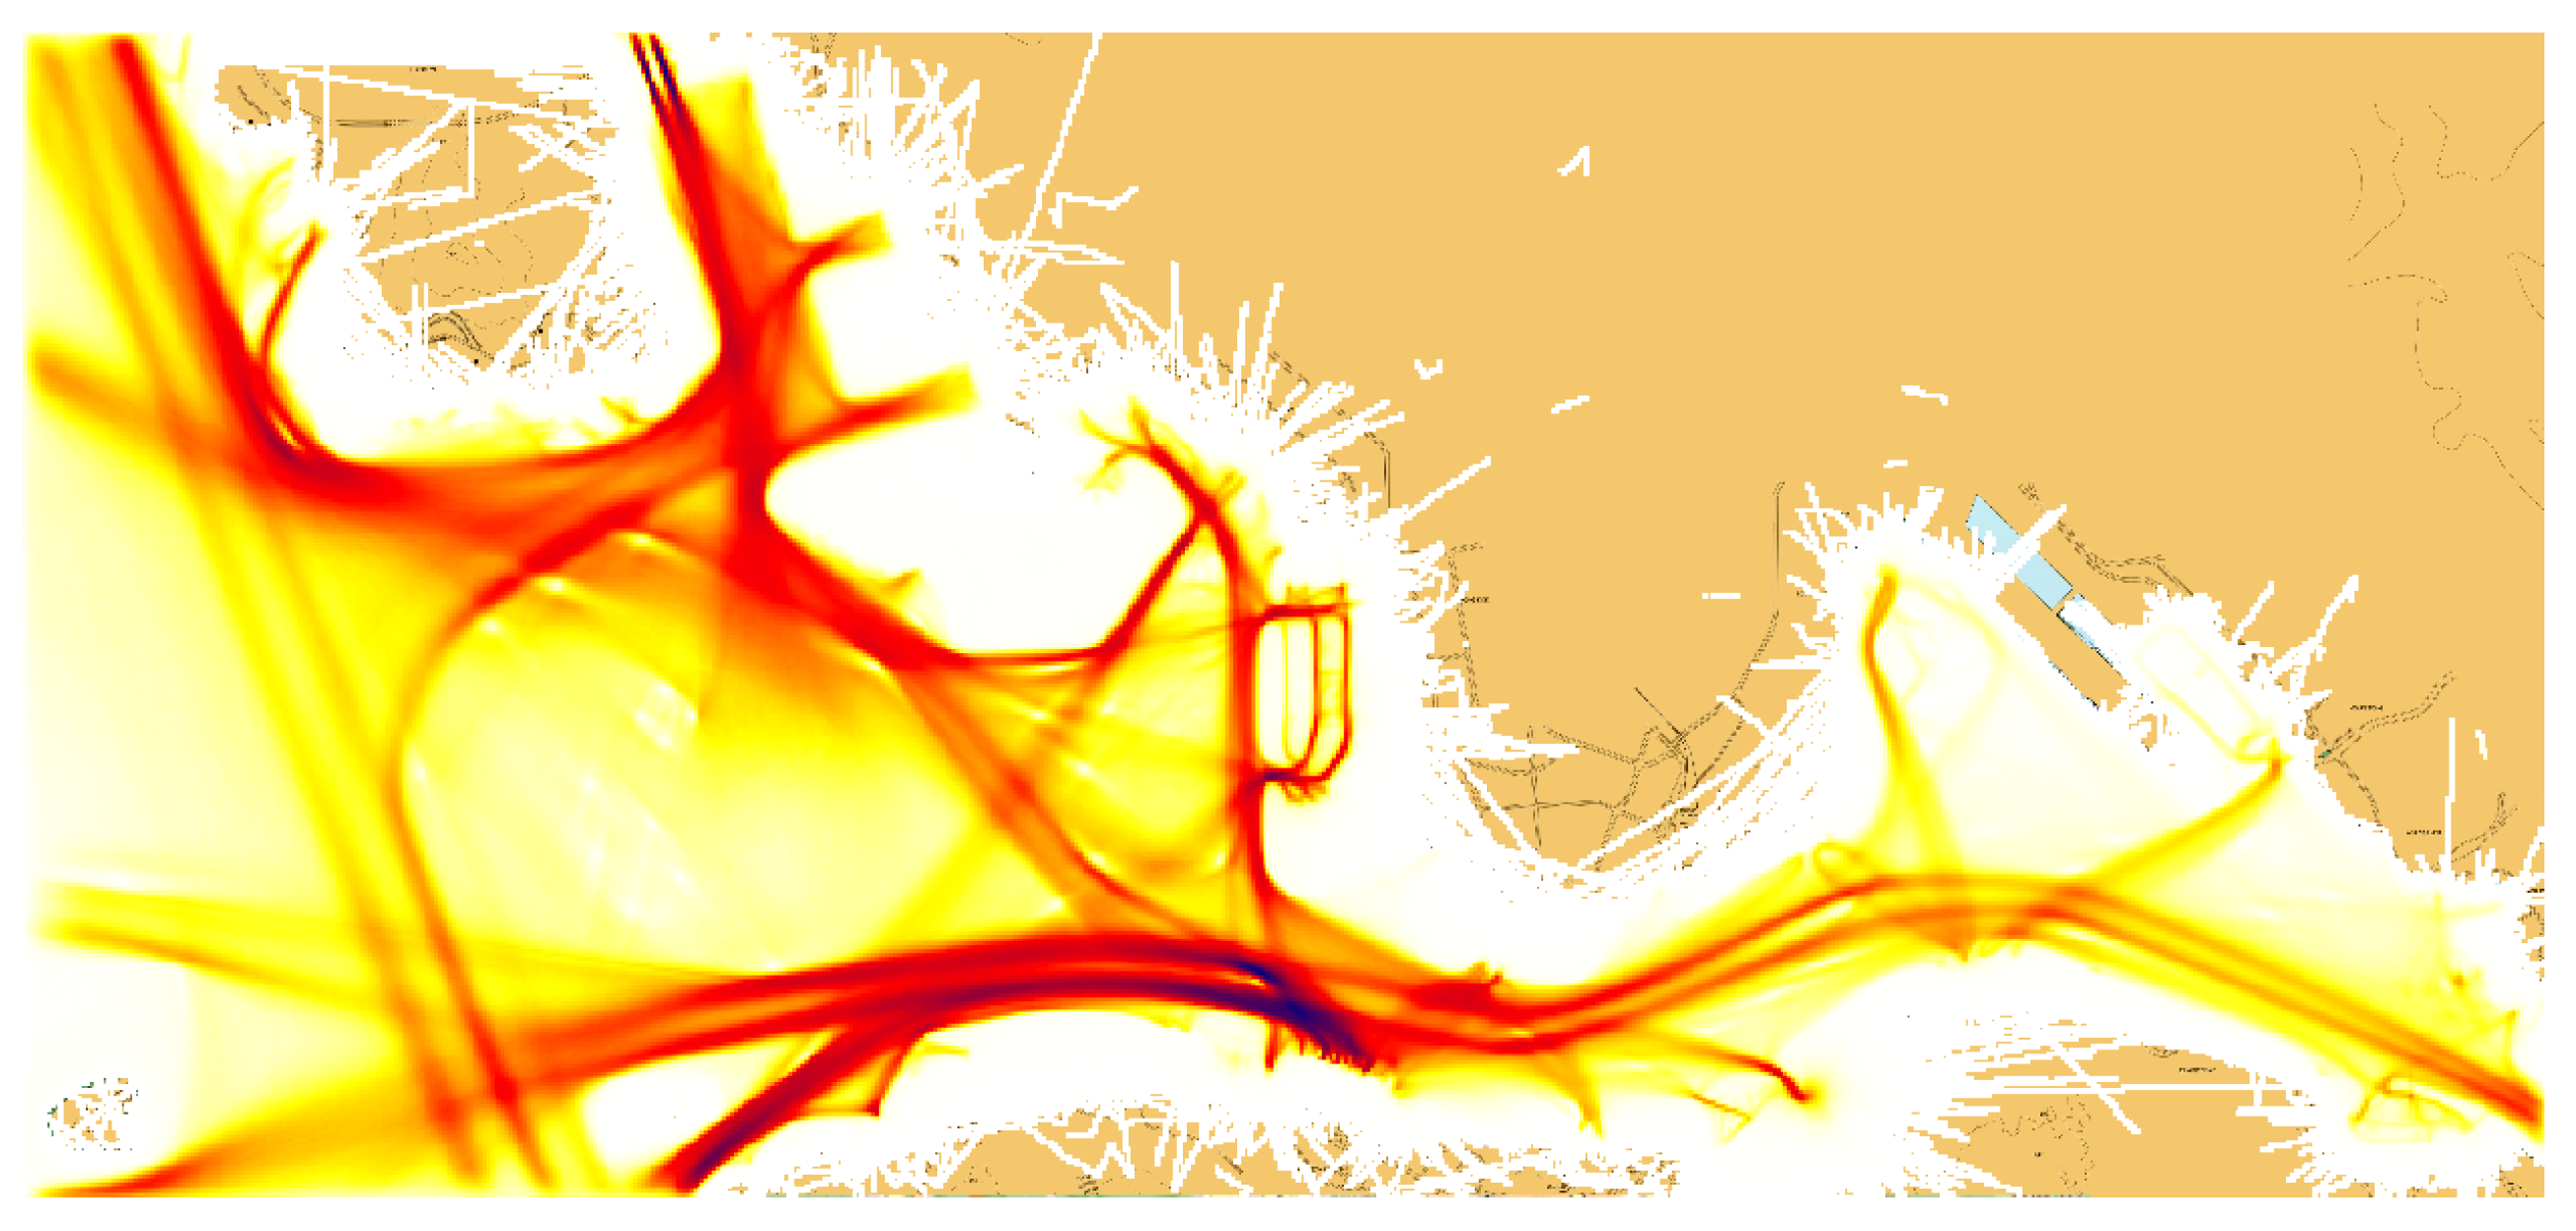
When reviewing marine traffic safety in the central harbour, the increased density and size of vessels resulting from the more regular central fairway of OGVs pose a significant concern. This is due to the constrained navigable waters of the area, which can lead to increased risks of collision. To visualize the relative level of risk, an IWRAP-based heat map (i.e., Figure 4) was generated, highlighting the most frequently traveled areas in the study area and thus the areas with the highest risk of collision.

4.1.1. Quantitative Analysis

To further analyze the collision risk, specific periods and areas were examined to identify the collision causation factor and risk probability for vessel movements.
The industry experienced a 45.5% decline in vessel arrivals between 2019 and 2020, resulting in a corresponding halving of incident risk. Table 1 shows that, assuming vessel figures recover to 2019 levels in the next five years, the risk within the study area is estimated to be 0.29 incidents per year, which is not significant. In addition, we can see that for both 2019 and 2021, the proportion of risk in the Central Fairway Path is between 40 and 50 percent of the study area. It is essential to note that the level of risk is influenced by various factors, such as local marine policy, geography, weather conditions, and traffic patterns, which are not included in this study. Therefore, the comparison should be interpreted with caution and not taken as conclusive evidence of an acceptable accident risk.
Table 2 shows that the risk of ship collisions in Hong Kong waters showed a clear downward trend from 2019 to 2022. The causality coefficient decreased from 0.2628 in 2019 to 0.0756 in 2022, a decrease of approximately 71.2%. The risk probability decreased from 0.26 incidents per year to 0.08 incidents per year, a decrease of approximately 69.2%. The decrease in risk probability is highly consistent with the decrease in the causality coefficient.

4.1.2. Daily and Weekly Risk Analysis

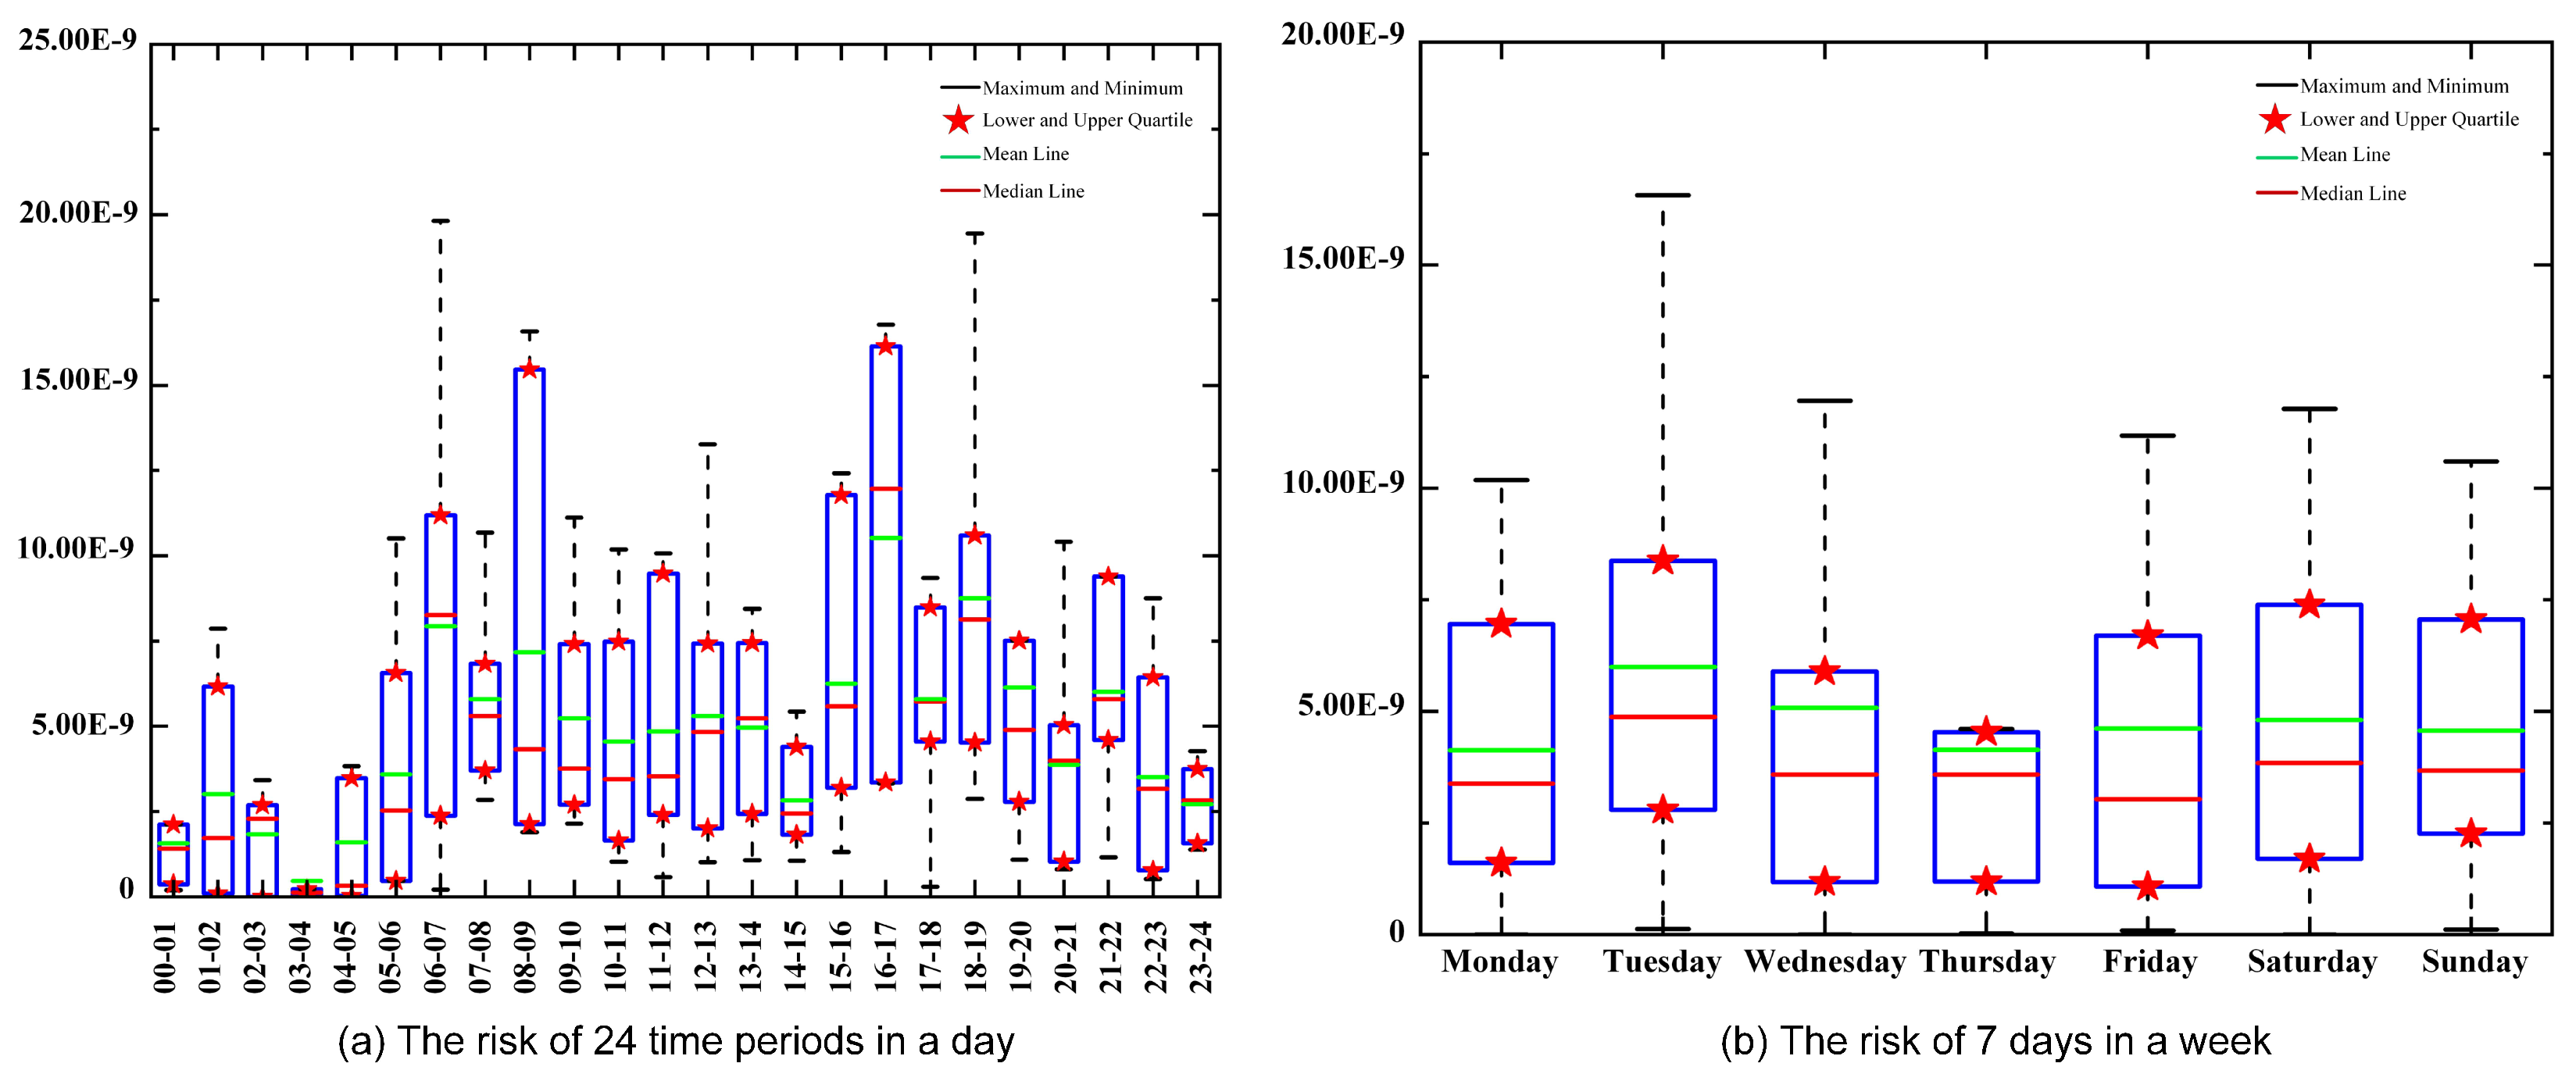
We randomly select a complete week of AIS data from September to October 2022 as a sample and assess hourly risks. This allows us to analyze which days within a week and which time periods within a day are more suitable time windows for cruise ships. We use box plots to analyze the risk of 24 time periods in a day and the seven days of the week. In Figure 5, we can see that the risk at night is significantly lower than that in the afternoon, mainly because the passenger ship and fast ferry in the central channel stop operating, and the number of moving ships decreases.
To visually represent the relative risk levels across the seven days of the week, we employed four indicators for evaluation, as illustrated in Figure 5. The findings indicate that the relative risk is lowest on Sundays and Mondays, which have conditions that are more favorable for ship safety. Notably, even during periods of elevated relative risk (such as 4:00 p.m. to 5:00 p.m., or every Tuesday), this does not mean that ships in this time zone are unsafe to pass, as the risk of collision is still low. Instead, it can be interpreted that there is a higher risk of navigation than in other time periods.

4.1.3. Collision Risk Ratios by Vessel Types

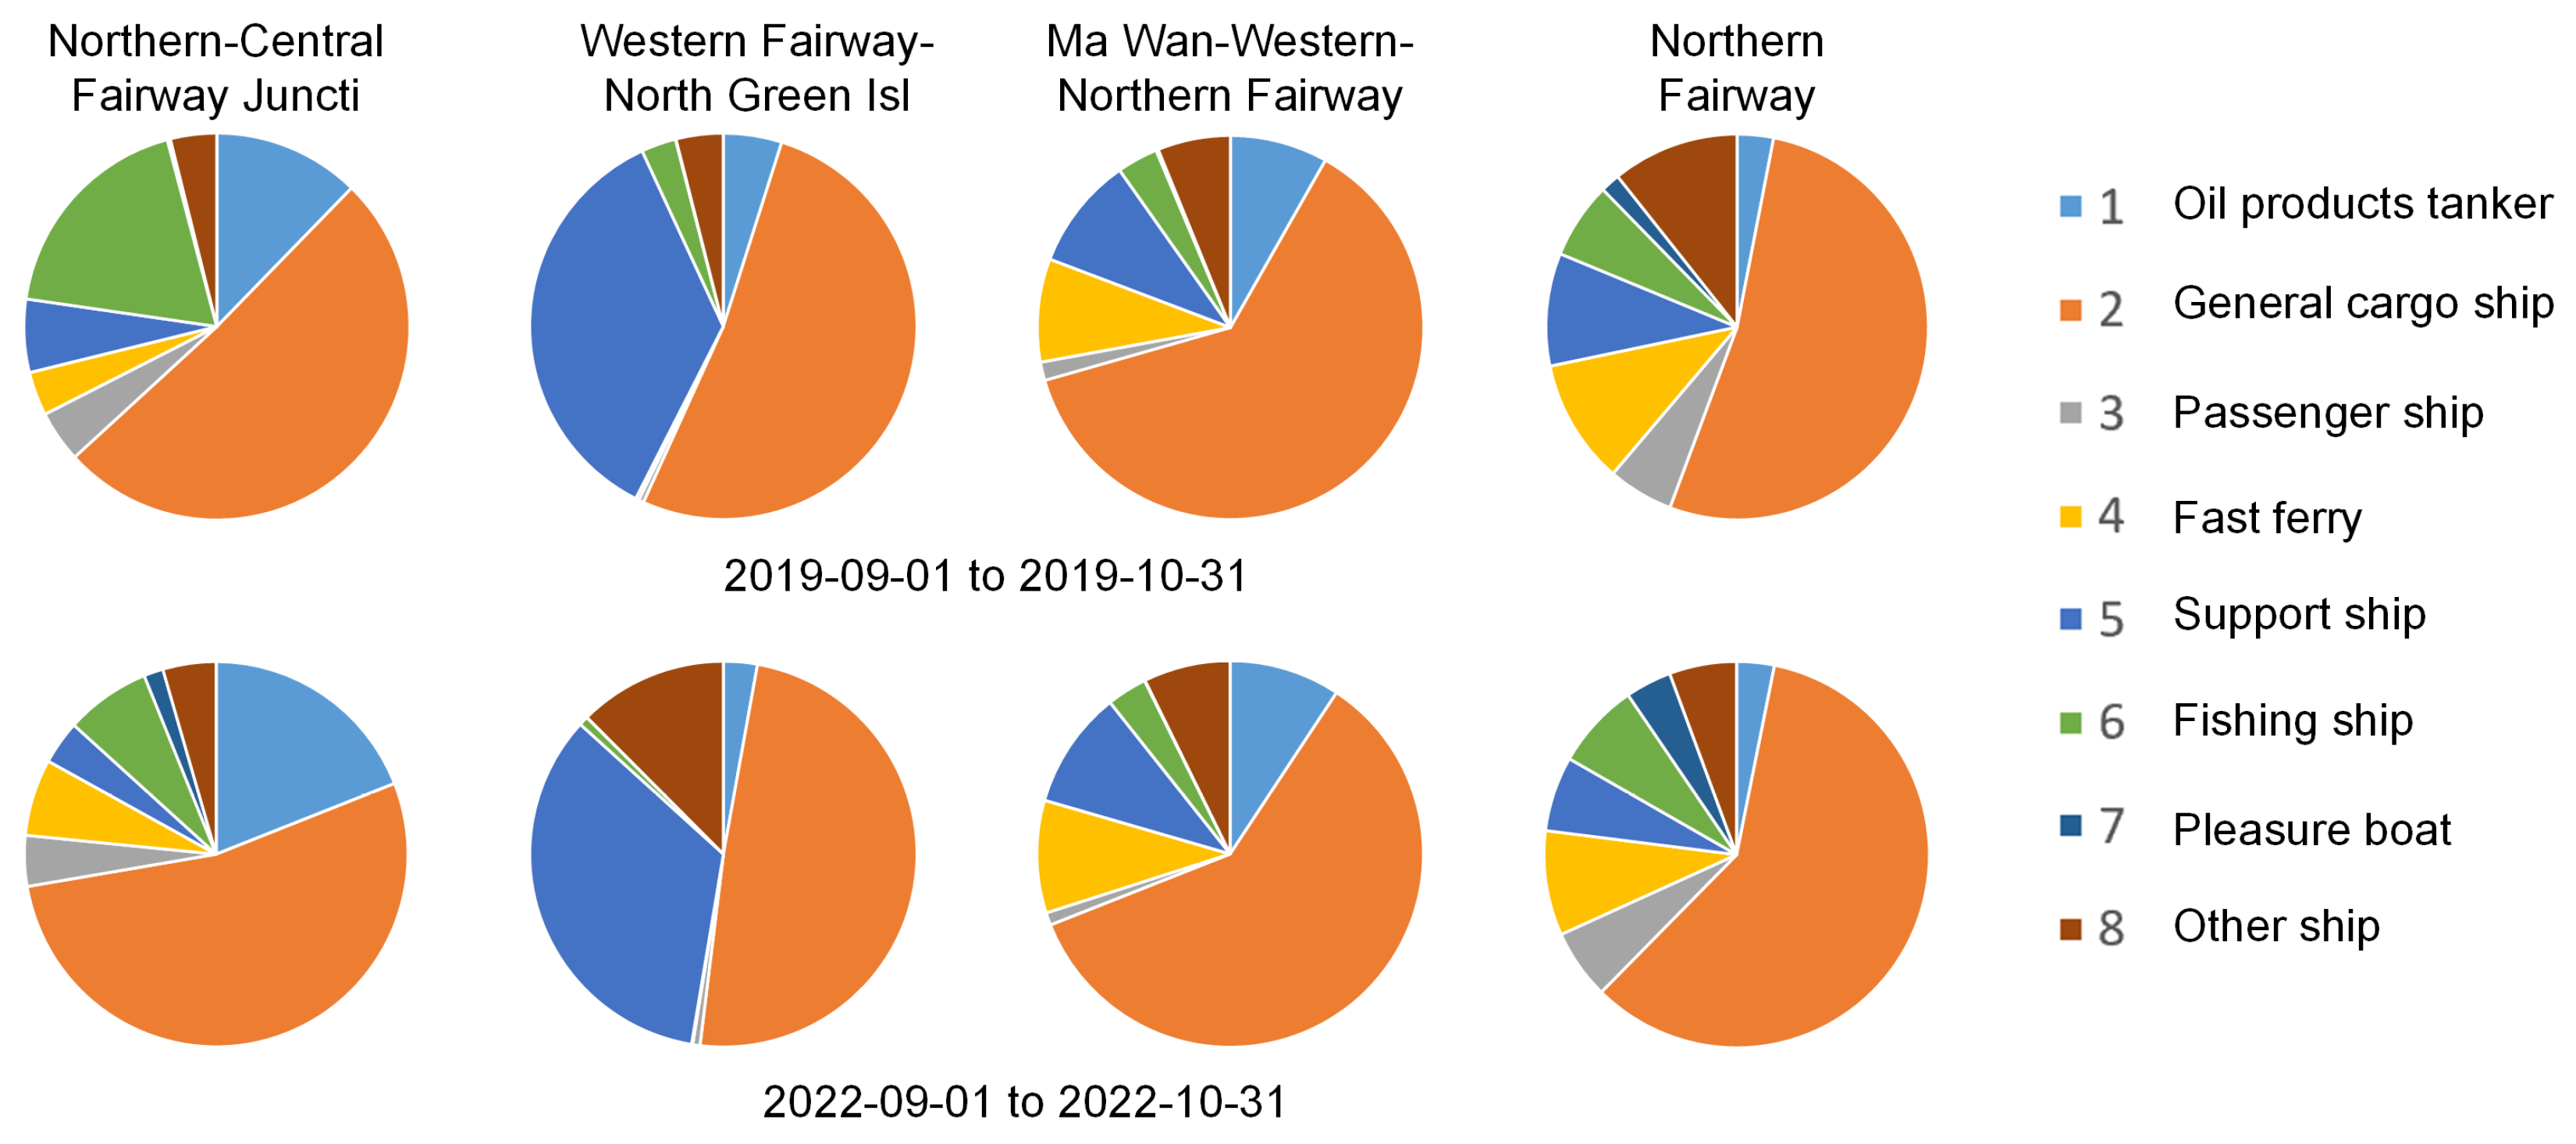
Figure 6 shows the collision risk ratios of different types of ships in different regions during the two time periods of June to October 2019 and September 2022 to October 2023. Among them, general cargo ships are always the type of ship with the highest collision risk, usually accounting for between 50% and 70%. The collision risk of passenger ships is generally lower, accounting for between 5% and 10%.

4.1.4. Risk Levels of Central Channel Voyage Segments

This subsection examines the risk situation for important voyage segments of the central channel in various time periods of the day. These voyage segments are located in positions corresponding to the port facilities where marine activities are carried out. Supported by the risk analysis in this study, proper adjustments can be made for these voyage segments. According to the risk value, we divide the risk of each segment in different time periods into three categories, i.e.,
  • Low: Among the 144 risk values of the selected six main routes and 24 time periods, a risk ranking in the top 1/3 is defined as low risk.
  • Medium: Among the 144 risk values of the selected six main routes and 24 time periods, a risk ranking in the middle 1/3 is defined as medium risk.
  • High: Among the 144 risk values of the selected six main routes and 24 time periods, a risk ranking in the bottom 1/3 is defined as high risk.
Figure 7 indicates that the time periods with the lowest risks are still concentrated at night. Due to the small number of ships transiting through the Leg-50 channel, it has a relatively low risk of collision.

4.2. Impact of Increased OGV Traffic

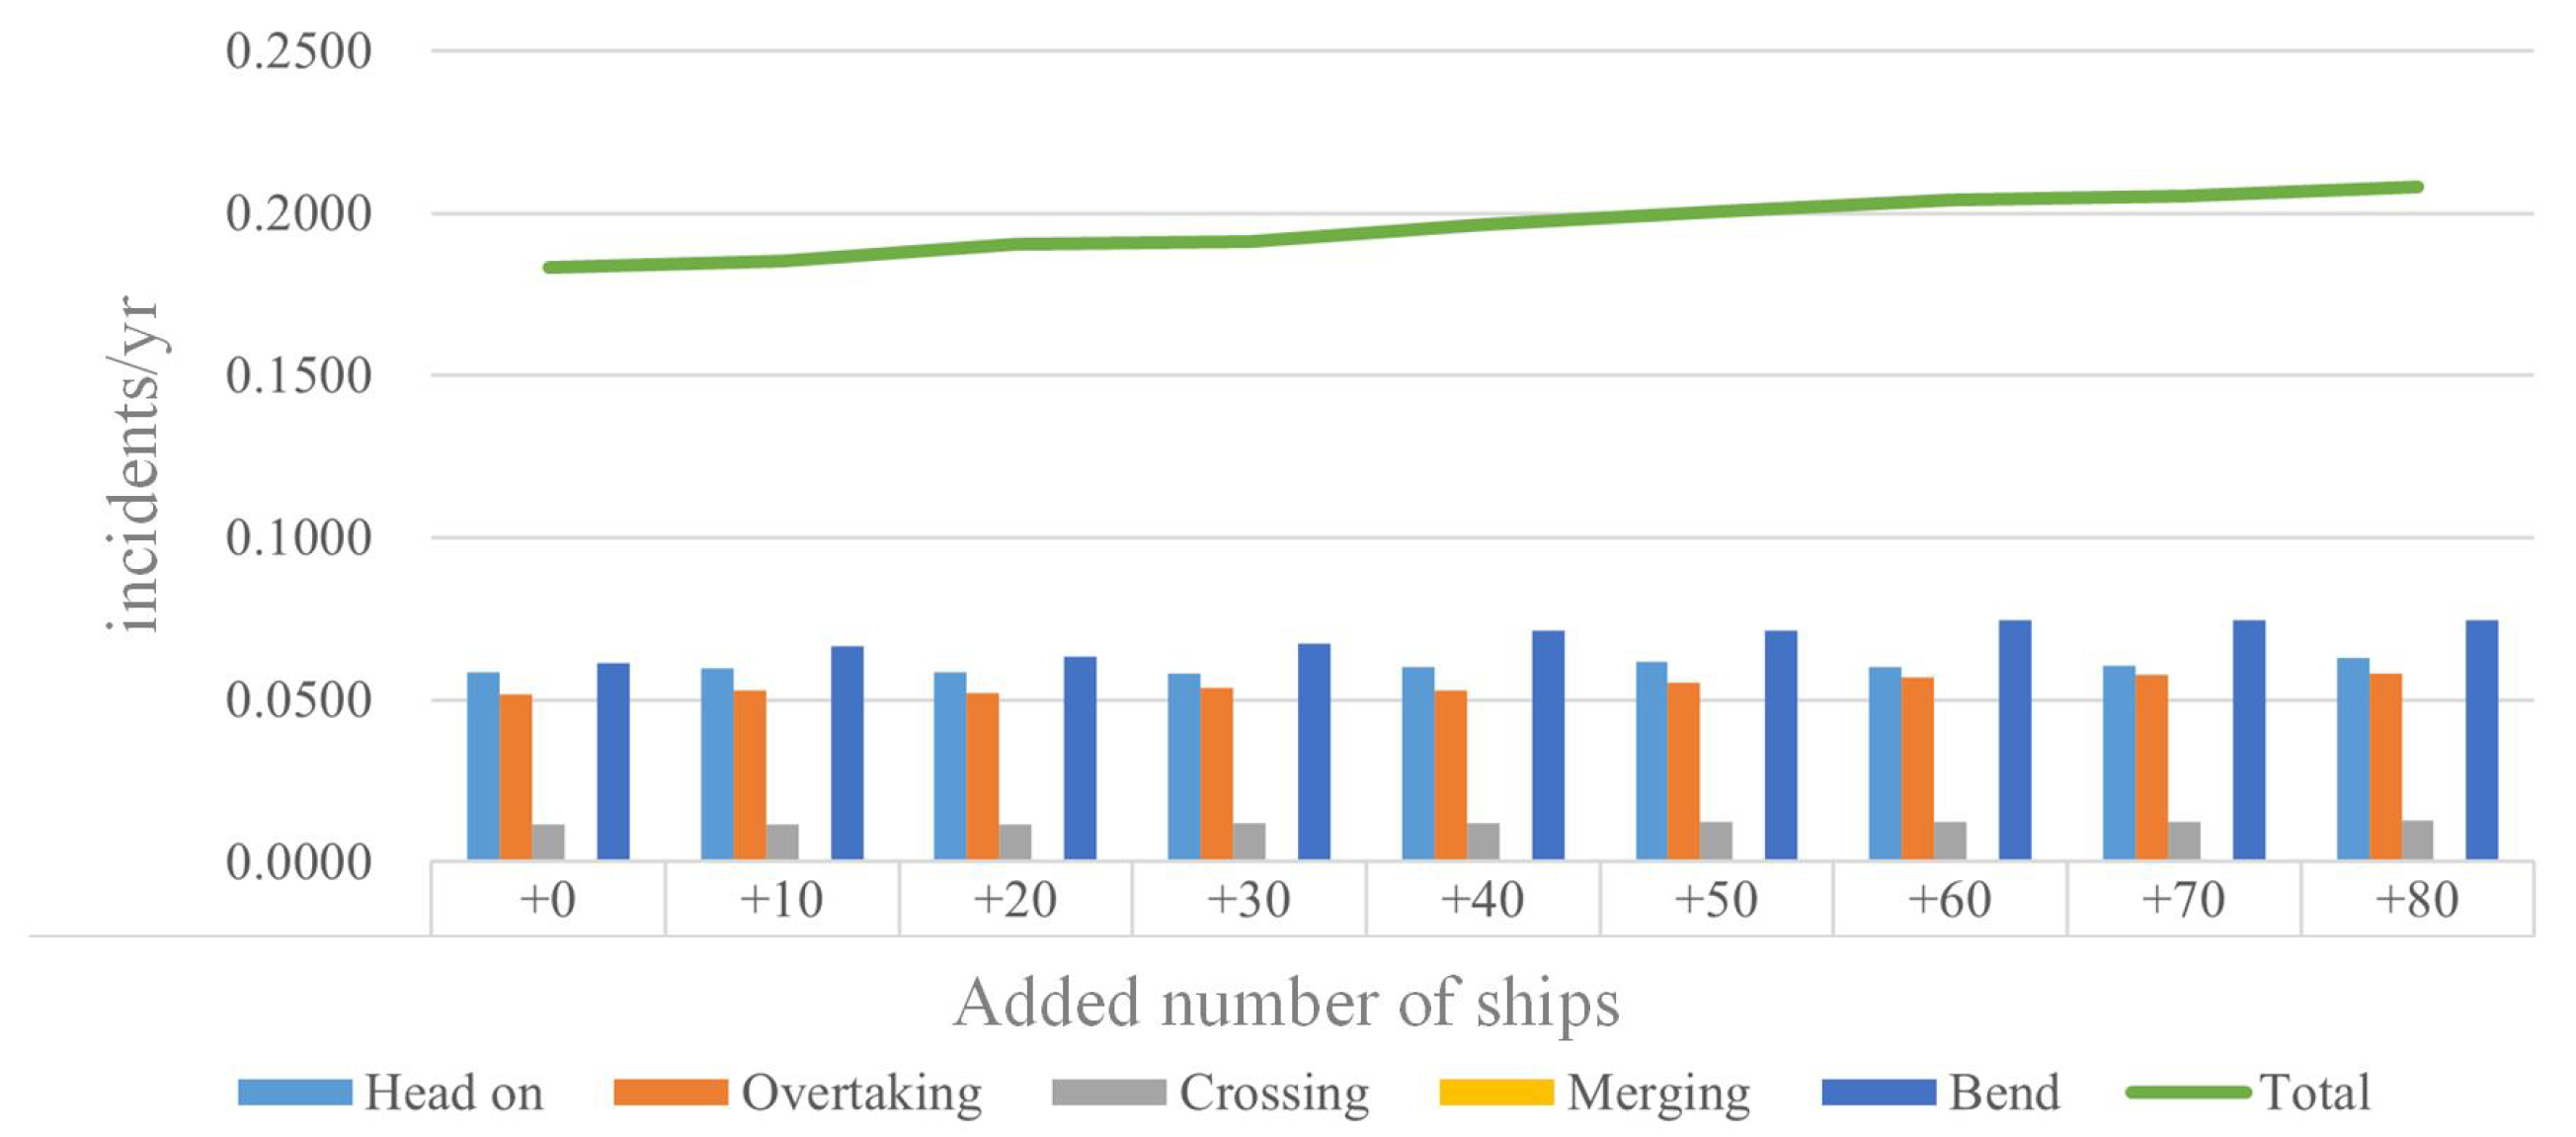
The impact of an increasing volume of OGV traffic on collision risk in the study area was simulated. As shown in Figure 8, using AIS data for a randomly selected day in 2019, the simulation indicated that the addition of up to 80 OGVs per day to existing traffic only increased the collision risk from 0.1832 to 0.2079 incidents per year (+13.5%, and this change is not significant).

4.3. Traffic Records from Real-Time Observations

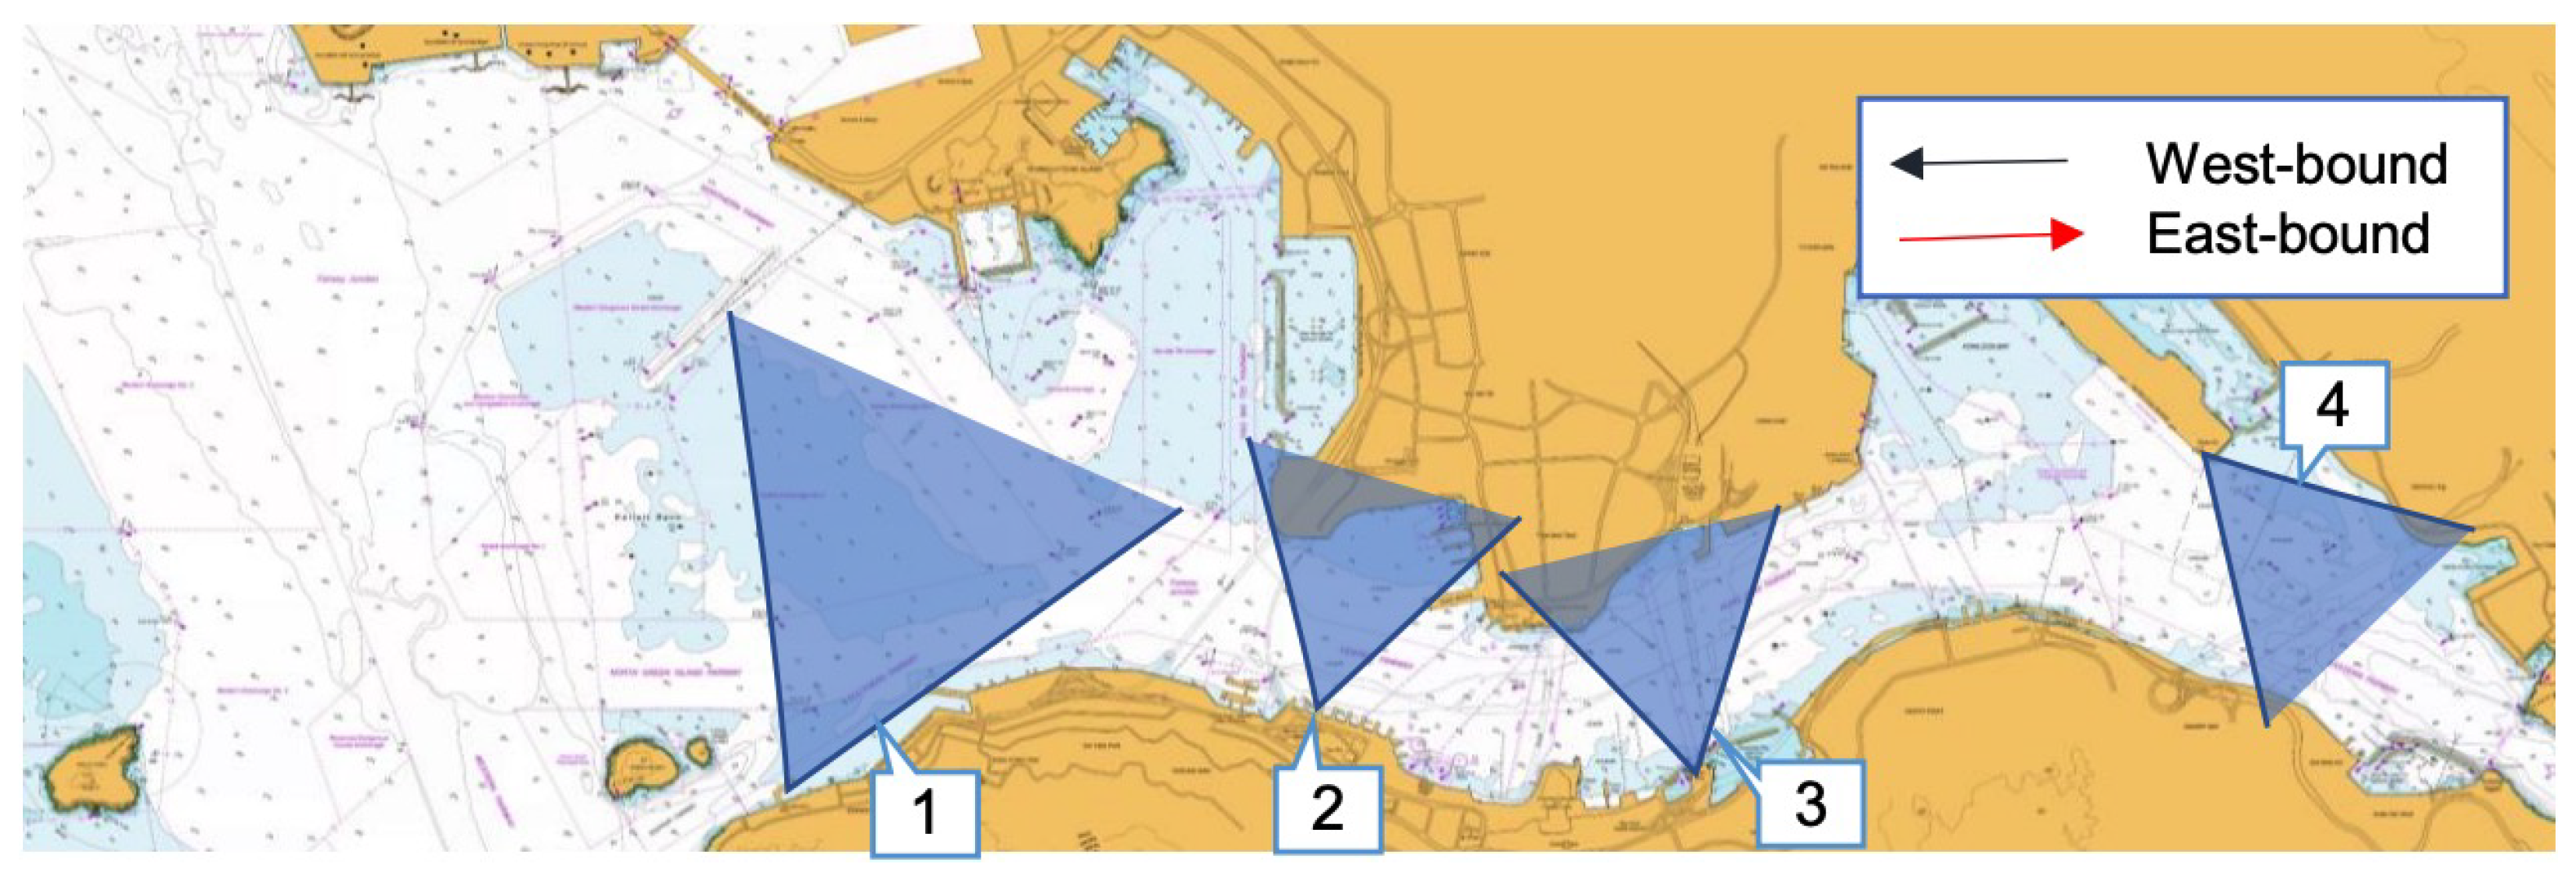
In Figure 9, we select four areas to observe and record vessel traffic in real time. Table 3 records the number of vessels from 07:00 to 18:00 on 12 randomly selected days in October 2022. Area 1 has the highest traffic volume, primarily comprising local vessels (62.0%) and ferries (28.2%). Traffic volume gradually decreases from Area 2 to Area 4, but the proportion of local vessels increases. Ferries account for a high proportion in Area 1, while their proportion decreases significantly in other areas (5.4–11.9%). Ocean-going and inland waterway vessels are the least numerous.

4.4. Discussion

This subsection will provide an overall discussion based on the findings, and the following risks are identified in order of risk: The first are collision and grounding. Through traffic levels and patterns, four areas were identified where ships must be extra careful when transiting. In the past five years, there has been only one collision in the channel and three collisions related to normal navigation. The accident risk for the entire study area in 2019 was 0.29/half-year. And Marine Department statistics show that there have been no grounding incidents in the study area in the past five years. Severe weather conditions pose significant challenges for ocean-going ships, making them particularly vulnerable to events such as strong monsoons, typhoons, and heavy rains. However, these conditions are relatively rare. For instance, wind speeds exceeding the central fairway BGL limit of 21 knots occur less than 0.5% of the time, while visibility below the MD standard of 1 nautical mile is observed only 1.3% of the time. This suggests that the number of days when such weather conditions impose central fairway restrictions on ocean-going vessels is extremely limited. In addition, large events on waterways also have the potential to disrupt waterway traffic, such as firework displays, sailing regattas, and sea parades in Victoria Harbour, Hong Kong. However, organizers of large events must obtain approval from the Marine Department, which will issue a Marine Department Notice to inform port users. Such events disrupt general traffic and are not suitable for ocean-going vessels for safety reasons.

5. Conclusions

This study assesses the reliability of risk calculations derived from the automatic identification system (AIS) in high-traffic waterways, integrating AIS data with video surveillance data to provide a comprehensive analysis of ship collision risks. By using the IWRAP tool to simulate maritime traffic flow, the probability of collision risk in different waters during different time periods is evaluated in detail. Furthermore, this paper examines data from 2019 to 2022 to investigate the impact of the COVID-19 pandemic on maritime traffic, revealing a reduction in ship arrivals during the pandemic and a corresponding decrease in accident risk. The study identified four traffic conflict areas in the central port area and pointed out that there are multi-directional ship interactions in these areas, but compliance with traffic rules can effectively reduce the risk of accidents. These findings provide valuable guidance for port authorities in optimizing traffic management strategies, such as improving navigational aids or establishing traffic separation schemes in high-risk areas.
In order to more accurately analyze waterway risks, this paper uses the YOLOv7 model for real-time ship detection to capture dynamic information for ships in the waterway. The experimental results show that the analysis method combining visual data with AIS data can better understand and manage waterway safety risks, providing important support for the formulation of more effective safety measures.
While this study provides significant insights, it has some limitations. The geographical scope is restricted to Hong Kong waters, which may limit the generalizability of findings to other regions. Additionally, the simplified assumptions of the IWRAP tool may not fully capture complex vessel interactions. Future research should extend the methodology to diverse geographical areas, incorporate external factors such as weather and human error, and further refine real-time detection models to improve monitoring accuracy. Exploring the effects of autonomous vessels on waterway risk dynamics could also provide valuable insights for the future of maritime safety management.

Author Contributions

Conceptualization, Y.J.; methodology, Y.J. and D.Y.; software, Y.J.; validation, Y.J. and D.Y.; formal analysis, Y.J.; investigation, W.X.; resources, W.X.; data curation, W.X.; writing—original draft preparation, Y.J. and D.Y.; writing—review and editing, Y.J.; visualization, W.X.; supervision, D.Y.; project administration, D.Y. All authors have read and agreed to the published version of the manuscript.

Funding

This research received no external funding.

Data Availability Statement

The data presented in this study are available on request from the corresponding author. The reason for this restriction is that the data originates from government departments, and the raw dataset cannot be directly published. However, the data can be obtained upon request after communication with the corresponding author.

Conflicts of Interest

The authors declare no conflicts of interest.

References

  1. Yang, D.; Wu, L.; Wang, S.; Jia, H.; Li, K.X. How big data enriches maritime research–a critical review of Automatic Identification System (AIS) data applications. Transp. Rev. 2019, 39, 755–773. [Google Scholar] [CrossRef]
  2. Xiao, G.; Amamoo-Otoo, C.; Wang, T.; Li, Q.; Biancardo, S.A. Evaluating the impact of ECA policy on sulfur emissions from the five busiest ports in America based on difference in difference model. Front. Mar. Sci. 2025, 12, 1609261. [Google Scholar] [CrossRef]
  3. Wu, M.; Li, X.; Chen, Y. Port–Shipping Interplay: A Multi-Stage Analysis of Facility Upgrades and Cargo Movement. Mathematics 2025, 13, 1152. [Google Scholar] [CrossRef]
  4. Wang, T.; Xiao, G.; Li, Q.; Biancardo, S.A. The impact of the 21st-Century Maritime Silk Road on sulfur dioxide emissions in Chinese ports: Based on the difference-in-difference model. Front. Mar. Sci. 2025, 12, 1608803. [Google Scholar] [CrossRef]
  5. He, Z.; Zhao, P.; Zhang, S.; Li, Z.; Huang, G.; Zhang, C.; Niu, Y. Analyzing foreland dynamics in China’s port clusters under global major events (2019–2022) by AIS trajectory data. Ocean. Coast. Manag. 2024, 255, 107269. [Google Scholar] [CrossRef]
  6. Yang, K.; Yang, D.; Lu, Y. Enhancing risk perception by integrating ship interactions in multi-ship encounters: A Graph-based Learning method. Reliab. Eng. Syst. Saf. 2025, 261, 111150. [Google Scholar] [CrossRef]
  7. Lam, R.P.K.; Wong, R.T.M.; Lau, E.H.Y.; Wong, K.W.; Cheung, A.C.K.; Chaang, V.K.; Chen, L.; Tsang, T.C.; Chan, T.K.; Chee, P.P.Y.; et al. Injury patterns of mass casualty incidents involving high-speed passenger ferries presenting to accident and emergency departments in Hong Kong: A retrospective review. Injury 2020, 51, 252–259. [Google Scholar] [CrossRef]
  8. Wang, Y.F.; Wang, L.T.; Jiang, J.C.; Wang, J.; Yang, Z.L. Modelling ship collision risk based on the statistical analysis of historical data: A case study in Hong Kong waters. Ocean Eng. 2020, 197, 106869. [Google Scholar] [CrossRef]
  9. Qu, J.; Liu, R.W.; Guo, Y.; Lu, Y.; Su, J.; Li, P. Improving maritime traffic surveillance in inland waterways using the robust fusion of AIS and visual data. Ocean Eng. 2023, 275, 114198. [Google Scholar] [CrossRef]
  10. Guo, Y.; Liu, R.W.; Qu, J.; Lu, Y.; Zhu, F.; Lv, Y. Asynchronous trajectory matching-based multimodal maritime data fusion for vessel traffic surveillance in inland waterways. IEEE Trans. Intell. Transp. Syst. 2023, 24, 12779–12792. [Google Scholar] [CrossRef]
  11. Liu, R.W.; Lu, Y.; Guo, Y.; Ren, W.; Zhu, F.; Lv, Y. AiOENet: All-in-one low-visibility enhancement to improve visual perception for intelligent marine vehicles under severe weather conditions. IEEE Trans. Intell. Veh. 2023, 9, 3811–3826. [Google Scholar] [CrossRef]
  12. Li, L.; Xu, W.; Gao, Y.; Lu, Y.; Yang, D.; Liu, R.W.; Zhang, R. Attention-oriented residual block for real-time low-light image enhancement in smart ports. Comput. Electr. Eng. 2024, 120, 109634. [Google Scholar] [CrossRef]
  13. Yang, D.; Li, X.; Zhang, L. A novel vessel trajectory feature engineering for fishing vessel behavior identification. Ocean Eng. 2024, 310, 118677. [Google Scholar] [CrossRef]
  14. Xu, W.; Yang, D.; Gao, Y.; Lu, Y.; Zhang, J.; Guo, Y. MvKSR: Multi-view Knowledge-guided Scene Recovery for Hazy and Rainy Degradation. IEEE Trans. Instrum. Meas. 2024, 73, 5028712. [Google Scholar] [CrossRef]
  15. Lu, Y.; Yang, D.; Gao, Y.; Liu, R.W.; Liu, J.; Guo, Y. AoSRNet: All-in-One Scene Recovery Networks via multi-knowledge integration. Knowl.-Based Syst. 2024, 294, 111786. [Google Scholar] [CrossRef]
  16. Liu, R.W.; Lu, Y.; Gao, Y.; Guo, Y.; Ren, W.; Zhu, F.; Wang, F.Y. Real-Time Multi-Scene Visibility Enhancement for Promoting Navigational Safety of Vessels Under Complex Weather Conditions. IEEE Trans. Intell. Transp. Syst. 2024, 25, 19979–19994. [Google Scholar] [CrossRef]
  17. Lu, Y.; Yang, K.; Yang, D.; Ding, H.; Weng, J.; Liu, R.W. Graph Learning-Driven Multi-Vessel Association: Fusing Multimodal Data for Maritime Intelligence. arXiv 2025, arXiv:2504.09197. [Google Scholar] [CrossRef]
  18. Paté-Cornell, M.E. Organizational aspects of engineering system safety: The case of offshore platforms. Science 1990, 250, 1210–1217. [Google Scholar] [CrossRef]
  19. Li, S.; Meng, Q.; Qu, X. An overview of maritime waterway quantitative risk assessment models. Risk Anal. Int. J. 2012, 32, 496–512. [Google Scholar] [CrossRef] [PubMed]
  20. Merrick, J.R.; Van Dorp, R. Speaking the truth in maritime risk assessment. Risk Anal. Int. J. 2006, 26, 223–237. [Google Scholar] [CrossRef] [PubMed]
  21. Yang, X.; Haugen, S.; Li, Y. Risk influence frameworks for activity-related risk analysis during operation: A literature review. Saf. Sci. 2017, 96, 102–116. [Google Scholar] [CrossRef]
  22. Grabowski, M.; Merrick, J.R.; Harrold, J.; Massuchi, T.; Van Dorp, J. Risk modeling in distributed, large-scale systems. IEEE Trans. Syst. Man Cybern. Part A Syst. Hum. 2000, 30, 651–660. [Google Scholar] [CrossRef]
  23. Soares, C.G.; Teixeira, A. Risk assessment in maritime transportation. Reliab. Eng. Syst. Saf. 2001, 74, 299–309. [Google Scholar] [CrossRef]
  24. Hu, S.; Li, X.; Fang, Q.; Yang, Z. Use of Bayesian method for assessing vessel traffic risks at sea. Int. J. Inf. Technol. Decis. Making 2008, 7, 627–638. [Google Scholar] [CrossRef]
  25. Hänninen, M.; Kujala, P. Influences of variables on ship collision probability in a Bayesian belief network model. Reliab. Eng. Syst. Saf. 2012, 102, 27–40. [Google Scholar] [CrossRef]
  26. Pedersen, P.T. Review and application of ship collision and grounding analysis procedures. Mar. Struct. 2010, 23, 241–262. [Google Scholar] [CrossRef]
  27. Heij, C.; Bijwaard, G.E.; Knapp, S. Ship inspection strategies: Effects on maritime safety and environmental protection. Transp. Res. Part D Transp. Environ. 2011, 16, 42–48. [Google Scholar] [CrossRef]
  28. Goerlandt, F.; Montewka, J. Maritime transportation risk analysis: Review and analysis in light of some foundational issues. Reliab. Eng. Syst. Saf. 2015, 138, 115–134. [Google Scholar] [CrossRef]
  29. Goerlandt, F.; Kujala, P. On the reliability and validity of ship–ship collision risk analysis in light of different perspectives on risk. Saf. Sci. 2014, 62, 348–365. [Google Scholar] [CrossRef]
  30. Lim, G.J.; Cho, J.; Bora, S.; Biobaku, T.; Parsaei, H. Models and computational algorithms for maritime risk analysis: A review. Ann. Oper. Res. 2018, 271, 765–786. [Google Scholar] [CrossRef]
  31. Zaccone, R. A dynamic programming approach to the collision avoidance of autonomous ships. Mathematics 2024, 12, 1546. [Google Scholar] [CrossRef]
  32. Laine, V.; Goerlandt, F.; Baldauf, M.; Mehdi, R.; Besikçi, E.; Koldenhof, Y.; Al Quhali, M.; Backer, H. OpenRisk Guideline for Regional Risk Management to Improve European Pollution Preparedness and Response at Sea; HELCOM–Helsinki Commission: Helsinki, Finland, 2018; Volume 111. [Google Scholar]
  33. Mullai, A.; Paulsson, U. A grounded theory model for analysis of marine accidents. Accid. Anal. Prev. 2011, 43, 1590–1603. [Google Scholar] [CrossRef]
  34. Gaonkar, R.S.P.; Xie, M.; Ng, K.M.; Habibullah, M.S. Subjective operational reliability assessment of maritime transportation system. Expert Syst. Appl. 2011, 38, 13835–13846. [Google Scholar] [CrossRef]
  35. Liu, J.; Yang, J.B.; Wang, J.; Sii, H.S. Engineering system safety analysis and synthesis using the fuzzy rule-based evidential reasoning approach. Qual. Reliab. Eng. Int. 2005, 21, 387–411. [Google Scholar] [CrossRef]
  36. Montewka, J.; Hinz, T.; Kujala, P.; Matusiak, J. Probability modelling of vessel collisions. Reliab. Eng. Syst. Saf. 2010, 95, 573–589. [Google Scholar] [CrossRef]
  37. Kolowrocki, K.; Soszynska, J. On safety analysis of complex technical maritime transportation systems. Proc. Inst. Mech. Eng. Part O J. Risk Reliab. 2011, 225, 345–354. [Google Scholar] [CrossRef]
  38. Singh, S.; Singh, J.; Singh, S.; Goyal, S.; Raboaca, M.S.; Verma, C.; Suciu, G. Detection and mitigation of GNSS spoofing attacks in maritime environments using a genetic algorithm. Mathematics 2022, 10, 4097. [Google Scholar] [CrossRef]
  39. Tao, L.; Chen, L.; Ge, D.; Yao, Y.; Ruan, F.; Wu, J.; Yu, J. An integrated probabilistic risk assessment methodology for maritime transportation of spent nuclear fuel based on event tree and hydrodynamic model. Reliab. Eng. Syst. Saf. 2022, 227, 108726. [Google Scholar] [CrossRef]
  40. Yin, J. Quantitative Risk Assessment for Maritime Safety Management. Ph.D. Thesis, Hong Kong Polytechnic University, Hong Kong, China, 2011. [Google Scholar]
  41. Dominguez-Péry, C.; Vuddaraju, L.N.R.; Corbett-Etchevers, I.; Tassabehji, R. Reducing maritime accidents in ships by tackling human error: A bibliometric review and research agenda. J. Shipp. Trade 2021, 6, 20. [Google Scholar] [CrossRef]
  42. Salihoglu, E.; Beşikçi, E.B. The use of Functional Resonance Analysis Method (FRAM) in a maritime accident: A case study of Prestige. Ocean Eng. 2021, 219, 108223. [Google Scholar] [CrossRef]
  43. Goerlandt, F.; Kujala, P. Traffic simulation based ship collision probability modeling. Reliab. Eng. Syst. Saf. 2011, 96, 91–107. [Google Scholar] [CrossRef]
  44. Cozzani, V.; Gubinelli, G.; Antonioni, G.; Spadoni, G.; Zanelli, S. The assessment of risk caused by domino effect in quantitative area risk analysis. J. Hazard. Mater. 2005, 127, 14–30. [Google Scholar] [CrossRef]
  45. Senol, Y.E.; Aydogdu, Y.V.; Sahin, B.; Kilic, I. Fault tree analysis of chemical cargo contamination by using fuzzy approach. Expert Syst. Appl. 2015, 42, 5232–5244. [Google Scholar] [CrossRef]
  46. Cui, H.; Qi, H.; Zhou, J. DBN-MACTraj: Dynamic Bayesian Networks for Predicting Combinations of Long-Term Trajectories with Likelihood for Multiple Agents. Mathematics 2024, 12, 3674. [Google Scholar] [CrossRef]
  47. Zhang, Y.; Hu, H.; Dai, L. Real-time assessment and prediction on maritime risk state on the Arctic Route. Marit. Policy Manag. 2020, 47, 352–370. [Google Scholar] [CrossRef]
  48. Liu, K.; Yu, Q.; Yuan, Z.; Yang, Z.; Shu, Y. A systematic analysis for maritime accidents causation in Chinese coastal waters using machine learning approaches. Ocean Coast. Manag. 2021, 213, 105859. [Google Scholar] [CrossRef]
  49. Wen, X.; Xie, Y.; Jiang, L.; Pu, Z.; Ge, T. Applications of machine learning methods in traffic crash severity modelling: Current status and future directions. Transport Rev. 2021, 41, 855–879. [Google Scholar] [CrossRef]
  50. Yang, D.; Yang, K.; Lu, Y.; Liang, M.; Zhao, C. Graph-driven multi-vessel long-term trajectories prediction for route planning under complex waters. Ocean Engineering 2024, 313, 119511. [Google Scholar] [CrossRef]
  51. Riveiro, M.; Pallotta, G.; Vespe, M. Maritime anomaly detection: A review. Wiley Interdiscip. Rev. Data Min. Knowl. Discov. 2018, 8, e1266. [Google Scholar] [CrossRef]
  52. Uyanık, T.; Karatuğ, Ç.; Arslanoğlu, Y. Machine learning approach to ship fuel consumption: A case of container vessel. Transp. Res. Part D Transp. Environ. 2020, 84, 102389. [Google Scholar] [CrossRef]
  53. Jin, M.; Shi, W.; Yuen, K.F.; Xiao, Y.; Li, K.X. Oil tanker risks on the marine environment: An empirical study and policy implications. Mar. Policy 2019, 108, 103655. [Google Scholar] [CrossRef]
  54. Hashemi, R.R.; Le Blanc, L.A.; Rucks, C.T.; Shearry, A. A neural network for transportation safety modeling. Expert Syst. Appl. 1995, 9, 247–256. [Google Scholar] [CrossRef]
  55. Kulkarni, K.; Goerlandt, F.; Li, J.; Banda, O.V.; Kujala, P. Preventing shipping accidents: Past, present, and future of waterway risk management with Baltic Sea focus. Saf. Sci. 2020, 129, 104798. [Google Scholar] [CrossRef]
  56. Mou, J.M.; Van der Tak, C.; Ligteringen, H. Study on collision avoidance in busy waterways by using AIS data. Ocean Eng. 2010, 37, 483–490. [Google Scholar] [CrossRef]
  57. Yekeen, S.T.; Balogun, A.L. Advances in remote sensing technology, machine learning and deep learning for marine oil spill detection, prediction and vulnerability assessment. Remote Sens. 2020, 12, 3416. [Google Scholar] [CrossRef]
  58. Kretschmann, L. Leading indicators and maritime safety: Predicting future risk with a machine learning approach. J. Shipp. Trade 2020, 5, 19. [Google Scholar] [CrossRef]
  59. Wang, C.Y.; Bochkovskiy, A.; Liao, H.Y.M. YOLOv7: Trainable bag-of-freebies sets new state-of-the-art for real-time object detectors. In Proceedings of the 2023 IEEE/CVF Conference on Computer Vision and Pattern Recognition (CVPR), Vancouver, BC, Canada, 17–24 June 2023; pp. 7464–7475. [Google Scholar] [CrossRef]
  60. Chen, X.; Wei, C.; Yang, Y.; Luo, L.; Biancardo, S.A.; Mei, X. Personnel trajectory extraction from port-like videos under varied rainy interferences. IEEE Trans. Intell. Transp. Syst. 2024, 25, 6567–6579. [Google Scholar] [CrossRef]
Figure 1. The flowchart of AIS data cleaning. AIS data cleaning can effectively improve the accuracy and reliability of data in waterway risk calculation.
Mathematics 13 02961 g001
Figure 2. Visual comparison before and after data cleaning: noise data and trajectory jumping phenomena are effectively suppressed.
Mathematics 13 02961 g002
Figure 3. Overview of IWRAP workflow.
Mathematics 13 02961 g003
Figure 4. Risk density map for vessels travelling within the study area. Lighter colours indicate lower risk; darker colours indicate higher risk.
Mathematics 13 02961 g004
Figure 5. Risk analysis of 24-h periods and 7-day weekly cycles across four key indicators.
Mathematics 13 02961 g005
Figure 6. The collision risk ratio of different types of ships in different regions. The main source of CHT risk is the general cargo ship, while the collision risk of passenger ships is generally low.
Mathematics 13 02961 g006
Figure 7. Important segments of the central channel and risk heat map of different shipping lanes in different time periods.
Mathematics 13 02961 g007
Figure 8. Collision risk of additional simulated OGV traffic.
Mathematics 13 02961 g008
Figure 9. Four areas to observe ships in Hong Kong.
Mathematics 13 02961 g009
Table 1. Collision risk in the study area for vessels in 2019 and 2022.
2019 May–Oct2021 May–Oct
(Pre-COVID-19)(COVID-19)
Study AreaCausation Factor0.28840.1405
Risk Probability0.29 incidents/yr0.14 incidents/yr
Central Fairway PathCausation Factor0.13650.0602
Risk Probability0.14 incidents/yr0.06 incidents/yr
Proportion of risk47.32%42.83%
Table 2. Ship collision risk in the whole study water area in 2019, 2020, 2021, and 2022.
Study Area2019 Sep–Oct2020 Sep–Oct2021 Sep–Oct2022 Sep–Oct
Causation Factor0.26280.15480.13680.0756
Risk Probability0.26 incidents/yr0.15 incidents/yr0.14 incidents/yr0.08 incidents/yr
Table 3. Ships recorded by real-time observation on 12 randomly selected days in October 2022, from 07:00 to 18:00. From left to right, Area 1 refers to China Merchants Wharf, Area 2 refers to Central Government Pier, Area 3 refers to Royal Hong Kong Yacht Club, and Area 4 refers to Kai Tak Cruise Terminal.
Area 1Area 2Area 3Area 4
WestEastTotalWestEastTotalWestEastTotalWestEastTotal
OGV463392855114992131151062219093184
Ferry119712492446453437890127147274194189383
Local Vessel267527055380319931576356228622134499186720043870
Total433543468681376636937459252824665094215122864437
Disclaimer/Publisher’s Note: The statements, opinions and data contained in all publications are solely those of the individual author(s) and contributor(s) and not of MDPI and/or the editor(s). MDPI and/or the editor(s) disclaim responsibility for any injury to people or property resulting from any ideas, methods, instructions or products referred to in the content.