Article

Carbon Price Prediction and Risk Assessment Considering Energy Prices Based on Uncertain Differential Equations

1
Digital Department, State Grid Jibei Electric Power Company Limited, Beijing 100029, China
2
Institute of Economic Technology, State Grid Jibei Electric Power Company Limited, Beijing 100029, China
3
School of Economics and Management, North China Electric Power University, Beijing 102206, China
*
Author to whom correspondence should be addressed.
Mathematics 2025, 13(17), 2834; https://doi.org/10.3390/math13172834
Submission received: 5 August 2025 / Revised: 18 August 2025 / Accepted: 1 September 2025 / Published: 3 September 2025
(This article belongs to the Special Issue Uncertainty Theory and Applications)

Abstract

Against the backdrop of escalating atmospheric carbon dioxide concentrations, carbon emission trading systems (ETS) have emerged as pivotal policy instruments, with China’s ETS playing a prominent role globally. The carbon price, central to ETS functionality, guides resource allocation and corporate strategies. Due to unexpected events, political conflicts, limited access to data information, and insufficient cognitive levels of market participants, there are epistemic uncertainties in the fluctuations of carbon and energy prices. Existing studies often lack effective handling of these epistemic uncertainties in energy prices and carbon prices. Therefore, the core objective of this study is to reveal the dynamic linkage patterns between energy prices and carbon prices, and to quantify the impact mechanism of epistemic uncertainties on their relationship with the help of uncertain differential equations. Methodologically, a dynamic model of carbon and energy prices was constructed, and analytical solutions were derived and their mathematical properties were analyzed to characterize the linkage between carbon and energy prices. Furthermore, based on the observation data of coal prices in Qinhuangdao Port and national carbon prices, the unknown parameters of the proposed model were estimated, and uncertain hypothesis tests were conducted to verify the rationality of the proposed model. Results showed that the mean squared error of the established model for fitting the linkage relationship between carbon and energy prices was 0.76, with the fitting error controlled within 3.72 % . Moreover, the prediction error was 1. 88 % . Meanwhile, the 5 % value at risk (VaR) of the logarithmic return rate of carbon prices was predicted to be 0.0369 . The research indicates that this methodology provides a feasible framework for capturing the uncertain interactions in the carbon-energy market. The price linkage mechanism revealed by it helps market participants optimize their risk management strategies and provides more accurate decision-making references for policymakers.

1. Introduction

The relentless increase in atmospheric carbon dioxide concentrations represents one of the most formidable challenges confronting humanity, manifesting in accelerating global climate change with profound environmental, economic, and societal consequences [1]. To mitigate this existential threat, carbon emission trading systems (ETS) have emerged globally as a cornerstone policy instrument, leveraging market mechanisms to incentivize cost-effective greenhouse gas emission reductions. Valued for their economic efficiency, capacity to spur low-carbon innovation, and transparency, carbon markets are pivotal in facilitating the transition towards global carbon neutrality. As the world’s largest energy consumer and carbon dioxide emitter, China’s strategic development and expansion of its national ETS hold immense significance. Having surpassed the European Union ETS in traded volume, China’s carbon market is now a focal point in global carbon mitigation efforts [2]. According to the International Energy Agency’s 2025 report, China’s carbon emissions in 2024 remained roughly unchanged from those in 2023, amounting to 1.26 billion tonnes, among which emissions from the energy sector increased by 0.4 % , while those from industrial processes decreased by 5 % . China’s total carbon emissions account for 1 / 3 of the global total, which is comparable to the proportion of China’s manufacturing industry in the global manufacturing sector. Considering China’s GDP growth rate, the value of China’s carbon emission intensity is on a downward trend.
Central to the functioning of any ETS is the carbon price. This critical signal guides resource allocation, informs corporate decarbonization strategies and investment decisions, and underpins the valuation of carbon assets. Only accurate prediction of carbon prices can guide the government in formulating reasonable carbon market policies, encourage enterprises to actively participate in carbon market trading, encourage social capital to actively invest in low-carbon technology industries, and promote the comprehensive low-carbon transformation of the economy [3]. Carbon price is influenced by the dynamic interactions of policy and institutional factors, financial markets, macroeconomics, climate change, and the crucial energy market [4]. Using the quantile connectedness approach, Wang et al. [5] analyzed the spillovers among climate policy uncertainty, energy price, green bond index, and carbon price. Yan et al. [6] found that there is a long-term equilibrium relationship between carbon price and coal futures price, and they can also influence each other in the short term. Dong et al. [7] used time frequency network analysis based on quantile vector autoregression and revealed the risk spillovers between China’s energy, financial, and carbon markets in different time and frequency domains. Taking into account economic policy uncertainty and investor sentiment, Man et al. [8] evaluated the risk spillover and hedging performance of China’s carbon energy finance markets system before and after its establishment of a national unified carbon market.
Among these influencing factors, the energy market vitally impacts the carbon market. Liu et al. [9] measured the tail dependence and risk spillover effects between China’s carbon market and the coal, crude oil, and natural gas markets using the TVP-Copula-CoVaR method. Based on the methods of network topology analysis and the DY spillover index, Qiao et al. [10] analyzed the time-varying spillover effect and network structure of risk transmission among renewable energy, non-renewable energy, and carbon markets. By employing the dynamic conditional correlation generalized autoregressive conditional heteroscedasticity model, Chang et al. [11] investigated the volatility spillover effects and dynamic correlations between China’s emissions allowances and fossil energy markets. Considering different time horizons, Cui et al. [12] utilized a proposed wavelet-based multi-scale investigation framework to explore the information spillovers and dynamic dependence between China’s energy and regional carbon emission trading markets. Liu et al. [13] identified the interactions between fossil fuel and carbon market prices in Guangdong. Coal-fired power generation is the main source of carbon emissions [14,15] in China and has a significant impact on the carbon price trajectory. A decline in coal prices typically enhances the relative cost competitiveness of coal-fired power generation compared to lower-carbon alternatives. This leads to increased coal consumption, higher CO2 emissions, and consequently, greater demand for emission allowances within the ETS, exerting upward pressure on carbon prices. Conversely, a significant rise in coal prices can diminish coal consumption, reduce associated emissions, lower compliance demand for allowances, and thus potentially place downward pressure on carbon prices. Studying the dynamic relationship between the coal market and the carbon market is of great practical significance for correctly handling the relationship between carbon reduction policies and energy consumption and achieving carbon peak targets.
Existing studies have achieved significant results, laying a solid foundation for further exploration. Note that most of these studies are based on probability theory to characterize uncertainties in energy and carbon price fluctuations. Actually, probability theory is mainly good at dealing with situations where its corresponding probability models can be determined through mathematical statistical methods and data analysis, and uncertainties that exist at this time are aleatory uncertainties [16]. However, most of the data closely related to human activities in the real world we face are difficult to meet these ideal conditions [17]. Due to unexpected events, political conflicts, limited access to data information, and insufficient cognitive levels of market participants, there are epistemic uncertainties [18] in the fluctuations of carbon and energy prices. To reasonably deal with epistemic uncertainty, uncertainty theory [18] was founded as another axiomatic mathematical system. Under the framework of uncertainty theory, uncertain differential equations [19] were proposed to characterize the evolution of dynamic systems affected by uncertain noise interference and to describe dynamic phenomena with uncertainty by combining deterministic differential equations with uncertain processes. Chen and Liu [20] proved the existence and uniqueness theorem of the solution of an uncertain differential equation under the linear growth condition and the Lipschitz condition. Noticing that some uncertain differential equations do not have analytical solutions, Yao and Chen [21] linked the solutions to a series of ordinary differential equations and designed a numerical method. For practical purposes, moment estimations for unknown parameters based on different forms [22] and residuals [23] of uncertain differential equations were investigated. Based on these theory methods, uncertain differential equations have been successfully applied in many fields, such as stock prices [23], carbon emissions [24], and reliability evaluation [25]. It can be seen that uncertain differential equations have already revealed a promising development trend. However, as far as we know, there has been no research on applying uncertain differential equations to the fields related to energy and carbon prices.
Most previous research has utilized probability theory to deal with uncertainties in energy and carbon price fluctuations. In contrast, our study adopts uncertain differential equations to address the epistemic uncertainties that are often overlooked or inadequately handled by these traditional methods. This approach allows us to more effectively deal with the epistemic uncertainties present in the fluctuations of carbon and energy prices due to various real-world factors like unexpected events and limited data access. By establishing a carbon-energy linkage model, this study explores in detail how energy prices affect overall carbon prices by influencing the mean and fluctuation path of carbon market prices and delves into the dynamic relationship between energy markets and carbon markets. The findings of this research have positive significance for clarifying the linkage between carbon and energy prices and are expected to contribute to providing practical implications for policymakers and market participants in navigating the increasingly interconnected energy-carbon markets.
The remainder of this paper is organized as follows. Section 2 establishes the carbon-energy linkage model and derives its analytical solution to characterize the price trends of carbon and energy. Using historical data on carbon and energy prices, an estimation method and hypothesis testing method for the proposed model are presented in Section 3. Based on these, a case study is shown in Section 4. Finally, the conclusions of this study are presented in Section 5.

2. Model Construction and Analysis

In order to study the impact mechanism of energy prices on carbon prices, it is first necessary to establish a linkage model between carbon prices and energy prices. Despite fluctuations in carbon prices, they often tend to recover to a certain level over a period of time. This is because the supply and demand relationship in the carbon market has a self-regulating mechanism. When carbon prices are too high, companies will have more motivation to adopt energy-saving and emission reduction technologies and optimize production processes to reduce carbon emissions and thus reduce the demand for carbon quotas; at the same time, higher carbon prices will stimulate more carbon reduction projects and increase the supply of carbon quotas. On the contrary, when carbon prices are too low, companies have insufficient motivation to reduce emissions, the demand for carbon quotas is relatively stable, and the supply may decrease, leading to a rebound in carbon prices. This self-regulation of market supply and demand ensures that carbon prices do not deviate from a specific level in the long term, which is consistent with the assumptions of the mean reversion model. Therefore, we use the following mean reversion uncertain differential model:
d X t = ( m a X t + γ Y t k 1 ) d t + σ 1 Y t k 2 d C t , X t 0 = x t 0
to describe the linkage between energy prices and carbon prices. In this carbon-energy price linkage model (1), X t and Y t are carbon price and coal price at time t, respectively, and x t 0 is the initial carbon price at time t 0 , C t is a Liu process that measures the uncertainty of carbon prices over time, m, a, γ , σ , k 1 , and k 2 are unknown parameters to be estimated, m / a represents the average level of carbon prices, a measures the speed at which carbon prices return to the average level, σ represents the degree to which energy prices affect the level of carbon price fluctuations, and γ represents the degree of impact of energy prices on the average carbon prices, and power parameters k 1 and k 2 are added considering the possibility of nonlinear effects. In addition to the above analysis, we also use uncertain hypothesis testing to verify the model’s ability to fit actual data in the subsequent case study (see Table 1).
Firstly, we utilize the properties of uncertain differential equations [20] to obtain analytical solutions for the carbon-energy price linkage model (1).
Theorem 1.
As the solution for the carbon-energy price linkage model (1), the carbon price is written as follows:
X t = exp ( a ( t t 0 ) ) X t 0 + t 0 t ( m + γ Y s k 1 ) exp ( a ( s t 0 ) ) d s + t 0 t σ Y s k 2 exp ( a ( s t 0 ) ) d C s ,
where X t and Y t are prices of carbon and energy at time t, respectively, m, a, γ, σ, k 1 , and k 2 are unknown parameters to be estimated, and C t is a Liu process.
Proof. 
Inspiring by Chen and Liu [20], we denote two uncertain processes U t and V t via uncertain differential equations, written as follows:
d U t = u 1 t U t d t + v 1 t U t d C t ,
and
d V t = u 2 t U t d t + v 2 t U t d C t ,
where u 1 t = a , u 2 t = m + γ Y t k 1 , v 1 t = 0 , and v 2 t = σ Y t k 2 . According to [20], we obtain the following:
U t = U 0 exp 0 t u 1 s d s + 0 t v 1 s d C s
and
V t = V 0 + 0 t u 2 s U s d s + 0 t v 2 s U s d C s .
It follows from the integration by parts [20] that the following:
d ( U t V t ) = ( u 1 t U t V t + u 2 t ) d t + ( v 1 t U t V t + v 2 t ) d C t = ( m a X t + γ Y t k 1 ) d t + σ 1 Y t k 2 d C t ,
which mean the uncertain process X t = U t V t is the solution of the carbon-energy price linkage model (1). Taking U 0 = 1 and V 0 = x 0 , the solution can be obtained as follows:
X t = exp ( a ( t t 0 ) ) X t 0 + t 0 t ( m + γ Y s k 1 ) exp ( a ( s t 0 ) ) d s + t 0 t σ Y s k 2 exp ( a ( s t 0 ) ) d C s .
The theorem is proved. □
Secondly, based on the carbon-energy price linkage solution (2), we obtain the following properties for carbon prices.
Theorem 2.
At any given time t, the carbon price X t is a normal uncertain variable with the expected value, calculated as follows:
E ( X t ) = m a + exp ( a ( t t 0 ) ) X t 0 m a + γ exp ( a ( t t 0 ) ) t 0 t Y s k 1 exp ( a ( s t 0 ) ) d s ,
and the standard deviation is calculated as follows:
S D ( X t ) = exp ( a ( t t 0 ) ) t 0 t | σ | Y s k 2 exp ( a ( s t 0 ) ) d s ,
where Y t is the energy price at time t, m, a, γ, σ, k 1 , k 2 are unknown parameters to be estimated, and C t is a Liu process.
Proof. 
According to properties of Liu process [18], we know that the following is calculated:
exp ( a ( t t 0 ) ) t 0 t σ Y s k 2 exp ( a ( s t 0 ) ) d C s
is a normal uncertain variable with the expected value 0 and the standard deviation, written as follows:
exp ( a ( t t 0 ) ) t 0 t | σ | Y s k 2 exp ( a ( s t 0 ) ) d s
at each time t. It follows from properties of normal uncertain variable [18] that at each time t the carbon price X t is also a normal uncertain variable with the expected value, written as follows:
E ( X t ) = exp ( a ( t t 0 ) ) X t 0 + t 0 t ( m + γ Y s k 1 ) exp ( a ( s t 0 ) ) d s = m a + exp ( a ( t t 0 ) ) X t 0 m a + γ exp ( a ( t t 0 ) ) t 0 t Y s k 1 exp ( a ( s t 0 ) ) d s ,
and the standard deviation, written as follows:
S D ( X t ) = exp ( a ( t t 0 ) ) t 0 t | σ Y s k 2 exp ( a ( s t 0 ) ) | d s .
The theorem is proved. □
Recall that the uncertainty distribution and inverse uncertainty distribution for a normal uncertain variable with the expected value e and the standard deviation σ [18] are written as follows:
Φ ( x ) = 1 + exp π ( e x ) 3 σ 1
and
Φ 1 ( α ) = e + σ 3 π ln α 1 α ,
respectively. Correspondingly, at time t the uncertainty distribution and inverse uncertainty distribution for the carbon price X t are written as follows:
Φ t ( x ) = 1 + exp π ( E ( X t ) x ) 3 S D ( X t ) 1 ,
and
Φ t 1 ( α ) = E ( X t ) + S D ( X t ) 3 π ln α 1 α ,
respectively, where E ( X t ) and S D ( X t ) are shown in Theorem 2. Therefore, the 100 ( 1 α ) % ( α ( 0 , 1 ) ) confidence interval for the carbon price X t can be constructed as follows:
Φ t 1 ( α / 2 ) , Φ t 1 ( 1 α / 2 ) .

3. Parameter Estimation and Hypothesis Testing

In the preceding section, we developed a carbon-energy price linkage model (1) to characterize the dynamic relationship between carbon price and energy price. The model incorporates parameters m, a, γ , σ , k 1 , and k 2 that govern its behavioral dynamics, yet their specific values remain undetermined. To bridge the gap between theory and empirical reality, this section focuses on estimating these parameters using the residual-based moment estimation method [23].
Theorem 3.
Assume that x t 1 , x t 2 , ⋯, x t n are observed carbon prices at times t 1 , t 2 , ⋯, t n , respectively, and y t 1 , y t 2 , ⋯, y t n represent the corresponding observed energy prices at the same time instants. The i-th ( i = 1 , 2 , , n 1 ) residual for the carbon-energy price linkage model (1) can be calculated as follows:
ϵ i + 1 ( m , a , γ , σ , k 1 , k 2 ) = 1 + exp π ( E ( X t i + 1 ) x t i + 1 ) 3 S D ( X t i + 1 ) 1 ,
where
E ( X t i + 1 ) = m a + exp ( a ( t i t i + 1 ) ) X t i m a + γ a Y t i k 1 ( 1 exp ( a t i a t i + 1 ) )
and
S D ( X t i + 1 ) = exp ( a ( t i + 1 t i ) ) σ a Y t i k 2 exp ( a t i + 1 a t i ) 1 .
Proof. 
For each i ( i = 1 , 2 , , n 1 ) , the updated version for the carbon-energy linkage model (1) is
d X t = ( m a X t + γ Y t k 1 ) d t + σ 1 Y t k 2 d C t , X t i = x t i , t i t t i + 1 ,
whose solution is calculated as follows:
X t = exp ( a ( t t i ) ) X t i + t i t ( m + γ Y s k 1 ) exp ( a ( s t i ) ) d s + t i t σ Y s k 2 exp ( a ( s t i ) ) d C s ,
t i t t i + 1 . It follows from Theorem 2 that X t i + 1 are normal uncertain variables with the expected values calculated as follows:
E ( X t i + 1 ) = m a + exp ( a ( t i t i + 1 ) ) X t i m a + γ a Y t i k 1 ( 1 exp ( a t i a t i + 1 ) )
and the standard deviations, calculated as follows:
S D ( X t i + 1 ) = exp ( a ( t i + 1 t i ) ) σ a Y t i k 2 exp ( a t i + 1 a t i ) 1 .
i = 1 , 2 , , n 1 , respectively. Therefore, the uncertainty distributions for X t i + 1 are calculated as follows:
Φ t i + 1 ( x ) = 1 + exp π ( E ( X t i + 1 ) x ) 3 S D ( X t i + 1 ) 1 ,
i = 1 , 2 , , n 1 , respectively. Correspondingly, the i-th ( i = 1 , 2 , , n 1 ) residuals [23] can be calculated as follows:
ϵ i + 1 ( m , a , γ , σ , k 1 , k 2 ) = Φ t i + 1 ( x t i + 1 ) = 1 + exp π ( E ( X t i + 1 ) x t i + 1 ) 3 S D ( X t i + 1 ) 1 .
The theorem is proved. □
Theorem 4.
Assume that x t 1 , x t 2 , ⋯, x t n are observed carbon prices at times t 1 , t 2 , ⋯, t n , respectively, and y t 1 , y t 2 , ⋯, y t n represent the corresponding observed energy prices at the same time instants. Estimations m ^ , a ^ , γ ^ , σ ^ , k ^ 1 , k ^ 2 for unknown parameters m , a , γ , σ , k 1 , k 2 in the carbon-energy price linkage model (1) are the solution for the following system of equations, i.e., written as follows:
1 n 1 i = 1 n 1 ϵ i + 1 k ( m , a , γ , σ , k 1 , k 2 ) = 1 k + 1 , k = 1 , 2 , , 6 ,
where ϵ i + 1 k ( m , a , γ , σ , k 1 , k 2 ) are residuals shown in Theorem 3.
Proof. 
It follows from [23] that the uncertainty distribution for residuals is calculated as follows:
{ ϵ i ( m , a , γ , σ , k 1 , k 2 ) x } = { Φ t i + 1 ( x t i ) x } = { x t i Φ t i + 1 1 ( x ) } = x .
Accordingly, residuals ϵ i + 1 ( m ^ , a ^ , γ ^ , σ ^ , k ^ 1 , k ^ 2 ) , i = 1 , 2 , , n 1 can be regarded as n 1 samples of a linear uncertainty distribution L ( 0 , 1 ) , whose k-th moments are 1 / ( k + 1 ) , k = 1 , 2 , According to the idea of moment estimation, the sample moments should be good approximations of the corresponding population moments. Hence, estimations for unknown parameters should follow the following system of equations:
1 n 1 i = 1 n 1 ϵ i k ( m , a , γ , σ , k 1 , k 2 ) = 1 k + 1 , k = 1 , 2 , , 6
since there are six unknown parameters. The theorem is proved. □
Remark 1.
If the system of Equation (3) has no solution, unknown parameters can be estimated by solving the following minimization problem, i.e., the following:
min m , a , γ , σ , k 1 , k 2 k = 1 6 1 n 1 i = 1 n 1 ϵ i + 1 k ( m , a , γ , σ , k 1 , k 2 ) 1 k + 1 2 .

4. Case Study

This section presents the proposed methodology and verifies its effectiveness through a detailed case study.

4.1. Model Fitting and Testing

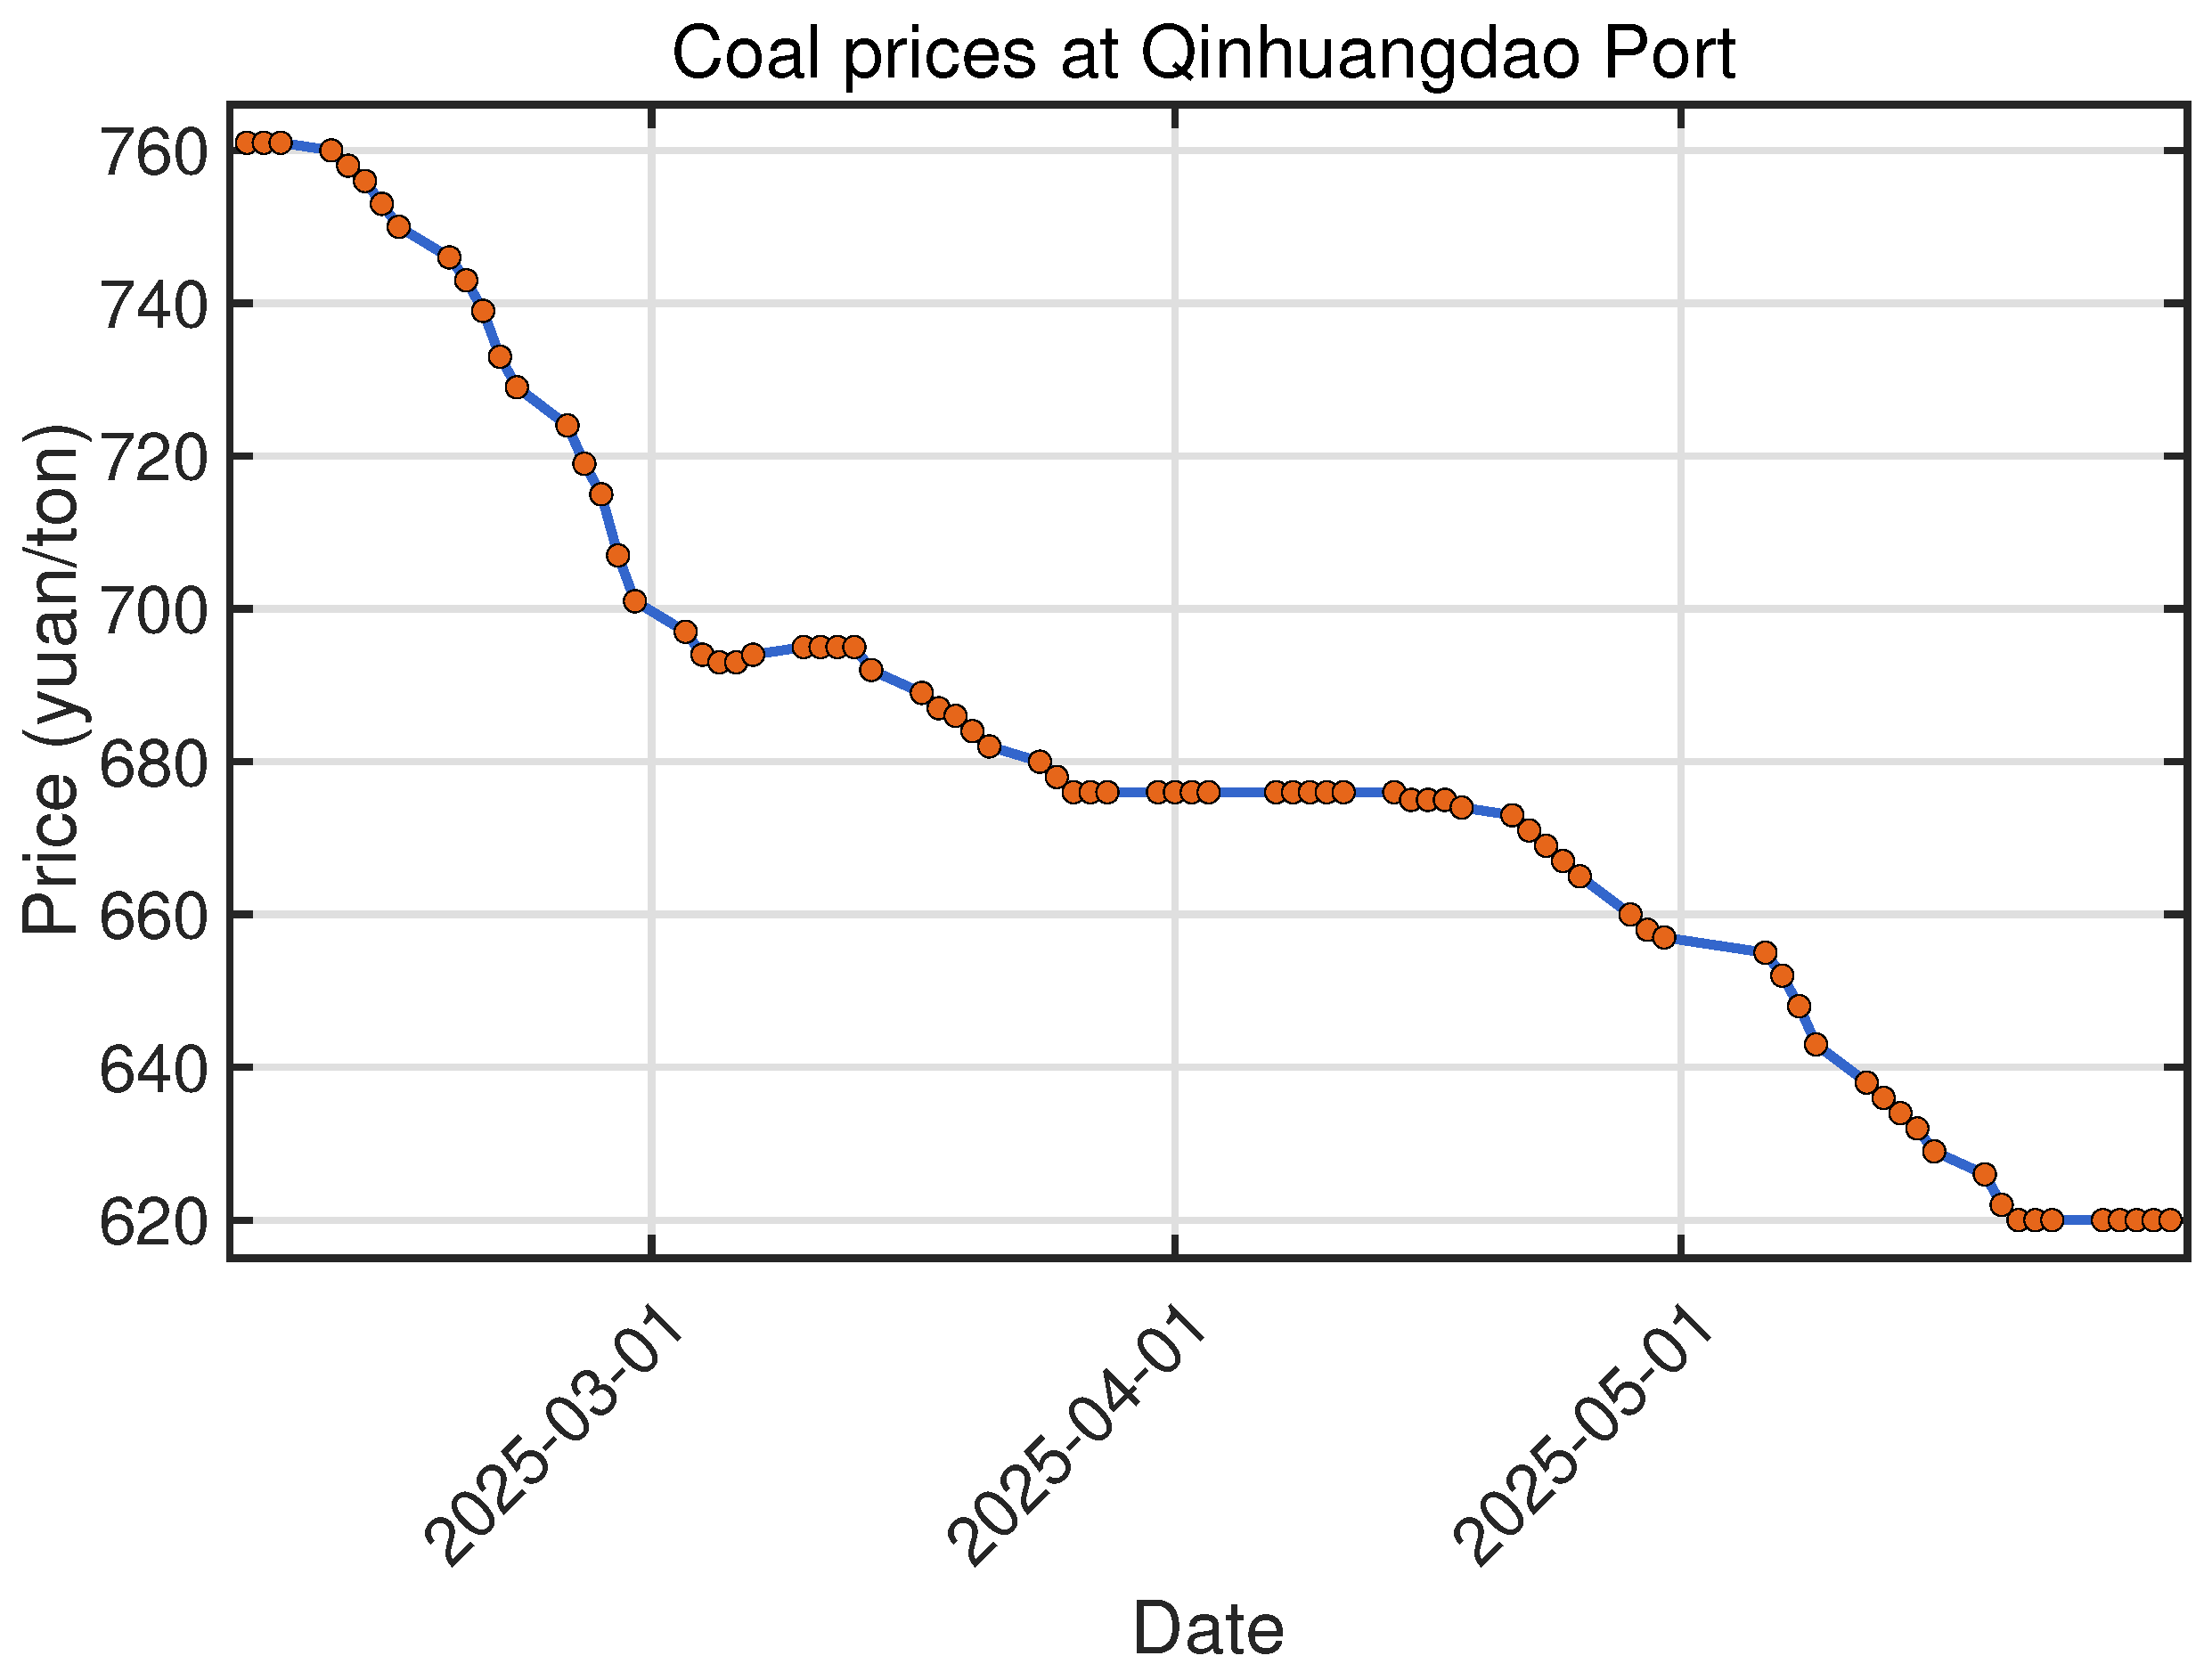
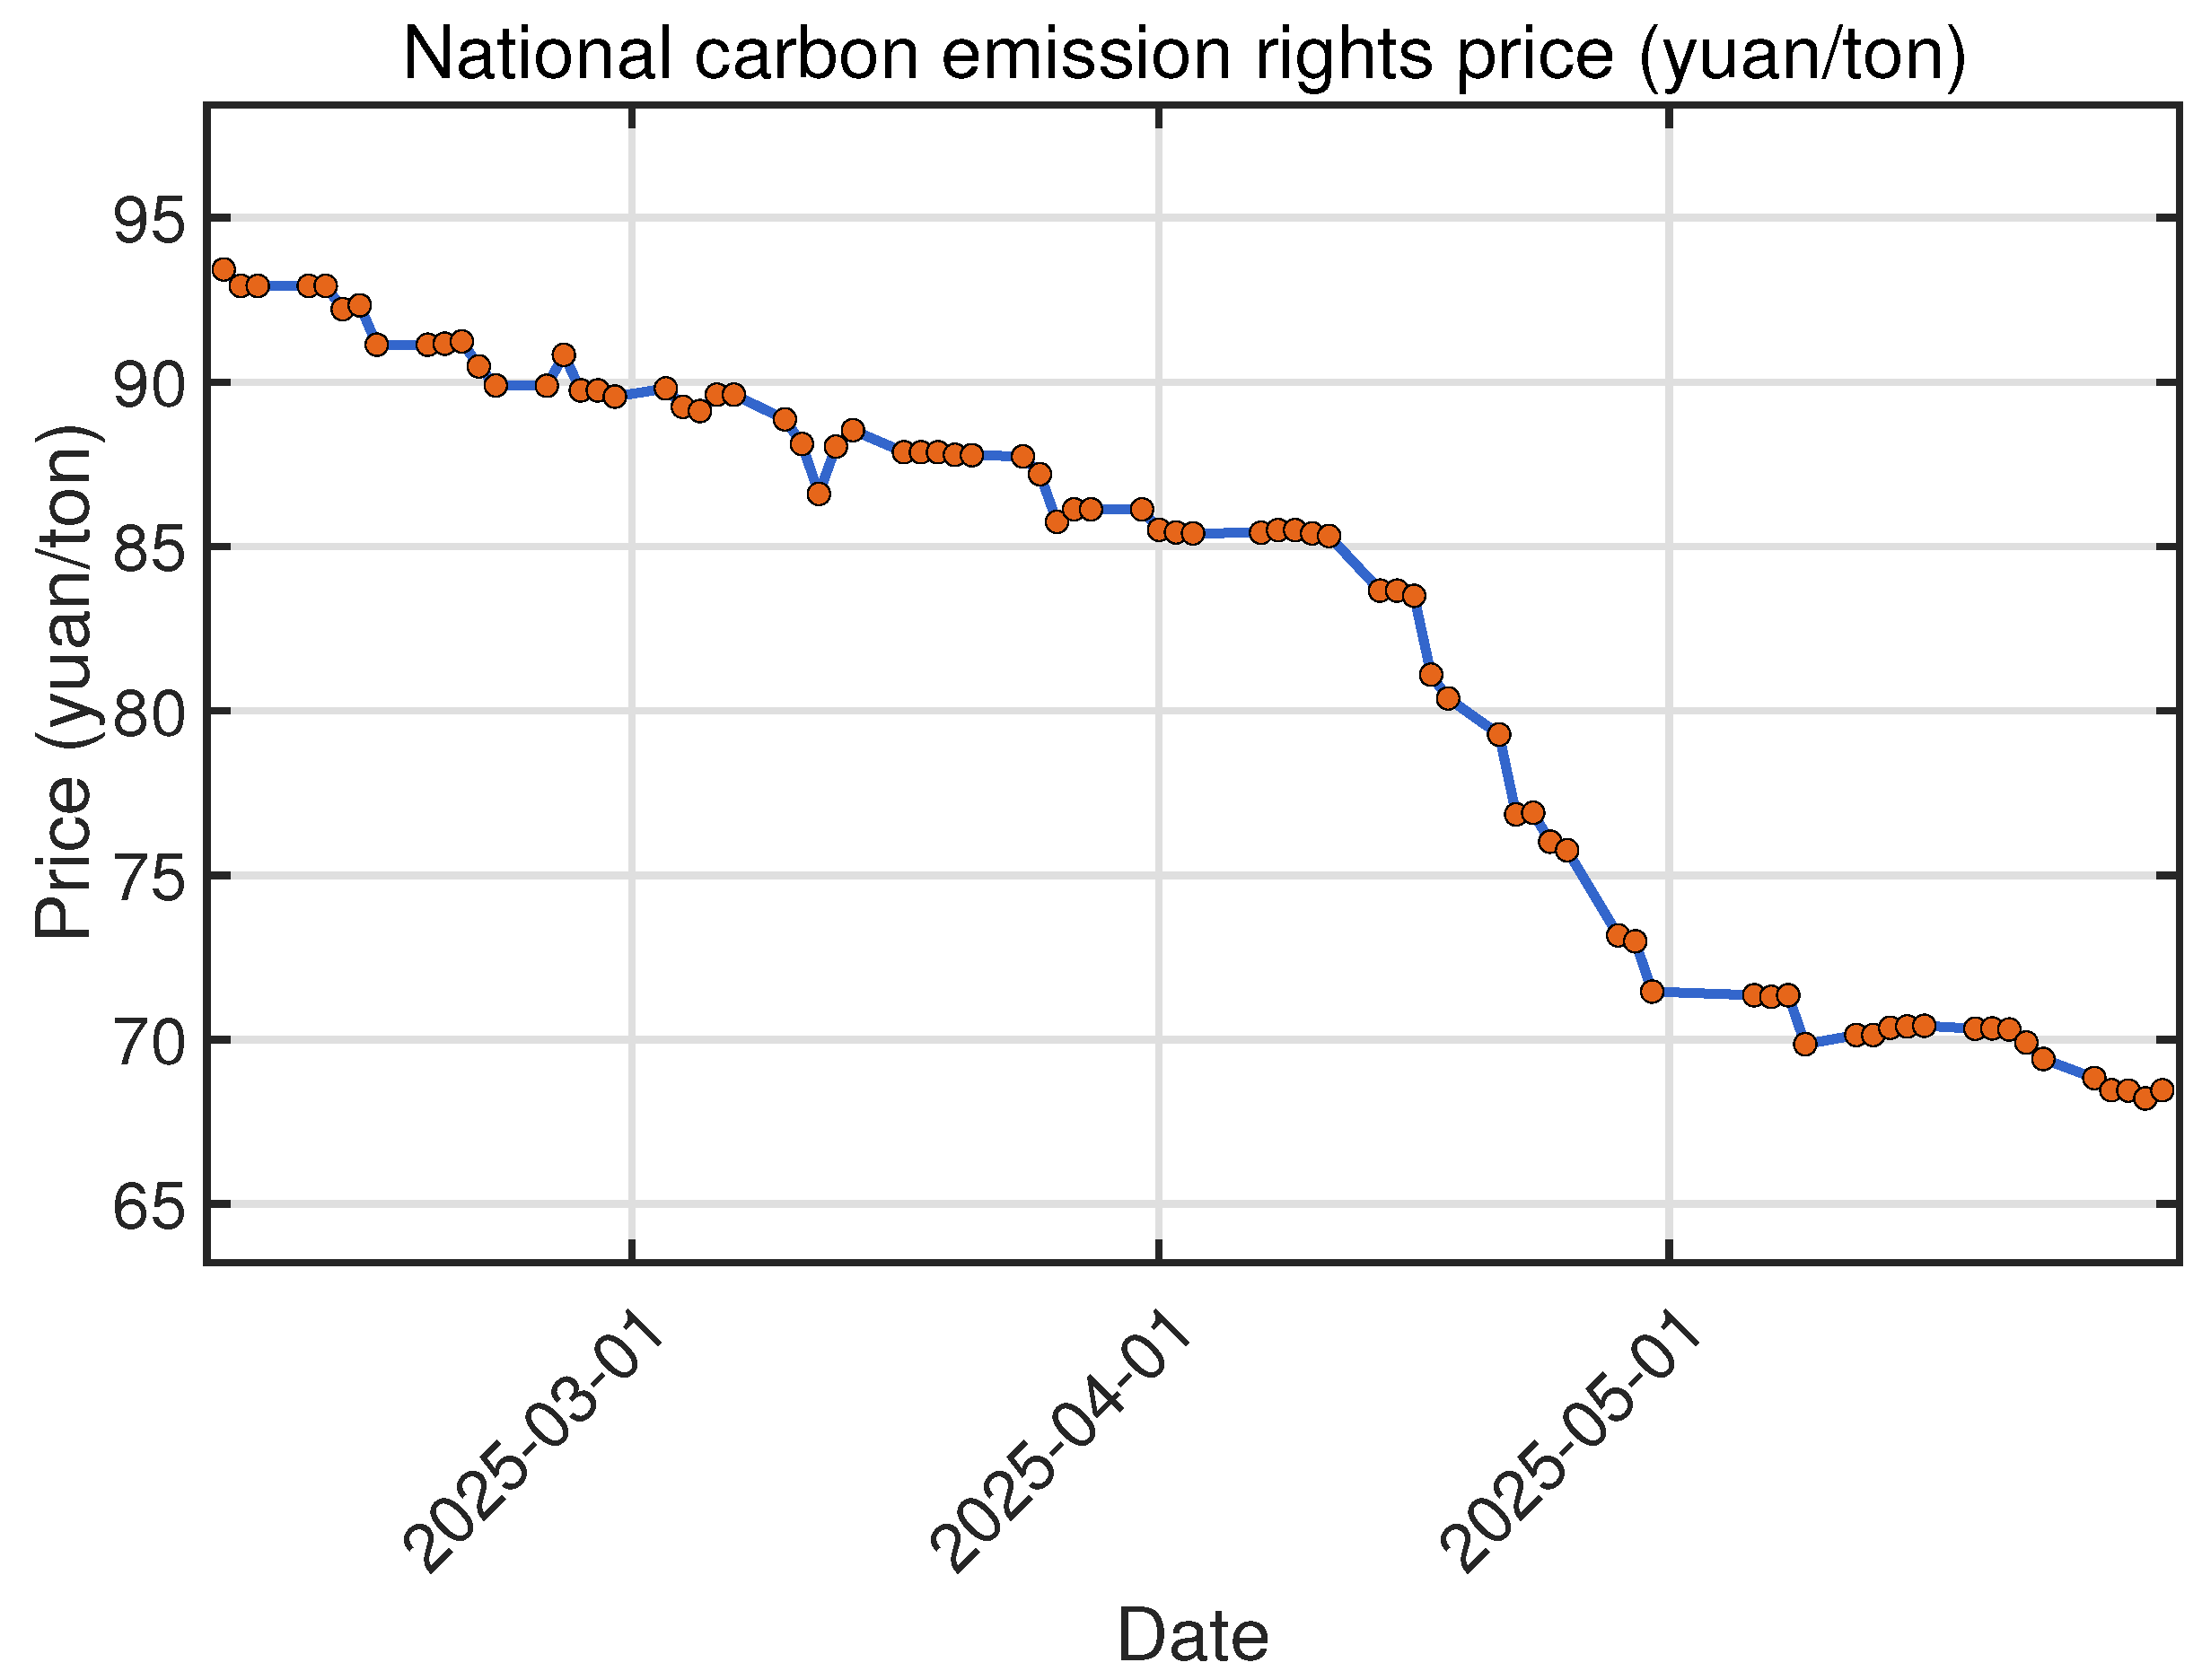
We collected thermal coal 5500 price data at Qinhuangdao Port and national carbon price data from the China Coal Market Website (https://www.cctd.com/) and Shanghai Environment and Energy Exchange (https://www.cneeex.com), respectively, with the data spanning from 5 February 2025 to 30 May 2025, right after the Spring Festival holiday. Details are shown in Figure 1 and Figure 2, respectively.
Using these observations, unknown parameters m, a, γ , σ , k 1 , and k 2 in the carbon-coal price linkage model (1) are estimated as m ^ = 2.9697 , a ^ = 0.0368 , γ ^ = 0.0857 , σ ^ 1 = 4.3206 , k ^ 1 = 0.0692 , and k ^ 2 = 0.3055 , respectively. Correspondingly, the fitted carbon-coal price linkage model is obtained as follows:
d X t = ( m ^ a ^ X t + γ ^ Y t k ^ 1 ) d t + σ ^ 1 Y t k ^ 2 d C t .
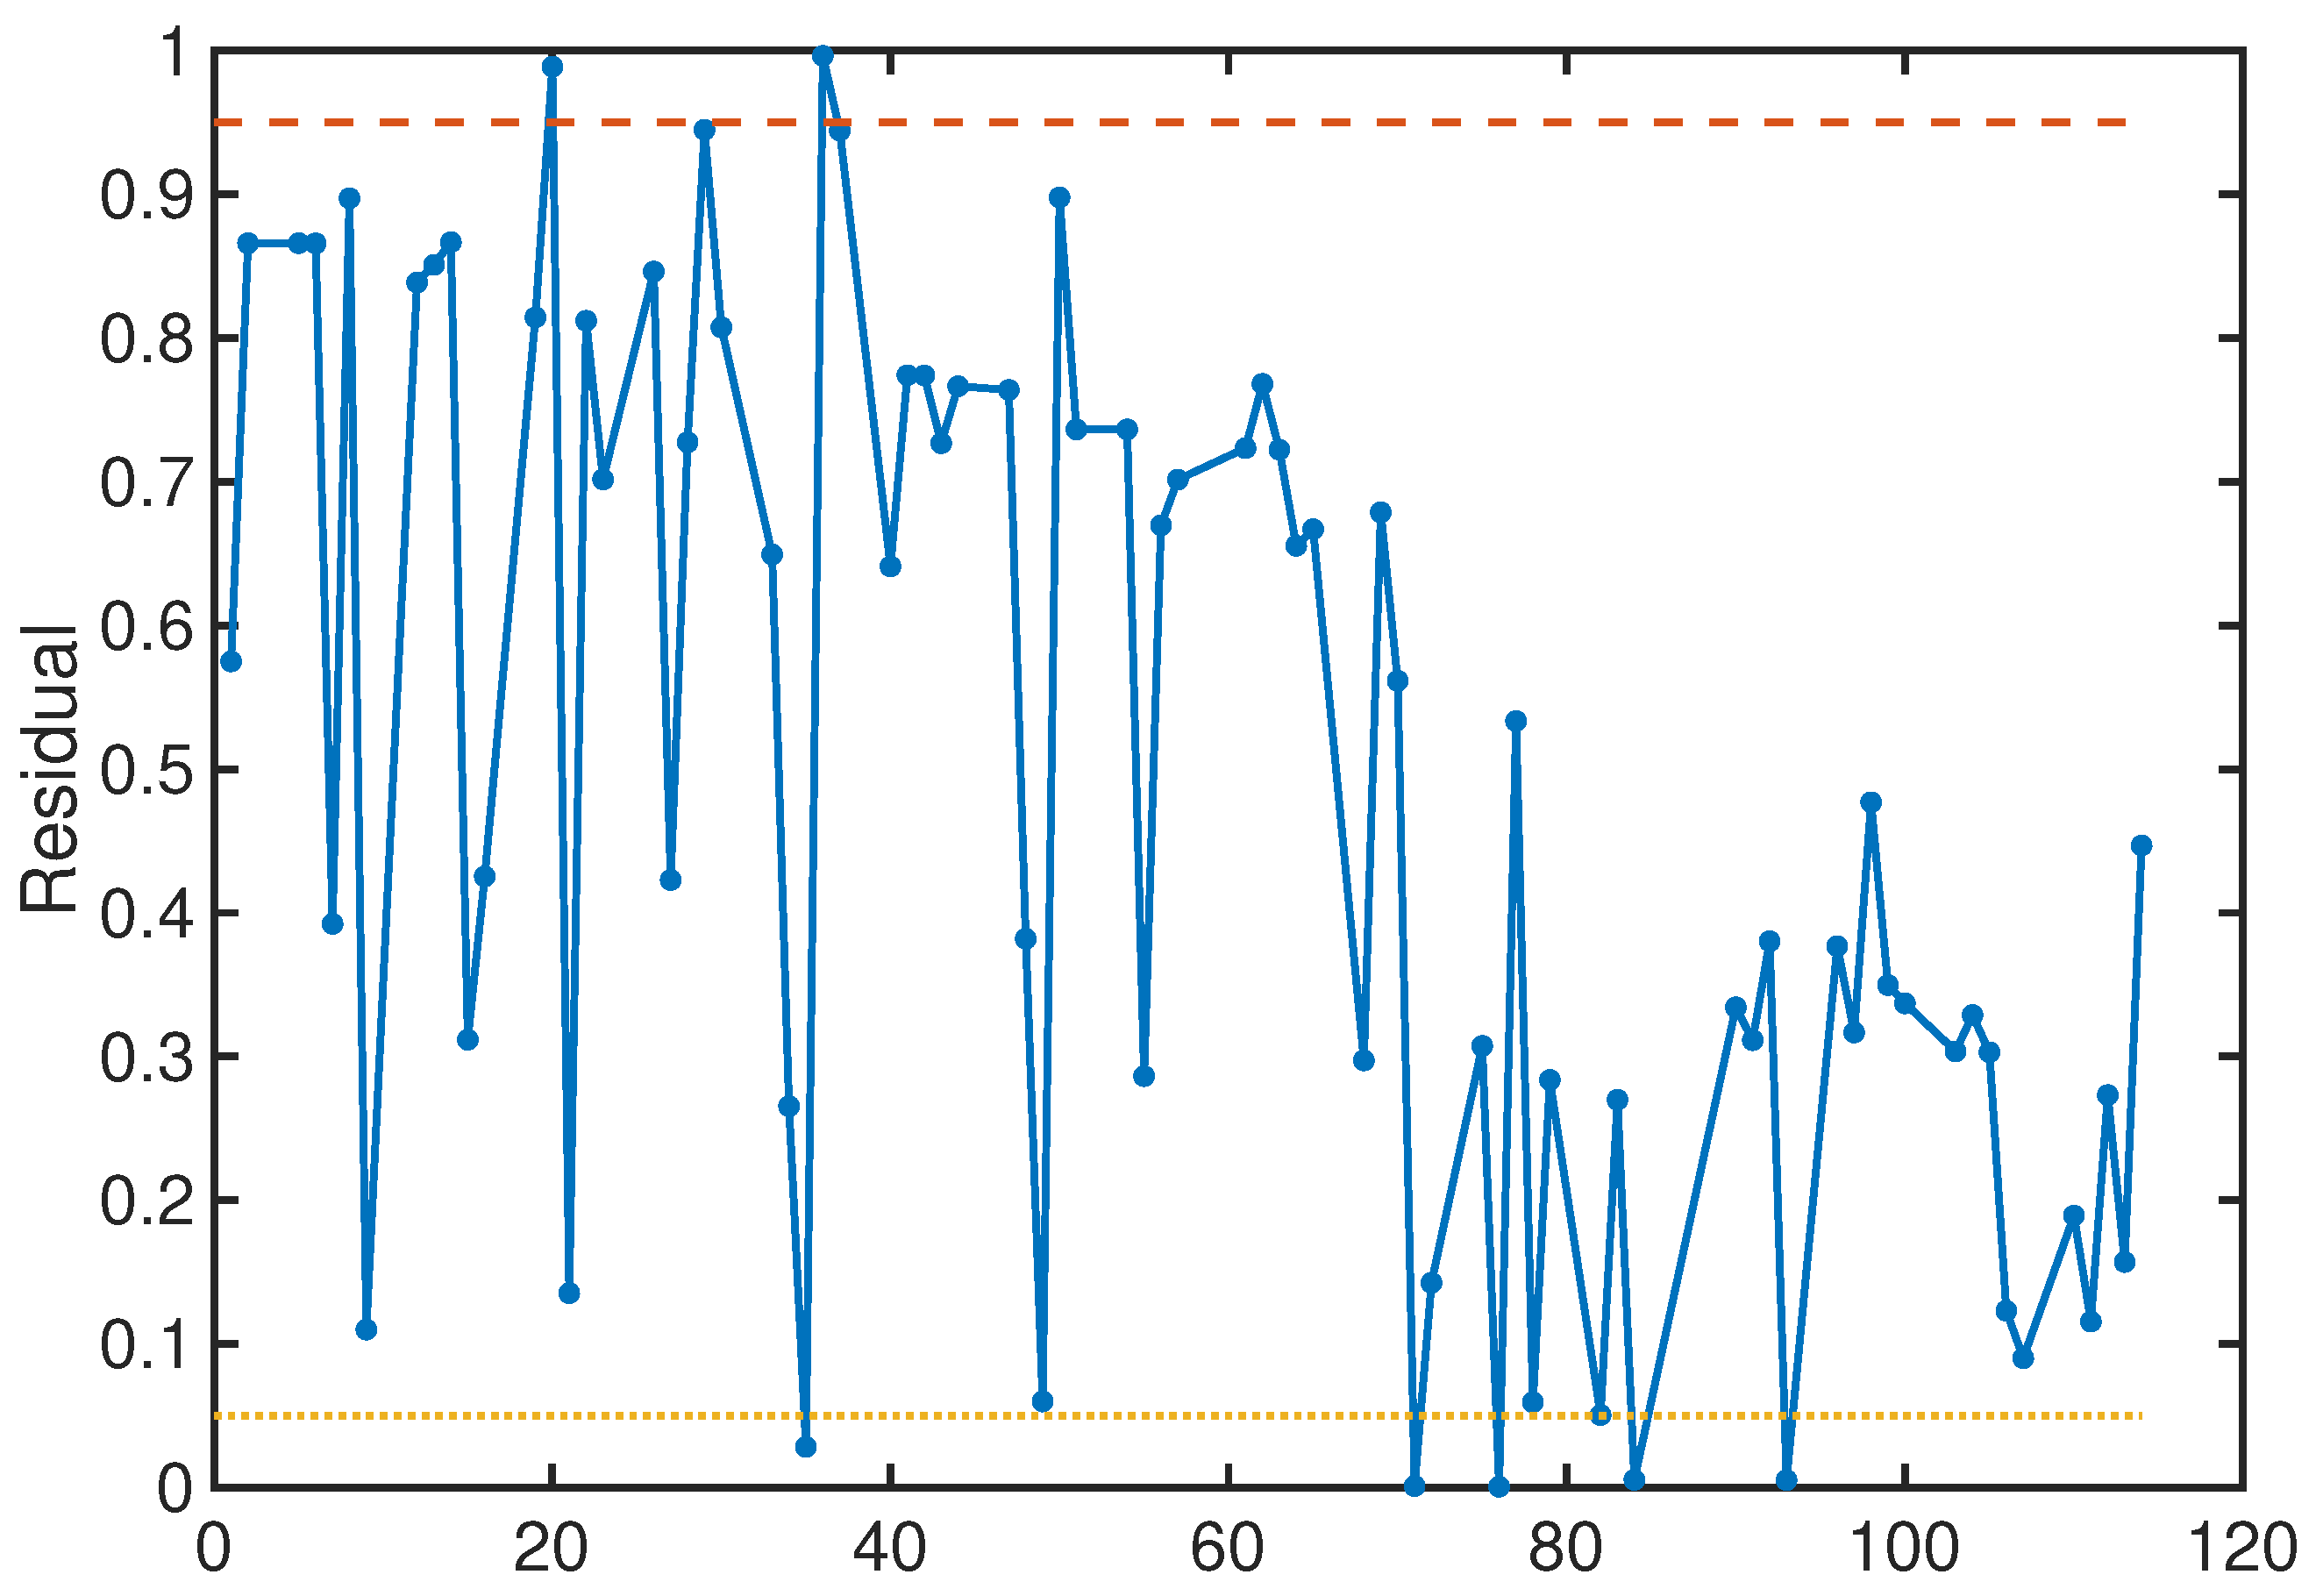
Before proceeding to the next step, we first use uncertain hypothesis testing [26] to identify the validity of this model. With the significance level α , the reject region for the fitted carbon-coal price linkage model (4) is calculated as follows:
W = ( ϵ 2 ( m ^ , a ^ , γ ^ , σ ^ , k ^ 1 , k ^ 2 ) , ϵ 2 ( m ^ , a ^ , γ ^ , σ ^ , k ^ 1 , k ^ 2 ) , , ϵ 79 ( m ^ , a ^ , γ ^ , σ ^ , k ^ 1 , k ^ 2 ) ) : there are at least α of indexes i s with 2 i 79 such that ϵ i < L ( 0 , 1 ) 1 ( α / 2 ) or ϵ i > L ( 0 , 1 ) 1 ( 1 α / 2 ) ,
where L ( 0 , 1 ) 1 ( α ) = α , 0 < α < 1 is the inverse uncertainty distribution for the linear uncertainty distribution. Taking the significance level as α = 0.1 , the reject region becomes the following:
W = ( ϵ 2 ( m ^ , a ^ , γ ^ , σ ^ , k ^ 1 , k ^ 2 ) , ϵ 3 ( m ^ , a ^ , γ ^ , σ ^ , k ^ 1 , k ^ 2 ) , , ϵ 79 ( m ^ , a ^ , γ ^ , σ ^ , k ^ 1 , k ^ 2 ) ) : there are at least 8 indexes i s with 2 i 79 such that ϵ i < 0.05 or ϵ i > 0.95 .
As can be seen in Figure 3, there are only 7 residuals not in the interval [ 0.05 , 0.95 ] . Thus, the fitted carbon-coal price linkage model (4) passes the uncertain hypothesis testing.

4.2. Carbon Price Prediction and Risk Assessment

It follows from Theorem 2 that the estimated updated expected values and the estimated standard deviation for carbon prices X t i + 1 are calculated as follows:
E ^ i + 1 = m ^ a ^ + exp ( a ^ ( t i t i + 1 ) ) X t i m ^ a ^ + γ ^ a ^ Y t i k ^ 1 ( 1 exp ( a ^ t i a ^ t i + 1 ) ) ,
and
S D ^ i + 1 = exp ( a ^ ( t i + 1 t i ) ) σ ^ a ^ Y t i k ^ 2 exp ( a ^ t i + 1 a ^ t i ) 1 ,
i = 1 , 2 , , 78 , respectively. The estimated 100 ( 1 α ) % confidence interval for carbon prices X t i + 1 are calculated as follows:
Φ ^ t i + 1 1 ( α / 2 ) , Φ ^ t i + 1 1 ( 1 α / 2 ) ,
with
Φ ^ t i + 1 1 ( α ) = E ^ i + 1 + S D ^ i + 1 3 π ln α 1 α ,
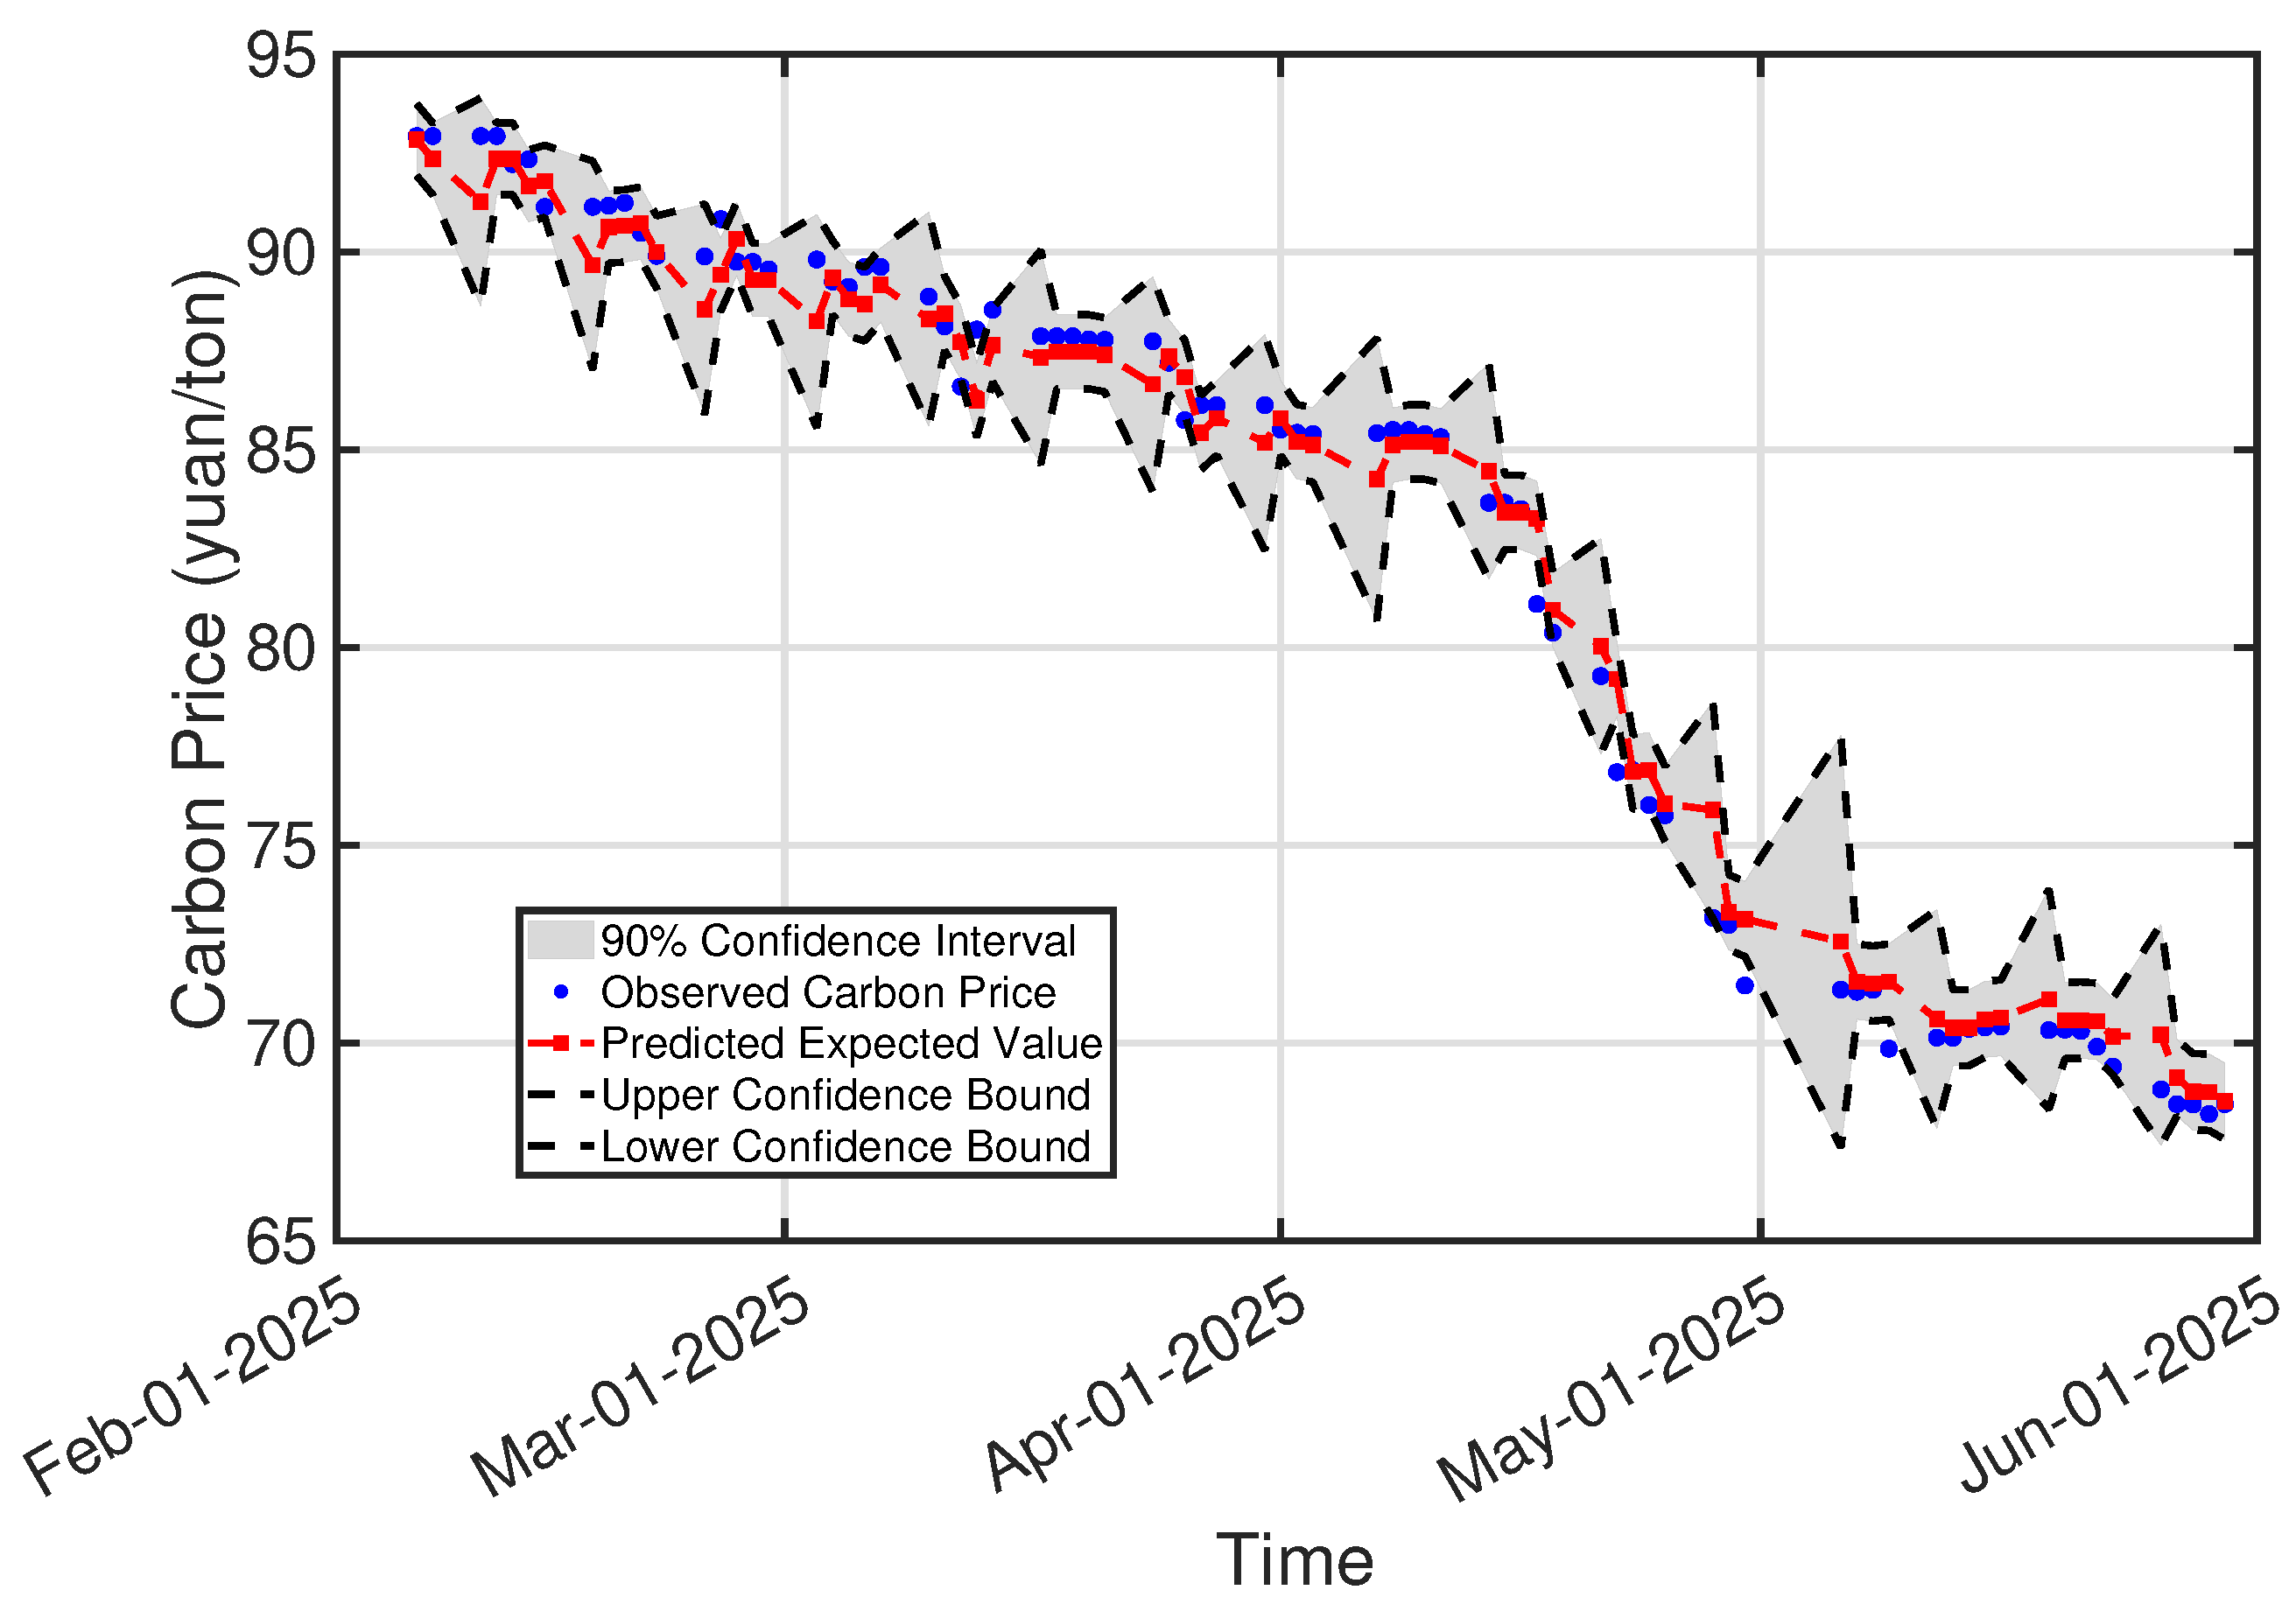
i = 1 , 2 , , 78 . The observations, estimated updated expected values, 90 % confidence interval for carbon price are shown in Figure 4. As can be seen, the expected values are in close proximity to the actual observed values with the mean square error, calculated as follows:
i = 2 79 ( x t i E ^ i ) 2 78 = 0.76 ,
and the maximum fitting error, calculated as follows:
max 2 i 79 | x t i E ^ i | x t i = 3.72 % .
These results suggest that the estimation method effectively captures the central tendency of the carbon prices. Meanwhile, the 90 % confidence interval exhibits an appropriate width, covering the majority of the observed data points. The maximum error between the upper bound of the confidence interval and the observed values is 6.42 , accounting for 8.99 % of the corresponding observed values. The maximum error between the lower bound of the confidence interval and the observed values is 4.73 , which accounts for 5.53 % of the corresponding observed values. This indicates that the interval achieves a reasonable balance between accuracy and coverage range and provides a reliable range within which the true carbon price is likely to fall with a high degree of confidence.
Following that, we use the fitted carbon-coal linkage model (4) to predict the point and interval estimates of carbon prices for the next day. The next available data shows that the Qinhuangdao coal price on 3 June 2025, is 620 yuan per ton as recorded on the CCTD website, while the carbon price on the same date (3 June 2025) is 68.34 yuan per ton as published by the Shanghai Environment and Energy Exchange. Using the estimated carbon-energy price linkage model (4), we obtained an estimated expected value of 69.63 yuan per ton as the point estimate and the 90 % confidence interval of [ 65.97 , 73.29 ] as the interval estimate. The prediction error is ( 69.63 68.34 ) / 68.34 = 1.88 % . This close alignment between the predicted point estimate and the actual carbon price, along with the reasonably narrow confidence interval that effectively captures the true value, indicates that the model demonstrates a certain degree of precision and reliability in predicting carbon prices, suggesting its potential as a valuable tool for carbon price analysis.
Furthermore, we evaluate the risks of carbon prices. Based on the carbon prices shown in Equation (2), the logarithmic return rate can be calculated as follows:
log X t 2 x t 1 = log X t 2 log x t 1 ,
where x t 1 is the observed carbon prices at the 30 May 2025, and the following:
X t 2 = exp ( a ( t 2 t 1 ) ) x t 1 + t 1 t 2 ( m + γ Y s k 1 ) exp ( a ( s t 1 ) ) d s + t 1 t 2 σ Y s k 2 exp ( a ( s t 1 ) ) d C s
is the future carbon price at 3 June 2025, which is the next available data. The α value at risk V a R α satisfies the following:
α = M log X t 2 x t 1 V a R α = M X t 2 exp ( V a R α + log x t 1 )
According to Theorem 2, by solving the following:
α = Φ t 2 ( exp ( V a R α + log x t 1 ) ) = 1 + exp π ( E ( X t 2 ) exp ( V a R α + log x t 1 ) ) 3 S D ( X t 2 ) 1
we obtain the following:
V a R α = log E X t 2 3 S D ( X t 2 ) π log 1 α α log x t 1 .
Note that E ( X t 2 ) = 69.63 and S D ( X t 2 ) = 2.25 . Taking α = 0.05 , the 5 % value at risk of carbon price logarithmic return is V a R 0.05 = 0.0369 , indicating a confidence level of 0.05 for logarithmic returns rate less than 0.0369 . At a 95 % confidence level, it can be stated that the logarithmic rate of return on carbon prices will not fall below 0.0369 , which implies that the price decline will not exceed exp ( 0.0369 ) 1 , equivalent to 3.62 % . There is merely a 5 % belief measure that a more significant decline will occur.

5. Conclusions

In the face of escalating atmospheric carbon dioxide concentrations, ETS have become crucial policy tools, and understanding the dynamic relationship between energy prices and carbon prices within this context is of great significance. This study delved into the dynamic connection between the energy market and the carbon market through uncertain differential equations, aiming to address the gaps in existing research regarding epistemic uncertainties in energy and carbon price fluctuations. By deriving the analytical solution of the carbon-energy linkage model, analyzing its properties, proposing parameter estimation and hypothesis testing methods using historical data, and discussing how energy prices impact carbon prices, we have established a viable framework. The case study with Qinhuangdao Port coal price and national carbon price verified the effectiveness of our methodology in capturing the uncertain interactions in carbon-energy markets. In terms of deterministic trend fitting, the established model’s mean squared error is 0.76 , with the fitting error controlled within 3.72 % . In terms of quantifying uncertainty trends, the 90 % confidence interval covers the majority of the observed data points. The maximum error between the upper bound of the 90 % confidence interval and the observed values is 6.42 , accounting for 8.99 % of the corresponding observed values. The maximum error between the lower bound of the 90 % confidence interval and the observed values is 4.73 , which accounts for 5.53 % of the corresponding observed values. In terms of predictive ability, the predicted value for the next day obtained by the proposed model is 69.93 , with a prediction error of 1.88 % . The 90 % confidence interval for the prediction is [ 65.97 , 73.29 ] . Moreover, the 5 % value at risk of the logarithmic return rate of carbon prices is predicted to be 0.0369 .
This research proposes a new approach to better handle dynamic cognitive uncertainty caused by unexpected events, political conflicts, limited access to data information, and insufficient cognitive levels of market participants. This helps to clarify the price linkage mechanism between carbon and energy, which is beneficial for improving the risk management of participants in energy and carbon markets. It also provides more reasonable policy-making references for policymakers, enabling them to better navigate the increasingly interconnected energy-carbon markets. Moreover, it is worth noting that the methodology employed herein holds the potential for generalization to other markets and for analyzing prices of various products, although the specific model forms may need to be adjusted accordingly. Future research efforts could focus on exploring such extensions to further enhance the applicability of our approach in a broader context.
Author Contributions

Conceptualization, D.G. and B.W.; data curation, C.W.; formal analysis, B.W. and Z.L.; funding acquisition, J.Z.; investigation, H.Y.; methodology, J.Z. and Z.L.; resources, D.G.; software, C.W.; validation, H.Y.; writing—original draft, Z.L.; writing—review and editing, J.Z. All authors have read and agreed to the published version of the manuscript.

Funding

This research was funded by the Science and Technology Project of State Grid Corporation of China (No.52018F240002), the National Natural Science Foundation of China (72403087), and the Fundamental Research Funds for the Central Universities (2024MS030).

Informed Consent Statement

Informed consent was obtained from all subjects involved in the study.

Conflicts of Interest

Authors Di Gao, Bingqing Wu, Chengmei Wei and Hao Yue were employed by the company State Grid Jibei Electric Power Company Limited. The remaining authors declare that the research was conducted in the absence of any commercial or financial relationships that could be construed as a potential conflict of interest.

References

  1. IPCC. Climate Change 2023: Synthesis Report; Intergovernmental Panel on Climate Change: Geneva, Switzerland, 2023. [Google Scholar]
  2. Progress Report of China’s National Carbon Market; Ministry of Ecology and Environment of the People’s Republic of China: Beijing, China, 2024.
  3. Rafaty, R.; Dolphin, G.; Pretis, F. Carbon pricing and the elasticity of CO2 emissions. Energy Econ. 2025, 144, 108298. [Google Scholar] [CrossRef]
  4. Lin, B.; Xu, B. A non-parametric analysis of the driving factors of China’s carbon prices. Energy Econ. 2021, 104, 105684. [Google Scholar] [CrossRef]
  5. Wang, K.; Wang, Z.; Yunis, M.; Kchouri, B. Spillovers and connectedness among climate policy uncertainty, energy, green bond and carbon markets: A global perspective. Energy Econ. 2023, 128, 107170. [Google Scholar] [CrossRef]
  6. Yan, Z.; Yu, Z.; Gu, X. Research on conduction mechanism between carbon price and coal future price in China. Econ. Probl. 2022, 6, 67–74. [Google Scholar]
  7. Dong, F.; Li, Z.; Huang, Z.; Liu, Y. Extreme weather, policy uncertainty, and risk spillovers between energy, financial, and carbon markets. Energy Econ. 2024, 137, 107761. [Google Scholar] [CrossRef]
  8. Man, Y.; Zhang, S.; He, Y. Dynamic risk spillover and hedging efficacy of China’s carbon-energy-finance markets: Economic policy uncertainty and investor sentiment non-linear causal effects. Int. Rev. Econ. Financ. 2024, 93, 1397–1416. [Google Scholar] [CrossRef]
  9. Liu, J.; Man, Y.; Dong, X. Tail dependence and risk spillover effects between China’s carbon market and energy markets. Int. Rev. Econ. Financ. 2023, 84, 553–567. [Google Scholar] [CrossRef]
  10. Qiao, S.; Guo, Z.; Tao, Z.; Ren, Z. Analyzing the network structure of risk transmission among renewable, non-renewable energy and carbon markets. Renew. Energy 2023, 209, 206–217. [Google Scholar] [CrossRef]
  11. Chang, K.; Ye, Z.; Wang, W. Volatility spillover effect and dynamic correlation between regional emissions allowances and fossil energy markets: New evidence from China’s emissions trading scheme pilots. Energy 2019, 185, 1314–1324. [Google Scholar] [CrossRef]
  12. Cui, J.; Goh, M.; Zou, H. Information spillovers and dynamic dependence between China’s energy and regional CET markets with portfolio implications: New evidence from multi-scale analysis. J. Clean. Prod. 2021, 289, 125625. [Google Scholar] [CrossRef]
  13. Liu, X.; Jin, Z. An analysis of the interactions between electricity, fossil fuel and carbon market prices in Guangdong, China. Energy Sustain. Dev. 2020, 55, 82–94. [Google Scholar] [CrossRef]
  14. Lin, B.; Chen, Y. Dynamic linkages and spillover effects between CET market, coal market and stock market of new energy companies: A case of Beijing CET market in China. Energy 2019, 172, 1198–1210. [Google Scholar] [CrossRef]
  15. Yin, J.; Zhu, Y.; Fan, X. Correlation analysis of China’s carbon market and coal market based on multi-scale entropy. Resour. Policy 2021, 72, 102065. [Google Scholar] [CrossRef]
  16. Kiureghian, A.; Ditlevsen, O. Aleatory or epistemic? Does it matter? Struct. Saf. 2009, 31, 105–112. [Google Scholar] [CrossRef]
  17. Peng, S. The theory, methods, and significance of nonlinear expectations. Chin. Sci. Math. 2017, 47, 1223–1254. [Google Scholar]
  18. Liu, B. Uncertainty Theory, 4th ed.; Springer: Berlin/Heidelberg, Germany, 2015. [Google Scholar]
  19. Liu, B. Fuzzy process, hybrid process and uncertain process. J. Uncertain Syst. 2008, 2, 3–16. [Google Scholar]
  20. Chen, X.; Liu, B. Existence and uniqueness theorem for uncertain differential equations. Fuzzy Optim. Decis. Mak. 2010, 9, 69–81. [Google Scholar] [CrossRef]
  21. Yao, K.; Chen, X. A numerical method for solving uncertain differential equations. J. Intell. Fuzzy Syst. 2013, 25, 825–832. [Google Scholar] [CrossRef]
  22. Liu, Z. Generalized moment estimation for uncertain differential equations. Appl. Math. Comput. 2021, 392, 125724. [Google Scholar] [CrossRef]
  23. Liu, Y.; Liu, B. Residual analysis and parameter estimation of uncertain differential equations. Fuzzy Optim. Decis. Mak. 2022, 21, 513–530. [Google Scholar] [CrossRef]
  24. Liu, Z.; Li, Y. Carbon option pricing using uncertain differential equation. Energy 2025, 320, 135320. [Google Scholar] [CrossRef]
  25. Liu, Z.; Li, X.; Kang, R. Uncertain differential equation based accelerated degradation modeling. Reliab. Eng. Syst. Saf. 2022, 225, 18641. [Google Scholar] [CrossRef]
  26. Ye, T.; Liu, B. Uncertain hypothesis test for uncertain differential equations. Fuzzy Optim. Decis. Mak. 2023, 22, 195–211. [Google Scholar] [CrossRef]
Figure 1. Coal price at Qinhuangdao Port from 5 February 2025 to 30 May 2025.
Mathematics 13 02834 g001
Figure 2. National carbon emission right price from 5 February 2025 to 30 May 2025.
Mathematics 13 02834 g002
Figure 3. Residual plot for the fitted carbon-coal price linkage model (4).
Mathematics 13 02834 g003
Figure 4. Observations, estimated expected value, and 90 % confidence interval for carbon price.
Mathematics 13 02834 g004
Table 1. Nomenclature Table.
Nomenclature
ETSEmission trading systems
VaRValue at risk
CCTDChina coal market website
IEAInternational energy agency
Disclaimer/Publisher’s Note: The statements, opinions and data contained in all publications are solely those of the individual author(s) and contributor(s) and not of MDPI and/or the editor(s). MDPI and/or the editor(s) disclaim responsibility for any injury to people or property resulting from any ideas, methods, instructions or products referred to in the content.