Abstract
This study critically examines the methodological rigor in credit card fraud detection research, revealing how fundamental evaluation flaws can overshadow algorithmic sophistication. Through deliberate experimentation with improper evaluation protocols, we demonstrate that even simple models can achieve deceptively impressive results when basic methodological principles are violated. Our analysis identifies four critical issues plaguing current approaches: (1) pervasive data leakage from improper preprocessing sequences, (2) intentional vagueness in methodological reporting, (3) inadequate temporal validation for transaction data, and (4) metric manipulation through recall optimization at precision’s expense. We present a case study showing how a minimal neural network architecture with data leakage outperforms many sophisticated methods reported in literature, achieving 99.9% recall despite fundamental evaluation flaws. These findings underscore that proper evaluation methodology matters more than model complexity in fraud detection research. The study serves as a cautionary example of how methodological rigor must precede architectural sophistication, with implications for improving research practices across machine learning applications. Compared to several recent studies reporting near-perfect recall (often exceeding 99%) using complex deep models, our corrected evaluation with a simple MLP baseline yields more modest but reliable metrics, exposing the overestimation common in flawed pipelines.
Keywords:
credit card fraud; data leakage; preprocessing flaws; methodological rigor; model performance MSC:
68T07; 68T09; 68T01
1. Introduction
The rise of deep learning has profoundly transformed how we approach complex classification and regression problems. Given its data-hungry nature, the prevailing emphasis has been on acquiring large volumes of training data to boost model performance. Meanwhile, the implementation of deep learning models has become increasingly trivialized, thanks to the proliferation of high-level APIs (application programming interface) and libraries—especially in Python 3—that abstract much of the underlying complexity. Today, even large language models (LLMs) and sophisticated neural architectures can be deployed with relatively little specialized knowledge, lowering the barrier to entry for applying advanced machine learning techniques.
However, this convenience comes at a cost. The focus has shifted so heavily toward automation and performance metrics that critical aspects of the modeling pipeline are often overlooked or poorly documented. Researchers frequently delegate key steps to automated tools, sometimes without fully understanding or reporting them. In doing so, we risk putting the cart before the horse—prioritizing model tuning over foundational concerns such as data quality and preparation.
The initial steps that precede model training are often loosely grouped under the term “preprocessing,” yet they receive scant attention in many studies. It is not uncommon for papers to devote pages to re-explaining ubiquitous evaluation metrics like accuracy, precision, recall, or confusion matrices, while providing vague or incomplete details on more foundational questions such as
- How were categorical, ordinal, or fuzzy variables handled?
- What strategy was used for data splitting (e.g., random, stratified, time-based)?
- When and how was normalization or standardization applied, and to which subsets?
- Were oversampling or undersampling techniques limited to the training set, or did they inadvertently affect the test data?
- Was feature selection or dimensionality reduction performed before or after data splitting?
This vagueness often extends to the methodological core. Sleek pipeline diagrams are commonly included but tend to omit essential details. For instance, one might encounter the use of 2D convolutional neural networks (CNNs [1]) applied to tabular data without any justification. Was there a compelling reason for employing a spatial model on non-spatial input? If so, how were the data reshaped to accommodate this architecture? Such decisions are non-trivial and require clear, transparent reporting.
These questions are far from minor. They directly affect the reproducibility, interpretability, and trustworthiness of machine learning models. When unaddressed, they may introduce silent data leakage, bias, or misleading performance metrics—ultimately undermining the credibility of the research. Thorough documentation and transparency in preprocessing are not optional; they are essential to rigorous, responsible data science.
In this work, we undertake a critical review of existing literature in light of the concerns previously discussed, using credit card fraud detection as a case study—specifically focusing on a widely referenced benchmark dataset [2]. This domain poses distinctive challenges, with extreme class imbalance being a primary issue. In such contexts, seemingly high accuracy scores are not uncommon, yet they can be misleading. Methodological oversights or missteps, whether inadvertent or otherwise, can easily lead to inflated performance metrics and a skewed perception of model efficacy.
One recurring issue we have observed is the mishandling of resampling techniques—particularly when oversampling or undersampling is performed before the train-test split—leading to data leakage. To underscore this point, we intentionally apply a simple yet flawed MLP-based approach. Despite its simplicity, the model yields impressively high metrics, thereby demonstrating how superficial performance gains can mask deeper methodological flaws.
The rest of this paper is organized as follows: Section 2 provides background on credit card fraud detection and dataset characteristics. Section 3 reviews the literature on deep learning-based fraud detection. Section 4 describes our methodology, followed by experimental results in Section 5. Finally, Section 6 concludes the paper.
2. Credit Card Fraud Detection
The widespread use of credit and debit cards has greatly enhanced financial convenience, but it has also led to increased fraudulent activity. Payment card fraud typically involves unauthorized transactions intended to obtain goods, services, or cash. While fraud represents a tiny fraction of all transactions, the absolute financial impact is substantial [3], making it a significant area of concern for financial institutions.
2.1. Dataset Description
We use the popular European credit card fraud dataset [2] for benchmarking. It contains transactions made by European cardholders over two days in September 2013, out of which only 492 are fraudulent, just , highlighting extreme class imbalance.
The dataset comprises 30 features: 28 anonymized principal components (V1–V28) derived via PCA (principal component analysis), along with Time and Amount. The target variable Class is binary, with 1 indicating fraud and 0 denoting legitimate transactions. Due to privacy concerns, the original feature labels and semantics were withheld. A snapshot of the first five rows of dataset, sorted based on Time is shown in Figure 1.

Figure 1.
Snapshot of the first five rows of the dataset.
2.2. Handling Imbalanced Data
In fraud detection, the misclassification of minority class instances (fraudulent cases) carries significant consequences, as failing to detect fraud can lead to financial losses and security risks. Traditional classifiers often bias toward the majority class due to the skewed distribution of data, leading to poor performance on the minority class. Resampling techniques address this issue by adjusting the class distribution, either by oversampling the minority class, undersampling the majority class, or combining both approaches to improve model performance.
2.2.1. Oversampling Methods
Oversampling techniques aim to increase the representation of the minority class by either duplicating existing samples or generating synthetic samples. These methods help the model learn patterns from the minority class more effectively.
- Random Oversampling: Duplicates minority samples without introducing new information. This method is simple but can lead to overfitting due to repeated samples.
- SMOTE (Synthetic Minority Oversampling Technique) [4]: Generates synthetic samples between nearest neighbors of minority instances. This method helps to create a more balanced dataset and can improve model performance.
- ADASYN (Adaptive Synthetic Sampling) [5]: Focuses on generating synthetic samples for harder-to-classify minority samples through adaptive weighting. This method is particularly useful for improving the classification of difficult minority instances.
- Borderline-SMOTE [6]: Creates synthetic samples near class boundaries for better discrimination. This method helps to improve the classification of minority instances near the decision boundary.
2.2.2. Undersampling Methods
Undersampling techniques aim to reduce the number of majority class samples to balance the class distribution. These methods help to reduce computational cost and improve the model’s focus on the minority class.
- Random Undersampling (RUS): Randomly removes majority class samples. This method is simple but can lead to loss of important information.
- NearMiss [7]: Selects majority samples based on proximity to minority instances. This method helps to retain informative majority samples.
- Tomek Links [8]: Removes borderline samples to clarify decision boundaries. This method helps to improve the classification of minority instances by removing ambiguous majority samples.
- Cluster Centroids [9]: Applies K-means clustering to condense the majority class. This method helps to reduce the number of majority samples while retaining the overall distribution.
2.2.3. Hybrid Methods
Hybrid methods combine oversampling and undersampling techniques to balance the class distribution and improve model performance. These methods aim to leverage the strengths of both approaches.
- SMOTE-Tomek, SMOTE-ENN [10]: Combine oversampling with data cleaning for improved balance. These methods help to generate synthetic minority samples and remove ambiguous majority samples.
- SMOTEBoost [11]: Integrates SMOTE with boosting to enhance weak classifiers. This method helps to improve the performance of weak classifiers by generating synthetic minority samples.
- SMOTE-SVM [12]: Uses SVM to guide synthetic sample generation. This method helps to generate synthetic minority samples based on the decision boundary of an SVM classifier.
2.3. Privacy Constraints and Feature Engineering
Due to privacy-preserving transformations like PCA, meaningful original features are not available [2]. While PCA protects sensitive data, it also results in components with uneven explanatory power, where only the top few capture substantial variance. Applying deep learning models to such transformed, sparse information may be excessive.
The literature often favors deep or complex models (e.g., CNNs, RNNs, GANs) [13], yet we argue that the focus should instead be on feature (re)engineering. By leveraging PCA components, their polynomial and pairwise combinations, and applying SMOTE for balancing, even simple models such as shallow MLPs can achieve competitive performance.
In fraud detection, minimizing false negatives (missed fraud cases) is vital. Hence, recall is a more appropriate metric than accuracy. Consequently, SMOTE remains a strong choice for mitigating imbalance, and its integration with meaningful features ensures that even basic models can remain effective and interpretable.
2.4. Performance Metrics
In evaluating classification models, the confusion matrix provides essential metrics such as accuracy, precision, recall (also known as sensitivity), specificity, and the F1-score. There are four key terms one can get from a confusion matrix, and, keeping the use case of credit card fraud detection in perspective, these are defined as:
- True Positives (TP): Correctly predicted positive instances (e.g., fraudulent transactions correctly identified as fraud).
- True Negatives (TN): Correctly predicted negative instances (e.g., legitimate transactions correctly identified as legitimate).
- False Positives (FP): Incorrectly predicted positive instances (e.g., legitimate transactions flagged as fraud; Type I error).
- False Negatives (FN): Incorrectly predicted negative instances (e.g., fraudulent transactions missed by the model; Type II error).
In credit card fraud detection [14], where the cost of missing fraudulent transactions (FN) is significantly higher than false alarms (FP), recall is particularly critical to minimize undetected fraud. However, precision must also be balanced to avoid overwhelming analysts with false positives. The F1-score, which harmonizes precision and recall, is thus a key metric for assessing model performance in such imbalanced scenarios.
Figure 2 illustrates the core elements of the confusion matrix and their relevance to credit card fraud detection. It highlights the inherent trade-off between precision, minimizing false alarms, and recall, capturing actual fraud. Since fraud cases are rare and the cost of missed detections (false negatives) is typically higher than that of false positives, recall is often prioritized. The score, as a harmonic mean of precision and recall, provides a balanced view and is particularly suited for imbalanced datasets. This cost-sensitive evaluation supports the use of the Precision-Recall Curve (PRC) over the ROC curve, as the latter may present an overly optimistic picture in skewed settings.
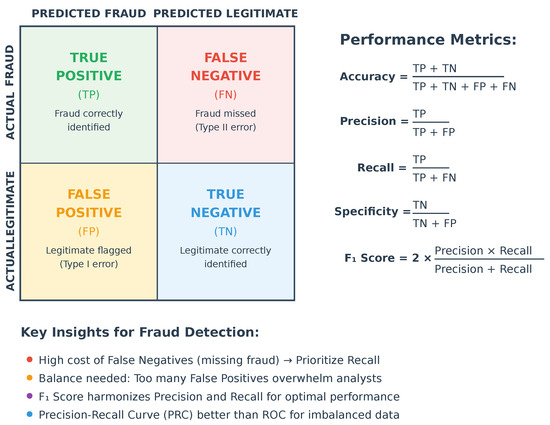
Figure 2.
Confusion matrix and performance metrics for credit card fraud detection.
The Precision-Recall Curve (PRC) offers a more informative evaluation of model performance in unbalanced scenarios. Unlike the ROC curve, which includes true negatives that dominate in fraud detection tasks, the PRC directly reflects the model’s ability to detect fraud (recall) while controlling false alarms (precision). It also aids in threshold selection by visualizing how precision and recall trade off, allowing practitioners to align model sensitivity with operational risk tolerance.
Although specificity is important for maintaining customer trust and operational efficiency, it is often secondary to recall and the score due to the high cost of missing fraudulent transactions. High specificity ensures that legitimate transactions are not unnecessarily flagged as fraudulent, but the primary focus remains on balancing recall and precision to minimize undetected fraud.
3. Literature Review
Credit card fraud detection has been extensively studied using both traditional and modern machine learning approaches. Comprehensive surveys—such as those in [15,16,17]—provide valuable overviews of this evolving landscape. While this task might appear straightforward in theory, the field has seen an over-application of complex methods that may be unnecessarily heavy for payment card fraud detection. This trend has even led to questions about the effectiveness of certain approaches, particularly multilayer perceptrons (MLPs), in capturing the temporal dependencies and sequential patterns that are crucial for identifying fraudulent activities [18]. In our view, the focus should shift from immediately applying sophisticated techniques to ensuring the correctness and efficiency of fundamental preprocessing tasks. To this end, we critically examine existing literature, identifying and analyzing potential methodological flaws in a substantial sample of previous works, as summarized in Table 1.

Table 1.
Machine Learning Methods.
The study in [38] evaluates four classifiers (LR, LDA, NB, and XGBoost) using their default configurations on SMOTE-balanced data. While the authors report exceptional performance for XGBoost (accuracy: 99.969%, precision: 99.938%, recall: 100%, : 99.969%, AUC: 99.969%), these results appear compromised by methodological flaws. Specifically, the preprocessing pipeline suffers from data leakage, as both feature scaling/normalization and SMOTE application were performed before the train-test split. Additionally, the study’s normalization approach is questionable, as it only scales the “Time” feature without addressing the temporal nature of transaction data.
The ANN described in [19] has 4 hidden layers, which is still fairly deep for the dataset in question. The data were balanced by applying SMOTE before doing the train/valid/test split and feeding it to the ANN, yet they got precision and recall, albeit with a leaky approach. The results are not consistent with those claimed in the conclusion section later.
Another set of methods described in [20] relies on swarm intelligence for feature selection, an attention mechanism for classifying relevant data items, UMAP for dimensionality reduction, SMOTE for addressing data imbalance, and LSTM for modeling long-term dependencies in transaction sequences. The claimed results are again circumspect because the authors have used SMOTE on the dataset before splitting it.
The authors in [21] propose an ID dilated convolutional neural network (DCNN) for credit card fraud detection, combining SMOTE with random under-sampling (RUS) and near-miss (NM) under-sampling, though the specific order of these techniques is not explicitly stated. While their model achieves a reported accuracy of 97.27% on the European credit card fraud dataset [2], this high accuracy is misleading given the dataset’s extreme class imbalance (fraud prevalence of 0.172%), where a trivial “no fraud” classifier would already achieve 99.8% accuracy. Additionally, the paper’s description of 1D CNNs with kernels and batch normalization over “feature maps” suggests a potential misapplication of 2D CNN architectures on flattened or PCA-reduced features.
Recent works [39] continue to emphasize ensemble-based and deep learning strategies. For example, the approach of [22] balances the data by combining SMOTE with edited nearest neighbor (SMOTE-ENN) and then employs a strong deep learning ensemble using the long short-term memory (LSTM) neural network as the adaptive boosting (AdaBoost) technique’s base learner. The authors claim to have achieved a recall rate and a specificity of . While everything else is described in detail, the key parts are vague, e.g., balancing before/after the dataset, normalization, etc. However, the data balancing algorithm outlined in the article points to the balancing of the whole dataset.
Another RNN-based method [23] uses the SMOTE-Tomek technique to address the data imbalance and, after splitting the data, employ a Bidirectional Gated Recurrent Unit (Bi-GRU) for classification. The approach is naive, not only for applying SMOTE-Tomek before the train/test split but also for using BN before the activation function inside the RNN module. The article also has readability issues. The reported metrics (Accuracy = Precision = , Recall = ) seem inconsistent with the reported AUC of (unbelievably high; should be lower).
The study in [24] exhibits methodological flaws, particularly in data balancing and train/validation/test splits. The authors oversample the majority class but extract the validation set before oversampling, then draw test cases from the oversampled majority class, likely inflating performance metrics. Additionally, their terminology is inconsistent: one model is correctly labeled as an MLP (32-16-8 neurons), while another is misleadingly called an ANN (50 neurons per hidden layer, unspecified depth). Their top-performing model—a computationally heavy LSTM–relies on borderline SMOTE, casting doubt on the robustness of their results.
A three-step deep learning technique [40] balances the data with borderline SMOTE and then uses a stacked autoencoder to extract key information for SoftMax-based classification. They demonstrate a commendable AUC score, but the method is still complex.
The authors of [25] combine SMOTE and Tomek Links to preprocess data before training a Back Propagation Neural Network (BPNN) with 3–6 hidden layers (each containing 28 neurons) and dropout regularization, particularly after the second hidden layer. However, the study suffers from ambiguities—such as the number of samples post-balancing and the test set fraction (25% or 30%)—as well as inconsistencies in reported metrics. Additionally, the approach risks data leakage due to balancing the entire dataset before splitting.
The study in [26] compares PCA and convolutional autoencoder (CAE) for feature extraction, followed by SMOTE and a Random Forest classifier, recommending CAE+SMOTE with an F1-score of 90.5%. However, their claim that inverse_transform can reconstruct original transactions from PCA components alone is incorrect, as it requires the original data and PCA model. Additionally, their evaluation strategy lacks a holdout test set, risks data leakage from improper SMOTE application, and may inflate performance due to repeated testing on the same holdout set.
The work in [27] employs a denoising autoencoder (DAE) for data cleaning and SMOTE-based balancing, followed by a deep fully connected neural network (4 hidden layers: 22 + 15 + 10 + 5) with a 2-neuron output layer for classification. Two variants are tested: (1) without SMOTE/autoencoder (AE) and (2) with SMOTE+AE. The baseline model (w/o SMOTE/AE) achieves 97.9% accuracy but near-zero recall, suggesting it fails to detect fraud cases. The SMOTE+AE model improves recall to 90.5% (at the expense of accuracy) but exhibits poor probability calibration (sharp recall drop at high thresholds) and overfitting risks from synthetic data.
The work presented in [28] utilizes SMOTE prior to applying various machine learning techniques, with the best results achieved by a Random Forest classifier followed by an MLP containing four hidden layers (50 + 30 + 30 + 50 neurons). While the Random Forest model attains an F1-score of 0.964, the MLP’s performance is notably inferior (F1 = 0.792), potentially indicating overfitting or inadequate training. The methodology exhibits significant weaknesses: potential data leakage from performing the train-test split after SMOTE application, unjustified exclusion of 5% of features which might have enhanced the MLP’s performance, and inconsistent results where the performance gap between RF and MLP could indicate either insufficient MLP training or feature mismatch.
The CNN-based approach in [29] appears methodologically flawed due to its naive architecture, which includes an unnecessary flatten layer following Conv1D layers and excessive dropout layers. This overly complex model with redundant components demonstrates inferior performance (≈93% precision/recall/accuracy) compared to their other methods evaluated (with RF achieving 0.99 F1-score and accuracy). The study also lacks clarity regarding the oversampling process and fails to specify how the dataset was reduced to 984 samples and how many were the fraud cases.
In [30], without bothering about balancing the dataset, the authors use a CNN with two ReLU-based conv2D layers (kernel sizes and , respectively), with dropout layers and eventually a flatten layer (). Probably, the use of filters with size may be an attempt to capture relationships between adjacent PCA features, but this should not be that useful since PCA transformation disrupts natural feature order. The use of CNNs here seems forced at best rather than necessary. The reported results (Accuracy: , Precision: , Recall: ) boasts higher performance as compared to DT, logistic regression, kNN, RF, and especially XGBoost. The recall is still on the lower side, though.
The study in [31] evaluates three deep learning approaches combined with SMOTE: ANN, CNN, and LSTM RNN. While the results suggest that CNN and ANN outperform LSTM (with reported accuracy/precision/recall > 99.9% for ANN/CNN and 97.3% for LSTM), the methodology suffers from several critical flaws. The application of CNN to PCA-transformed data are fundamentally invalid due to the lack of spatial structure in such data. Moreover, the use of 2D kernels on 1D tabular data represents a misapplication of convolutional techniques. The study lacks transparency in evaluation methodology and presents highly questionable results with weak scientific justification for the core methods employed.
The study in [32] evaluates three deep learning architectures (CNN, MLP, and LSTM) independently, though the authors misleadingly refer to this as “federated learning.” The models are trained on data balanced using various undersampling and oversampling techniques. The CNN architecture consists of a Conv1D (32, 2) layer with 20% dropout and batch normalization, followed by a Conv1D (64, 2) layer with batch normalization, a flatten layer, 20% dropout, a 64-unit dense layer with 40% dropout, and a final output layer. The MLP features two dense hidden layers (65 units each) with 50% dropout, while the LSTM comprises one LSTM layer (50 units) with 50% dropout followed by a 65-unit dense layer with 50% dropout before the output. As expected, the models achieve high accuracy without balancing, but other metrics suffer. Performance improves with balancing: LSTM and CNN benefit most from random oversampling, while MLP performs better with SMOTE.
The study in [33] implements a deep recurrent neural network with 4 stacked LSTM layers (each containing 50 hidden units), achieving high accuracy (99.6%) and precision (99.6%) but suffering from low recall (80%). The methodology exhibits several flaws: normalization before train-test splitting (risking data leakage), misconceptions about PCA re-application, lack of class balancing, and inclusion of unnecessary implementation details that obscure the core methodology. While the model demonstrates strong precision, its poor recall indicates a significant bias toward the majority class, likely due to the imbalanced dataset and absence of resampling techniques.
The obsession with using RNN can be observed in [41] in the form of what the authors call an “ensemble” of LSTM/GRU as RNNs. The latter are employed for classification followed by aggregation via a feed forward neural network (FFNN) as the voting mechanism. Their results on the European Cardholders Dataset (ECD) may be good, but yet it is too complex. The same is the case with [42], which employs AE for preprocessing, DL for classification, and a Bayesian algorithm to optimize the hyperparameters. Such overuse of deep learning methods can be found in about 11 different techniques reported in [43] and strangely attributed to the adversarial approach [44], which may be a misreporting and seems far-fetched. Similarly, a CNN method is wrongly attributed to [45], which in fact has an unspecified MLP as one of the methods and that too performs very poorly on our dataset of interest with precision, sensitivity, and a F1 score, albeit a better specificity of .
The study in [34] proposes a time-aware attention mechanism for RNNs, designed to capture users’ current transactional behavior in relation to their historical patterns. While the approach aims to model behavioral periodicity effectively, it forgoes data balancing, resulting in poor precision (50.07%) despite high recall (99.6%). Performance improves with increased memory size (units unspecified), suggesting memory-intensive requirements. The evaluation relies on AUC rather than balanced metrics, which may obscure class imbalance issues.
The work presented in [35] examines six classification algorithms (SVM, LR, RF, XGBoost, DT, and ET) both in their standard form and with AdaBoost enhancement, employing SMOTE to address class imbalance. The approach shows substantial performance gains when using AdaBoost, most notably in recall metrics (with DT recall improving from 75.57% to 99%), and achieves 99.95% accuracy with RF-AdaBoost. However, the study presents several methodological limitations: (1) data leakage risk: applying SMOTE before the train-test split may contaminate the test set with synthetic samples and (2) preprocessing ambiguity: unclear specification of when normalization occurs relative to the data splitting process.
The comparative analysis presented in [36] exhibits fundamental methodological flaws, most notably an overemphasis on the SMOTE + Logistic Regression results while neglecting to investigate the abnormally low precision (<10%) observed in other methods. The study’s credibility is further compromised by the publisher’s expression of concern over the language and readability.
The study in [37] evaluates three sampling techniques (under-sampling, SMOTE, and SMOTE-Tomek) combined with four classifiers (KNN, Logistic Regression, Random Forest, and SVM), though the methodology raises several concerns. First, there’s ambiguity regarding the order of resampling and train/test splitting, which likely occurs in the wrong sequence. More critically, both SMOTE and SMOTE-Tomek produce identical sample counts (227,845 per class), an unusual outcome suggesting either Tomek link misconfiguration or ineffectiveness due to PCA-transformed features. Additionally, the aggressive under-sampling to just 492 samples per class risks underfitting despite appearing to yield good metrics. Finally, the evaluation’s focus on recall over precision may lead to high false positive rates, as evidenced by Logistic Regression’s 0.52 precision despite 0.92 recall when using SMOTE. While Random Forest achieves the highest F1-scores (0.94 with under-sampling, 0.92 with SMOTE, and 0.93 with SMOTE-Tomek), these methodological concerns undermine the reliability of the reported performance improvements.
Based on our comprehensive review of credit card fraud detection methodologies, we have identified several persistent flaws that significantly undermine the reliability and practical applicability of many studies:
- Data Leakage in Preprocessing: Numerous studies perform critical preprocessing steps (normalization, SMOTE, etc.) before train-test splitting, artificially inflating performance metrics through information leakage.
- Intentional Vagueness in Methodology: Many works deliberately omit crucial implementation details, making replication difficult and raising questions about result validity. This includes unspecified parameter settings, ambiguous preprocessing sequences, silence about stratified sampling, and unexplained architectural choices.
- Inadequate Temporal Validation: Most approaches fail to account for the time-dependent nature of transaction data, neglecting temporal splitting, which is essential for real-world deployment.
- Unjustified Method Complexity: There’s a tendency to apply unnecessarily sophisticated techniques without first ensuring proper data preparation and validation, often obscuring fundamental methodological flaws.
- Overemphasis on Recall: Many works prioritize recall metrics at the expense of precision, leading to models with high false positive rates that would be impractical in production environments.
For the sake of brevity, we have summarized the most common flaws in Figure 3.

Figure 3.
Summary of the flaws in credit card fraud detection identified in the literature.
These persistent issues—particularly the concerning trend of intentional vagueness—highlight the urgent need for more rigorous evaluation protocols and complete methodological transparency in fraud detection research. Addressing these common pitfalls, especially the lack of full disclosure in implementation details, would significantly improve both the validity and practical utility of future studies in this domain. While these studies reveal a broad range of model architectures and evaluation protocols, our investigation focuses not on proposing a new algorithm, but on exposing how flawed experimental design—especially data leakage—can lead to deceptively strong performance. We now detail our experimental setup.
4. Our Flawed Methodology
In this section, we describe the experimental protocols designed to demonstrate how subtle methodological oversights can lead to inflated evaluation metrics. The findings of the last section suggest that methodological rigor matters more than algorithmic sophistication. To demonstrate this, we will present a deliberately flawed MLP implementation with SMOTE applied to the dataset (already described in Section 2.1) before train-test splitting—a clear violation of proper evaluation protocol. Despite this fundamental flaw, we anticipate this method will outperform many existing approaches, underscoring how data leakage can overshadow algorithmic advantages. This serves as a cautionary example that sophisticated techniques cannot compensate for basic methodological failures in fraud detection research.
The flawed methodology used in this investigation to differentiate deceptive transactions from genuine ones focuses on the most prevalent vice from the literature: balancing the data before splitting it into train/val/test partitions. It consists of the integration of two modules central to the detection of the fraudulent card transactions, viz. a SMOTE module and a multilayer perceptron (MLP) network.
4.1. Synthetic Minority Over-Sampling Technique (SMOTE)
To address the unbalanced data, we employ oversampling using SMOTE, which is particularly effective in mitigating class imbalance issues in classification tasks. SMOTE generates synthetic samples of the minority class to balance the class distribution [4].
The synthetic sample is generated using the following rule:
where:
- is the new synthetic data point,
- is the original minority class data point,
- is one of the k nearest neighbors of , and
- is an arbitrary value between zero and one.
As far as the Python implementation is concerned, the SMOTE-related module is imported from the imblearn (imbalanced-learn) library [46]. The imblearn package includes techniques for handling unbalanced datasets and is built on scikit-learn, an open-source Python library that provides simple and efficient tools for data mining and data analysis. This approach helps in creating a more balanced dataset, thereby improving the performance of classification models.
4.2. The Multilayer Perceptron (MLP) Module
An artificial neural network (ANN) is a computational model inspired by the structure and function of biological neural networks, designed to process inputs and learn patterns akin to human cognition. A typical MLP, a type of ANN (as illustrated in Figure 4), consists of interconnected layers of nodes (neurons), where each connection is associated with a weight that is adjusted during training. Due to their ability to model complex, non-linear relationships, ANNs are widely employed in tasks such as pattern recognition, regression, and classification.
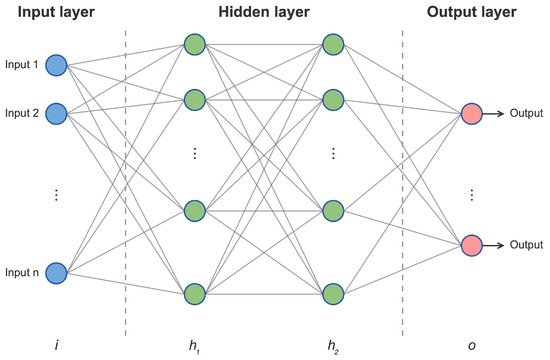
Figure 4.
A generic MLP architecture.
An MLP typically comprises three key components:
- Input Layer: Receives raw data and distributes it to the subsequent layer. Each neuron in this layer corresponds to a feature or attribute of the input data.
- Hidden Layers: Perform computations and feature extraction, enabling the network to capture intricate patterns in the data.
- Output Layer: Produces the final prediction or classification result. The number of neurons in this layer is determined by the specific task (e.g., one neuron for binary classification, multiple neurons for multi-class classification).
The fundamental building blocks of an ANN are neurons, which process inputs by applying an activation function to the weighted sum of their inputs and producing an output. This output is then propagated to subsequent neurons, facilitating the network’s ability to learn and adapt [47].
The multilayer perceptron (MLP) used in this work is intentionally kept minimal to underscore how deceptively high performance can result from flawed evaluation procedures, regardless of architectural complexity. The network (as per the code given in Figure 5) consists of an input layer with 29 neurons corresponding to the features in the dataset (28 PCA components along with the Amount attribute), followed by a single hidden layer with N neurons, and an output layer with a single neuron using the sigmoid activation function for binary classification.

Figure 5.
The Flawed MLP Model.
The hidden layer uses the ReLU activation function, and the model is trained using the Adam optimizer with binary cross-entropy as the loss function. Accuracy is reported as the training metric. The mathematical formulation of the MLP is as follows:
where:
- is the input feature vector,
- and are the weights and biases for the hidden layer,
- is the ReLU activation function,
- and are the weights and bias for the output layer,
- is the sigmoid activation function.
No hyperparameter tuning was performed in this study. Parameters such as learning rate, batch size, and number of epochs were kept at their TensorFlow/Keras default values (i.e., learning rate of with the Adam optimizer, batch size of 32, and 20 epochs). The number of neurons N in the hidden layer was varied manually over the set purely to demonstrate the impact of increasing model complexity under a flawed evaluation pipeline, rather than to optimize performance.
Data leakage occurs when information from the test set is inadvertently used during training, leading to overly optimistic performance estimates. In the specific case of applying SMOTE before the train-test split, synthetic samples generated from minority class instances are scattered across both the training and testing subsets. This contaminates the test set with samples that are not truly unseen—they are interpolated from points already included in training. As a result, the model is implicitly evaluated on data it has partially “seen” during training, which artificially boosts precision, recall, and other metrics. The impact is especially severe in high-imbalance settings, such as fraud detection, where even a small number of leaked synthetic fraud samples can dominate the minority class distribution in the test set, misleadingly improving recall and F1-score. The gain in apparent performance is therefore not due to superior generalization but due to evaluation on a tainted test distribution.
We simulate a specific and well-documented form of data leakage; the application of SMOTE before splitting the dataset into training and testing partitions. This violates a key principle of supervised learning—ensuring that the test set remains entirely unseen and independent from the training process. SMOTE works by interpolating new minority-class samples based on nearest neighbors. When applied to the full dataset before splitting, it introduces artificial samples that are derived from—and often statistically similar to—what later becomes the test set. This leads to data leakage, as the model indirectly sees synthetic approximations of future test data during training. To quantify the leakage’s effect, we compare model performance under two protocols: (i) SMOTE-before-split (leaky) and (ii) SMOTE-after-split (correct). A marked difference in metrics—especially precision and recall—serves as empirical evidence of leakage-induced inflation. This deliberate setup is not intended to prove the feasibility of SMOTE but to expose how improper usage can yield deceptively strong results even with simple models.
Although our case study focused specifically on the application of SMOTE before data splitting in combination with a minimal MLP architecture, this choice was made to isolate and clearly demonstrate the consequences of a single but widespread methodological flaw. We acknowledge, however, that other forms of data leakage—such as normalization before splitting, global feature selection, and improper use of cross-validation—can similarly distort performance outcomes. Furthermore, while our example employed a simple MLP, more complex models (e.g., CNNs, RNNs, and ensemble methods) are not immune to these issues. Indeed, our broader review of the literature identifies multiple instances where even highly sophisticated architectures yield artificially high results due to flawed evaluation pipelines. These observations reinforce the generalizability of our conclusions: regardless of model complexity, methodological rigor in preprocessing and evaluation is paramount to ensuring meaningful and reproducible results.
5. Results and Analysis
To further demonstrate our argument about the disproportionate impact of methodological flaws versus algorithmic sophistication, we conducted an extreme simplification test: eliminating the hidden layer entirely () while maintaining the data leakage from SMOTE application before train-test splitting. Figure 6 presents the Precision-Recall Curve (PRC) and Receiver Operating Characteristic Curve (ROC) for this minimal configuration. Despite this extreme simplification, Table 2 shows we achieved remarkably high performance metrics: 94% recall and 97.6% precision. This demonstrates that
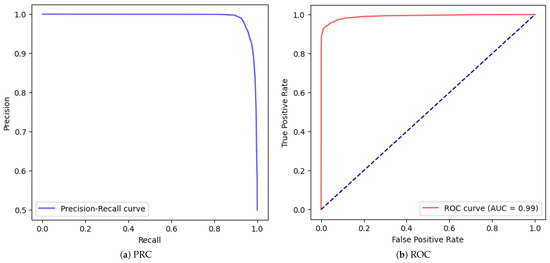
Figure 6.
Test results after applying the MLP with no hidden layer ().

Table 2.
Our MLP with various number of neurons (N) in its hidden layer.
- A single output neuron with data leakage can outperform many sophisticated models
- The data leakage from improper SMOTE application provides more benefit than architectural complexity
- Such results are artificially inflated and would not generalize to real-world scenarios
We then systematically increased the complexity by introducing a hidden layer and varying the number of neurons ( to ). As shown in Table 2, performance metrics improved incrementally with more neurons, reaching near-perfect scores (99.9% recall) at . Figure 7 and Figure 8 illustrate the PRC and ROC curves for selected configurations.
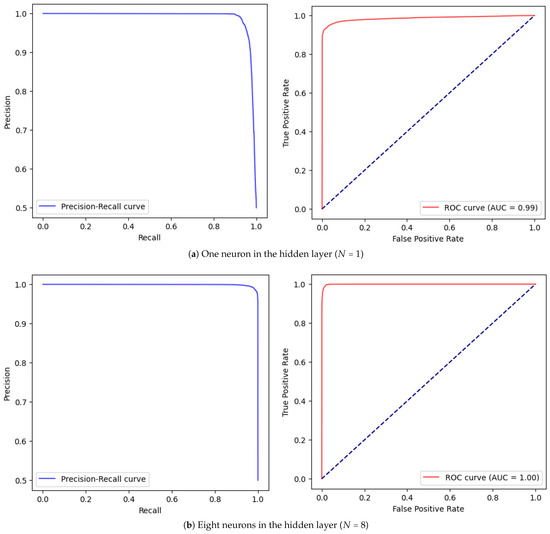
Figure 7.
Pairwise PRC (left) and ROC (right) test results of the MLP method.
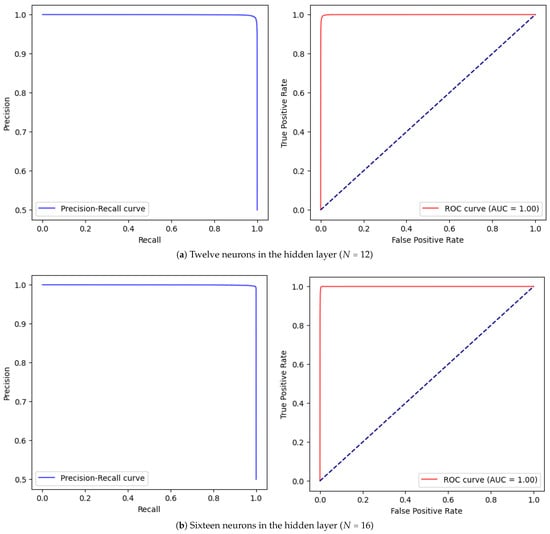
Figure 8.
Pairwise PRC (left) and ROC (right) test results of the MLP method with N neurons in a single hidden layer.
This case study vividly illustrates how fundamental methodological flaws can produce deceptively impressive results that would fail in real-world deployment. The key takeaway is that the evaluation of rigor must precede architectural sophistication in fraud detection research.
Let us go a step further and apply step by step corrections and improvements to the MLP, as progressively illustrated in the form of Table 3. Interestingly, we observed that training the model on the original, imbalanced dataset (without any oversampling) consistently yielded higher precision and recall compared to models trained with SMOTE—even when stratified splitting was used in both cases. This counterintuitive outcome underscores a critical nuance: while SMOTE is widely recommended for class imbalance, its benefits are not guaranteed. In our case, synthetic samples may have blurred class boundaries or introduced non-representative patterns, thereby impairing generalization to real fraud cases.

Table 3.
Performance of MLP with correct preprocessing configurations.
Table 3.
Performance of MLP with correct preprocessing configurations.
| MLP with 1 Hidden Layer of 32 Neurons | |||||||||
|---|---|---|---|---|---|---|---|---|---|
| No. | Stratified | Scaling | Validation | SMOTE | Accuracy | Precision | Recall | F1 | PRC/ROC |
| 1 | no | no | no | no | 0.999 | 0.867 | 0.637 | 0.735 | Figure 9 |
| 2 | yes | no | no | no | 0.999 | 0.911 | 0.415 | 0.570 | Figure 10 |
| 3 | yes | yes | no | no | 0.997 | 0.814 | 0.847 | 0.830 | Figure 11 |
| 4 | yes | yes | yes | yes | 0.998 | 0.491 | 0.867 | 0.627 | Figure 12 |
| 5 * | yes | yes | yes | yes | 0.998 | 0.522 | 0.837 | 0.643 | Figure 13 |
* No. 5 Has an Extra Hidden Layer of 16 Neurons.
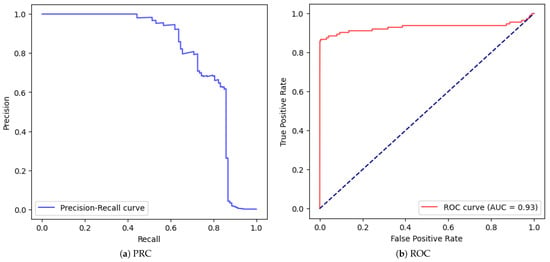
Figure 9.
Correctly fed MLP with one hidden layer of 32 neurons (Not stratified, No Scaling, No Validation, No SMOTE.
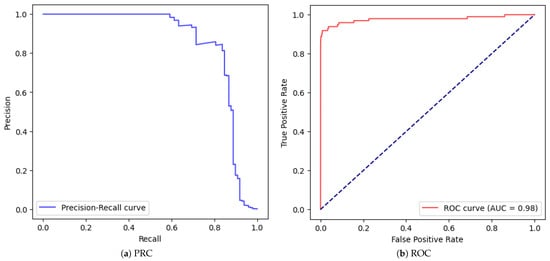
Figure 10.
Correctly fed MLP with one hidden layer of 32 neurons (stratified, No Scaling, No Validation, No SMOTE.
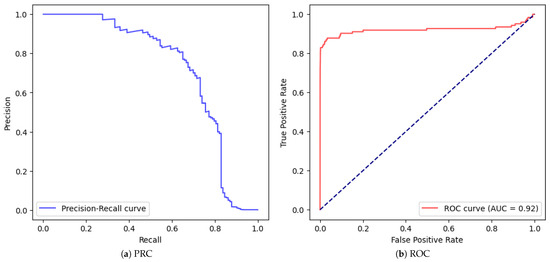
Figure 11.
Correctly fed MLP with one hidden layer of 32 neurons (stratified, Scaled, No Validation, No SMOTE.
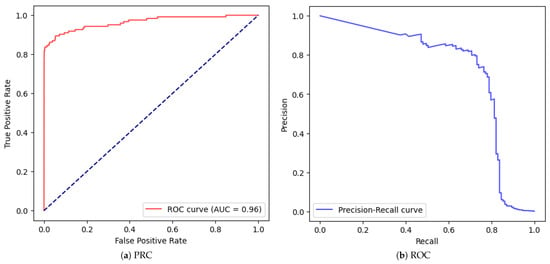
Figure 12.
Correctly fed MLP with one hidden layer of 32 neurons (stratified, Scaled, with Validation and SMOTE.).
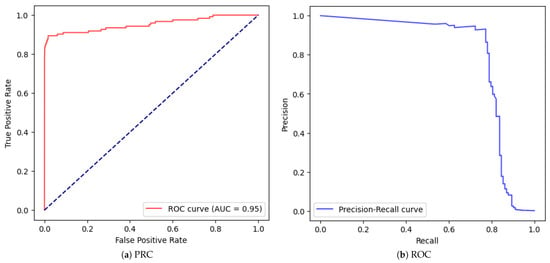
Figure 13.
Correctly fed MLP with two hidden layers of 32 and 16 neurons (stratified, Scaled, with Validation and SMOTE).
To further assess this, we compared two models: one trained on unbalanced data and another using SMOTE correctly applied after the train-test split. Despite a deeper architecture, the SMOTE-balanced model performed worse: F1-score = 0.643, Precision = 0.522, Recall = 0.837. In contrast, the unbalanced model achieved an F1-score of 0.83 (Precision = 0.814, Recall = 0.847). These findings challenge the common assumption that oversampling always improves fraud detection, emphasizing instead the importance of empirical validation.
Key observations: Stratification alone (Row 1 → Row 2) improves precision but reduces recall, possibly due to a harsher, more realistic test split. Adding scaling (Row 3) significantly boosts recall, showing that feature scaling can outperform oversampling. When SMOTE is added with a validation split (Row 4), precision remains relatively low at 0.491 despite decent recall. Even with increased model capacity (Row 5), the F1-score only modestly improves to 0.643, still well below the unbalanced model in Row 3.
These results affirm that SMOTE is not a silver bullet. Its misuse—or even correct use without calibration—can degrade performance. More importantly, simple preprocessing steps such as scaling and stratification, when applied correctly, may have more impact than sophisticated sampling techniques.
- Data leakage can overshadow architectural improvements.
- Gains from increasing neurons are marginal compared to leakage-induced boosts.
- Near-perfect metrics with SMOTE (e.g., at ) are statistically implausible.
- Methodology must precede model complexity.
This case study exemplifies how flawed evaluation can lead to deceptively impressive but non-generalizable results. Preprocessing choices—when, how, and if they are used—must be driven by data behavior and validated experimentally, not by routine convention.
6. Conclusions
Our analysis reveals that methodological rigor is far more critical than algorithmic sophistication in fraud detection research. Through deliberate experimentation with flawed evaluation protocols, we demonstrated how even simple models can achieve deceptively impressive results when fundamental methodological principles are violated. The extreme case of a single-neuron model outperforming sophisticated architectures—solely due to data leakage from improper SMOTE application—serves as a stark illustration of how evaluation flaws can overshadow algorithmic advantages.
Our results further reveal that preprocessing variations (e.g., stratification, scaling, SMOTE positioning) and minor architectural changes can lead to drastically different performance metrics, with seemingly high precision or recall often resulting from improper validation rather than genuine model merit. While our experiments are intentionally limited to a single dataset and model family (MLP), this design highlights the ease with which inflated scores can be obtained without deep models or careful tuning—thus reinforcing our central argument. A broader benchmarking across datasets or with different architectures is left for future work. Moreover, our results show that different combinations of preprocessing and validation design can produce deceptively high scores on select metrics (e.g., precision, accuracy) even when model performance is unreliable. This confirms that metric manipulation—whether through selective reporting or flawed evaluation—can obscure a model’s real effectiveness.
Beyond these technical considerations, our findings must be contextualized within the broader academic ecosystem. The peer review system faces significant challenges, including reviewer fatigue, time constraints, and overwhelming submission volumes. These issues are exacerbated by publication pressures, financial incentives tied to rapid dissemination, and citation practices that may inadvertently inflate impact metrics. The current academic reward structure, which heavily weights publication quantity and citation counts for career advancement, can sometimes incentivize quantity over quality. While understandable given institutional pressures, this emphasis may occasionally compromise research rigor and originality.
These systemic factors contribute to a growing disconnect between academic research and industrial practice. As researchers, we often find ourselves playing catch-up to industry innovation, with many academic publications essentially formalizing concepts that have already gained practical traction. The review process itself may sometimes prioritize presentation quality over substantive contribution, allowing incremental or ambiguous work to pass through.
It is crucial to emphasize that this critique is general in nature and not directed at any specific work cited in this study. All references were selected based on their relevance and alignment with our discussion and should not be construed as examples of the concerns raised. Rather, our analysis aims to highlight systemic issues that affect the field as a whole, with the goal of fostering more rigorous and impactful research practices.
For future work, we intend to expand our analysis to time-sensitive fraud detection datasets, explore leakage in unsupervised anomaly detection, and quantify the prevalence of flawed evaluation pipelines in existing literature using automated audits.
In summary, our key contribution is to expose how deceptive performance can result from evaluation flaws rather than model sophistication, using simple neural architectures to demonstrate this clearly. We advocate for (1) stricter evaluation protocols that prioritize methodological soundness over novelty, (2) enhanced transparency in reporting preprocessing and validation, (3) better alignment between academic research and industry needs, and (4) reform of incentive structures to reward rigor and long-term impact over rapid publication. Additionally, we highlight the importance of model interpretability in fraud detection. In high-stakes applications, understanding why a model flags a transaction is essential for trust, regulatory compliance, and human oversight—regardless of the underlying architecture.
By addressing these challenges, we can bridge the gap between academic research and practical applications, ultimately advancing the field of fraud detection in more meaningful ways.
Author Contributions
Methodology, K.H.; Software, K.H.; Validation, K.H. and B.M.; Formal analysis, K.H.; Investigation, K.H.; Resources, K.H.; Writing—original draft, K.H. and B.M.; Writing—review & editing, K.H. and B.M.; Visualization, K.H. and B.M.; Supervision, K.H. All authors have read and agreed to the published version of the manuscript.
Funding
This research received no external funding.
Data Availability Statement
No new data were created or analyzed in this study.
Conflicts of Interest
The authors declare no conflict of interest.
Abbreviations
The following abbreviations are used in this manuscript:
| ADASYN | Adaptive Synthetic Sampling |
| ANN | Artificial Neural Network |
| API | Application Programming Interface |
| AUC | Area Under the Curve |
| BN | Batch Normalization |
| CAE | Convolutional Autoencoder |
| CNN | Convolutional Neural Network |
| DAE | Denoising Autoencoder |
| DL | Deep Learning |
| DT | Decision Tree |
| ET | Extra Trees |
| FFNN | Feed Forward Neural Network |
| FN | False Negative |
| FP | False Positive |
| GRU | Gated Recurrent Unit |
| HRSC | High-Resolution Ship Collections |
| LDA | Linear Discriminant Analysis |
| LSTM | Long Short-Term Memory |
| ML | Machine Learning |
| MLP | Multilayer Perceptron |
| NB | Naive Bayes |
| PCA | Principal Component Analysis |
| PRC | Precision-Recall Curve |
| RF | Random Forest |
| ROC | Receiver Operating Characteristic |
| RUS | Random Undersampling |
| SMOTE | Synthetic Minority Over-sampling Technique |
| SVM | Support Vector Machine |
| TN | True Negative |
| TP | True Positive |
| UMAP | Uniform Manifold Approximation and Projection |
| XGBoost | Extreme Gradient Boosting |
References
- Lecun, Y.; Bottou, L.; Bengio, Y.; Haffner, P. Gradient-based learning applied to document recognition. Proc. IEEE 1998, 86, 2278–2324. [Google Scholar] [CrossRef]
- Pozzolo, A.D.; Caelen, O.; Johnson, R.A.; Bontempi, G. Calibrating Probability with Undersampling for Unbalanced Classification. In Proceedings of the Symposium on Computational Intelligence and Data Mining (CIDM), Cape Town, South Africa, 7–10 December 2015. [Google Scholar]
- Nguyen, T.T.; Tahir, H.; Abdelrazek, M.; Babar, A. Deep learning methods for credit card fraud detection. arXiv 2020, arXiv:2012.03754. [Google Scholar] [CrossRef]
- Chawla, N.V.; Bowyer, K.W.; Hall, L.O.; Kegelmeyer, W.P. SMOTE: Synthetic minority over-sampling technique. J. Artif. Intell. Res. 2002, 16, 321–357. [Google Scholar] [CrossRef]
- He, H.; Bai, Y.; Garcia, E.A.; Li, S. ADASYN: Adaptive synthetic sampling approach for imbalanced learning. In Proceedings of the 2008 IEEE International Joint Conference on Neural Networks (IEEE World Congress on Computational Intelligence), Hong Kong, China, 1–8 June 2008; pp. 1322–1328. [Google Scholar]
- Han, H.; Wang, W.Y.; Mao, B.H. Borderline-SMOTE: A new over-sampling method in imbalanced data sets learning. In Proceedings of the International Conference on Intelligent Computing, Hefei, China, 23–26 August 2005; pp. 878–887. [Google Scholar]
- Mani, I.; Zhang, I. kNN approach to unbalanced data distributions: A case study involving information extraction. In Proceedings of the Workshop on Learning from Imbalanced Datasets, ICML, Washington, DC, USA, 21–24 August 2003; Volume 126, pp. 1–7. [Google Scholar]
- Tomek, I. An experiment with the edited nearest-nieghbor rule. IEEE Trans. Syst. Man Cybern. 1976, 6, 448–452. [Google Scholar]
- Megha-Natarajan. Cluster Centroid. 2023. Available online: https://medium.com/@megha.natarajan/understanding-the-intuition-behind-cluster-centroids-smote-and-smoteen-techniques-for-dealing-058f3233abeb (accessed on 23 April 2024).
- Batista, G.E.; Prati, R.C.; Monard, M.C. A study of the behavior of several methods for balancing machine learning training data. ACM SIGKDD Explor. Newsl. 2004, 6, 20–29. [Google Scholar] [CrossRef]
- Chawla, N.V.; Lazarevic, A.; Hall, L.O.; Bowyer, K.W. SMOTEBoost: Improving prediction of the minority class in boosting. In Proceedings of the Knowledge Discovery in Databases: PKDD 2003: 7th European Conference on Principles and Practice of Knowledge Discovery in Databases, Cavtat-Dubrovnik, Croatia, 22–26 September 2003; pp. 107–119. [Google Scholar]
- Nguyen, H.M.; Cooper, E.W.; Kamei, K. Borderline over-sampling for imbalanced data classification. Int. J. Knowl. Eng. Soft Data Paradig. 2011, 3, 4–21. [Google Scholar] [CrossRef]
- Fiore, U.; De Santis, A.; Perla, F.; Zanetti, P.; Palmieri, F. Using generative adversarial networks for improving classification effectiveness in credit card fraud detection. Inf. Sci. 2019, 479, 448–455. [Google Scholar] [CrossRef]
- Aditya-Mishra. METRICS. 2018. Available online: https://towardsdatascience.com/metrics-to-evaluate-your-machine-learning-algorithm-f10ba6e38234 (accessed on 10 September 2024).
- Cherif, A.; Badhib, A.; Ammar, H.; Alshehri, S.; Kalkatawi, M.; Imine, A. Credit card fraud detection in the era of disruptive technologies: A systematic review. J. King Saud Univ.-Inf. Sci. 2023, 35, 145–174. [Google Scholar] [CrossRef]
- Hafez, I.Y.; Hafez, A.Y.; Saleh, A.; Abd El-Mageed, A.A.; Abohany, A.A. A systematic review of AI-enhanced techniques in credit card fraud detection. J. Big Data 2025, 12, 6. [Google Scholar] [CrossRef]
- Gbadebo-Ogunmefun, S.; Oketola, A.; Gbadebo-Ogunmefun, T.; Agbeja, A. A Review of Credit Card Fraud Detection Using Machine Learning Algorithms. 2023. Available online: https://www.researchgate.net/publication/376516430_A_Review_of_Credit_Card_Fraud_Detection_using_Machine_Learning_Algorithms (accessed on 3 June 2025).
- Mienye, I.D.; Jere, N. Deep Learning for Credit Card Fraud Detection: A Review of Algorithms, Challenges, and Solutions. IEEE Access 2024, 12, 96893–96910. [Google Scholar] [CrossRef]
- Sharma, P.; Banerjee, S.; Tiwari, D.; Patni, J.C. Machine learning model for credit card fraud detection-a comparative analysis. Int. Arab J. Inf. Technol. 2021, 18, 789–796. [Google Scholar] [CrossRef]
- Benchaji, I.; Douzi, S.; El Ouahidi, B.; Jaafari, J. Enhanced credit card fraud detection based on attention mechanism and LSTM deep model. J. Big Data 2021, 8, 1–21. [Google Scholar] [CrossRef]
- Karthika, J.; Senthilselvi, A. Smart credit card fraud detection system based on dilated convolutional neural network with sampling technique. Multimed. Tools Appl. 2023, 82, 31691–31708. [Google Scholar] [CrossRef]
- Esenogho, E.; Mienye, I.D.; Swart, T.G.; Aruleba, K.; Obaido, G. A neural network ensemble with feature engineering for improved credit card fraud detection. IEEE Access 2022, 10, 16400–16407. [Google Scholar] [CrossRef]
- Sadgali, I.; Sael, N.; Benabbou, F. Bidirectional gated recurrent unit for improving classification in credit card fraud detection. Indones. J. Electr. Eng. Comput. Sci. (IJEECS) 2021, 21, 1704–1712. [Google Scholar] [CrossRef]
- Saad Rubaidi, Z.; Ben Ammar, B.; Ben Aouicha, M. Comparative Data Oversampling Techniques with Deep Learning Algorithms for Credit Card Fraud Detection. In Proceedings of the International Conference on Intelligent Systems Design and Applications, Seattle, WA, USA, 12–14 December 2022; pp. 286–296. [Google Scholar]
- Rtayli, N. An Efficient Deep Learning Classification Model for Predicting Credit Card Fraud on Skewed Data. J. Inf. Secur. Cybercrimes Res. 2022, 5, 61–75. [Google Scholar] [CrossRef]
- Salekshahrezaee, Z.; Leevy, J.L.; Khoshgoftaar, T.M. Feature extraction for class imbalance using a convolutional autoencoder and data sampling. In Proceedings of the 2021 IEEE 33rd International Conference on Tools with Artificial Intelligence (ICTAI), Washington, DC, USA, 1–3 November 2021; pp. 217–223. [Google Scholar]
- Zou, J.; Zhang, J.; Jiang, P. Credit Card Fraud Detection Using Autoencoder Neural Network. arXiv 2019, arXiv:1908.11553. [Google Scholar] [CrossRef]
- Varmedja, D.; Karanovic, M.; Sladojevic, S.; Arsenovic, M.; Anderla, A. Credit Card Fraud Detection—Machine Learning methods. In Proceedings of the 2019 18th International Symposium INFOTEH-JAHORINA (INFOTEH), East Sarajevo, Bosnia and Herzegovina, 20–22 March 2019; pp. 1–5. [Google Scholar] [CrossRef]
- Mizher, M.Z.; Nassif, A.B. Deep CNN approach for Unbalanced Credit Card Fraud Detection Data. In Proceedings of the 2023 Advances in Science and Engineering Technology International Conferences (ASET), Dubai, United Arab Emirates, 20–23 February 2023; pp. 1–7. [Google Scholar] [CrossRef]
- Ajitha, E.; Sneha, S.; Makesh, S.; Jaspin, K. A Comparative Analysis of Credit Card Fraud Detection with Machine Learning Algorithms and Convolutional Neural Network. In Proceedings of the 2023 International Conference on Advances in Computing, Communication and Applied Informatics (ACCAI), Chennai, India, 25–26 May 2023; pp. 1–8. [Google Scholar] [CrossRef]
- Yousuf Ali, M.N.; Kabir, T.; Raka, N.L.; Siddikha Toma, S.; Rahman, M.L.; Ferdaus, J. SMOTE Based Credit Card Fraud Detection Using Convolutional Neural Network. In Proceedings of the 2022 25th International Conference on Computer and Information Technology (ICCIT), Cox’s Bazar, Bangladesh, 17–19 December 2022; pp. 55–60. [Google Scholar] [CrossRef]
- Aurna, N.F.; Hossain, M.D.; Taenaka, Y.; Kadobayashi, Y. Federated Learning-Based Credit Card Fraud Detection: Performance Analysis with Sampling Methods and Deep Learning Algorithms. In Proceedings of the 2023 IEEE International Conference on Cyber Security and Resilience (CSR), Venice, Italy, 31 July 2023–2 August 2023; pp. 180–186. [Google Scholar] [CrossRef]
- Owolafe, O.; Ogunrinde, O.B.; Thompson, A.F.B. A Long Short Term Memory Model for Credit Card Fraud Detection. In Artificial Intelligence for Cyber Security: Methods, Issues and Possible Horizons or Opportunities; Misra, S., Kumar Tyagi, A., Eds.; Springer International Publishing: Cham, Switzerland, 2021; pp. 369–391. [Google Scholar] [CrossRef]
- Xie, Y.; Liu, G.; Yan, C.; Jiang, C.; Zhou, M. Time-Aware Attention-Based Gated Network for Credit Card Fraud Detection by Extracting Transactional Behaviors. IEEE Trans. Comput. Soc. Syst. 2023, 10, 1004–1016. [Google Scholar] [CrossRef]
- Ileberi, E.; Sun, Y.; Wang, Z. Performance evaluation of machine learning methods for credit card fraud detection using SMOTE and AdaBoost. IEEE Access 2021, 9, 165286–165294. [Google Scholar] [CrossRef]
- Sasank, J.S.; Sahith, G.R.; Abhinav, K.; Belwal, M. Credit card fraud detection using various classification and sampling techniques: A comparative study. In Proceedings of the 2019 International Conference on Communication and Electronics Systems (ICCES), Coimbatore, India, 17–19 July 2019; pp. 1713–1718. [Google Scholar]
- Mahesh, K.P.; Afrouz, S.A.; Areeckal, A.S. Detection of fraudulent credit card transactions: A comparative analysis of data sampling and classification techniques. J. Phys. Conf. Ser. 2022, 2161, 012072. [Google Scholar] [CrossRef]
- Abdulghani, A.Q.; Uçan, O.N.; Alheeti, K.M.A. Credit card fraud detection using XGBoost algorithm. In Proceedings of the 2021 14th International Conference on Developments in eSystems Engineering (DeSE), Sharjah, United Arab Emirates, 7–10 December 2021; pp. 487–492. [Google Scholar]
- Khalid, A.; Owoh, N.; Uthmani, O.; Ashawa, M.; Osamor, J.; Adejoh, J. Enhancing Credit Card Fraud Detection: An Ensemble Machine Learning Approach. Big Data Cogn. Comput. 2024, 8, 6. [Google Scholar] [CrossRef]
- Smiti, S.; Soui, M. Bankruptcy prediction using deep learning approach based on borderline SMOTE. Inf. Syst. Front. 2020, 22, 1067–1083. [Google Scholar] [CrossRef]
- Forough, J.; Momtazi, S. Ensemble of deep sequential models for credit card fraud detection. Appl. Soft Comput. 2021, 99, 106883. [Google Scholar] [CrossRef]
- Fanai, H.; Abbasimehr, H. A novel combined approach based on deep Autoencoder and deep classifiers for credit card fraud detection. Expert Syst. Appl. 2023, 217, 119562. [Google Scholar] [CrossRef]
- Alarfaj, F.K.; Malik, I.; Khan, H.U.; Almusallam, N.; Ramzan, M.; Ahmed, M. Credit Card Fraud Detection Using State-of-the-Art Machine Learning and Deep Learning Algorithms. IEEE Access 2022, 10, 39700–39715. [Google Scholar] [CrossRef]
- Cartella, F.; Anunciacao, O.; Funabiki, Y.; Yamaguchi, D.; Akishita, T.; Elshocht, O. Adversarial attacks for tabular data: Application to fraud detection and imbalanced data. arXiv 2021, arXiv:2101.08030. [Google Scholar] [CrossRef]
- Arora, V.; Leekha, R.S.; Lee, K.; Kataria, A. Facilitating User Authorization from Imbalanced Data Logs of Credit Cards Using Artificial Intelligence. Mob. Inf. Syst. 2020, 2020, 8885269. [Google Scholar] [CrossRef]
- Imbalanced-Learn Developers. Imblearn.Over_Sampling.SMOTE—Imbalanced-Learn 0.11.0 Documentation. 2024. Available online: https://imbalanced-learn.org/stable/references/generated/imblearn.over_sampling.SMOTE.html (accessed on 23 July 2025).
- Amir-Al. Artificial Neural Network (ANN) with Practical Implementation. 2019. Available online: https://medium.com/machine-learning-researcher/artificial-neural-network-ann-4481fa33d85a (accessed on 18 September 2024).
Disclaimer/Publisher’s Note: The statements, opinions and data contained in all publications are solely those of the individual author(s) and contributor(s) and not of MDPI and/or the editor(s). MDPI and/or the editor(s) disclaim responsibility for any injury to people or property resulting from any ideas, methods, instructions or products referred to in the content. |
© 2025 by the authors. Licensee MDPI, Basel, Switzerland. This article is an open access article distributed under the terms and conditions of the Creative Commons Attribution (CC BY) license (https://creativecommons.org/licenses/by/4.0/).