Article

Influence of Regional PM2.5 Sources on Air Quality: A Network-Based Spatiotemporal Analysis in Northern Thailand

by
Khuanchanok Chaichana
1,2,3,
Supanut Chaidee
1,2,3,
Sayan Panma
1,2,3,
Nattakorn Sukantamala
1,2,3,
Neda Peyrone
4 and
Anchalee Khemphet
1,2,3,*
1
Advanced Research Center for Computational Simulation, Chiang Mai University, Chiang Mai 50200, Thailand
2
Department of Mathematics, Faculty of Science, Chiang Mai University, Chiang Mai 50200, Thailand
3
Centre of Excellence in Mathematics, MHESI, Bangkok 10400, Thailand
4
Department of Computer Engineering, Faculty of Engineering, Chulalongkorn University, Bangkok 10330, Thailand
*
Author to whom correspondence should be addressed.
Mathematics 2025, 13(15), 2468; https://doi.org/10.3390/math13152468
Submission received: 22 June 2025 / Revised: 26 July 2025 / Accepted: 30 July 2025 / Published: 31 July 2025
(This article belongs to the Special Issue Application of Mathematical Theory in Data Science)

Abstract

Northern Thailand frequently suffers from severe PM2.5 air pollution, especially during the dry season, due to agricultural burning, local emissions, and transboundary haze. Understanding how pollution moves across regions and identifying source–receptor relationships are critical for effective air quality management. This study investigated the spatial and temporal dynamics of PM2.5 in northern Thailand. Specifically, it explored how pollution at one monitoring station influenced concentrations at others and revealed the seasonal structure of PM2.5 transmission using network-based analysis. We developed a Python-based framework to analyze daily PM2.5 data from 2022 to 2023, selecting nine representative stations across eight provinces based on spatial clustering and shape-based criteria. Delaunay triangulation was used to define spatial connections among stations, capturing the region’s irregular geography. Cross-correlation and Granger causality were applied to identify time-lagged relationships between stations for each season. Trophic coherence analysis was used to evaluate the hierarchical structure and seasonal stability of the resulting networks. The analysis revealed seasonal patterns of PM2.5 transmission, with certain stations, particularly in Chiang Mai and Lampang, consistently acting as source nodes. Provinces such as Phayao and Phrae were frequently identified as receptors, especially during the winter and rainy seasons. Trophic coherence varied by season, with the winter network showing the highest coherence, indicating a more hierarchical but less stable structure. The rainy season exhibited the lowest coherence, reflecting greater structural stability. PM2.5 spreads through structured, seasonal pathways in northern Thailand. Network patterns vary significantly across seasons, highlighting the need for adaptive air quality strategies. This framework can help identify influential monitoring stations for early warning and support more targeted, season-specific air quality management strategies in northern Thailand.

1. Introduction

Air pollution from fine particulate matter (PM2.5) is a major global concern due to its serious effects on human health. PM2.5 particles are small enough to enter the lungs and bloodstream, increasing the risk of respiratory and cardiovascular diseases and reducing life expectancy [1,2,3]. In northern Thailand, PM2.5 levels often spike during the dry season due to the widespread burning of agricultural and forest biomass [4]. Understanding the spatiotemporal transmission of PM2.5 is essential for effective air quality forecasting, regional pollution management, and the design of long-term mitigation strategies.
Previous studies have examined PM2.5 sources [5,6] and the influence of meteorological and economic factors [7,8,9]. However, many of these studies analyze each station independently or rely on simple correlation methods, which may not fully capture how pollution propagates across regions, especially during long-range transport events [10,11]. Recent advancements in network-based approaches [12,13] and machine learning models [14] have improved our understanding of PM2.5 dynamics, but most of these works either focus on statistical dependencies or prediction accuracy without exploring the directional and hierarchical structure of pollutant transmission.
To address these limitations, we propose a network framework that combines cross-correlation, Granger causality, and trophic coherence to analyze PM2.5 dynamics. Cross-correlation reveals time-lagged similarities between stations, while Granger causality tests whether changes at one station can predict changes at another [15,16,17,18]. Trophic coherence, a concept adapted from food-web theory, measures the hierarchical structure and stability of directed networks [19,20]. Together, these methods allow us to characterize the statistical dependencies, directional flows, and structural stability of PM2.5 transmission, providing a comprehensive perspective.
Compared to event synchronization techniques [21,22] and general correlation networks [23,24,25], Granger causality better captures both the direction and timing of pollution transport. Other network approaches, such as percolation analysis [26,27], have been used to study transitions in air pollution systems, and complex networks have revealed dynamic interactions in environmental and climate systems [28,29,30]. On a global scale, studies have shown that events such as El Niño can influence air and climate networks far beyond their origin [31,32]. While these methods offer valuable insights, they are not designed to uncover localized, directional, and seasonally varying relationships between PM2.5 monitoring stations.
Our approach is seasonally resolved, capturing how transmission pathways and hub regions shift between the winter, summer, and rainy seasons. This network analysis provides a dynamics understanding of PM2.5 behavior, complementing previous studies that focus on static or annual patterns. While deep learning models such as LSTM, RNN, and Transformer architectures [33,34] have achieved strong predictive performance, their complex architectures make it challenging to interpret how specific inputs influence the results.
Spatial structure is another critical factor in pollution spread. Northern Thailand’s irregular geography means that fixed-distance thresholds or grid-based approaches can misrepresent spatial connectivity. To overcome this, we use Delaunay triangulation to define adjacency relationships based on actual station positions [35], combined with shape analysis to ensure consistency with the region’s geographical boundaries [36,37].
Our framework extends existing PM2.5 network studies by integrating cross-correlation, Granger causality, trophic coherence, and spatial methods such as Delaunay triangulation and shape analysis, enabling a more comprehensive examination of seasonal and hierarchical transmission dynamics. This study applies the proposed framework to PM2.5 data from 2022 to 2023 across eight provinces in northern Thailand, demonstrating how PM2.5 spreads over time and space while identifying consistent source and receptor regions.

2. Materials and Methods

2.1. Study Area, Data Collection, and Preprocessing

This study utilized PM2.5 data provided by the Climate Change Data Center (CCDC) at Chiang Mai University, accessible through both file downloads and a REST API. The dataset spans 730 days, from January 2022 to December 2023, and includes records from 677 monitoring stations, both active and inactive, located within 8 provinces of upper northern Thailand (Figure 1), Chiang Mai, Chiang Rai, Lampang, Lamphun, Mae Hong Son, Nan, Phayao, and Phrae, where PM2.5 pollution is a recurring problem. To ensure accurate and efficient data handling, we developed a Python program (version 3.10.2) that automatically fetches and manages the dataset.
Once the data files were downloaded, the program executed an extract, transform, and load (ETL) process to store the PM2.5 data in an SQLite database. SQLite is particularly suitable for efficient exploration and analysis of PM2.5 data due to its lightweight, file-based structure and reliability. Our investigation revealed that some monitoring stations had missing measurements during certain hours or entire days, likely due to network connectivity issues or sensor malfunctions. To ensure data quality, we first removed any PM2.5 values outside the range of 0 to 1000 μg/m3, as such values were considered implausible and likely caused by recording errors. We then included only days with at least 18 valid hourly observations, equivalent to 75% data completeness, to reduce the influence of short-term spikes and required this condition to be met for at least 600 days within the 730-day study period. Based on this filtering process, 48 stations qualified as having sufficient data for calculating daily average PM2.5 levels. Figure 2 presents histograms showing the distributions of valid and missing data across all the stations, while Figure 3 shows the locations of all the stations with indications of valid data availability. Finally, we visually inspected the time series for each station to confirm that no artificial outliers remained after aggregation.

2.2. Spatial Network Construction

In this study, we analyze a network of monitoring stations, mathematically modeled as a graph consisting of nodes (or vertices) and edges. Each node represents a station, and edges denote connections between stations, defined based on spatial attributes such as distance or other associations. Given that some stations are located in close proximity, we optimized the network size by selecting representative stations through spatial clustering using Delaunay triangulation. This triangulation was constructed using latitude and longitude coordinates because the study area is relatively small, and the resulting spatial distortion is negligible. For analyses covering larger geographic regions, an equidistant projection, such as UTM, should be used to ensure accurate spatial relationships.

2.2.1. Delaunay Triangulation

We analyze the spatial relationships among a set of stations located on a two-dimensional plane, where each station is positioned at coordinates corresponding to its latitude and longitude. We then employ Delaunay triangulation on the set of stations. This method ensures that no point lies within the circumcircle of any triangle in the triangulation, effectively identifying local neighbor connections. An edge between two stations exists in Delaunay triangulation if and only if those two stations are spatially proximate [35,37].
Once the Delaunay triangulation was constructed, we removed outliers and grouped the stations to identify appropriate representatives. The set of Euclidean distances along the edges of the Delaunay triangulation was analyzed using a box plot to detect and remove outliers. Distances exceeding Q 3 + 1.5 · IQR, where IQR denotes the interquartile range (the difference between the first and third quartiles), were excluded, producing a refined set D of stations from which distant stations were removed. The mean and standard deviation were then used to define a proximity threshold ϵ = Mean ( D ) 0.5 · SD ( D ) , which guided the formation of local groups around each station, i.e., a station was grouped with another station if their distance was smaller than the threshold.
Based on these groups, representative stations were selected using criteria, such as group size, data availability, and spatial centrality. Single-station groups are self-representing; in two-station groups, the station with more data is selected; and for larger groups, the station closest to the group’s centroid is chosen. Ties are resolved based on data coverage, and connections to external stations are preserved to maintain the overall network structure.

2.2.2. Regional Shape Analysis

To determine representative stations for each province, we consider the geometric characteristics of the region’s shape. One key factor is the roundness of the region, which quantifies its similarity to a perfect circle. Provinces are treated as bounded regions defined by a set of boundary points. The roundness metric is calculated using the region’s area A and perimeter P as follows:
roundness = 4 π A P 2
This value approaches 1 when the region closely resembles a circle. However, some provinces in our dataset exhibit elongated or irregular shapes. In such cases, it may be necessary to identify more than one representative station within a single province.
In this study, we first computed the roundness for each province. Using an appropriate threshold, we identified provinces that were significantly narrow or elongated. For these provinces, we applied the rectangle-fitting method proposed by Chaudhuri and Samal [36]. This algorithm fits the minimum-area-enclosing rectangle to the region’s boundary. The rectangle is then bisected at the midpoint of its longer side, producing two subregions. Next, we calculated the centroid of each subregion. For each side of the separator, the station closest to the corresponding centroid was selected as the representative for that section of the province. If a subregion did not contain any stations, no representative was assigned to that part.

2.3. Temporal Causality and Dependency Analysis

After selecting the representative stations using the previously described procedure, we analyze the relationships between the PM2.5 measurements at these stations. The analysis focuses on identifying statistical and structural dependencies between pairs of stations. To achieve this, we apply two analytical techniques: cross-correlation, to assess temporal similarity, and Granger causality, to detect directional influence. For both methods, daily averaged PM2.5 concentrations are used as the time step to ensure consistent temporal resolution.

2.3.1. Cross-Correlation

To quantify the temporal relationship between pairs of time series X i ( t ) and X j ( t ) over a given time window of length T, we employ cross-correlation analysis. First, each time series is mean-centered by computing its average X i ¯ and deviation δ X i ( t ) as follows:
X i ¯ = 1 T t = 1 T X i ( t ) , δ X i ( t ) = X i ( t ) X i ¯
The cross-correlation function C ^ i j ( τ ) is then calculated to measure the similarity between time series X i and X j as a function of lags τ , where τ m a x τ τ m a x . It is defined as
C ^ i j ( τ ) = t = 1 T τ δ X i ( t ) · δ X j ( t + τ ) t = 1 T ( δ X i ( t ) ) 2 · t = 1 T ( δ X j ( t + τ ) ) 2
This function is normalized to yield values in the range [ 1 , 1 ] , allowing for consistent comparison across time-series pairs. It measures how well one series aligns with the other when shifted by τ . To identify the most significant temporal relationship, we determine the optimal lag τ i j that maximizes the cross-correlation:
τ i j = arg max τ m a x τ τ m a x C ^ i j ( τ )
The corresponding maximum correlation value at this lag is denoted C i j = C ^ i j ( τ i j ) . The sign and magnitude of τ i j provide insight into the temporal direction of influence between the time series: if τ i j > 0 , then series X i leads X j ; if τ i j < 0 , then series X j leads X i ; and if τ i j = 0 , the two series are synchronized in time. The magnitude of C i j indicates the strength of the relationship, with values near ± 1 suggesting strong correlation and values near 0 indicating weak or no linear correlation.

2.3.2. Granger Causality

To assess directional predictability between time series, we use the Granger causality test, originally proposed by Granger [15]. This method evaluates whether past values of one time series, X, contain information that helps predict future values of another series, Y, beyond the information already contained in the past values of Y itself. Unlike simple correlation analyses, Granger causality is based on predictive modeling. The test involves estimating the following autoregressive model:
Y t = i = 1 k θ i X t i + i = 1 k γ i Y t i + ϵ t ,
where k is the maximum lag length, θ i and γ i are regression coefficients, and ϵ t is the model residual. An F-test is used to determine whether the coefficients θ i associated with the lagged values of X are jointly significantly different from zero. If they are, we conclude that X Granger-causes Y, indicating that past values of X improve the prediction of Y. It is important to emphasize that Granger causality identifies predictive rather than true causality. The results reflect temporal precedence and statistical association, not necessarily a causal mechanism.

2.4. Trophic Coherence of the Granger Network

Finally, we analyze the hierarchical structure of the Granger causality network using trophic coherence, a measure that quantifies how well a directed network conforms to a layered, feedforward structure [19]. This approach reconstructs hierarchical levels for each node in the network and evaluates the degree of consistency in the direction of influence. Trophic coherence is defined for networks that contain at least one basal node, a node with zero in-degree, and where each node lies on a directed path originating from at least one basal node. The trophic level s i of node i is defined recursively as the average trophic level of all nodes from which it receives input:
s i = 1 + 1 k i i n j a i j s j ,
where a i j is the adjacency matrix (1 if there is a directed edge from node j to node i, 0 otherwise), and k i i n = j a i j is the in-degree of node i. By definition, basal nodes are assigned a trophic level of s i = 1 . The trophic difference between two connected nodes i and j is given by δ i j = s i s j . The trophic coherence of the network is then measured by the standard deviation of the distribution of δ i j , referred to as the incoherence parameter q:
q = 1 L i j a i j δ i j 2 1 ,
where L is the total number of directed edges in the network. A smaller value of q indicates higher trophic coherence, meaning the network exhibits a clearer hierarchical structure. Conversely, larger q values reflect greater structural feedback and deviation from hierarchy.

3. Results and Discussion

3.1. Spatial Network Characteristics

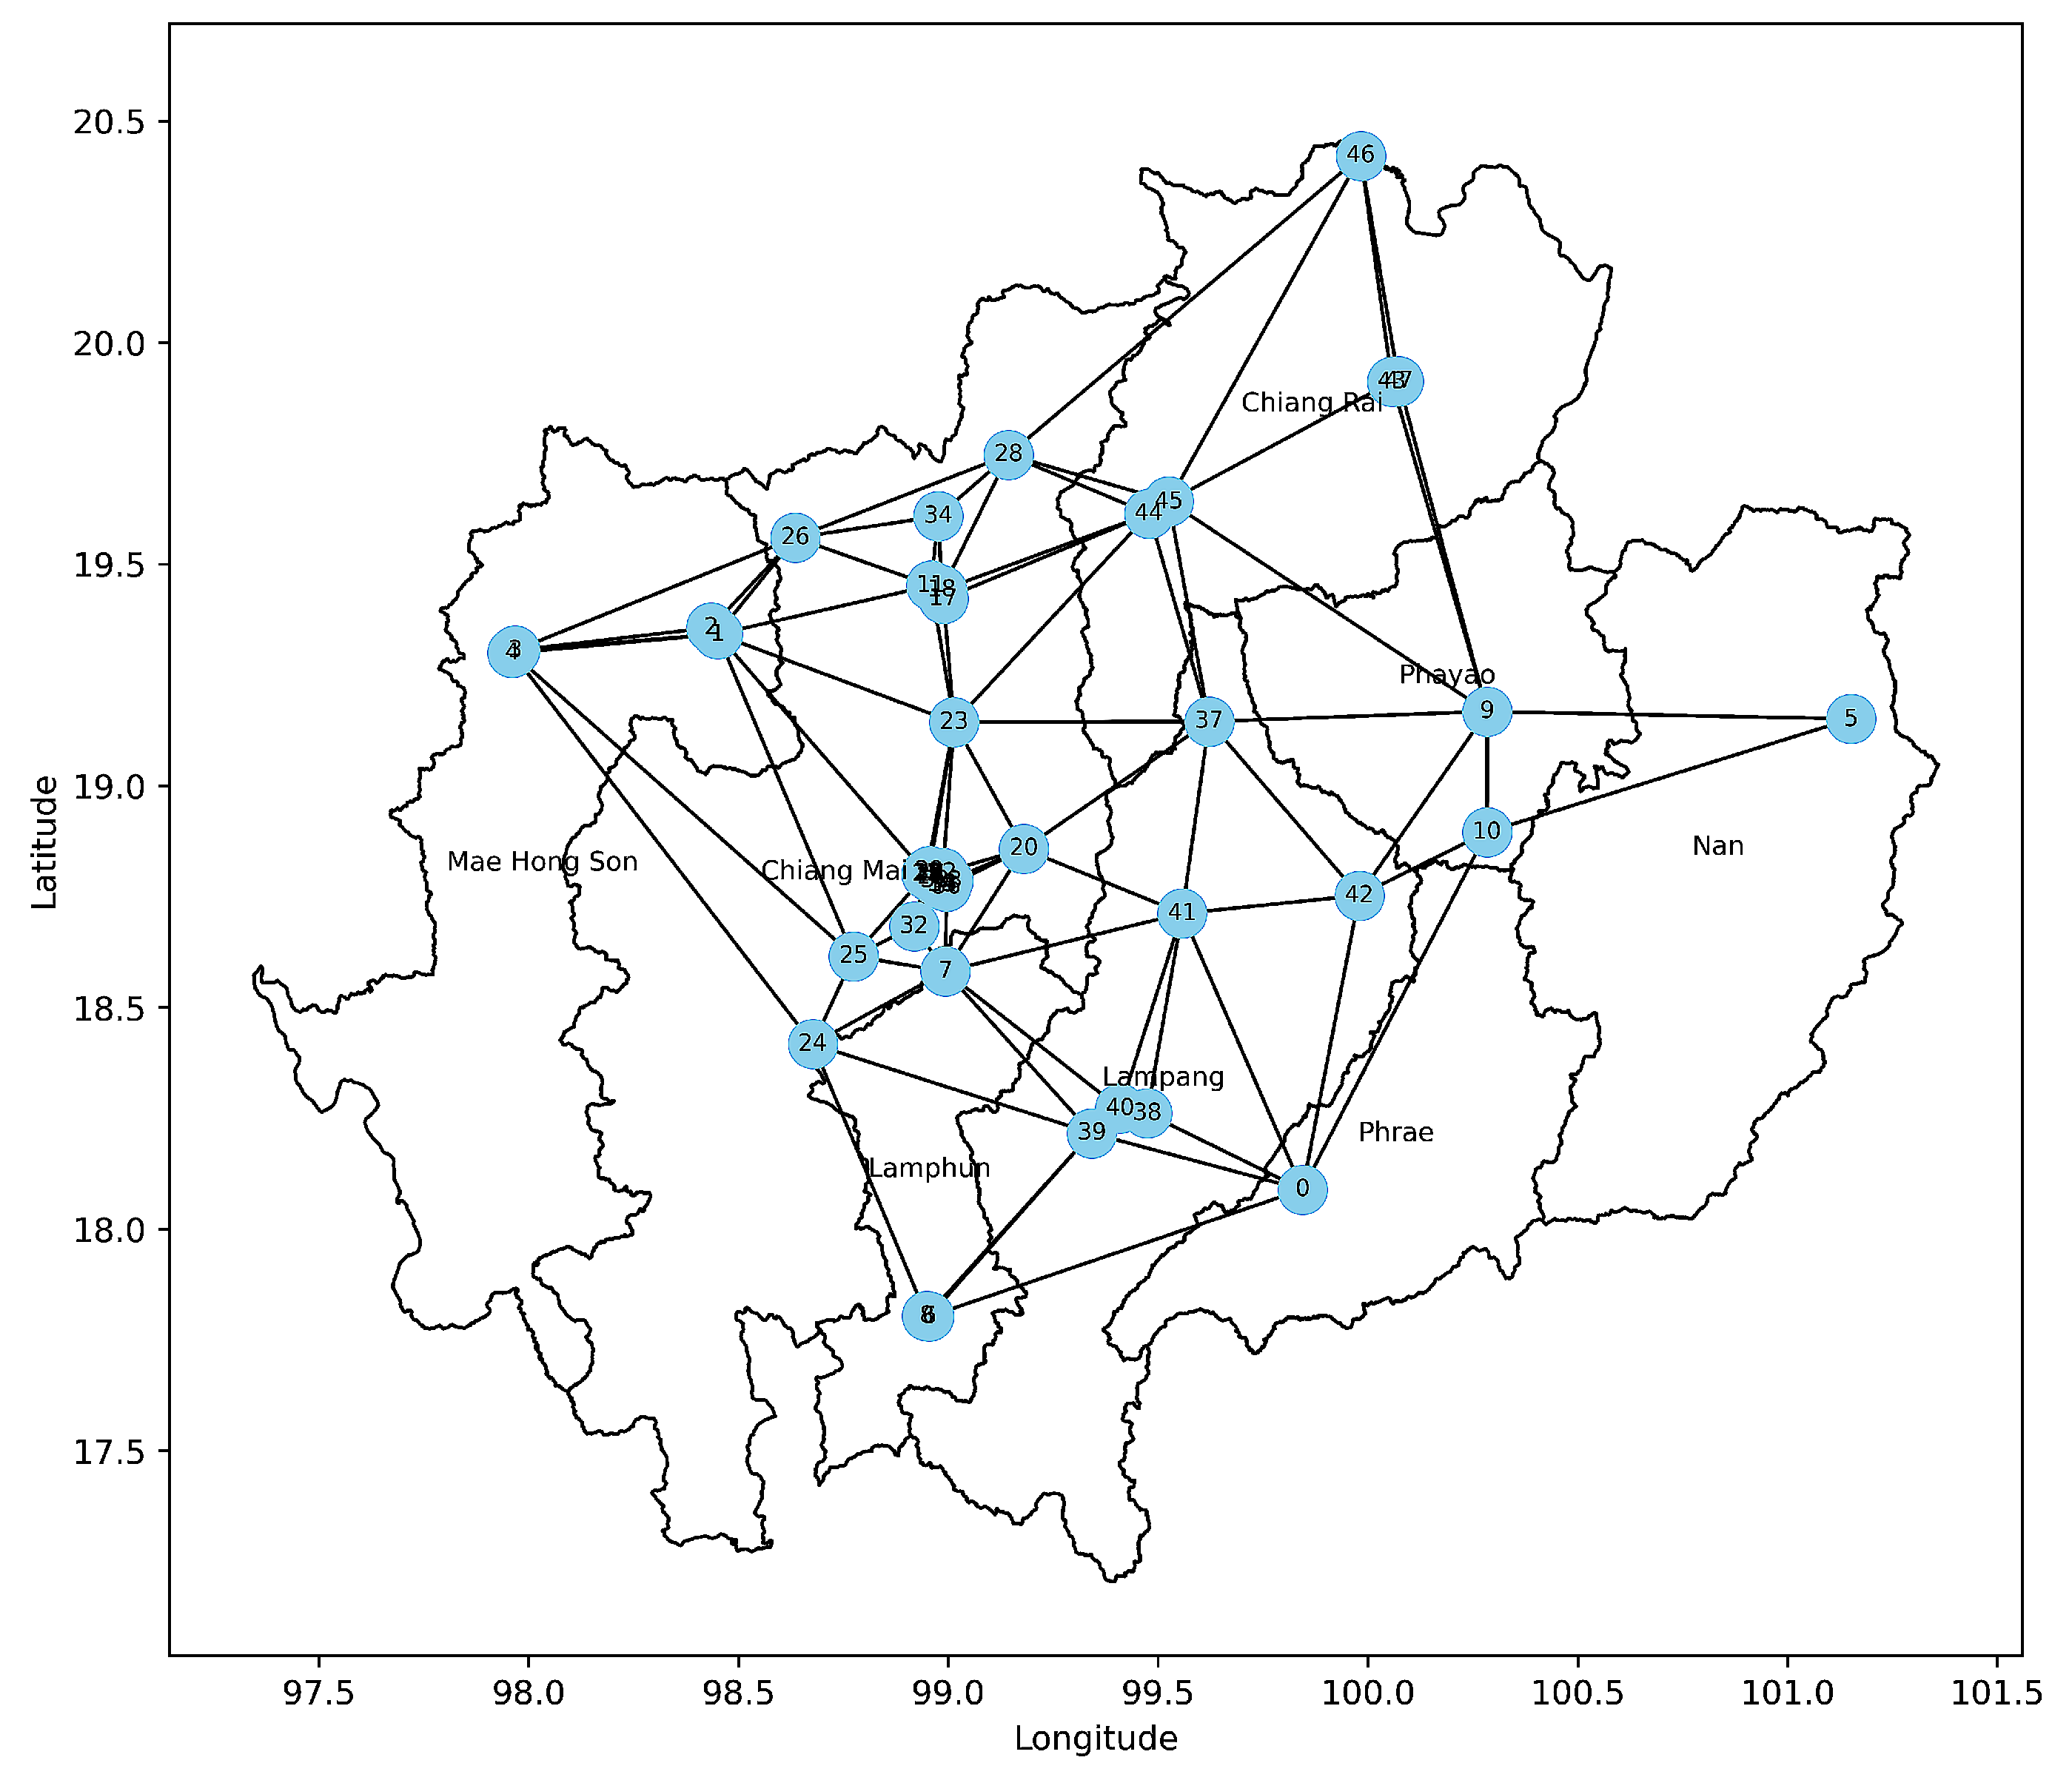
From the initial dataset of 677 monitoring stations across northern Thailand, we selected 48 stations based on spatial filtering criteria, as described in Section 2.1. We applied Delaunay triangulation to construct a spatial network and calculated the edge lengths. The average and standard deviation of the edge lengths were 0.3629 and 0.3730 (latitude/longitude degrees), respectively. The highest outlier ( 0.7508 ) was used as a threshold to remove excessively long edges, resulting in a refined network shown in Figure 4. We verified that these values and the resulting Delaunay network structure remain consistent when using a planar projection, indicating that distortion from the coordinate system is minimal in our study area.
During clustering, station pairs separated by distances less than ϵ = 0.1753 , calculated using the formula presented in Section 2.2.1, were grouped together. After this process, 21 stations remained in the graph, preserving the structure of the original network. This filtering supported later causal and network analyses, such as Granger causality and trophic coherence, by simplifying the network without losing key spatial information. The number of monitoring stations in each province, both before and after applying Delaunay triangulation, is summarized in Table 1.
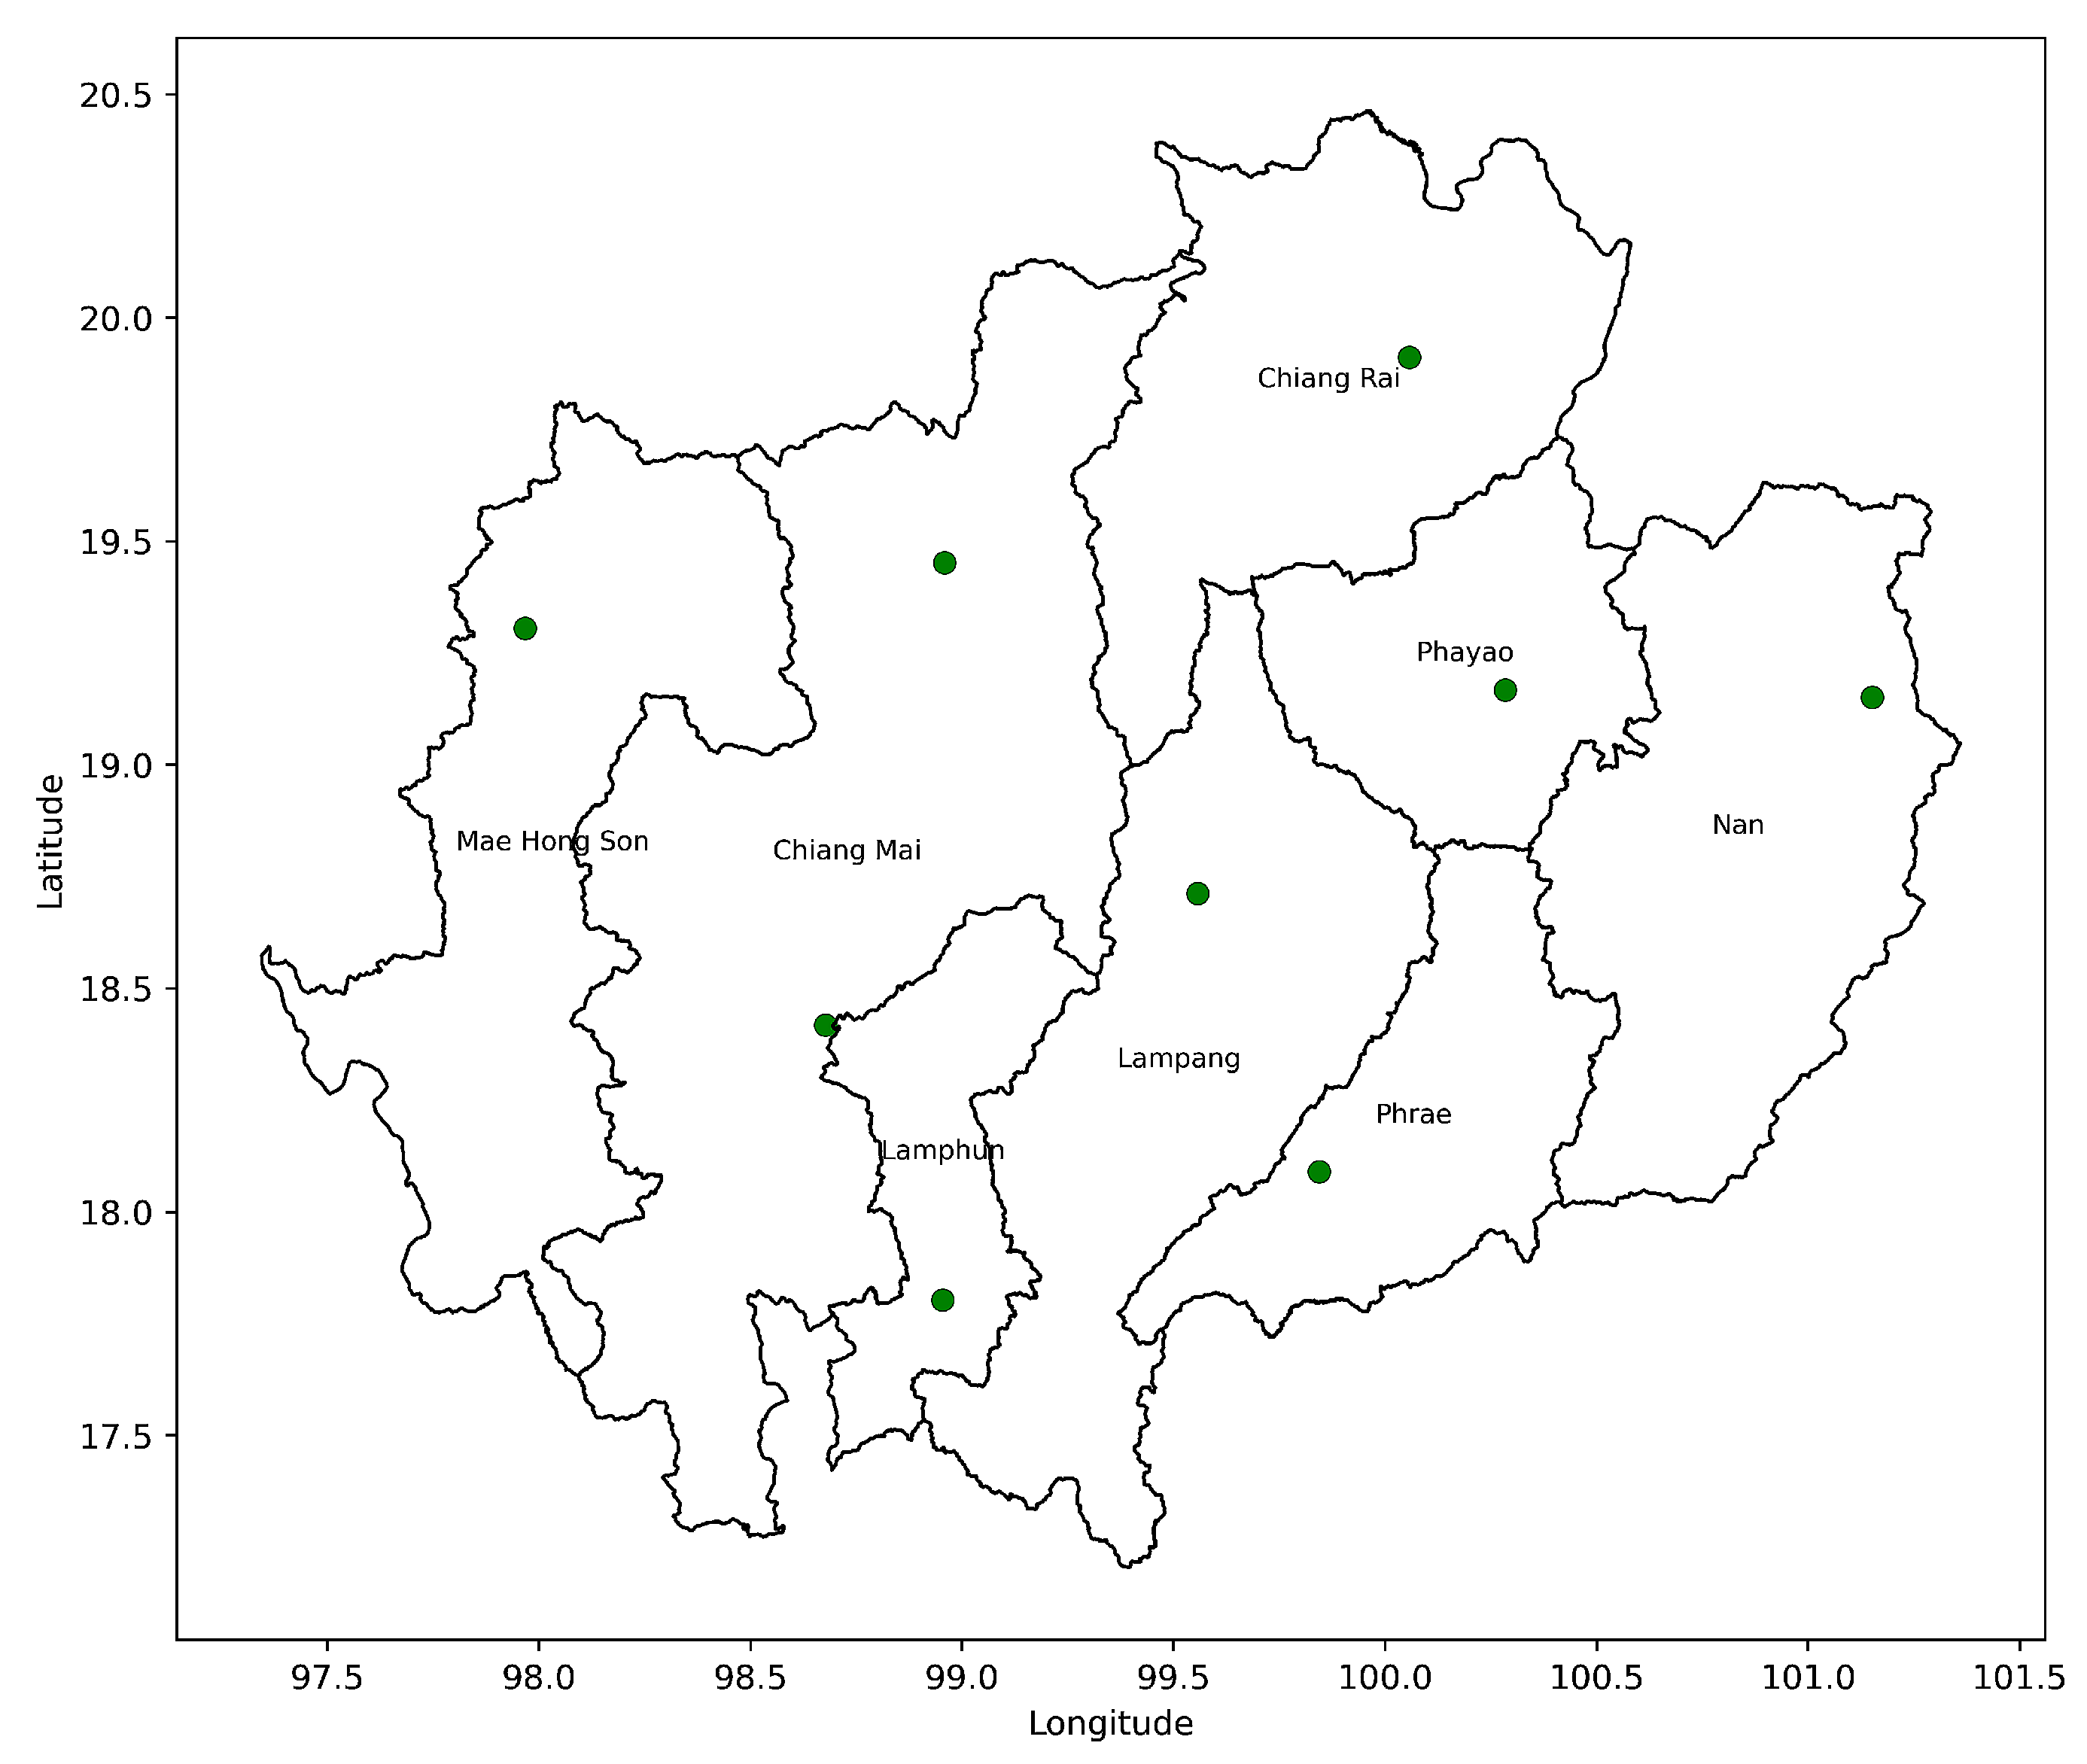
To represent each province, we computed the roundness of regional boundaries using Equation (1) based on data from CCDC. The average roundness across the eight provinces was 0.2485. We selected provinces with roundness below this average, specifically, Chiang Mai, Lampang, Lamphun, and Mae Hong Son, and fitted bounding rectangles to each selected region. As shown in earlier studies, regional shape characteristics can influence how pollution spreads and how monitoring networks should be organized [36]. Using these rectangles and their centroids as spatial separators, we identified nine representative stations: Chiang Mai 1 (north area), Chiang Mai 2 (south area), Chiang Rai, Lampang, Lamphun, Mae Hong Son, Nan, Phayao, and Phrae. The locations and associated metadata are illustrated in Figure 5. These stations provided a spatially representative framework for analyzing PM2.5 spread, supporting regional air quality planning.
In this study, we adopted Delaunay triangulation to define realistic neighborhood structures among irregularly distributed stations, which is central to our network analysis. Advanced spatial models, such as INLA-SPDE or grid-based interpolation, could enhance the spatiotemporal resolution of PM2.5 dynamics, particularly when applied to larger datasets. Integrating such approaches with our network framework is an interesting avenue for future research.

3.2. PM2.5 Trends and Data Overview

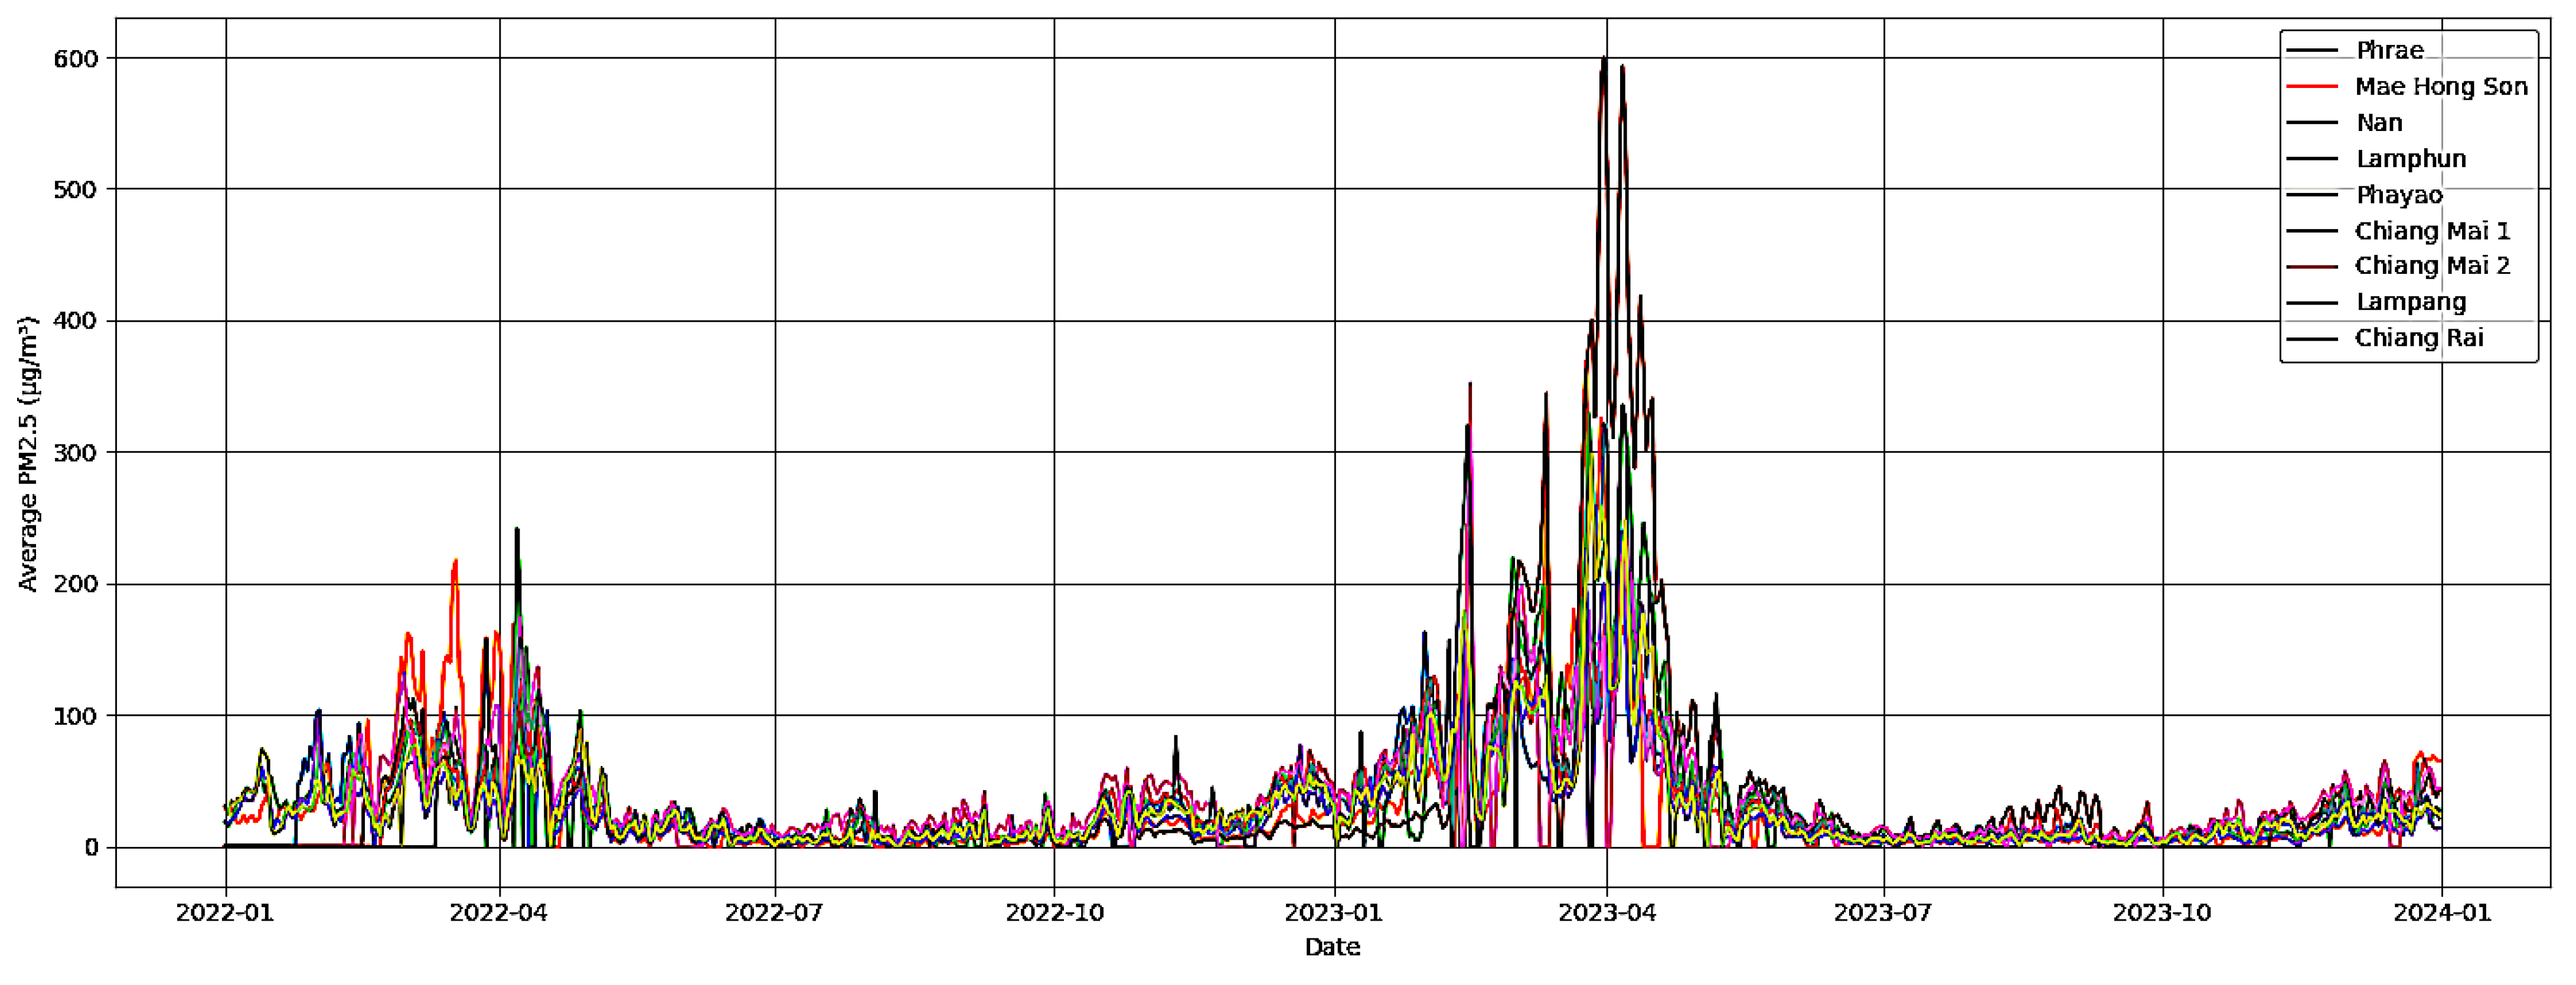
Average PM2.5 concentrations (in μg/m3) from January 2022 to December 2023 were recorded at nine stations across eight provinces in northern Thailand, Phrae, Mae Hong Son, Nan, Lamphun, Phayao, Chiang Mai, Lampang, and Chiang Rai, and showed distinct seasonal and regional patterns (Figure 6). Elevated PM2.5 levels occurred annually during the early months, especially from February to April, corresponding to the dry season and widespread agricultural burning [4].
The most significant spike occurred in March 2023, when Chiang Mai 1 and Chiang Rai recorded extreme values exceeding 500 μg/m3, classified as hazardous according to WHO air quality guidelines [3]. This spike reflected not only increased fire activity but also worsening air quality conditions compared to the same period in 2022, which showed high but relatively lower concentrations. These findings aligned with satellite and ground-based reports of intensified biomass burning events in 2023, particularly in border regions. This seasonal haze pollution has been a recurrent issue in northern Thailand, especially during the dry season, challenging local resilience efforts [38].
In contrast, PM2.5 levels dropped significantly during the rainy season (May to October), likely due to increased atmospheric washout and reduced fire activity [8]. This seasonal contrast highlighted the strong meteorological influence on air pollution levels and supported previous studies indicating the dominant role of transboundary haze and seasonal burning in shaping regional air quality.
Regional differences between stations also suggested local variations in emission sources and topography. For instance, Chiang Mai and Chiang Rai, both located in valleys surrounded by mountains, may have experienced more severe pollution due to pollutant trapping and limited air circulation [11].
These seasonal and spatial patterns provided critical context for assessing public health risks and formulating targeted air quality interventions. For further analysis, we categorized the data into three seasons: winter (16 October to 15 February, 246 days), summer (16 February to 15 May, 177 days), and rainy season (16 May to 15 October, 304 days), following Thai Meteorological Department definitions to explore temporal and station-specific trends.

3.3. Temporal Dependency and Causality Between Stations

3.3.1. Cross-Correlation Results

To explore spatial relationships in PM2.5 concentrations, we constructed directed networks using cross-correlation between monitoring stations. A strong correlation between station i and j was defined as C i j 0.8 , where C i j was the maximum cross-correlation value and τ i j 0 was the corresponding optimal time lag. Based on this, the adjacency matrix A = [ a i j ] was defined as
a i j = 1 if C i j 0.8 , τ i j 0 , i j , 0 otherwise
We then generated a directed network where each node represented a monitoring station, and a directed edge from station i to station j was drawn when a i j = 1 . If both a i j = 1 and a j i = 1 , the edge was considered undirected, indicating mutual high correlation. This method was applied to daily PM2.5 data collected from nine monitoring stations during 2022 and 2023, grouped into three seasonal categories: winter, summer, and rainy seasons.
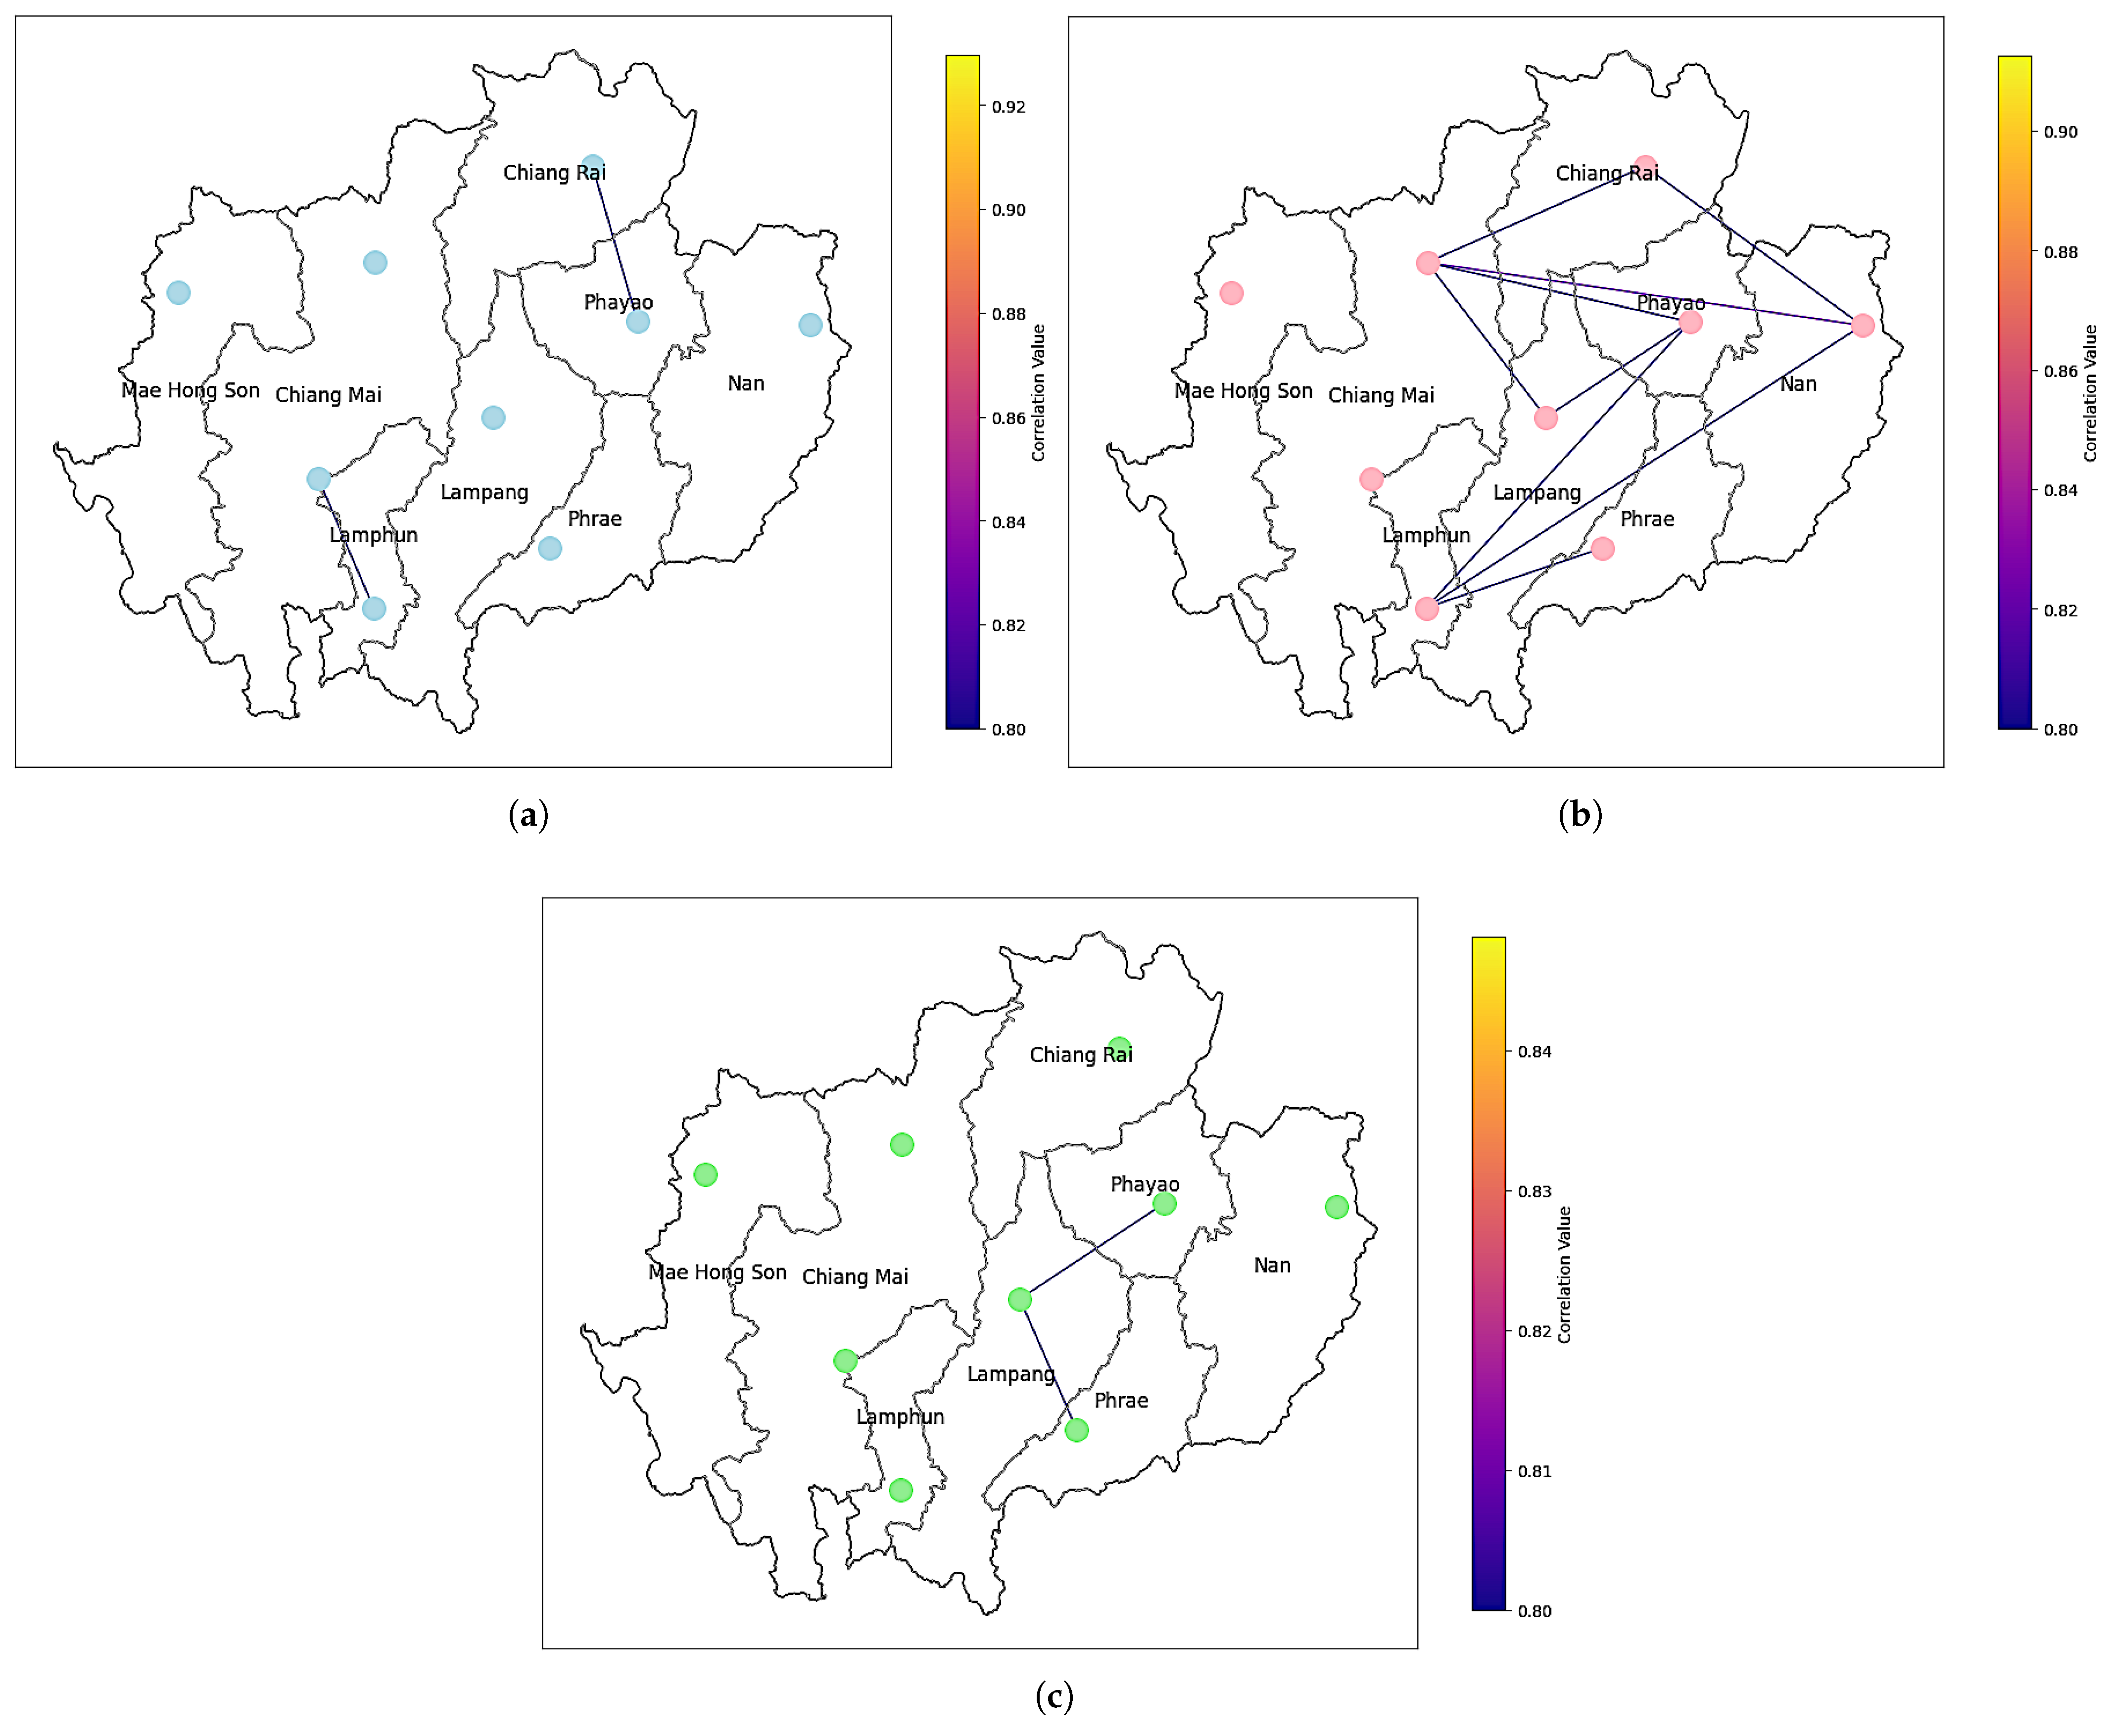
During the winter season (Figure 7a), strong correlations were observed among Lamphun, Chiang Mai 2, and Lampang. These provinces were geographically close and topographically similar, located in the central-western part of northern Thailand. This suggested shared pollution sources or common meteorological influences, such as low wind speed and temperature inversions [4]. A distinct connection between Chiang Rai and Phayao in the northeast indicated regional coherence in air pollution, possibly reflecting shared transboundary or regional emissions.
In the summer season (Figure 7b), Chiang Mai 1 showed strong correlations with Nan, Phayao, Lampang, and Chiang Rai. The strongest correlation with Nan may have indicated pollutant transport or fire activity in the northeastern highlands influencing a wider area during this season. The broader spatial spread of correlations in the summer suggested that atmospheric transport processes played a larger role during this period compared to the winter.
During the rainy season (Figure 7c), the network showed fewer strong correlations overall, likely due to increased rainfall and atmospheric cleansing reducing PM2.5 levels and spatial dependence. However, moderate correlations persisted between Lampang and both Phayao and Phrae, implying continued influence from shared sources or stable background pollution in these areas.
Across all seasons, Mae Hong Son consistently showed weak or no significant correlations with other stations, suggesting localized or independent pollution events, or geographic and meteorological isolation. Its mountainous terrain and distance from dense urban or agricultural activity may have contributed to this distinct behavior.
Overall, the analysis revealed that spatial correlations in PM2.5 concentrations varied significantly by season. These shifting patterns highlighted the complex interplay of meteorological factors, topography, and human activities. Understanding how these correlations evolved across seasons can help guide more targeted air quality management strategies in northern Thailand.
To validate the significance of cross-correlation, we applied a permutation test in which randomized surrogate datasets were used to construct an empirical null distribution. The observed maximum cross-correlations across all seasons were consistently above the 99.9th percentile ( p 0.001 ), confirming that the PM2.5 relationships are robust and not attributable to random variability.

3.3.2. Granger Causality Results

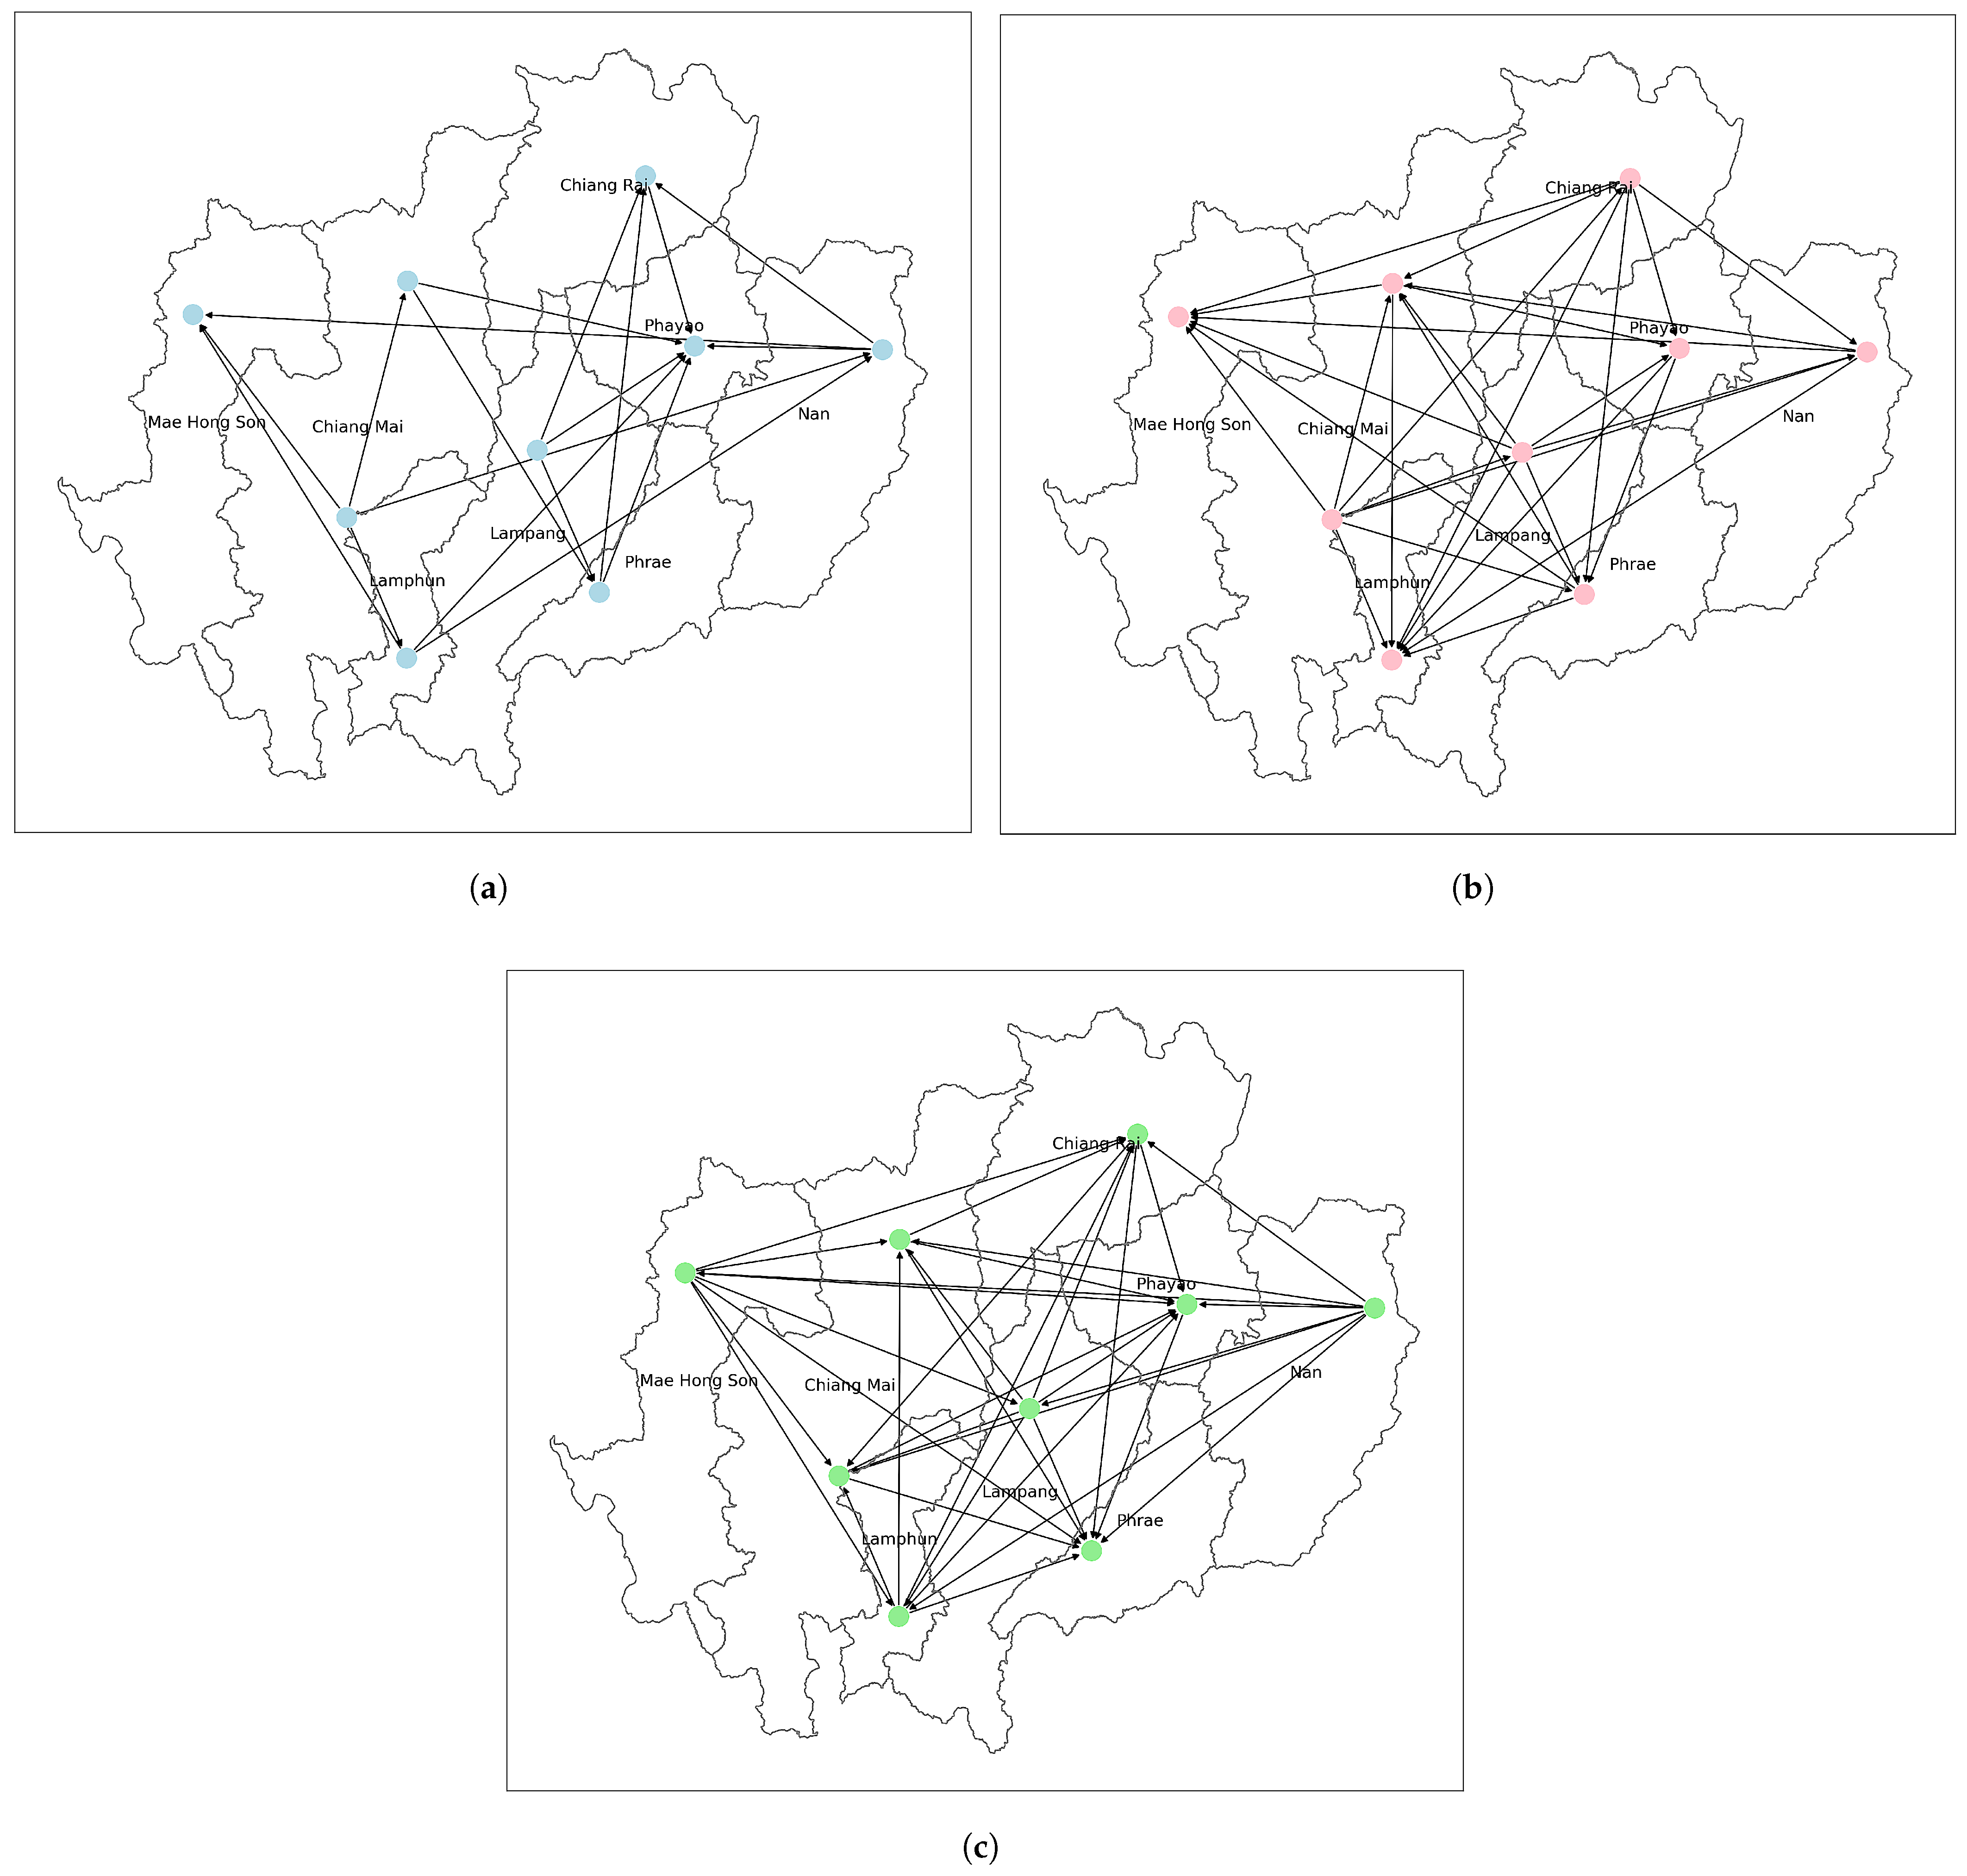
To investigate directional relationships in PM2.5 concentrations between monitoring stations, we applied the Granger causality test to all station pairs across three seasons. This method evaluated whether past values at one station could statistically predict future values at another, offering insights into temporal dynamics of pollution transport [15].
Based on model selection criteria, including the AIC, BIC, FPE, and HQIC, the optimal lag for all stations was determined to be 7 days. Granger causality links were validated using the F-test with a 95 % confidence interval within an autoregressive framework, ensuring that the identified directional connections reflect genuine predictive influences rather than chance effects. Granger causality relationships were then established using a significance threshold of p < 0.05 , and in bidirectional cases, the direction with the lower p-value was considered dominant. For instance, in the winter, PM2.5 levels in Phayao were significantly influenced by Chiang Rai ( p = 0.0001 ), although a reverse influence from Phayao to Chiang Rai was also present ( p = 0.0038 ). The stronger effect of Chiang Rai suggested it as the dominant causal source.
Seasonal Granger causality networks revealed distinct source–receptor dynamics. In the winter (Figure 8a), Chiang Mai emerged as a central source of PM2.5, influencing several neighboring provinces, while Phayao was mostly a receptor, consistent with typical winter meteorological conditions such as calm winds and temperature inversions, which favored pollutant accumulation and increased residential burning [4]. Phayao’s location downwind of other provinces, along with limited local emissions, made it particularly susceptible to transboundary pollution.
In the summer (Figure 8b), Chiang Mai and Lampang remained primary contributors, with Lamphun and Mae Hong Son identified as the most affected. This corresponded to the peak agricultural burning period (February to April), when widespread slash-and-burn practices were used to clear fields. The dry conditions, increased wind activity, and reduced rainfall promoted long-range transport of PM2.5 [7]. Lamphun, located southeast of Chiang Mai, was likely impacted by downwind flow within the same valley. Similarly, Mae Hong Son, surrounded by mountainous terrain, was particularly sensitive to incoming pollution, with limited pathways for dispersion.
During the rainy season (Figure 8c), although overall PM2.5 concentrations were generally lower due to frequent rainfall and atmospheric cleansing, Mae Hong Son and Lampang emerged as the main contributors to PM2.5 pollution in other provinces, especially Phrae. These relationships may have resulted from occasional dry spells within the rainy season, during which localized biomass burning or industrial emissions could still lead to short-term pollution episodes. In particular, Lampang’s industrial activity and persistent burning practices, combined with wind flows channeled by local topography, could have facilitated the transport of pollutants to lower-lying areas, such as Phrae. The surrounding hills in Phrae may also have trapped pollutants, contributing to accumulation when external emissions were present.
The Granger-based network analysis of PM2.5 concentrations across northern Thailand revealed dynamic seasonal patterns in pollution sources and affected areas. Chiang Mai consistently emerged as a major source throughout the year, likely due to its dense population, vehicular emissions, construction activity, and regional economic importance. In contrast, the provinces most affected by pollution varied seasonally, influenced by factors such as geographic vulnerability, prevailing wind patterns, burning activities, and weather conditions. For example, Mae Hong Son transitioned from being primarily affected in the summer to a contributing source in the rainy season, suggesting a complex interaction between local and regional influences.
These results highlighted the value of Granger causality in identifying not just correlation but directional influence over time. The findings emphasized the importance of seasonally adaptive, regionally coordinated air quality policies. Targeting dominant pollution sources such as Chiang Mai and Lampang, particularly during the dry season, may be essential for mitigating regional air pollution in northern Thailand.

3.4. Trophic Coherence and Network Stability

To investigate the hierarchical structure and seasonal stability of PM2.5 transmission in northern Thailand, we applied trophic coherence analysis to the Granger causality-based directed networks constructed for each season. In this framework, nodes with zero in-degree were identified as basal nodes and were assigned a trophic level of 1. The trophic levels of all the other nodes, calculated using Equation (6), and the hierarchical structures for the winter, summer, and rainy seasons are illustrated in Figure 9, respectively. This allowed us to identify source and receptor provinces within the network. To quantitatively assess the stability and directional consistency of these seasonal networks, we calculated the incoherence parameter q using Equation (7).
In the winter (Figure 9a), the network exhibited the lowest incoherence with a q-value of 0.58 , indicating the highest trophic coherence and a clearly stratified hierarchical structure. However, this more hierarchical arrangement may be less stable and more vulnerable to cascading effects, such as feedback loops that can amplify pollution propagation through the network [19,20]. Winter was also characterized by the largest number of basal nodes, implying that more provinces act as independent sources of PM2.5 pollution during this season. Chiang Mai 2 and Lampang were notable as source nodes, while Phayao attained the highest trophic level ( 3.17 ), highlighting its role as a major receptor of pollution from surrounding areas. These findings were consistent with typical winter atmospheric conditions, such as calm winds, temperature inversions, and increased local emissions, which trapped pollutants near the surface.
In the summer (Figure 9b), the trophic coherence was slightly lower ( q = 0.70 ), suggesting a more distributed network structure. Chiang Mai 2 again appeared as a consistent source, while Lamphun, Mae Hong Son, Phayao, Chiang Mai 1, and Phrae exhibited higher trophic levels, indicating they are primarily affected by emissions from other provinces. This aligned with the peak agricultural burning season, where wind-driven transport and dry conditions facilitated long-range PM2.5 dispersion [5,6]. The broader spatial connectivity of sources and receptors reflected a shift toward regionally distributed transport mechanisms, as also captured through cross-correlation and Granger causality in previous sections.
During the rainy season (Figure 9c), the network exhibited the lowest trophic coherence ( q = 0.73 ), suggesting greater structural stability but less hierarchy. In this period, Phrae showed the highest trophic level ( 3.7 ), acting as the most significant receptor, while Nan emerged as a primary source. Despite overall lower PM2.5 concentrations due to frequent rainfall, a well-documented rainfall cleansing mechanism [9], pollution could still accumulate during dry spells or be transported from surrounding areas. The lower coherence implied that pollution events were more isolated, possibly due to interrupted transport paths caused by weather variability and reduced long-range connectivity.
Overall, trophic coherence analysis revealed strong seasonal variation in PM2.5 transmission networks across northern Thailand. Chiang Mai 2 consistently acted as a basal node and primary source during the winter and summer, while provinces like Phayao and Phrae primarily served as receptors. Integrating this hierarchical perspective with correlation and causality analyses provided a comprehensive view of pollution flow structure and stability. These insights support seasonally adaptive air quality management, prioritizing dominant source regions and enhancing network resilience.

4. Conclusions

This study presents a seasonal network analysis of PM2.5 pollution in northern Thailand, integrating Delaunay triangulation, cross-correlation, Granger causality, and trophic coherence into an analytical framework. By combining these methods, we captured both the directional flow and hierarchical stability of PM2.5 transmission while ensuring realistic spatial connectivity through shape-aware Delaunay triangulation. Trophic coherence further allowed us to quantify the stability and ordering of pollution pathways, extending the capabilities of traditional correlation or causality analyses.
Our findings reveal clear seasonal shifts in PM2.5 dynamics. During the summer burning season, Chiang Mai (particularly Station 2) and Lampang emerged as dominant sources influencing PM2.5 levels in Lamphun and Mae Hong Son. In the rainy season, PM2.5 levels dropped significantly due to rainfall and atmospheric dispersion, though residual emissions from Lampang and Mae Hong Son occasionally affected receptor provinces such as Phrae during dry spells. In the winter, PM2.5 levels increased again due to temperature inversions and stagnant conditions, with Chiang Mai and Lampang remaining key sources while Phayao and Phrae acted as receptors.
These findings highlight the value of a network-based approach for uncovering spatiotemporal structures and causal relationships. While this case study focused on 2022–2023 data for northern Thailand, the framework is generalizable and can be applied to other regions and datasets. From a practical perspective, identifying key source and receptor regions can support targeted mitigation efforts and guide the optimal placement of monitoring stations. Future research could extend this framework to multi-year datasets and cross-regional studies. By combining methodological innovation with interpretable causal insights, this study contributes both to environmental science and to the development of advanced network-based analytical tools for complex spatiotemporal processes.

Author Contributions

Conceptualization, K.C., S.C., S.P. and A.K.; formal analysis, K.C., S.C., S.P. and A.K.; data curation, N.P.; writing—original draft preparation, K.C., S.C., S.P., N.S. and A.K.; writing—review and editing, N.S. and A.K.; visualization, K.C., S.C., S.P. and N.P. All authors have read and agreed to the published version of the manuscript.

Funding

This research was funded by the (1) Fundamental Fund 2025, Chiang Mai University, Chiang Mai, Thailand; (2) Thailand Science Research and Innovation (TSRI)(FRB680102/0162); (3) Chiang Mai University, Chiang Mai, Thailand; and (4) Centre of Excellence in Mathematics, MHESI, Bangkok, Thailand.

Data Availability Statement

JSON files for each monitoring station can be downloaded from https://www.cmuccdc.org/download (accessed on 19 March 2024).

Acknowledgments

The authors wish to thank Phapaengmuang Sukkasem for supporting spatial data management.

Conflicts of Interest

The authors declare no conflicts of interest.

References

  1. Helble, J.J.; DeVito, M.S.; Wu, C.Y.; Smith, F.L.; Marrack, D. Combustion aerosols: Factors governing their size and composition and implications to human health. J. Air Waste Manag. Assoc. 2000, 50, 1619–1622. [Google Scholar] [CrossRef]
  2. Pope, C.A., III; Ezzati, M.; Dockery, D.W. Fine-particulate air pollution and life expectancy in the United States. N. Engl. J. Med. 2009, 360, 376–386. [Google Scholar] [CrossRef]
  3. WHO. Particulate matter (PM2.5 and PM10), ozone, nitrogen dioxide, sulfur dioxide and carbon monoxide. In WHO Global Air Quality Guidelines; WHO: Geneva, Switzerland, 2021. [Google Scholar]
  4. Chansuebsri, S.; Kolar, P.; Kraisitnitikul, P.; Kantarawilawan, N.; Yabueng, W.; Wiriya, W.; Thepnuan, D.; Chantara, S. Chemical composition and origins of PM2.5 in Chiang Mai (Thailand) by integrated source apportionment and potential source areas. Atmos. Environ. 2024, 327, 120517. [Google Scholar] [CrossRef]
  5. Guan, D.; Su, X.; Zhang, Q.; Peters, G.P.; Liu, Z.; Lei, Y.; He, K. The socioeconomic drivers of China’s primary PM2.5 emissions. Environ. Res. Lett. 2014, 9, 024010. [Google Scholar] [CrossRef]
  6. Huang, R.-J.; Zhang, Y.; Bozzetti, C.; Ho, K.-F.; Cao, J.-J.; Han, Y.; Daellenbach, K.R.; Slowik, J.G.; Platt, S.M.; Canonaco, F.; et al. High secondary aerosol contribution to particulate pollution during haze events in China. Nature 2014, 514, 218–222. [Google Scholar] [CrossRef]
  7. Hoffmann, R.; Lee, C.G.; Ramasamy, B.; Yeung, M. FDI and pollution: A granger causality test using panel data. J. Int. Dev. 2005, 17, 311–317. [Google Scholar] [CrossRef]
  8. Hu, Q.L.; Yang, Z. The research on air pollution laws in Guanzhong urban agglomeration based on high frequency AQI data. DEStech Trans. Environ. Energy Earth Sci. 2017, 3. [Google Scholar] [CrossRef]
  9. Wang, J.; Zhang, M.; Bai, X.; Tan, H.; Li, S.; Liu, J.; Zhang, R.; Wolters, M.A.; Qin, X.; Zhang, M.; et al. Large-scale transport of PM2.5 in the lower troposphere during winter cold surges in China. Sci. Rep. 2017, 7, 13238. [Google Scholar] [CrossRef]
  10. Gao, H.; Chen, J.; Wang, B.; Tan, S.C.; Lee, C.M.; Yao, X.; Yan, H.; Shi, J. A study of air pollution of city clusters. Atmos. Environ. 2011, 45, 3069–3077. [Google Scholar] [CrossRef]
  11. Hatzopoulou, M.; Valois, M.F.; Levy, I.; Mihele, C.; Lu, G.; Bagg, S.; Minet, L.; Brook, J. Robustness of land-use regression models developed from mobile air pollutant measurements. Environ. Sci. Technol. 2017, 51, 3938–3947. [Google Scholar] [CrossRef]
  12. Bashan, N.F.; Li, W.; Wang, Q.R. Dynamics of PM2.5 and network activity during extreme pollution events. NPJ Clim. Atmos. Sci. 2024, 7, 171. [Google Scholar] [CrossRef]
  13. Lv, K.; Zheng, H.; Ge, L. Digital empowerment to reduce air pollution: The impact of urban network infrastructure construction on PM2.5. J. Asian Econ. 2025, 98, 101930. [Google Scholar] [CrossRef]
  14. Singh, S.; Suthar, G. Machine learning and deep learning approaches for PM2.5 prediction: A study on urban air quality in Jaipur, India. Earth Sci Inf. 2025, 18, 97. [Google Scholar] [CrossRef]
  15. Granger, C.W.J. Investigating causal relations by econometric models and cross-spectral methods. Econometrica 1969, 37, 424–438. [Google Scholar] [CrossRef]
  16. Runge, J.; Petoukhov, V.; Donges, J.F.; Hlinka, J.; Jajcay, N.; Vejmelka, M.; Hartman, D.; Marwan, N.; Palus, M.; Kurths, J. Identifying causal gateways and mediators in complex spatio-temporal systems. Nat. Commun. 2015, 6, 8502. [Google Scholar] [CrossRef] [PubMed]
  17. Runge, J.; Nowack, P.; Kretschmer, M.; Flaxman, S.; Sejdinovic, D. Detecting and quantifying causal associations in large nonlinear time series datasets. Sci. Adv. 2019, 5, eaau4996. [Google Scholar] [CrossRef]
  18. Ping, W.Y.; Abd Rais, Z.; Ramli, N.; Mohamed Noor, N.; Ul-Saufie, A.Z.; Hamid, H.A.; Mahmad, M.K.N. Granger causality analysis of air pollutants and meteorological parameters. Environ. Earth Sci. Proc. 2025, 33, 6. [Google Scholar] [CrossRef]
  19. Johnson, S.; Dominguez-Garcia, V.; Donetti, L.; Muñoz, M.A. Trophic coherence determines food-web stability. Proc. Natl. Acad. Sci. USA 2014, 111, 17923–17928. [Google Scholar] [CrossRef]
  20. Johnson, S.; Jones, N.S. Looplessness in networks is linked to trophic coherence. Proc. Natl. Acad. Sci. USA 2017, 114, 5618–5623. [Google Scholar] [CrossRef]
  21. Boers, N.; Bookhagen, B.; Marwan, N.; Kurths, J.; Marengo, J. Complex networks identify spatial patterns of extreme rainfall events of the South American Monsoon System. Geophys. Res. Lett. 2013, 40, 4386–4392. [Google Scholar] [CrossRef]
  22. Boers, N.; Goswami, B.; Rheinwalt, A.; Bookhagen, B.; Hoskins, B.; Kurths, J. Complex networks reveal global pattern of extreme-rainfall teleconnections. Nature 2019, 566, 373–377. [Google Scholar] [CrossRef]
  23. Liu, J.; Li, W.; Wu, J.; Liu, Y. Visualizing the intercity correlation of PM2.5 time series in the Beijing-Tianjin-Hebei region using ground-based air quality monitoring data. PLoS ONE 2018, 13, e0192614. [Google Scholar] [CrossRef]
  24. Zhang, Y.; Chen, D.; Fan, J.; Havlin, S.; Chen, X. Correlation and scaling behaviors of fine particulate matter (PM2.5) concentration in China. Europhys. Lett. 2018, 122, 58003. [Google Scholar] [CrossRef]
  25. Zhang, W.; Guan, Z.; Li, J.; Su, Z.; Deng, W.; Li, W. Chinese cities’ air quality pattern and correlation. J. Stat. Mech. 2020, 4, 043403. [Google Scholar] [CrossRef]
  26. Du, R.; Li, J.; Dong, G.; Tian, L.; Qing, T.; Fang, G.; Dong, Y. Percolation analysis of urban air quality: A case in China. Phys. A Stat. Mech. Its Appl. 2020, 541, 123312. [Google Scholar] [CrossRef]
  27. Liu, L.; Li, H.; Li, W.W.; Sui, Q.L.; Zhu, Y.H. Dynamic complex network analysis of PM2.5 in Henan province of China. Appl. Ecol. Environ. Res. 2022, 20, 3033–3056. [Google Scholar] [CrossRef]
  28. Steinhaeuser, K.; Chawla, N.V.; Ganguly, A.R. An exploration of climate data using complex networks. ACM SIGKDD Explor. Newslett. 2010, 12, 25–32. [Google Scholar] [CrossRef]
  29. Fan, J.; Meng, J.; Ashkenazy, Y.; Havlin, S.; Schellnhuber, H.J. Network analysis reveals strongly localized impacts of El Niño. Proc. Natl. Acad. Sci. USA 2017, 114, 7543–7548. [Google Scholar] [CrossRef]
  30. Meng, J.; Fan, J.; Ashkenazy, Y.; Havlin, S. Percolation framework to describe El Niño conditions. Chaos 2017, 27, 035807. [Google Scholar] [CrossRef]
  31. Yamasaki, K.; Gozolchiani, A.; Havlin, S. Climate networks around the globe are significantly affected by El Niño. Phys. Rev. Lett. 2008, 100, 228501. [Google Scholar] [CrossRef]
  32. Ludescher, J.; Gozolchiani, A.; Bogachev, M.I.; Bunde, A.; Havlin, S.; Schellnhuber, H.J. Improved El Niño forecasting by cooperativity detection. Proc. Natl. Acad. Sci. USA 2013, 110, 11742–11745. [Google Scholar] [CrossRef]
  33. Ye, Y.; Cao, Y.; Dong, Y.; Yan, H. A graph neural network and Transformer-based model for PM2.5 prediction through spatiotemporal correlation. Environ. Model. Softw. 2025, 191, 106501. [Google Scholar] [CrossRef]
  34. Zeng, Q.; Wang, L.; Zhu, S.; Gao, Y.; Qiu, X.; Chen, L. Long-term PM2.5 concentrations forecasting using CEEMDAN and deep Transformer neural network. Atmos. Pollut. Res. 2023, 14, 101839. [Google Scholar] [CrossRef]
  35. Okabe, A.; Boots, B.; Sugihara, K.; Chiu, S.N. Spatial Tessellations: Concepts and Applications of Voronoi Diagrams; Wiley: Chichester, UK, 2000. [Google Scholar]
  36. Chaudhuri, D.; Samal, A. A simple method for fitting of bounding rectangle to closed regions. Pattern Recognit. 2007, 40, 1981–1989. [Google Scholar] [CrossRef]
  37. Okabe, A.; Sugihara, K. Spatial Analysis Along Networks: Statistical and Computational Methods; Wiley: Chichester, UK, 2012. [Google Scholar]
  38. Pardthaisong, L.; Sin-ampol, P.; Suwanprasit, C.; Charoenpanyanet, A. Haze pollution in Chaing Mai, Thailand: A road to resilience. Procedia Eng. 2018, 212, 85–92. [Google Scholar] [CrossRef]
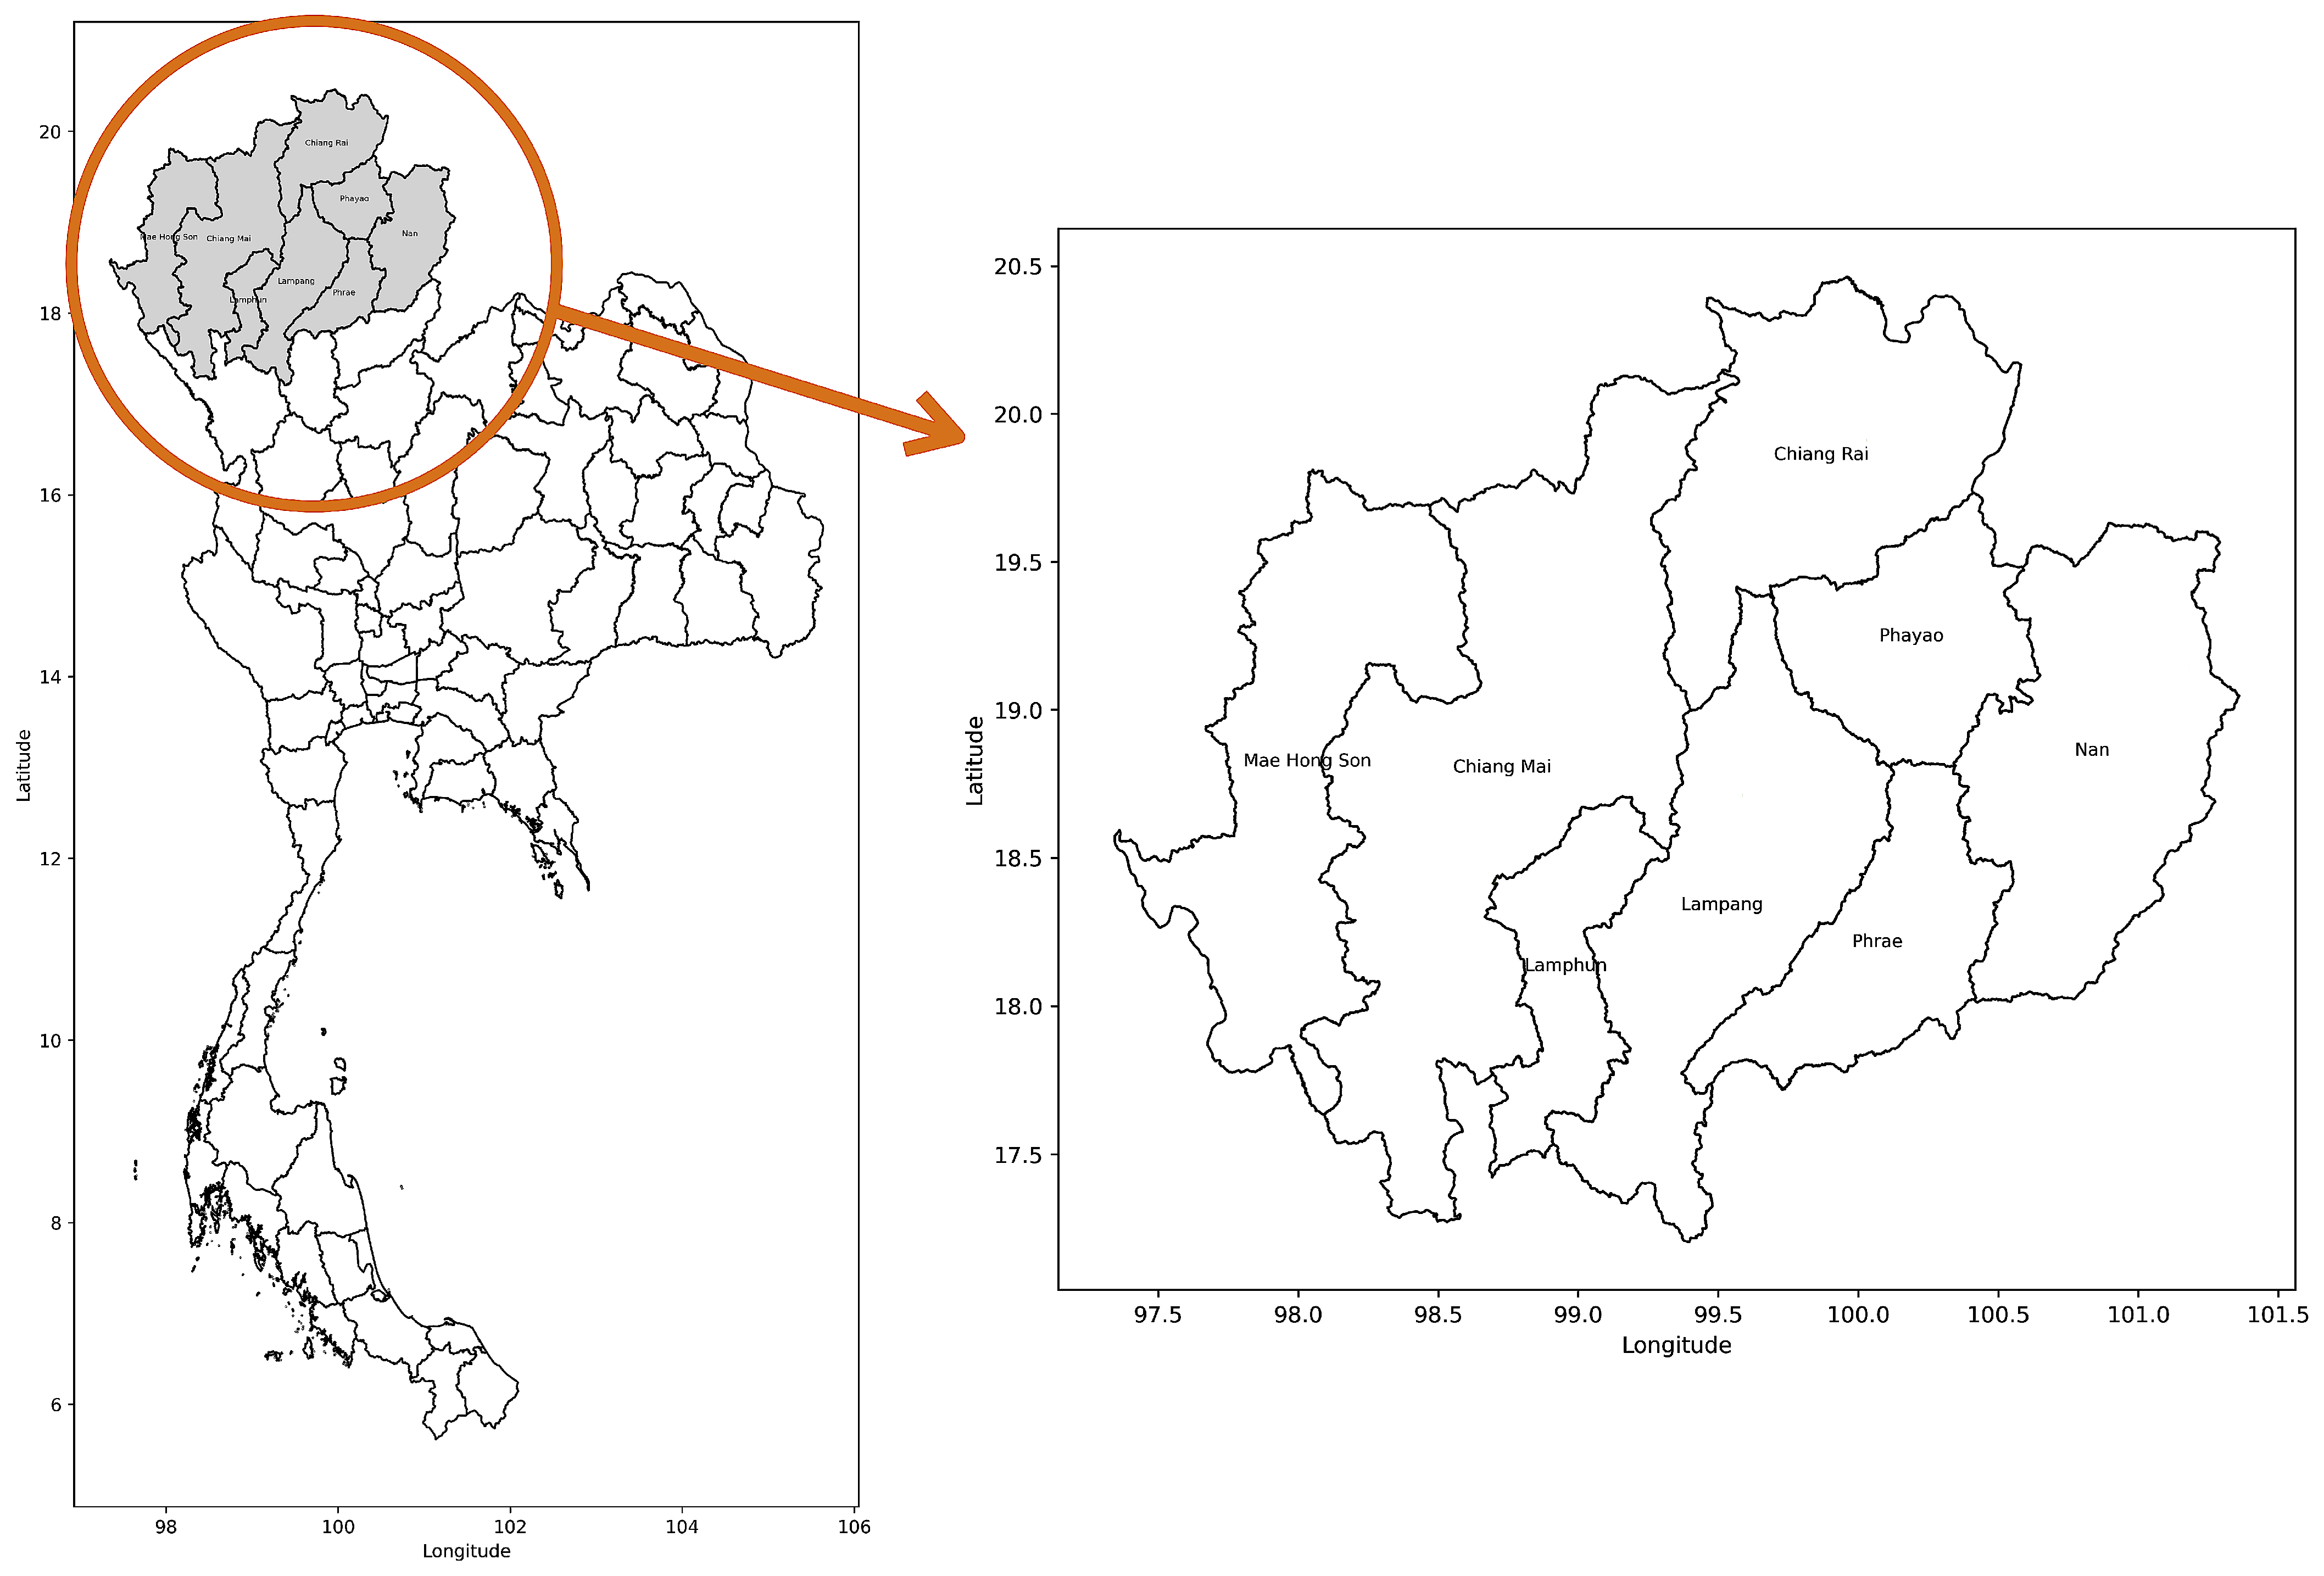
Figure 1. Map of 8 provinces in upper northern Thailand.
Mathematics 13 02468 g001
Figure 2. Histograms showing the distribution of (a) valid data and (b) missing data across all 677 monitoring stations in upper northern Thailand.
Mathematics 13 02468 g002
Figure 3. PM2.5 monitoring stations in upper northern Thailand visualized on a map; valid stations according to the criterion are shown in red, and all stations are shown in blue.
Mathematics 13 02468 g003
Figure 4. Delaunay triangulation of the 48 stations with long edges removed.
Mathematics 13 02468 g004
Figure 5. The 9 selected of each province based on roundness criteria.
Mathematics 13 02468 g005
Figure 6. Daily average PM2.5 concentrations from January 2022 to December 2023 across provinces in northern Thailand.
Mathematics 13 02468 g006
Figure 7. PM2.5 correlation networks based on cross-correlation analysis for (a) winter, (b) summer, and (c) rainy season.
Mathematics 13 02468 g007
Figure 8. Granger-based PM2.5 networks in northern Thailand for (a) winter, (b) summer, and (c) rainy season.
Mathematics 13 02468 g008
Figure 9. Hierarchical structure of PM2.5 Granger-based networks in northern Thailand for (a) winter, (b) summer, and (c) rainy season.
Mathematics 13 02468 g009
Table 1. Comparison of the number of monitoring stations in each province before and after applying Delaunay triangulation.
ProvincesOut of 48 StationsOut of 21 Stations
Chiang Mai267
Chiang Rai53
Lampang64
Lamphun31
Mae Hong Son42
Nan11
Phayao22
Phrae11
Disclaimer/Publisher’s Note: The statements, opinions and data contained in all publications are solely those of the individual author(s) and contributor(s) and not of MDPI and/or the editor(s). MDPI and/or the editor(s) disclaim responsibility for any injury to people or property resulting from any ideas, methods, instructions or products referred to in the content.