Abstract
To investigate the oscillation modes of iced transmission lines, this study introduces a forcing term into the galloping equation and applies two discretization approaches: Discrete Method I (DMI), which directly transforms the partial differential equation into an ordinary differential form, and Discrete Method II (DMII), which first averages dynamic tension along the span. The finite element method is employed to validate the analytical solutions. Using a multiscale approach, amplitude-frequency responses under primary, harmonic, and internal resonance are derived. Results show that DMII yields larger galloping amplitudes and trajectories than DMI, with lower resonant frequencies and weaker geometric nonlinearities. In harmonic resonance, superharmonic and subharmonic modes (notably 1/2) are more easily excited. Under 2:1:2 internal resonance, amplitude differences in the vertical (z) direction are more sensitive to the discretization method, whereas the 1:1:1 case shows minimal variation across directions. These findings suggest that the choice of discretization significantly influences galloping behavior, with DMII offering a more conservative prediction.
Keywords:
primary resonance; harmonic resonance; internal resonance; finite element analysis; multiscale method MSC:
70K10; 70G65
1. Introduction
Transmission lines are prone to uneven ice accretion under complex weather conditions such as typhoons and freezing rain. The oscillation of the transmission lines, induced by wind excitation after eccentric ice accretion, results in low-frequency, large-amplitude self-excited vibrations, long-time oscillation can lead to wires breaking, hardware damaged, and even tower-line damage [1,2,3,4]. In January 2023, Hunan Province, China was affected by a cold wave and some transmission lines were covered with ice, as shown in Figure 1a. In December 2023, due to severe freezing rain and snow disasters in Shanxi Province, China, all four towers collapsed, as shown in Figure 1b. In February 2024, in Hubei Province, China, freezing weather caused the base tower to be covered with ice up to 20 cm thick, resulting in damage to the transmission lines, as shown in Figure 1c,d. The study of transmission line galloping is extremely challenging and of significant importance for engineering applications due to the interaction of various contributing factors.
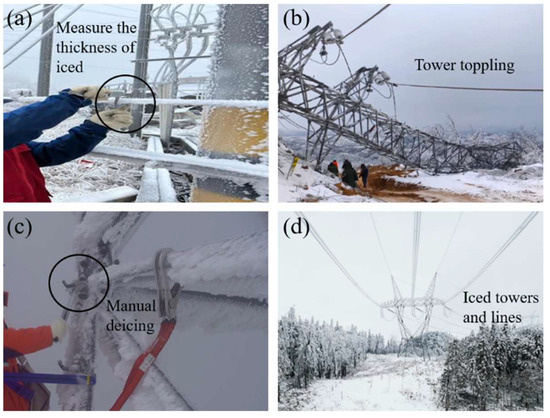
Figure 1.
Disaster and ice of transmission towers and lines. (a) Measuring the thickness of ice (in Hunan Province), (b) tower toppling (in Shanxi Province), (c) manual deicing (in Hubei Province), and (d) iced towers and lines (in Hubei Province).
The study of the mechanics of vibration can be traced back to the earliest works on vertical vibration theory by Den Hartog [5] and torsional excitation vibration theory by Nigol [6,7]. These two mechanisms have been widely employed in subsequent theoretical research and simulation analyses. Flexible structures such as transmission lines and suspension cables, which only withstand tension and not bending moments or compression, often exhibit typical nonlinear behaviors when subjected to self-weight and external excitations [8,9]. For simulation analysis, Cai et al. [10,11] studied the mechanical characteristics of transmission lines under different turbulence intensities, wind speeds, and spans through finite element analysis and wind tunnel experiments. Chen et al. [12] established a finite element model for a crescent-shaped iced transmission line to investigate its dynamics under steady, unsteady, and random wind.
For theoretical research, Benedettini [13,14] and Rega [15] utilized the high-order multiscale method to investigate the amplitude-frequency response of cables under harmonic excitations, conducting a parametric study of dynamic phenomena through numerical solutions. Kamel [16] applied the multiscale method to analyze the primary resonance and internal resonance responses of nonlinear systems, studying the influence of different parameters on the system. Zhao et al. [17] employed the multiscale method and homotopy analysis method to study the primary resonance of suspension cables under external excitations, comparing and analyzing the differences in displacement fields and axial tensions. Discrete methods in theoretical solution involve approximating physical quantities in continuous medium mechanics using finite parameters, making the numerical calculation results converge, stable, and satisfy certain accuracy requirements. Therefore, the discrete method is widely used.
Effective discrete methods include finite difference methods, finite element methods, and weighted residual methods. Building upon traditional discrete methods, further developments encompass discrete differential forms of discrete variational derivative methods [18], discrete projection methods [19], and discrete dynamic convexification algorithms [20]. The two discrete methods discussed in this paper are primarily through the Galerkin method using the weighted residual method for discretizing the galloping equation in integral form. In Discrete Method I (DMI), scholars directly apply the Galerkin method to discretely solve the partial differential galloping equation, as seen in the approach taken by Perkins [21], Wang [22], and others. Discrete Method II (DMII) involves treating dynamic tension along the length range equivalently and then discretizing the resulting nonlinear ordinary differential equation through the Galerkin method, as demonstrated by Zhou [23], Zhao [24], and others. According to these two methods, Min and Liu et al. [25,26], utilizing a multiscale and averaging approach, investigated the impact of the two computational methods on the vibration characteristics of a 1:1 cable-stayed bridge resonance model and the dynamic behavior of iced transmission lines.
When the natural frequency of a transmission line approaches the excitation frequency, and the frequencies in the y and z directions are proportional, resonance can occur, disrupting normal operation and potentially causing structural damage. In studies of primary, harmonic, and internal resonances in flexible structures—such as iced transmission lines and inclined cables—researchers have typically analyzed the effects using either Discrete Method I (DMI) or Discrete Method II (DMII) independently. However, the comparative influence of these two discretization approaches on resonance characteristics remains insufficiently explored.
To address this gap, this study investigates the distinct resonance behaviors of iced transmission lines under both discrete methods. Harmonic loads are applied in the y-direction, and nonlinear galloping equations are derived for each method. The finite element method (FEM) is employed to validate the discrete formulations. Displacement responses and amplitude-frequency characteristics under varying excitation amplitudes and detuning parameters are then obtained using MATLAB R2023a in conjunction with a multiscale approach. These results provide a basis for comparing the galloping characteristics of iced transmission lines under primary, harmonic, and internal resonance conditions across the two discretization methods. The detailed technical roadmap is illustrated in Figure 2.
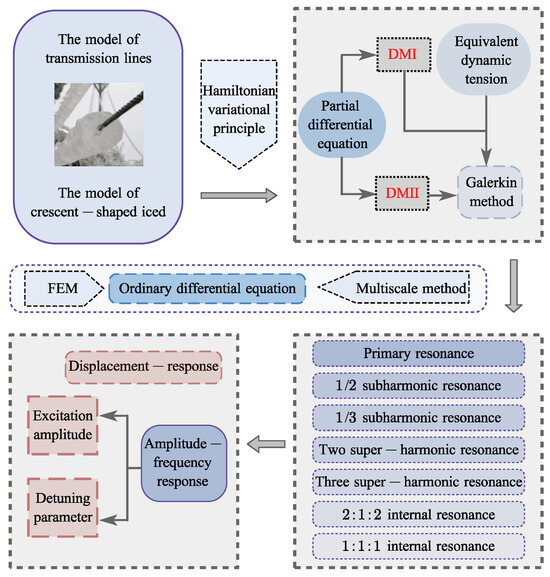
Figure 2.
Research methodology flowchart.
2. Galloping Equation
2.1. Mathematical Model
To facilitate the derivation of the galloping equation for analyzing the dynamic behavior of iced transmission lines, a simplified model is considered in which the transmission line lies in a horizontal plane with both ends fixed. The direction along the line connecting the two fixed ends is defined as the x-direction, the vertical downward direction as the y-direction, and the direction perpendicular to the x–y plane as the z-direction. Let L denote the span of the transmission line, and u, v, and w represent the dynamic displacements in the x, y, and z directions, respectively. The simplified mathematical model of the transmission line is illustrated in Figure 3.

Figure 3.
Mathematical model of transmission lines.
A uniform harmonic load Fy is applied in the vertical (y) direction of the transmission line, expressed as Fy = f(x) cos (Ωt), where f(x) denotes the spatial distribution of the excitation amplitude along the span, and Ω represents the excitation frequency. Physically, this forcing term represents the periodic aerodynamic excitation induced by wind action, serving as the primary driver of the galloping response. The term reflects not only the interaction between structural motion and external wind disturbances, but also captures the unsteady characteristics arising from wind-structure coupling.
To enhance the physical realism of the model, the transmission line is idealized as having two configurations: a static configuration induced solely by gravity, and a dynamic configuration governed by both gravity and external excitation. As illustrated in Figure 3, ds and dsl represent the infinitesimal arc lengths of the line under the two respective configurations.
Given the relatively small deformation in the x-direction, the aerodynamic forces acting in the y- and z-directions are the primary concern. The z-direction is aligned with the actual wind velocity. Due to the conductor’s motion, the magnitude and direction of the relative wind speed () Ur vary over time, leading to dynamic changes in the angle of attack. This variation directly influences the instantaneous lift FL and drag FD forces experienced by the iced conductor.
To account for the influence of ice accretion, a crescent-shaped ice profile is assumed for the conductor cross-section (Figure 4). This introduces significant geometric asymmetry, thereby altering the aerodynamic behavior under different angles of attack. In this study, the lift coefficient CL and drag coefficient CD are established based on theoretical aerodynamic principles and fitted using third-order polynomial approximations derived from literature-reported [10] aerodynamic characteristics of typical iced profiles. These aerodynamic coefficients are then coupled with the conductor’s motion to yield nonlinear aerodynamic forces in the y- and z-directions. Ultimately, these force components are introduced as forcing terms into the governing equations of motion, thereby embedding the effects of ice accretion into the galloping model and allowing for a more accurate assessment of the system’s dynamic stability and response behavior.
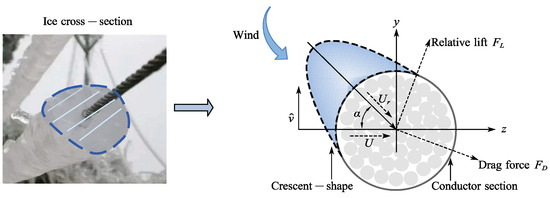
Figure 4.
Cross-section of an iced transmission line.
As shown in Figure 4, α denotes the instantaneous angle of attack, FL is the relative lift force, and FD is the drag force. Neglecting aerodynamic forces and rotational effects in the x-direction, the aerodynamic loads in the y- and z-directions can be derived based on aerodynamic theory and cubic curve fitting.
where ρ is the air density, D is the windward diameter, and αi and βi are aerodynamic coefficients obtained from wind tunnel experiments.
By applying Hamilton’s variational principle, the governing equations can be derived.
where T is the kinetic energy of the system, V is the potential energy, and W represents the virtual work carried out by non-conservative forces.
Given the relatively weak oscillations of iced transmission lines in the x-direction, the axial strain at the point of configuration change is derived accordingly.
To investigate the influence of different discretization methods on primary, harmonic, and internal resonances in the y-direction, a harmonic load is applied along this direction. The analysis accounts for gravity, viscous damping, aerodynamic forces, and external loads acting on the transmission lines. Based on Equations (1)–(3), the governing expression can be obtained.
where H is the horizontal tensile force, E is Young’s modulus, A is the cross-sectional area of the transmission line, I is the second moment of area, m is the mass per unit length, and cy and cz are the viscous damping coefficients in the y- and z-directions, respectively.
In the modeling process, the transmission line is assumed to be at rest before the application of external loads, resulting in initial conditions of zero displacement and zero velocity. Both ends of the line are fixed, and thus the boundary conditions are defined as zero displacement at both ends.
2.2. Discrete Method I
Discrete Method I directly transforms the partial differential galloping equations (Equations (4) and (5)) into ordinary differential equations, following the approach adopted by Perkins [21], Wang [22], and others.
The dynamic displacements in the y- and z-directions are expressed as:
where and are the mode shape functions, and and are the corresponding time-dependent functions. Focusing on the galloping characteristics of the first-order mode of the transmission lines, the mode shape functions are taken as [27,28,29].
By substituting Equation (7) into Equations (4) and (5), the partial differential galloping equations are transformed. The resulting ordinary differential equations for the y- and z-directional galloping under Discrete Method I are given as follows:
The terms and represent the linear and nonlinear coefficients obtained using the DMI method. By applying the Runge–Kutta method to the above equation, their explicit expressions can be derived.
2.3. Discrete Method II
Discrete Method II involves an equivalent treatment of dynamic tensile strain, followed by the application of the Galerkin method to convert the processed partial differential galloping equation into an ordinary differential form, as demonstrated by Zhou [23], Zhao [24], and others.
Based on Equation (3), the average strain along the span length is initially calculated as follows:
by substituting Equation (12) into Equations (4) and (5), the following is obtained:
Similarly, the ordinary differential galloping equations in the y- and z-directions of the transmission lines under DMII are derived as follows:
The terms and represent the linear and nonlinear coefficients obtained using the DMII method. By applying the Runge–Kutta method to the above equation, their explicit expressions can be derived.
3. The Finite Element Method
Under external influences such as ice accretion and wind loads, transmission lines are prone to vibration. However, obtaining relevant experimental data is often challenging, which has prompted researchers to take advantage of the finite element method (FEM). FEM enables the simulation of complex structural responses under various boundary conditions and loading scenarios, and has thus been widely applied in the study of transmission line vibration characteristics to validate theoretical predictions.
To evaluate the applicability of the two discretization methods, a finite element model of a single-span transmission line was established in ABAQUS. Beam elements were employed, with a total of 100 mesh divisions uniformly distributed along the span direction. The element length was approximately 0.01 L, where L is the total span length of the conductor. This mesh density provides sufficient spatial resolution to ensure the accuracy of the modal analysis. Other model parameters are listed in Table 1 [30]. Moreover, the numerical solutions of Equations (8), (9), (15), and (16) were also based on the parameter settings in Table 1, ensuring consistency between the finite element simulation and theoretical analysis. The simulation considered only vertical motion (y-direction), and fixed boundary conditions were applied at both ends of the conductor.

Table 1.
Physical parameters of the transmission lines.
In Step 1, gravity loading was applied using a nonlinear static analysis step. An automatic time incrementation strategy was adopted, with an initial increment of 0.01 s and a maximum increment capped at 0.1 s, to ensure numerical stability during the solution process. In Step 2, a linear modal analysis was performed to extract the first ten natural frequencies and the corresponding mode shapes in the y-direction. The solution convergence in both analysis steps satisfied the default energy residual tolerance criteria of ABAQUS, with maximum residuals maintained below 1 × 10⁻⁴. The first ten mode shapes in the y-direction are presented in Figure 5.
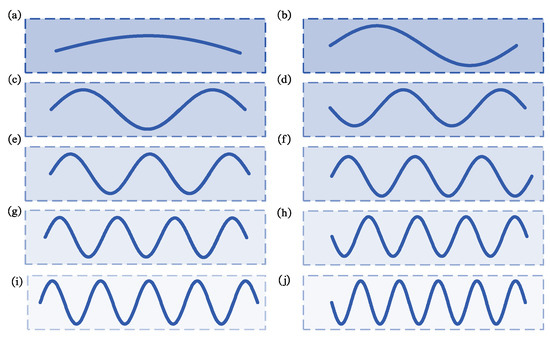
Figure 5.
Mode of transmission lines in the y-direction. (a) 1st order, (b) 2nd order, (c) 3rd order, (d) 4th order, (e) 5th order, (f) 6th order, (g) 7th order, (h) 8th order, (i) 9th order, (j) 10th order.
Using the shared physical parameters of the transmission lines, the natural frequencies were computed by two discrete methods in MATLAB and compared with those obtained via finite element modeling (FEM), as presented in Table 2.

Table 2.
Comparison of natural frequencies under different methods in the y-direction.
To quantitatively evaluate the deviation between the discrete methods and the FEM results, the relative error of the natural frequencies e was calculated for each mode using the following expression:
where denotes the natural frequency obtained by either the DMI or DMII method for the i-th mode, and represents the corresponding frequency computed using the finite element model. The average relative error across all ten modes was then used to assess the overall accuracy of each method.
As shown in Table 3, the mean relative error of the DMI method is 0.1457%, while that of the DMII method is only 0.0009%. These results indicate that both methods yield natural frequencies that are generally consistent with the reference values. However, DMII demonstrates significantly higher accuracy in the estimation of modal frequencies.

Table 3.
Error analysis of natural frequencies in the y-direction under different methods.
4. Multiscale Method
Owing to the demonstrated effectiveness and correctness of applying the multiscale method to nonlinear galloping problems, second-order expansions of the galloping equations in the y and z directions for iced transmission lines are carried out using this method. By introducing a small non-dimensional bookkeeping parameter ε (ε ≪ 1), and referring to Equations (8), (9), (15), and (16), it is evident that the two discrete methods differ only in their treatment of dynamic tension. Consequently, the galloping equations derived under both methods exhibit an identical form, with differences limited to the expressions of the linear and nonlinear coefficients. Through a unified transformation, the galloping equations for iced transmission lines under the two discrete approaches can be expressed in a consistent form.
Here, q2 and q3 denote the vibrational displacements in the y- and z-directions of the iced transmission lines, respectively, while ω2 and ω3 represent the corresponding natural frequencies. The terms f2 and f3 are the coupling terms in the y- and z-directions, and fnn denotes the excitation amplitude. To compare the amplitude-frequency responses across different resonant conditions, a detuning parameter σ is introduced to quantitatively characterize the deviation between the excitation frequency and the natural frequency.
To derive an approximate solution for Equation (20), we assume the solution takes the form:
where T0 = t and T1 = εt. Representing the excitation term on a time scale T0 and T1 can be obtained:
By substituting Equation (22) into Equation (20) and expressing both sides in terms of powers of ε, the coefficients of ε0 and ε1 are equated accordingly.
where , and are the linear and nonlinear coefficients after transformation by the multiscale method. Due to not considering the amplitude-frequency response in the z-direction, only the specific expression for is given as follows:
The general solution of Equation (24) can be represented as:
where , A is an undetermined complex-valued function, and A* denotes its complex conjugate.
By substituting Equation (27) into Equation (25), applying Euler’s formula (exp(ix) = cos x + isin x) and eliminating the secular terms, the analytical expression for the amplitude-frequency response in the y-direction under primary resonance can be derived.
where a is the response amplitude.
When the natural frequencies in the y and z directions approach a certain ratio, the system may exhibit coupled internal resonance. Accordingly, two types of internal resonance can be identified in this dynamic system: ω2 ≈ ω3 and ω2 ≈ 2ω3.
Harmonic resonance arises when the excitation frequency introduced by the external forcing term is approximately equal to an integer or fractional multiple of the system’s natural frequency. By applying the second-order multiscale expansion method to eliminate the ε term preceding the external force in Equation (20), the governing equation in the y-direction can be reformulated as:
The resonance conditions of the system can similarly be deduced, including the 1/2 and 1/3 subharmonic resonances, as well as the second and third superharmonic resonances. By setting Ω = 2ω2 + εσ, Ω = 3ω2 + εσ, 2Ω = ω2 + εσ, and 3Ω = ω2 + εσ, the analytical expressions for the amplitude-frequency responses corresponding to these resonance cases can be obtained.
5. Different Resonance Analysis
5.1. The Primary Resonance
Based on the previously derived galloping equations for transmission lines using different discretization methods, this study investigates the influence of these methods on the galloping characteristics under primary resonance conditions. The physical properties of the transmission lines and the aerodynamic coefficients of the iced conductors are listed in Table 1 and Table 4 [30], respectively. The aerodynamic coefficients in Table 4 correspond to an initial angle of attack of α0 = 10° and a wind speed of U = 4.1 m/s. To ensure consistency throughout the analysis, these operating parameters were held constant during all computations.

Table 4.
Aerodynamic coefficients.
These parameters were substituted into the nonlinear governing Equations (8), (9), (15), and (16), and numerically solved using the classical fourth-order Runge–Kutta integration method implemented in MATLAB. To balance numerical stability and temporal resolution, the time step was set to Δt = 0.001 s, with a total integration duration of 60 s, ensuring accurate capture of the system’s steady-state response under primary resonance conditions.
During the simulation, the transverse (y-direction) and in-plane (z-direction) displacements of the conductor were recorded to generate displacement-response curves. These curves were used to analyze the effects of the two discretization methods on vibration amplitude, frequency shift, and trajectory stability under primary resonance conditions.
The ratio of the excitation frequency and the natural frequency in the forced term is defined as 1:1. According to the Equations (8) and (15), the expressions for the natural frequencies of the DMI and II are denoted as and , respectively. Using MATLAB, the excitation frequencies for DMI and DMII are determined to be 0.6022 Hz and 0.5559 Hz, respectively. Due to the influence of the forcing term, both the period and amplitude of the response gradually stabilize, as shown in Figure 6a,b. Under these conditions, the response trajectories in the y- and z-directions are plotted, as depicted in Figure 6c. It is observed that both approaches exhibit a slight difference in the time required to reach steady state, and the resulting galloping trajectories form closed elliptical loops. Notably, the amplitude and trajectory corresponding to DMII. In addition, the excitation frequency of DMII is lower than that of DMI. These results indicate that the galloping characteristics of primary resonance oscillations in iced transmission lines can be significantly influenced by the choice of discrete method.

Figure 6.
Displacement-response for primary resonance; (a) y-direction displacement-response, (b) z-direction displacement-response, (c) trajectory.
According to Equation (28), the detuning parameter σ and excitation amplitude fnn are defined, and their effects on the response amplitude a are illustrated in Figure 7 and Figure 8, respectively. In Figure 7, solid lines correspond to DMI, while dashed lines represent DMII. The amplitude-frequency responses for both methods exhibit pronounced geometric nonlinearity under the influence of dynamic tension. As the excitation amplitude increases, the resonance amplitude also increases and shifts in the positive frequency direction. By selecting representative curves and marking all operating conditions with solid lines, it is observed that the galloping amplitude in DMII exceeds that of DMI, while the degree of geometric nonlinearity in DMII is weaker.
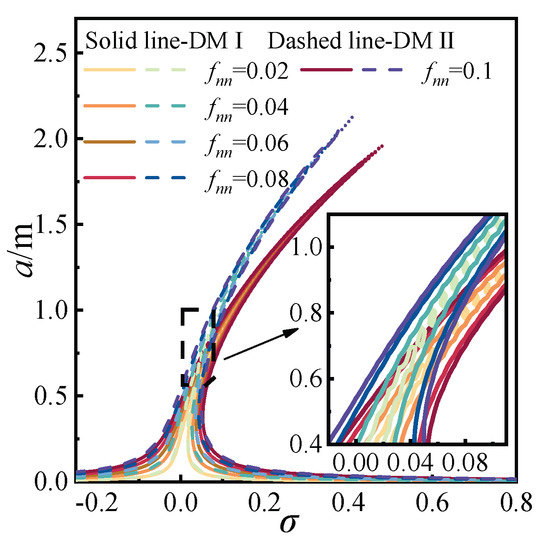
Figure 7.
Amplitude-frequency response for primary resonance.
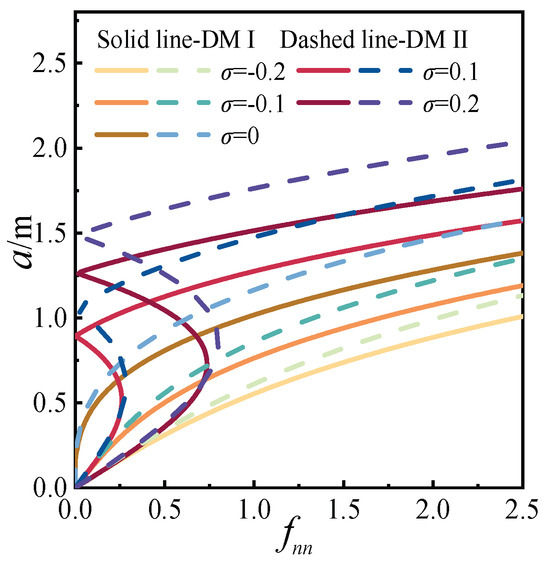
Figure 8.
Response affected by detuning parameter for primary resonance.
As shown in Figure 8, an increase in the detuning parameter leads to both a rise in galloping amplitude and an accelerated rate of amplitude growth. When the detuning parameter σ ≤ 0, the system exhibits a single-valued response. However, for σ > 0, the response transitions from single-valued to multi-valued, indicating the emergence of unstable nonlinear behavior. Under identical detuning conditions, both the galloping amplitude and its growth rate are greater in DMII than in DMI.
5.2. The Harmonic Resonance
5.2.1. The 1/2 Subharmonic Resonance
To investigate the influence of different discrete methods on the 1/2-subharmonic resonance of iced transmission lines, the ratio of the excitation frequency in the forcing term to the natural frequency is set to 2:1. Two discrete approaches are employed to obtain the displacement responses in the y- and z-directions, as well as the corresponding galloping trajectories, as illustrated in Figure 9. Due to the effect of the forcing term, both the vibration period and amplitude gradually stabilize, as shown in Figure 9a,b. Based on the stable-state data in the y- and z-directions, the galloping trajectory is plotted in Figure 9c.

Figure 9.
Displacement-response for 1/2 subharmonic; (a) y-direction displacement-response, (b) z-direction displacement-response, (c) trajectory.
It is observed that the time required for the two methods to reach steady state is nearly identical, and both exhibit closed elliptical galloping trajectories. However, DMII yields larger amplitudes and a broader trajectory compared to DMI. Furthermore, the excitation frequency associated with DMII is lower than that of DMI. These findings indicate that the galloping characteristics of 1/2-subharmonic resonance in iced transmission lines are affected by the choice of discrete method.
Based on Equation (30), the detuning parameter σ and excitation amplitude fnn are defined. The effects of these two parameters on the response amplitude a for both discrete methods are presented in Figure 10 and Figure 11. In Figure 10, solid lines correspond to DMI and dashed lines to DMII. Both amplitude-frequency responses exhibit pronounced geometric nonlinearity under the influence of dynamic tension. As the excitation amplitude increases, the resonance amplitude becomes larger and shifts toward the positive detuning direction. A comparison of selected curves, all plotted as solid lines for consistency, reveals that the geometric nonlinearity of DMII is weaker than that of DMI. Additionally, as the excitation amplitude increases, the response curves diverge from σ = 0, with DMI displaying a more rapid spreading rate.
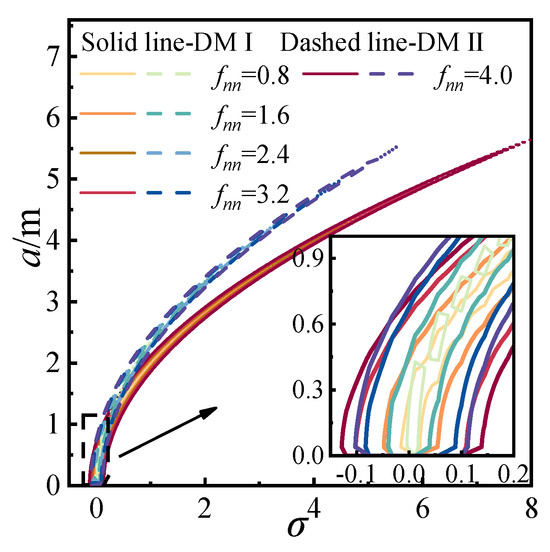
Figure 10.
Amplitude-frequency response for 1/2 subharmonic.
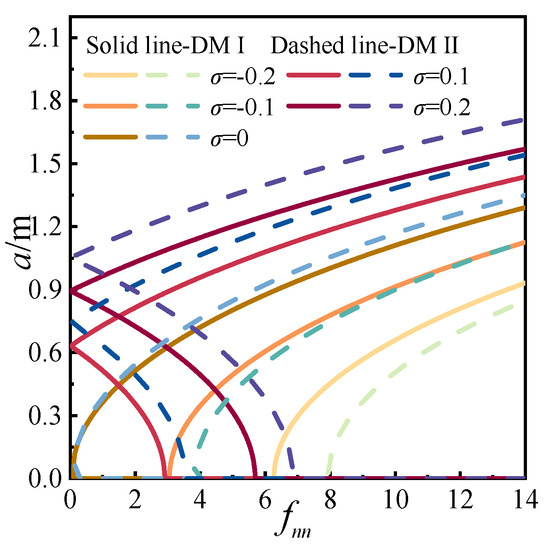
Figure 11.
Response affected by detuning parameter for 1/2 subharmonic.
Figure 11 shows that with increasing detuning parameter σ, the galloping amplitude grows, but the rate of amplitude increase gradually decreases. When σ ≤ 0, the response remains single-valued and shifts leftward as σ increases. For σ > 0, the system transitions from a single-valued to a multi-valued response, with the curves shifting rightward. Under identical detuning conditions, DMII produces both higher galloping amplitudes and faster amplitude growth compared to DMI.
5.2.2. The 1/3 Subharmonic Resonance
To investigate the influence of different discrete methods on the 1/3-subharmonic resonance of iced transmission lines, the excitation frequency to natural frequency ratio in the forcing term is set to 3:1. Two approaches are employed to obtain the displacement responses in the y- and z-directions, as well as the oscillation trajectories, as illustrated in Figure 12. Under 1/3-subharmonic resonance, the overall trends, galloping amplitudes, phase relations, frequencies, and trajectory characteristics of the responses are observed to be similar for both methods, consistent with the patterns identified under 1/2-subharmonic resonance. These results indicate that the galloping characteristics of 1/3-subharmonic resonance in iced transmission lines are substantially influenced by the choice of discrete method.

Figure 12.
Displacement-response for 1/3 subharmonic; (a) y-direction displacement-response, (b) z-direction displacement-response, (c) trajectory.
According to Equation (31), the effects of the detuning parameter and excitation amplitude on the response amplitude a were separately derived for the two discrete methods, as shown in Figure 13 and Figure 14. In Figure 13, the amplitude-frequency responses exhibit closed elliptical shapes, indicating pronounced geometric nonlinearity. As the excitation amplitude increases, the resonance amplitude also increases and shifts in a positive direction. By extracting representative curves and depicting all operating conditions as solid lines, it is observed that DMII exhibits weaker geometric nonlinearity than DMI. In Figure 14, the responses again show elliptical shapes and are multi-valued. The overall trend slopes towards the lower right corner. With increasing detuning parameters, the galloping amplitude increases, while the rate of amplitude growth decreases—differing from the behavior observed in primary and 1/2-subharmonic resonances. Under identical detuning parameters, DMII yields larger galloping amplitudes and a slower rate of increase compared to DMI.
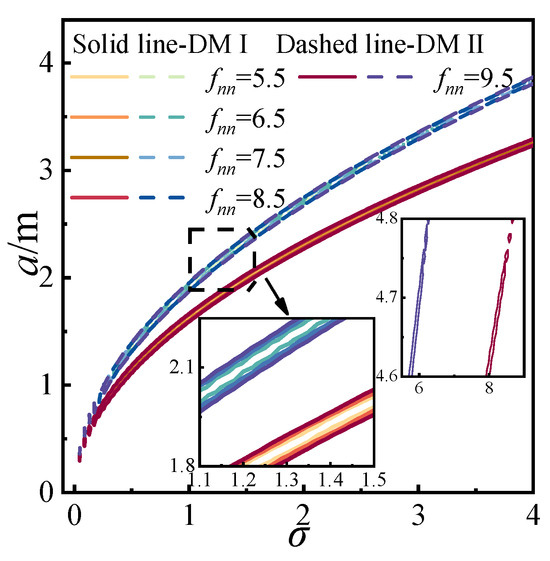
Figure 13.
Amplitude-frequency response for 1/3 subharmonic.
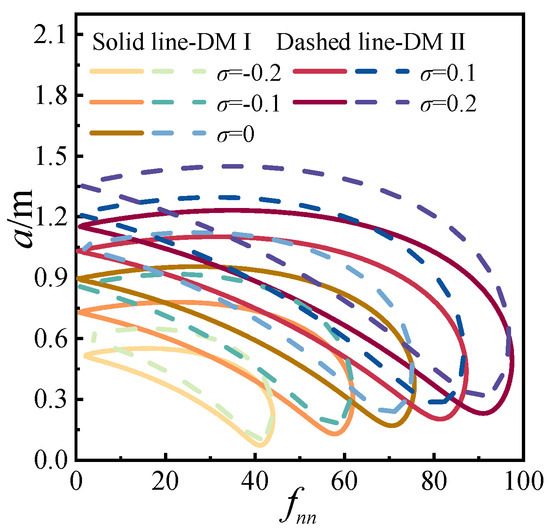
Figure 14.
Response affected by detuning parameter for 1/3 subharmonic.
5.2.3. The Two Superharmonic Resonance
To investigate the influence of different discrete methods on the second-order superharmonic resonance of iced transmission lines, the excitation frequency-to-natural frequency ratio in the forcing term is set to 1:2. Under this condition, displacement responses in the y- and z-directions, along with the trajectories of arbitrary mass points, were obtained using two distinct methods, as shown in Figure 15. The results indicate that the influence of the two methods for dynamic tension calculation on the overall response pattern, galloping amplitude, phase, frequency, and trajectory is similar to the effects observed in 1/2-subharmonic resonance. Therefore, the galloping characteristics under second-order superharmonic resonance are significantly affected by the choice of discrete method.

Figure 15.
Displacement-response for two superharmonic; (a) y-direction displacement-response, (b) z-direction displacement-response, (c) trajectory.
Using Equation (32), the effects of the detuning parameter and excitation amplitude on the response amplitude a were evaluated for the two discrete methods, as shown in Figure 16 and Figure 17. As illustrated in Figure 16, both amplitude-frequency responses exhibit evident geometric nonlinearity, with the resonance peak shifting towards positive values of the detuning parameter σ. However, when the excitation amplitude fnn is less than or equal to 0.35 for DMI and less than or equal to 0.40 for DMII, no distinct geometric nonlinearity is observed in the curves, although the resonance amplitude increases with the excitation amplitude. By selecting representative curves and depicting all operating conditions as solid lines, it is evident that DMII yields larger galloping amplitudes than DMI, while exhibiting weaker geometric nonlinearity. In Figure 17, as the detuning parameter increases, both the galloping amplitude and its rate of increase are amplified. When σ ≤ 0, the response curve is single-valued; however, for σ > 0, the curve transitions from single-valued to multi-valued. As the detuning parameter continues to increase, the overall trend tilts towards the lower right corner, distinguishing it from the primary and 1/2-subharmonic resonances. Under identical detuning parameters, DMII produces higher galloping amplitudes and a greater rate of amplitude increase than DMI, with a steeper tilt in the response curve.
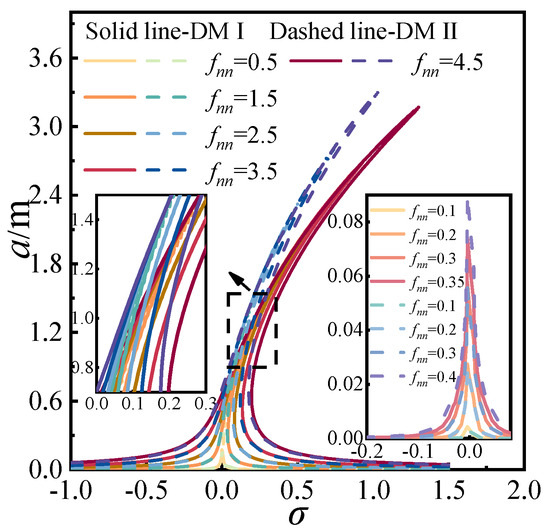
Figure 16.
Amplitude-frequency for two superharmonic.
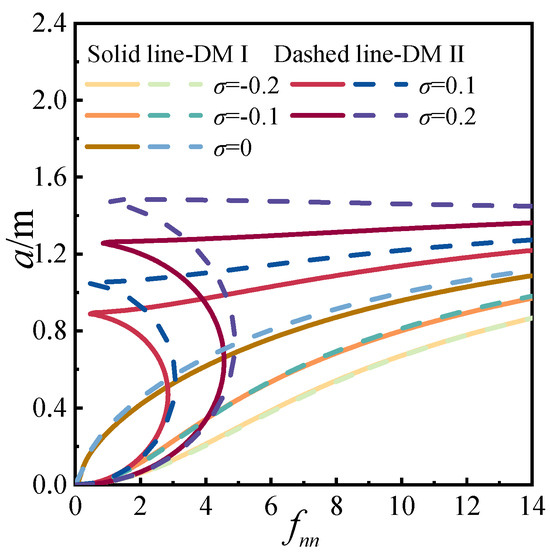
Figure 17.
Response affected by detuning parameters for two superharmonic.
5.2.4. The Three Superharmonic Resonance
To investigate the influence of different discrete methods on the third-order superharmonic resonance of iced transmission lines, the excitation frequency Ω to natural frequency ratio in the forcing term is set to 1:3. Under this condition, displacement responses in the y- and z-directions, along with the trajectories of arbitrary mass points, were obtained using two distinct methods, as shown in Figure 18. The results indicate that the influence of the two methods on the overall response pattern, galloping amplitude, frequency, and trajectory under geometric nonlinearity is similar to that observed in the 1/2-subharmonic resonance. Therefore, the oscillation characteristics of overhead iced transmission lines at third-order superharmonic resonance are significantly affected by the choice of discrete method.

Figure 18.
Displacement response curve for three superharmonic; (a) y-direction displacement response, (b) z-direction displacement response, (c) trajectory.
Using Equation (33), the effects of the detuning parameter and excitation amplitude on the response amplitude a under the two discrete methods are illustrated in Figure 19 and Figure 20, respectively. As shown in Figure 19, both amplitude–frequency responses exhibit significant geometric nonlinearity, with the resonance peaks shifting towards positive values of the detuning parameter σ. However, for both methods, when the excitation amplitude fnn ≤ 1.9, the curves do not display evident geometric nonlinearity. As the excitation amplitude increases, the resonance amplitude also increases. By extracting representative curves and depicting all operating conditions as solid lines, it is observed that DMII results in larger galloping amplitudes than DMI, while exhibiting weaker geometric nonlinearity. In Figure 20, as the detuning parameter increases, both the galloping amplitude and the rate of increase in galloping amplitude are enhanced. When the detuning parameter σ ≤ 0, the response curve is single-valued; for σ > 0, the curve transitions from single-valued to multi-valued. As the detuning parameter increases, the overall trend tilts towards the lower right, distinguishing it from primary resonance and 1/2-subharmonic resonance. Under the same detuning parameter, DMII produces larger galloping amplitudes and a greater rate of increase in galloping amplitude compared to DMI, with both methods exhibiting similar tilting rates.
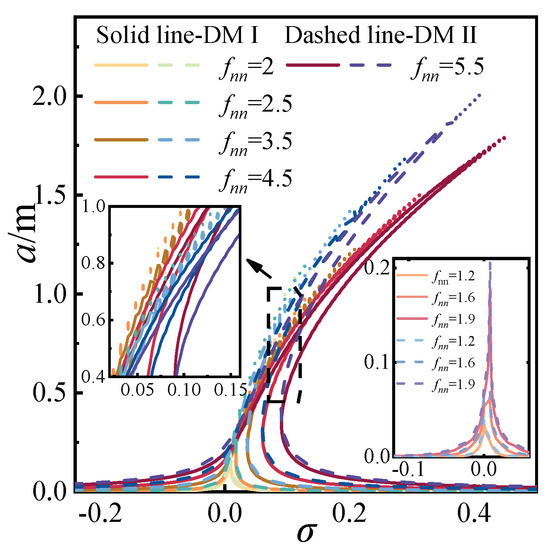
Figure 19.
Amplitude-frequency for three superharmonic.
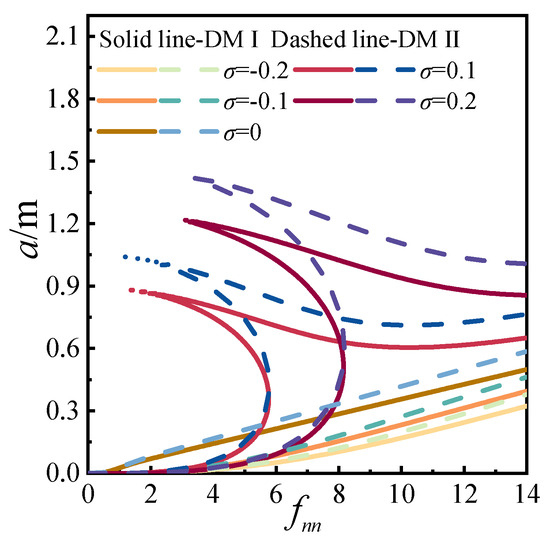
Figure 20.
Response affected by detuning parameter for three superharmonic.
5.3. The Internal Resonance
By defining a specific parameter, the system can satisfy both 2:1 and 1:1 internal resonances under both DMI and DMII. Specifically, the frequency ratio in the y-direction to the frequency in the z-direction is 2:1 and 1:1, respectively. Additionally, by considering the excitation term within the in-plane, the system satisfies these two internal resonance conditions for in-plane primary resonance, where the ratio of frequencies in the y-direction to the z-direction and the excitation frequency in the y-direction is 2:1:2 and 1:1:1.
5.3.1. The 2:1:2 Internal Resonance
To investigate the influence of discrete methods on the 2:1:2 internal resonance of iced transmission lines, reference parameters from Table 1 and Table 3 were utilized. For DMI, the tension force is set to H = 13,500 N, and for DMII, the tension force is set to H = 11,400 N, which satisfies the approximate 2:1 frequency ratio between the y- and z-directions. Considering the primary resonance scenario, the frequency ratios in the y-direction, z-direction, and excitation frequency in the y-direction are set to 2:1:2.
After a period of vibration, the vibration period and amplitude stabilize. The displacement responses over several cycles in the stable state were intercepted, as shown in Figure 21a,b. The y-direction and z-direction data under this stable condition were used to plot the galloping trajectory, as depicted in Figure 21c. A comparison of the different discrete methods reveals minimal time differences in reaching stability, with both methods exhibiting an approximately closed ‘∞’ shape in the galloping trajectory. However, DMII shows larger amplitude and trajectory than DMI, with DMII having a lower frequency than DMI. Consequently, the galloping characteristics are distinct under different discrete methods in the 2:1:2 internal resonance of iced transmission lines.

Figure 21.
Displacement-response for the 2:1:2 internal resonance; (a) y-direction displacement-response, (b) z-direction displacement-response, (c) trajectory.
When comparing the effects of different discrete methods on the amplitudes in the y- and z-directions, the displacement response in the y-direction shows that the amplitude obtained by DMI is 0.093 smaller than that of DMII, with an error of 8.81%. In the displacement response in the z-direction, the amplitude calculated by DMI is 0.2157 smaller than that of DMII, with an error of 15.81%. Thus, the amplitude in the z-direction is more significantly influenced by the differences between the two discrete methods.
Using Equation (28), the tension force, detuning parameter σ, and excitation amplitude fnn were defined. Subsequently, two distinct discrete methods for the 2:1:2 internal resonance scenario were employed to investigate the effects of the detuning parameter and excitation amplitude on the response amplitude a, as shown in Figure 22 and Figure 23. As illustrated in Figure 22, under the same excitation amplitude, the amplitude-frequency response exhibits characteristics similar to primary resonance, albeit with a generally lower amplitude. Similarly, as depicted in Figure 23, under the same detuning parameter, the impact of the excitation amplitude on the response amplitude a follows a pattern resembling that of primary resonance.
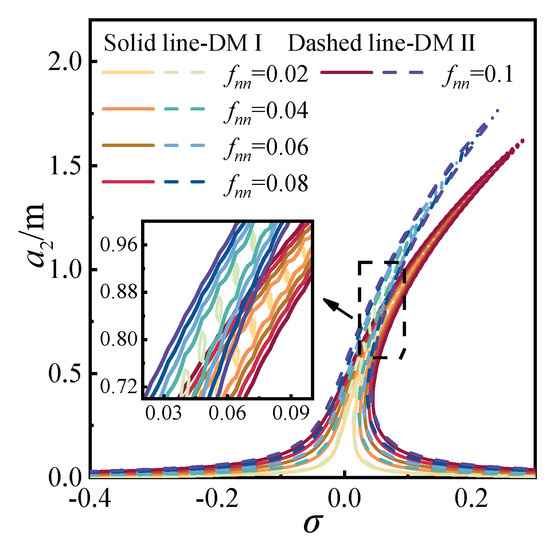
Figure 22.
Amplitude-frequency response for the 2:1:2 internal resonance.
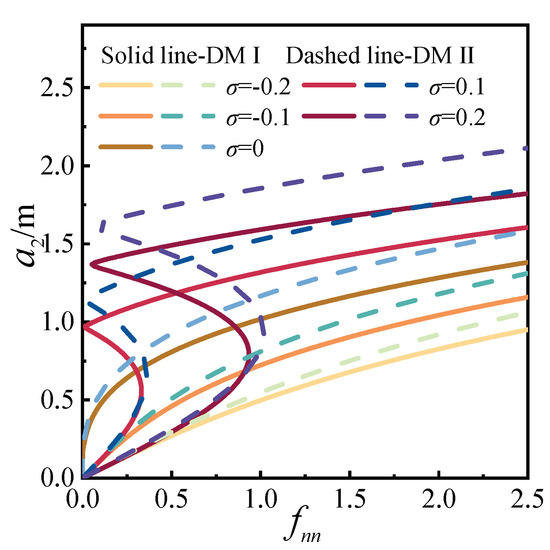
Figure 23.
Response affected by detuning parameter for the 2:1:2 internal resonance.
5.3.2. The 1:1:1 Internal Resonance
To investigate the impact of discrete methods on the 1:1:1 internal resonance of iced transmission lines, the parameters from Table 1 and Table 3 were used. For both DMI and DMII, when the tension force H = 70,000 N, the ratio of frequencies in the y- and z-directions of the transmission lines is approximately 1:1. Considering the primary resonance, the ratio of frequencies in the y- and z-directions and the excitation frequency in the y-direction are set to 1:1:1. Numerical methods were employed to analyze the coupled vibrations of the transmission lines.
The displacement responses over several cycles in the steady state were captured after a period of vibration, as shown in Figure 24a,b. Under this condition, the y-direction and z-direction data were extracted to plot the galloping trajectory, as depicted in Figure 24c. Comparing the different discrete methods, it was observed that the time difference for stabilization is minimal, and both trajectories exhibit approximately closed elliptical shapes. However, the galloping amplitude and trajectory for DMII are larger than those for DMI. Additionally, the frequency for DMII is smaller than that for DMI. Therefore, the dynamic characteristics of the 1:1:1 internal resonance of iced transmission lines are influenced by the choice of discrete method.

Figure 24.
Displacement-response for the 1:1:1 internal resonance; (a) y-direction displacement-response, (b) z-direction displacement-response, (c) trajectory.
When comparing the effects of different discretization methods on the amplitudes in the y- and z-directions, the displacement response in the y-direction shows that the amplitude calculated by DMI is 0.1033 smaller than that of DMII, with an error of 11.95%. In the displacement response in the z-direction, the amplitude calculated by DMI is 0.0021 smaller than that of DMII, with an error of 10.42%. These results indicate that the difference between the two discretization methods has a minimal effect on the amplitudes in both the y- and z-directions.
Using Equation (28), adjustments were made to the tension force, and the detuning parameter σ and excitation amplitude fnn were defined. Subsequently, two distinct discrete methods for the 1:1:1 internal resonance scenario were employed to investigate the effects of the detuning parameter and excitation amplitude on the response amplitude a, as shown in Figure 25 and Figure 26. As illustrated in Figure 25, under the same excitation amplitude, the amplitude-frequency response exhibits characteristics similar to the primary resonance, albeit with an overall amplitude lower than that of both the primary resonance and the 2:1:2 internal resonance. Similarly, as shown in Figure 26, under the same detuning parameter, the impact of the excitation amplitude on the response amplitude a follows a pattern resembling the primary resonance.
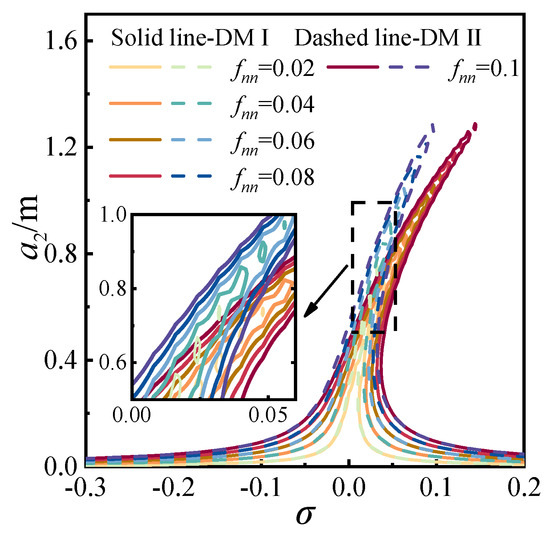
Figure 25.
Amplitude-frequency response for the 1:1:1 internal resonance.
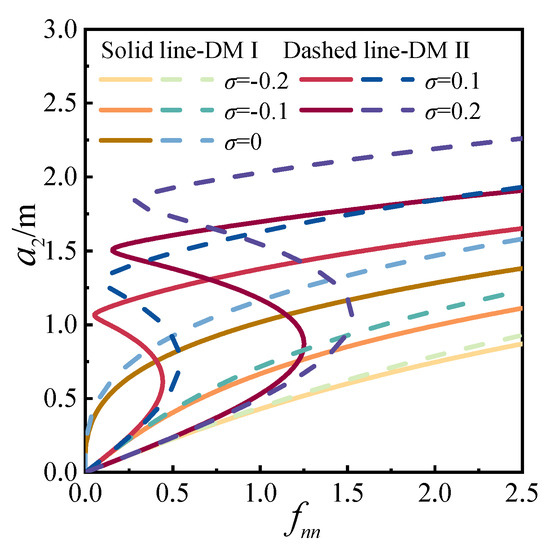
Figure 26.
Response affected by detuning parameter for the 1:1:1 internal resonance.
By comparing the computational results obtained using Discrete Method I (DMI) and Discrete Method II (DMII), it is evident that each method exhibits distinct characteristics in terms of computational accuracy, efficiency, and engineering applicability. DMI directly transforms the governing equations into ordinary differential form, resulting in a relatively simple algorithm with lower computational cost. This makes it suitable for rapid simulations or preliminary assessments where computational efficiency is a priority. However, DMI may suffer from reduced accuracy when dealing with strong nonlinearities, such as large-amplitude vibrations.
In contrast, DMII adopts the Galerkin method for numerical discretization, which allows for a more accurate representation of the structural nonlinear response and enhances the numerical stability of the solution. While DMII provides higher modeling fidelity, it also entails significantly greater computational complexity. From an engineering perspective, DMI is more appropriate for routine evaluations and parameter studies with moderate accuracy requirements, whereas DMII is better suited for safety-critical applications and refined analyses, particularly under complex boundary conditions or severe icing scenarios.
6. Conclusions
By establishing the galloping equation for iced transmission lines and verifying the two discrete methods using FEM, MATLAB R2023a, and the multiscale method, the galloping characteristics of primary, harmonic, and internal resonances under different discrete methods were analyzed. The following conclusions were drawn:
- (1)
- For primary resonance, the galloping characteristics are significantly influenced by the two discrete methods. As the excitation amplitude increases, the response amplitude also increases, and the amplitude-frequency response exhibits pronounced geometric nonlinearity. As the detuning parameter increases, the response amplitude transitions from single-valued to multi-valued, leading to unstable nonlinear vibrations.
- (2)
- For harmonic resonance, the galloping characteristics across the four types of harmonic resonance are similar. In the amplitude-frequency response, when the excitation amplitude is too small, superharmonic resonance exhibits no geometric nonlinearity, and the system is more prone to 1/2 subharmonic and two superharmonic resonances. The excitation amplitude corresponding to primary resonance is significantly smaller than that of harmonic resonances. Regarding the influence of the detuning parameter, except for the 1/3 subharmonic resonance response, where the response amplitude remains multi-valued, the remaining curves are consistent with primary resonance.
- (3)
- During the 2:1:2 internal resonance, the differences between methods have a greater impact on amplitude in the z-direction. For the 1:1:1 internal resonance, the differences between methods show a relatively minor influence on amplitudes in both the y- and z-directions, although the overall trends in the displacement response differ from those observed during primary resonance. As the excitation amplitude and detuning parameter increase, the overall characteristics of the curves resemble those of primary resonance, yet the amplitude of the internal resonance decreases.
- (4)
- When comparing the two discrete methods, the results from DMII are closer to the FEM due to its equivalent treatment of dynamic tension, which is more consistent with FEM principles. DMII yields larger galloping amplitudes and trajectories compared to DMI. Furthermore, the frequency and geometric nonlinearity of DMII are smaller than those of DMI. From the larger galloping response observed with DMII, it can be inferred that, for practical engineering applications, DMII is more conservative.
Author Contributions
Methodology, R.C.; writing—review and editing, W.B.; supervision, M.C. All authors have read and agreed to the published version of the manuscript.
Funding
This research was funded by the foundation of the National Natural Science Foundation of China (51507106) and the China Postdoctoral Science Foundation (2021M702371).
Data Availability Statement
The original contributions presented in this study are included in the article, further inquiries can be directed to the corresponding author.
Conflicts of Interest
We declare that we have no financial and personal relationships with other people or organizations that can inappropriately influence our work; there is no professional or other personal interest of any nature or kind in any product, service, and/or company that could be construed as influencing the position presented in, or the review of, the manuscript entitled.
References
- Zhang, Z.J.; Zhang, H.; Yue, S.; Zeng, W.H. A review of icing and anti-icing technology for transmission lines. Energies 2023, 16, 601. [Google Scholar] [CrossRef]
- Lou, W.J.; Lv, J.; Huang, M.F.; Yang, L.; Yan, D. Aerodynamic force characteristics and galloping analysis of iced bundle conductors. Wind Struct. 2014, 18, 135–154. [Google Scholar] [CrossRef]
- Lou, W.J.; Huang, C.R.; Huang, M.F.; Yu, J. An aerodynamic anti-galloping technique of iced 8-bundled conductors in ultra-high-voltage transmission lines. J. Wind. Eng. Ind. Aerodyn. 2019, 193, 103972. [Google Scholar] [CrossRef]
- Liu, Y.; Li, C.; Yin, F.H.; Du, B.X.; Farzaneh, M. Dynamic interactive characteristics between icicle growth and corona discharge on HVDC outdoor insulators during icing accretion. High Volt. 2023, 8, 570–582. [Google Scholar] [CrossRef]
- Den Hartog, J.P. Transmission line vibration due to sleet. Trans. Am. Inst. Electr. Eng. 1932, 51, 1074–1076. [Google Scholar] [CrossRef]
- Nigol, O.; Buchan, P. Conductor galloping Part I—Den Hartog mechanism. IEEE Trans. Power Appar. Syst. 1981, PAS-100, 699–707. [Google Scholar] [CrossRef]
- Nigol, O.; Buchan, P. Conductor galloping—Part II torsional mechanism. IEEE Trans. Power Appar. Syst. 1981, PAS-100, 708–720. [Google Scholar] [CrossRef]
- Zulli, D.; Luongo, A. Bifurcation and stability of a two-tower system under wind-induced parametric, external and self-excitation. J. Sound Vib. 2012, 331, 365–383. [Google Scholar] [CrossRef]
- Giaccu, G.F.; Barbiellini, B.; Caracoglia, L. Stochastic unilateral free vibration of an in-plane cable network. J. Sound Vib. 2015, 340, 95–111. [Google Scholar] [CrossRef]
- Cai, M.Q.; Yan, B.; Lu, X.; Zhou, L.S. Numerical Simulation of Aerodynamic Coefficients of Iced-Quad Bundle Conductors. IEEE Trans. Power Deliv. 2015, 30, 1669–1676. [Google Scholar] [CrossRef]
- Cai, M.Q.; Xu, Q.; Zhou, L.S.; Liu, X.H.; Huang, H.J. Aerodynamic characteristics of iced 8-bundle conductors under different turbulence intensities. KSCE J. Civ. Eng. 2019, 23, 4812–4823. [Google Scholar] [CrossRef]
- Chen, J.B.; Sun, G.Q.; Guo, X.C.; Peng, Y.B. Galloping behaviors of ice-coated conductors under steady, unsteady and stochastic wind fields. Cold Reg. Sci. Technol. 2022, 200, 103583. [Google Scholar] [CrossRef]
- Benedettini, F.; Rega, G. Non-linear dynamics of an elastic cable under planar excitation. Int. J. Non-Linear Mech. 1987, 22, 497–509. [Google Scholar] [CrossRef]
- Benedettini, F.; Rega, G.; Alaggio, R. Non-linear oscillations of a four-degree-of-freedom model of a suspended cable under multiple internal resonance conditions. J. Sound Vib. 1995, 182, 775–798. [Google Scholar] [CrossRef]
- Rega, G.; Benedettini, F. Planar non-linear oscillations of elastic cables under subharmonic resonance conditions. J. Sound Vib. 1989, 132, 367–381. [Google Scholar] [CrossRef]
- Kamel, M.M.; Hamed, Y.S. Nonlinear analysis of an elastic cable under harmonic excitation. Acta Mech. 2010, 214, 315–325. [Google Scholar] [CrossRef]
- Zhao, Y.B.; Sun, C.S.; Wang, Z.Q.; Wang, L.H. Analytical solutions for resonant response of suspended cables subjected to external excitation. Nonlinear Dyn. 2014, 78, 1017–1032. [Google Scholar] [CrossRef]
- Takaharu, Y.; Takaharu, M.; Masaaki, S. The discrete variational derivative method based on discrete differential forms. J. Comput. Phys. 2012, 231, 3963–3986. [Google Scholar] [CrossRef]
- Nilofar, N.; Gnaneshwar, N. Discrete projection methods for Hammerstein integral equations on the half-line. Calcolo 2020, 57, 37. [Google Scholar] [CrossRef]
- Zhu, W.X.; Fan, H. A discrete dynamic convexized method for nonlinear integer programming. J. Comput. Appl. Math. 2009, 223, 356–373. [Google Scholar] [CrossRef][Green Version]
- Perkins, N.C.; Mote, C.D. Three-dimensional vibration of travelling elastic cables. J. Sound Vib. 1987, 114, 325–340. [Google Scholar] [CrossRef]
- Wang, L.H.; Zhao, Y.Y. Large amplitude motion mechanism and non-planar vibration character of stay cables subject to the support motions. J. Sound Vib. 2009, 327, 121–133. [Google Scholar] [CrossRef]
- Zhou, C. In-Plane nonlinear vibration of overhead power transmission conductors with coupling effects of wind and rain. IEEE Access 2021, 9, 63398–63405. [Google Scholar] [CrossRef]
- Zhao, Y.Y.; Wang, L.H. On the symmetric modal interaction of the suspended cable: Three-to-one internal resonance. J. Sound Vib. 2006, 297, 1073–1093. [Google Scholar] [CrossRef]
- Min, G.Y.; Liu, X.H.; Wu, C.; Yang, S.G.; Cai, M.Q. Influences of two calculation methods about dynamic tension on vibration characteristics of cable-Bridge coupling model. Discret. Dyn. Nat. Soc. 2021, 2021, 6681954. [Google Scholar] [CrossRef]
- Liu, X.H.; Min, G.Y.; Cai, M.Q.; Yan, B.; Wu, C. Two simplified methods for galloping of iced transmission lines. KSCE J. Civ. Eng. 2021, 25, 272–290. [Google Scholar] [CrossRef]
- Lou, W.J.; Yang, L.; Huang, F.M. Two-parameter bifurcation and stability analysis for nonlinear galloping of iced transmission lines. J. Eng. Mech. 2014, 140, 04014081. [Google Scholar] [CrossRef]
- Liu, X.H.; Liang, H.B.; Min, G.Y. Investigation on the nonlinear vibration characteristics of current-carrying crescent iced conductors under aerodynamic forces, ampere’s forces, and forced excitation conditions. Discret. Dyn. Nat. Soc. 2021, 2021, 5009209. [Google Scholar] [CrossRef]
- Long, Y.; Kang, H.J. Analysis of 1:1 internal resonance of a CFRP cable with an external 1/3 subharmonic resonance. Nonlinear Dyn. 2022, 107, 3425–3441. [Google Scholar] [CrossRef]
- Desai, Y.M.; Yu, P.; Popplewell, N.; Shah, A.H. Finite element modelling of transmission line galloping. Comput. Struct. 1995, 57, 407–420. [Google Scholar] [CrossRef]
Disclaimer/Publisher’s Note: The statements, opinions and data contained in all publications are solely those of the individual author(s) and contributor(s) and not of MDPI and/or the editor(s). MDPI and/or the editor(s) disclaim responsibility for any injury to people or property resulting from any ideas, methods, instructions or products referred to in the content. |
© 2025 by the authors. Licensee MDPI, Basel, Switzerland. This article is an open access article distributed under the terms and conditions of the Creative Commons Attribution (CC BY) license (https://creativecommons.org/licenses/by/4.0/).