Article

Evolutionary Dynamics and Policy Coordination in the Vehicle–Grid Interaction Market: A Tripartite Evolutionary Game Analysis

by
Qin Shao
,
Ying Lyu
and
Jian Cao
*
College of Management, Zhejiang University of Technology, Hangzhou 310023, China
*
Author to whom correspondence should be addressed.
Mathematics 2025, 13(15), 2356; https://doi.org/10.3390/math13152356
Submission received: 25 June 2025 / Revised: 15 July 2025 / Accepted: 22 July 2025 / Published: 23 July 2025

Abstract

This study introduces a novel tripartite evolutionary game model to analyze the strategic interactions among electric vehicle (EV) aggregators, local governments, and EV users in vehicle–grid interaction (VGI) markets. The core novelty lies in capturing bounded rationality and dynamic decision-making across the three stakeholders, revealing how policy incentives and market mechanisms drive the transition from disordered charging to bidirectional VGI. Key findings include the following: (1) The system exhibits five stable equilibrium points, corresponding to three distinct developmental phases of the VGI market: disordered charging (V0G), unidirectional VGI (V1G), and bidirectional VGI (V2G). (2) Peak–valley price differences are the primary driver for transitioning from V0G to V1G. (3) EV aggregators’ willingness to adopt V2G is influenced by upgrade costs, while local governments’ subsidy strategies depend on peak-shaving benefits and regulatory costs. (4) Increasing the subsidy differential between V1G and V2G accelerates market evolution toward V2G. The framework offers actionable policy insights for sustainable VGI development, while advancing evolutionary game theory applications in energy systems.

1. Introduction

To achieve carbon reduction and neutrality goals and transform the energy structure, it is essential to address the dual challenges of spatiotemporal mismatches between energy supply and demand and the lack of flexibility in constructing a clean-energy-based power system. Such a system requires efficient coordination among generation, grid, load, and storage. Electric vehicles (EVs), as mobile energy storage units capable of bidirectional energy exchange, have gained significant attention. They can stabilize fluctuations in renewable energy output and help optimize regional peak–valley load differences through rapid demand-side responses [1,2,3]. Furthermore, aggregating EV batteries into a distributed virtual energy storage system provides several advantages for the smart grid. This system supports peak–valley load regulation, enhancing power supply stability and mitigating renewable energy volatility, thereby promoting efficient clean energy use [4,5]. Supported by favorable policies, the development of EVs in China has entered a large-scale phase. By the end of 2024, the national stock of new energy vehicles was expected to reach 31.4 million units, with 12.82 million charging stations. Therefore, the rapid increase in EV ownership and charging demand will expedite the transition of VGI technology from theoretical validation to widespread application.
Encouraged by policy incentives, charging operators are evolving into load EV aggregators, and increasing public awareness is creating favorable market conditions for VGI. However, large-scale promotion of the VGI mode faces three primary challenges: (i) Operational Complexity—the bidirectional variability in EV loads creates spatiotemporal uncertainties in charging/discharging patterns, requiring advanced scheduling models that must account for electricity pricing, user satisfaction, and regulatory constraints [6,7]. (ii) User Adoption—EV users’ participation is limited by economic viability concerns, battery degradation risks, and up-front costs [5]. (iii) Regulatory barriers—scheduling risks from load forecasting inaccuracies and misaligned subsidy–ancillary market mechanisms impede incentive effectiveness [8]. Therefore, a comprehensive analysis of pricing incentives, user perceptions, battery costs, and other key conditions across VGI development phases is essential to inform both aggregator strategies and government policies, driving progress in sustainable transportation and energy security.
The existing literature on VGI can be categorized into three primary research streams: (i) technological control and application potential of VGI systems, (ii) subsidy incentive policies for VGI, and (iii) application of evolutionary game theory (EGT) to VGI.
Contemporary studies have conclusively demonstrated VGI’s technical viability through three principal research avenues: optimized charging/discharging algorithms, market equilibrium simulations, and dynamic pricing architectures [9]. In terms of technological control, studies have primarily focused on orderly charging and intelligent charging/discharging control methods for EVs, to reduce adverse impacts on regional distribution networks [10,11,12]. Breakthrough research by Lee et al. [13] employing multi-physics modeling quantitatively validated that State of Charge optimization extends battery cycle life by 15–20% in bidirectional operation modes, addressing a critical commercialization barrier. Moreover, empirical evidence from demand–response programs confirms VGI’s dual value proposition, participating EV users achieve 20–30% cost reductions, while grid operators benefit from 15–25% improvement in stability indices [14,15]. Regional case studies, particularly Wu et al.’s [16] spatial-temporal analysis of Texas’s V2G potential, project scalable capacity reaching 747 MWh by 2030. The technical reliability proposition has been further substantiated by over 100 international pilot projects, though their commercialization pathways reveal persistent challenges in market design [17] and technology standardization [18]. EV aggregators have emerged as the pivotal nexus in VGI value chains, simultaneously functioning as infrastructure operators and market coordinators [19]. The theoretical underpinnings of aggregator-mediated VGI markets were first formalized in [20], with subsequent field studies by Brandt et al. [21] demonstrating 80–85% operational feasibility in controlled environments. Recent advances have yielded three operational paradigms: (i) hierarchical fleet dispatch models [22], (ii) price-responsive demand shaping using time-variable tariffs [23], and (iii) neural-network-based coordination, reducing peak–valley differentials by 22 ± 3% [24]. These developments collectively underscore the necessity for adaptive profit-allocation mechanisms that align stakeholder incentives with grid optimization objectives.
The design of policy mechanisms has become pivotal in overcoming the bottlenecks to large-scale VGI adoption [25], with two dominant approaches emerging: (i) hybrid price-signaling systems that integrate dynamic electricity pricing with tapered subsidies to guide orderly charging/discharging behavior [26], and (ii) performance-based regulatory frameworks incorporating financial guarantees and penalty mechanisms to ensure compliance [27]. Empirical evidence demonstrates that well-structured incentive policies can simultaneously reduce user participation costs by 25–40% [28], lower carbon emissions by 15–20% per charging cycle [29], and enhance grid stability by 30–35% [30]. However, existing research often relies on static game-theoretic assumptions, neglecting transitional mechanisms such as graduated subsidy reductions, adaptive pricing models, and dynamic revenue-sharing adjustments during the shift from V1G to V2G modes. Recent initiatives, including China’s first batch of VGI pilot projects across nine cities, highlight the growing emphasis on policy–market synergy to accelerate VGI commercialization. These findings underscore the need for adaptive policy frameworks that balance short-term market incentives with long-term regulatory stability to facilitate sustainable VGI system development.
EGT has emerged as a powerful framework for modeling strategic interactions across diverse fields, including economics, ecology, and engineering, by relaxing the stringent rationality assumptions of classical game theory in favor of bounded rationality and dynamic adaptation [31]. In energy systems, EGT has been applied to power market equilibria [32,33,34], carbon trading [35,36,37], and low-carbon supply chains [38,39,40,41,42], demonstrating its versatility in analyzing multi-agent decision-making under uncertainty. V2G technology enables bidirectional interaction between EVs and the grid, allowing EVs not only to charge from the grid, but also to return stored electricity to the grid. A significant body of research has focused on VGI, where EGT addresses challenges in electric vehicle (EV) adoption, charging infrastructure planning, and VGI coordination. For instance, studies have employed EGT to optimize EV charging station deployment, incorporating government subsidies and user behavior [43,44]. In V2G contexts, EGT models have been used to analyze peak-shaving incentives and bidirectional energy trading [45], revealing cost reductions of up to 24.5% for grid operators. Furthermore, EGT has elucidated policy impacts, such as the Dual Credit Policy’s role in accelerating EV sales [46] and the effectiveness of dynamic carbon taxes [47]. Wei et al. [45] developed a hierarchical V2G dispatch framework combining global optimization for energy allocation with evolutionary-game-based prosumer trading. Similarly, Gao et al. [48] demonstrated that evolutionary game modeling of EV–grid coordination can reduce grid costs by 24.5% through optimized peak shaving and valley filling services.
Despite these advancements, the literature exhibits two substantive limitations: (i) predominant use of static game-theoretic models that inadequately capture market dynamics, and (ii) insufficient attention to transitional governance mechanisms during the V1G–V2G migration phase. This gap is particularly evident in the lack of integrated frameworks addressing subsidy phase-out schedules, pricing model iterations, and benefit-sharing adaptations—all critical for sustainable VGI maturation.
The remainder of this paper is structured as follows: Section 2 develops the theoretical framework and constructs the tripartite evolutionary game model. Section 3 discusses the stability of the evolutionary game system. Section 4 analyzes the stability conditions of evolutionary equilibrium points. Section 5 presents numerical simulations to visually illustrate the dynamic evolutionary paths of the three stakeholders under specific scenarios. Finally, Section 6 concludes with the main findings of this study.

2. Methodology

2.1. Basic Conceptions in EGT

EGT is widely recognized as having been founded by Maynard Smith in 1973 [31]. It employs mathematical models to analyze the dynamic evolution of strategies within populations. Compared to classical game theory, evolutionary game theory more effectively addresses complex problems in economic and managerial decision-making. At its core, it describes how strategy frequencies evolve over time and how stable equilibrium states are reached through adaptive adjustments.
The research framework of EGT mainly comprises two key components: the definition of fitness functions, and the design of selection and mutation mechanisms. The fitness function determines whether stable strategies can emerge during evolution, while selection and mutation mechanisms jointly drive the evolutionary process. The selection mechanism enables individuals to retain advantageous strategies from previous generations, whereas the mutation mechanism introduces strategic diversity. EGT aims to address two central questions: (1) how to construct dynamic learning models that reflect diverse learning needs, and (2) based on stability theory, how to analyze equilibrium stability during imitation learning and adaptation, as well as examine the long-term dynamics of systems converging toward equilibrium [49].
The replicator dynamic (RD) is a fundamental model in EGT, simulating how individuals adapt their strategies in response to payoffs. For a population with n strategies, where the proportion of individuals adopting strategy i is x i ( i = 1 n x i = 1 ), the fitness of strategy i is f i , and the average fitness is f a v e = j = 1 n x j f j , the RD equation can be written as d x i d t = x i f i f a v e . Solving this equation yields equilibrium points, which represent stable strategies formed through prolonged strategic interactions. Further stability analysis of these points can reveal the system’s ultimate evolutionarily stable equilibrium state [50].
The theory of evolutionarily stable strategy (ESS) shows that dominant strategies in a population exhibit exclusivity, effectively resisting invasions by alternative strategies. This concept is highly relevant to the development of EV charging markets: once a particular charging mode (e.g., fast-charging station networks) becomes dominant, its scale advantages (e.g., lower unit costs) and user habit lock-in (e.g., charging convenience) generate positive feedback effects that hinder the adoption of competing models. Moreover, policy support (e.g., subsidies and infrastructure planning) can reinforce such dominance, endowing mainstream charging strategies with the stability characteristics of an ESS.
Mathematically, ESS identification typically involves stability analysis methods such as Lyapunov stability theory and Jacobian matrix analysis at the equilibrium points of replicator dynamics [19]. For instance, in a tripartite two-strategy evolutionary game (3P2S-EG), let x , y , and z denote the probabilities of each player adopting a specific strategy. The corresponding replicator dynamics differential equations are given in Equation (1), and the Jacobian matrix J of the system, obtained through linearization, is shown in Equation (2).
f x , t = x f f a v e g y , t = y g g a v e h z , t = z h h a v e
J = f x f y f z g x g y g z h x h y h z
In evolutionary stability analysis, Jacobian matrix analysis, dynamic simulation techniques, and Lyapunov methods can be jointly used to assess whether the internal equilibrium points of the replicator dynamics system are evolutionarily stable in the long term. The stability of these points is determined by the eigenvalues of the Jacobian matrix, as summarized in Table 1, where x * , y * , and z * denote the coordinates of the system’s internal non-pure strategy equilibrium points.
As shown in Table 1, the stability of the system’s equilibrium points can be categorized as follows: (i) Asymptotic Stability (Point 1): If all eigenvalues of the Jacobian matrix J have negative real parts, the point is asymptotically stable. (ii) Instability (Point 2): If at least one eigenvalue has a positive real part, then the state of the original nonlinear system is unstable. (iii) Critical Stability (Point 3): If at least one eigenvalue has a zero real part, the point is considered a saddle point.

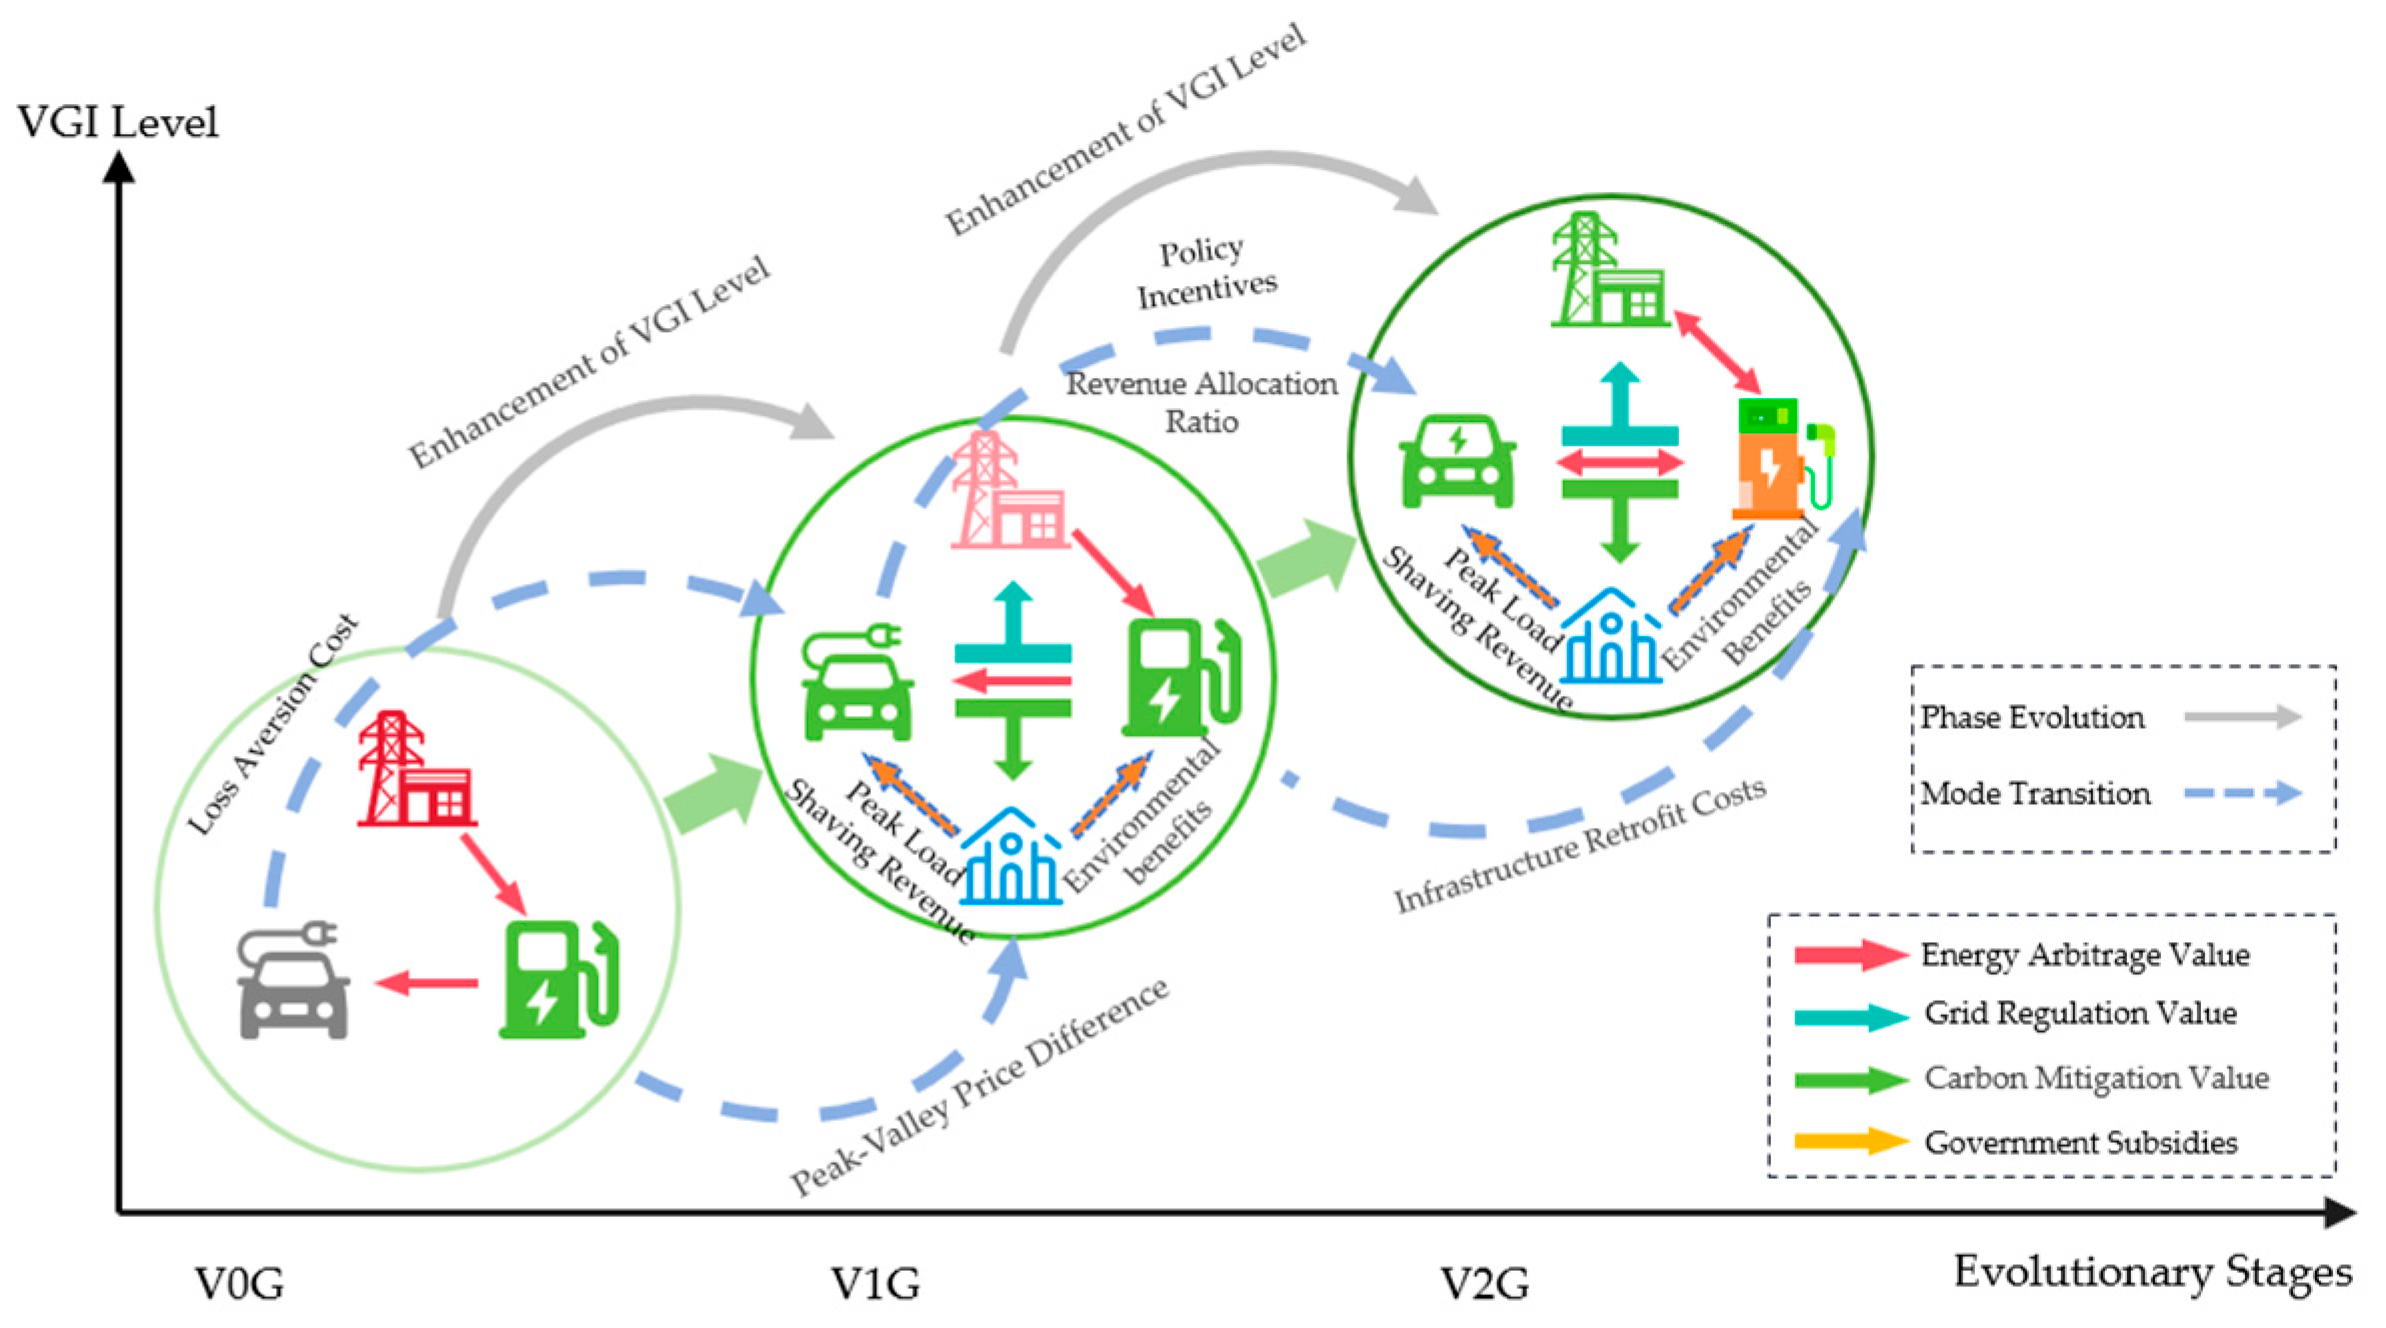
2.2. Theoretical Framework of VGI

VGI is a collaborative operation mechanism formed by the energy–information coupling between electric vehicles and the power grid. Its technological evolution follows a three-stage pattern: The disordered charging phase (V0G), the unidirectional VGI phase (V1G), and the bidirectional VGI phase (V2G). In a VGI system, EV aggregators participate in electricity market transactions by integrating distributed electric vehicle energy storage resources, while EV users, acting as prosumers, determine their participation based on multidimensional factors including charging costs, battery degradation, and response benefits. The government employs subsidy mechanisms to regulate market equilibrium, capture environmental benefits, and maintain grid stability. Based on this, this paper constructs a tripartite evolutionary game model involving EV aggregators, the local government, and EV users. We assume that the probabilities of choosing the V2G strategy for EV aggregators and EV users are x and z , and the probability of choosing the subsidy strategy for the local government is y . Hence, the probabilities of choosing the V1G strategy for EV aggregators and EV users are 1 x and 1 z , respectively, and 1 y denotes the probability of the no-subsidy strategy chosen by the local government.
For EV aggregators, the V1G strategy refers to controlling the charging power through a load management system, providing off-peak charging services with controllable charging power. In this strategy, EV aggregators charge a service fee per unit of charging energy, denoted as f s , and earn a unit profit Δ r from peak–valley arbitrage, along with a management cost represented by C a . When the EV aggregators choose the V2G strategy, this means utilizing user-side resources to discharge back to the grid and participate in grid frequency regulation auxiliary services. Additionally, the upgrade costs for V2G infrastructure are denoted as C s . The government will provide subsidies to EV aggregators implementing V1G and V2G strategies. The total amount of subsidies is influenced by the subsidy coefficient and the peak-shaving amount. Additionally, the EV aggregators will share the subsidies with EV users at ratios a (under the V1G strategy) and b (under the V2G strategy) to incentivize their participation in the VGI.
For local governments, the decision to implement subsidy policies or adopt a non-intervention approach significantly impacts the development of the VGI market. Under a non-subsidy scenario, the government refrains from providing financial incentives to EV aggregators but must bear the associated environmental losses, denoted as L . In contrast, the subsidy strategy involves offering financial support, where r 1 and r 2 denote the subsidy amounts for V1G and V2G scenarios, respectively, and k 1 and k 2 represent the corresponding responsiveness coefficients. While this approach incurs regulatory costs C g , it yields substantial environmental improvement benefits ( E 1 for V1G and E 2 for V2G), with incremental environmental improvement benefits ( Δ E 1 for V1G and Δ E 2 for V2G). Critically, VGI implementation allows the government to harness peak-shaving benefits E g through reduced grid load fluctuations and lower power generation costs.
For EV users, in the V0G scenario, the charging amount is denoted as Q 0 , with a corresponding charging cost of C 0 . V1G refers to shifting part of the charging to off-peak hours (denoted by the subscript p), while V2G refers to EV users charging during off-peak hours and discharging to the grid during peak hours (denoted by the subscript d). In the no-subsidy scenario, the peak-shaving and discharging amounts for EV users in the V1G and V2G modes are denoted as Q p and Q d , respectively, with perceived utilities of U 1 and U 2 , and loss aversion costs of C t and C l , respectively. When the local government adopts the subsidy strategy, the incremental peak-shaving and discharging amounts for EV users are denoted as Δ Q p and Δ Q d , with additional perceived utilities of U s , and incremental loss aversion costs of Δ C t and Δ C l . When EV users discharge to the grid, the unit discharge income is r d and the unit battery wear cost is k b .
The above parameters and their definitions for the three parties are listed in Table 2.

2.3. Model Construction

Based on the previous theoretical framework, the corresponding payoff matrix for EV aggregators, the local government, and EV users is constructed, as shown in Table 3.
Table 3 displays the tripartite payoff matrix for EV aggregators, local governments, and EV users within our evolutionary game framework, where boundedly rational actors strategically maximize their payoffs. When a strategy’s expected payoff for a group exceeds the average of the other strategies, the proportion of individuals choosing that strategy increases. In other words, participants’ willingness to adopt that strategy strengthens. Strategies with higher payoffs are more likely to be imitated and spread [51,52]. Through the elimination of inefficient strategies and reinforcement of advantageous ones, the choices of the three stakeholders interact and eventually stabilize. This process can be modeled using replicator dynamics equations [53,54,55]. Next, by calculating the expected payoffs for the strategies of EV aggregators, local governments, and EV users, we construct a replicator dynamic equation to study the evolutionary relationships of these parties in VGI cooperation.
First, we define the expected payoffs for the EV aggregators’ V2G strategy and V1G as E 11 and E 12 , respectively, and use E ¯ 1 to represent the average expected payoff. According to the above payoff matrix and the probabilities of selecting different strategies, E 11 , E 12 , and E ¯ 1 can be expressed as follows:
E 11 = y z ( 1 δ ) k 2 r 2 Q d + Δ Q d + f s Q 0 + Q d + Δ Q d C s C a + y ( 1 z ) Δ r Q 0 + f s Q 0 C s C a + ( 1 y ) z f s Q 0 + Q d C s C a + ( 1 y ) ( 1 z ) Δ r Q 0 + f s Q 0 C s C a
E 12 = y z 1 γ k 1 r 1 Q p + Δ Q p + Δ r Q 0 Q p Δ Q p + f s Q 0 C a + y 1 z Δ r Q 0 + f s Q 0 C a + 1 y z Δ r Q 0 Q p + f s Q 0 C a + 1 y 1 z Δ r Q 0 + f s Q 0 C a
E ¯ 1 = x E 11 + 1 x E 12
The replicator dynamic equation for EV aggregators d x d t can be calculated as
F x = d x d t = x E 11 E ¯ 1 = x 1 x y z 1 δ k 2 r 2 Q d + Δ Q d + f s Δ Q d + Δ r Δ Q p 1 γ k 1 r 1 Q p + Δ Q p           + z f s Q d Δ r Q 0 Q p C s
Similarly, we use E 21 and E 22 to represent the expected payoffs of the local government’s subsidy strategy and non-subsidy strategy, respectively, and use E ¯ 2 to denote the average expected payoff. E 21 , E 22 , and E ¯ 2 can be obtained as follows:
E 21 = x z E g Q 0 + Q d + Δ Q d k 2 r 2 Q d + Δ Q d C g L + E 2 + Δ E 2 + ( 1 x ) ( 1 z ) C g L + ( 1 x ) z E g Q p + Δ Q p k 1 r 1 Q p + Δ Q p C g L + E 1 + Δ E 1 + x ( 1 z ) C g L
E 22 = x z E g Q 0 + Q d L + E 2 + x ( 1 z ) L + ( 1 x ) z E g Q p L + E 1 + ( 1 x ) ( 1 z ) L
E ¯ 2 = y E 21 + 1 y E 22
The replicator dynamic equation for the local government d y d t can be calculated as
F ( y ) = d y d t = y E 21 E ¯ 2 = y ( 1 y ) x z E g Δ Q d Δ Q p + k 1 r 1 Q p + Δ Q p           k 2 r 2 Q d + Δ Q d + Δ E 2 Δ E 1 + z E g Δ Q p k 1 r 1 Q p + Δ Q p + Δ E 1 C g          
Next, we use E 31 and E 32 to represent the expected payoffs for EV users participating in V1G mode and participating in V2G mode, respectively, and use E ¯ 3 to represent the average expected payoff. E 31 , E 32 , and E ¯ 3 can be expressed as follows:
E 31 = x y U 2 + U s + r d Q d + Δ Q d + δ k 2 r 2 Q d + Δ Q d k b Q d + Δ Q d           C 0 Δ r Q 0 + r t Δ r Q d + Δ Q d C l Δ C l + ( 1 x ) ( 1 y ) U 1 C 0 + Δ r Q p C t + ( 1 x ) y U 1 + U s + γ k 1 r 1 Q p + Δ Q p C 0 + Δ r Q p + Δ Q p C t Δ C t + x ( 1 y ) U 2 + r d Q d C 0 Δ r Q 0 + r t Δ r Q d k b Q d C l
E 32 = x y + x ( 1 y ) + ( 1 x ) y + ( 1 x ) ( 1 y ) C 0
E ¯ 3 = z E 31 + 1 z E 32
The replicator dynamic equation for EV users d z d t can be calculated as
F ( z ) = d z d t = z E 31 E ¯ 3 = = z ( 1 z ) x y [ δ k 2 r 2 Q d + Δ Q d γ k 1 r 1 Q p + Δ Q p + r d + Δ r r t k b Δ Q d Δ r Q p Δ C l + Δ C t                     ] + x U 2 U 1 + r d + Δ r r t k b Q d + Δ r Q 0 Q p C l + C t           + y U s + γ k 1 r 1 Q p + Δ Q p + Δ r Δ Q p Δ C t + U 1 + Δ r Q p C t
Finally, let F x = 0 , F y = 0 , and F z = 0 , and combine Equations (6) and (10), and (14) to establish a three-dimensional dynamic system, as shown in Equation (15).
x 1 x y z A 1 + z A 5 C s = 0 y 1 y x z A 2 + z A 6 C g = 0 z 1 z x y A 3 + x A 4 + y A 7 + U 1 + Δ r Q p C t = 0
where
A 1 = 1 δ Q d + Δ Q d k 2 r 2 1 γ Q p + Δ Q p k 1 r 1 + f s Δ Q d + Δ r Δ Q p A 2 = E g Δ Q d Δ Q p + k 1 r 1 Q p + Δ Q p k 2 r 2 Q d + Δ Q d + Δ E 2 Δ E 1 A 3 = δ k 2 r 2 Q d + Δ Q d γ k 1 r 1 Q p + Δ Q p + r d + Δ r r t k b Δ Q d Δ r Q p Δ C l + Δ C t A 4 = U 2 U 1 + r d + Δ r r t k b Q d + Δ r Q 0 Q p C l + C t A 5 = f s Q d Δ r Q 0 Q p A 6 = E g Δ Q p k 1 r 1 Q 0 Q p + Δ E 1 A 7 = U s + γ k 1 r 1 Q 0 Q p + Δ r Δ Q p Δ C t A 8 = U 1 + Δ r Q p C t
In the next section, we will solve this replicator dynamic system to analyze the stability of strategies for the three parties.

3. Results

Based on the tripartite game model constructed in Section 2, we identified eight pure strategy equilibrium points and established a Jacobian matrix to evaluate the stability of these equilibrium points.

3.1. Equilibrium Points of the Tripartite Evolutionary Game Model

Solving Equation (15) yields a total of 15 equilibrium points, which include 8 pure strategy solutions for three players, 6 pure strategy solutions for two players, and 1 mixed strategy solution. Game theory stipulates that the strategies in multi-player evolutionary games must be Nash equilibria in pure strategies. Consequently, we focus exclusively on 8 pure strategy solutions: P 1 0 , 0 , 0 , P 2 0 , 0 , 1 , P 3 0 , 1 , 0 , P 4 0 , 1 , 1 , P 5 1 , 0 , 0 , P 6 1 , 0 , 1 , P 7 1 , 1 , 0 , and P 8 1 , 1 , 1 as stable equilibrium points.

3.2. The Stability of the Equilibrium Points

Based on Friedman’s research on the stability of replicator dynamic systems [56,57,58], the stability of the eight equilibrium points can be evaluated by constructing a Jacobian matrix and calculating its eigenvalues. The Jacobian matrix for the tripartite evolutionary game is shown as follows:
J = F ( x ) x F ( x ) y F ( x ) z F ( y ) x F ( y ) y F ( y ) z F ( z ) x F ( z ) y F ( z ) z = J 11 J 12 J 13 J 21 J 22 J 23 J 31 J 32 J 33
where
J 11 = ( 1 2 x ) y z 1 δ Q d + Δ Q d k 2 r 2 1 γ Q p + Δ Q p k 1 r 1 + f s Δ Q d + Δ r Δ Q p + z f s Q d Δ r Q 0 Q p C s J 12 = z x ( 1 x ) 1 δ Q d + Δ Q d k 2 r 2 1 γ Q p + Δ Q p k 1 r 1 + f s Δ Q d + Δ r Δ Q p J 13 = x ( 1 x ) y 1 δ Q d + Δ Q d k 2 r 2 1 γ Q p + Δ Q p k 1 r 1 + f s Δ Q d + Δ r Δ Q p + f s Q d Δ r Q 0 Q p J 21 = y ( 1 y ) z E g Δ Q d Δ Q p + k 1 r 1 Q p + Δ Q p k 2 r 2 Q d + Δ Q d + Δ E 2 Δ E 1 J 22 = ( 1 2 y ) x z E g Δ Q d Δ Q p + k 1 r 1 Q p + Δ Q p k 2 r 2 Q d + Δ Q d + Δ E 2 Δ E 1 + z E g Δ Q p k 1 r 1 Q p + Δ Q p + Δ E 1 C g J 23 = y ( 1 y ) x E g Δ Q d Δ Q p + k 1 r 1 Q p + Δ Q p k 2 r 2 Q d + Δ Q d + Δ E 2 Δ E 1 + E g Δ Q p k 1 r 1 Q p + Δ Q p + Δ E 1 J 31 = z ( 1 z ) y δ k 2 r 2 Q d + Δ Q d γ k 1 r 1 Q p + Δ Q p + r d + Δ r r t k b Δ Q d Δ r Q p Δ C l + Δ C t + U 2 U 1 + r d + Δ r r t k b Q d + Δ r Q 0 Q p C l + C t J 32 = z ( 1 z ) x δ k 2 r 2 Q d + Δ Q d γ k 1 r 1 Q p + Δ Q p + r d + Δ r r t k b Δ Q d Δ r Q p Δ C l + Δ C t + U s + γ k 1 r 1 Q p + Δ Q p + Δ r Δ Q p Δ C t J 33 = ( 1 2 z ) x y δ k 2 r 2 Q d + Δ Q d γ k 1 r 1 Q p + Δ Q p + r d + Δ r r t k b Δ Q d Δ r Q p Δ C l + Δ C t + x U 2 U 1 + r d + Δ r r t k b Q d + Δ r Q 0 Q p C l + C t + y U s + γ k 1 r 1 Q p + Δ Q p + Δ r Δ Q p Δ C t + U 1 + Δ r Q p C t
Table 4 analyzes the conditions under which P 1 ~ 8 become equilibrium points.
Then, we can reason about the equilibrium conditions for each possible equilibrium point by analyzing the realistic meaning of their eigenvalues in Table 5. Here, DNE (Does Not Exist) is applied when the point fails to satisfy any of the following conditions: (1) ESS, (2) saddle point, or (3) unstable point.
By substituting the eight equilibrium points into the Jacobian matrix, the evolutionary equilibrium points and their conditions are shown in Table 6. Here, “N” denotes indeterminate eigenvalue signs, “+” represents positive eigenvalues, and “-“ indicates negative eigenvalues. As shown in Table 6, no stable equilibrium is identified, suggesting that a stable state is not reached among EV aggregators, the local government, and EV users. However, five saddle points are observed, and under specific conditions, these equilibrium points may lead the tripartite evolutionary game to a stable state. The next section will explore the conditions under which these three stakeholders can establish evolutionarily stable strategies.

4. Discussion

As indicated in Table 3, five saddle points have been identified: P 1 0 , 0 , 0 , P 2 0 , 0 , 1 , P 4 0 , 1 , 1 , P 6 1 , 0 , 1 , and P 8 1 , 1 , 1 . In the subsequent analysis, we will evaluate the stability conditions associated with each saddle point, while categorizing the VGI dynamic evolutionary process into three distinct stages: the initial phase (V0G), the growth phase (V1G), and the maturity phase (V2G).

4.1. The Initial Phase: V0G Mode

Scenario 1  P 1 0 , 0 , 0 : When A 8 < 0 , the tripartite evolutionary game reaches a stable state. In this case, the EV aggregators choose the V1G strategy, the local do not provide the subsidy, while EV users not to participate in VGI.
Scenario 1 suggests that when the market’s peak–valley price difference remains below the threshold ( Δ r < C t U 1 / Q p ), the savings in charging costs Δ r Q p for EV users participating in V1G mode, under the local government’s non-subsidy policy, are not enough to offset the losses caused C t by longer charging times. Moreover, the benefits gained from discharging in the bidirectional VGI mode fail to cover the costs associated with battery wear. Consequently, EV users are not motivated to engage in VGI. At the same time, due to limited regional scale effects in VGI and the high costs of upgrading to V2G infrastructure, EV aggregators also lack an incentive to invest in equipment upgrades and adopt the V2G strategy.
Conclusion 1: The evolutionarily stable strategy P 1 0 , 0 , 0 represents the initial development phase of VGI, where attempts by EV aggregators to implement unidirectional VGI (V1G) services are obstructed by three systemic barriers: (i) a lack of sufficient price signals within electricity markets, (ii) inadequate policy frameworks, and (iii) low alignment among stakeholders. These challenges, coupled with EV users’ behavioral inertia and cognitive limitations regarding the adoption of new technologies, lead to suboptimal participation rates. Our analysis indicates that targeted government intervention—through improved discharge compensation mechanisms (e.g., time-variable pricing premiums) and structured fiscal incentives (e.g., phased tax exemptions and technology-specific subsidies)—is essential to address these market failures and facilitate the broader adoption of VGI.

4.2. The Growth Phase: V1G Mode

Scenario 2  P 2 0 , 0 , 1 : When A 8 > 0 , A 5 C s < 0 , and A 6 C g < 0 , the tripartite evolutionary game reaches a stable state. In this case, EV aggregators adopt the V1G strategy, the local government does not provide subsidies, and EV users participate in V1G.
Scenario 2 illustrates that when the peak–valley price difference is large, and the local government’s savings from peak-shaving costs cannot offset subsidy payments and regulation costs, policy intervention becomes unjustified. Nevertheless, the charging cost savings adequately compensate users for their time costs, thus encouraging voluntary participation in V1G. During the growth phase of the VGI market, EV aggregators, however, face constrained profitability due to high upgrade costs and a limited user base, which diminishes the incentives to invest in V2G infrastructure.
Scenario 3  P 4 0 , 1 , 1 : When A 7 + A 8 > 0 , A 5 + A 7 C s < 0 , and A 6 C g > 0 , the system stabilizes, with EV aggregators choosing the V1G strategy, the local government adopting a subsidy strategy, and EV users participating in V1G.
This scenario generally emerges at a specific developmental stage of the VGI market, marked by a substantial peak–valley price difference and elevated grid upgrade costs. In this context, with government regulatory expenses being relatively manageable and the implementation of subsidy policies potentially generating significant environmental benefits, the government aims to foster greater participation in VGI by offering moderate financial incentives to EV aggregators. However, the existing subsidy levels are insufficient to cover the equipment upgrade costs necessary for EV aggregators to adopt the bidirectional VGI mode (V2G). Moreover, the lack of notable improvements in the overall benefits for users participating in the V2G mode leads all stakeholders to prefer engaging in the unidirectional VGI mode (V1G).
Conclusion 2: The evolutionarily stable strategies P 2 0 , 0 , 1 and P 4 0 , 1 , 1 delineate the growth phase in the development of the VGI market. Influenced by the peak–valley price difference, VGI progresses from the initial disordered charging phase (V0G) to the unidirectional VGI mode (V1G). During this phase, the primary factors shaping the development models include the peak-shaving benefits and regulatory costs for the local government, the subsidy levels, and the subsidy-sharing ratio.

4.3. The Maturity Phase: V2G Mode

Scenario 4  P 6 1 , 0 , 1 : When A 4 + A 8 > 0 , A 2 + A 6 C g < 0 , and A 5 C s > 0 , the tripartite evolutionary game reaches a stable equilibrium, where EV aggregators choose the V2G strategy, the local government chooses the no-subsidy strategy, and EV users participate in V2G.
Scenario 4 demonstrates that when the peak–valley price differential in the electricity market is sufficiently small, the combined benefits of peak-shaving cost savings and environmental benefits for the local government fail to outweigh its subsidy expenditures and regulatory costs. Consequently, the local government opts for a no-subsidy policy. Conversely, if EV aggregators face relatively low upgrade costs, a significant peak–valley price differential creates strong economic incentives, promoting the adoption of V2G strategies. Moreover, when the peak–valley price gap is pronounced, V2G infrastructure coverage is adequate, and EV aggregators wield substantial influence, EV users exhibit greater willingness to voluntarily engage in V2G modes.
Scenario 5  P 8 1 , 1 , 1 : When A 1 + A 3 + A 4 + A 7 + A 8 > 0 , A 2 + A 6 C g > 0 , and A 1 + A 5 C s > 0 , the system stabilizes and EV aggregators choose the V2G strategy, the local government chooses the subsidy strategy, and EV users participate in V2G.
Scenario 5 indicates that when the EV adoption reaches a critical mass, local government policies are well established, the grid’s ancillary services market is well developed, V2G infrastructure upgrade costs decline, and EV aggregators are more inclined to adopt the V2G strategy. Moreover, the combined benefits derived from peak-shaving cost savings and environmental benefits are sufficient to cover subsidy expenditures and regulatory costs. In light of the urgent need for carbon neutrality and energy transition, the local governments are compelled to provide subsidies to EV aggregators. Within this enabling framework, facilitated by collaboration between EV aggregators and policymakers, EV users are willing to participate in the bidirectional VGI mode (V2G).
Conclusion 3: The evolutionarily stable strategies P 6 1 , 0 , 1 and P 8 1 , 1 , 1 correspond to the maturity phase of the VGI market, while societal awareness of VGI increases, alongside the maturation of VGI technology and the improvement of incentive subsidy mechanisms. During this phase, the VGI market follows a comprehensive development path that combines market-driven endogenous forces with external policy regulation. The primary factors influencing the development models in this phase include the peak-shaving benefits and regulatory costs for the local government, the subsidy level, and the subsidy-sharing ratio.
The analysis above indicates that the peak–valley price difference, peak-shaving costs, the strength of local government subsidies, upgrade costs, subsidy-sharing ratios, and EV users’ loss aversion significantly influence the evolutionary stability of the game system. These factors govern the system’s progression through various development stages. Based on this analysis, the dynamic evolution of VGI market development is illustrated in Figure 1.

5. Numerical Simulation of Tripartite Evolutionary Game Model

To further validate the effectiveness of the theory and to provide a clearer and more intuitive demonstration of the impact of relevant factors on the model’s evolutionary outcomes, as well as the dynamic evolutionary paths of EV aggregators and local government strategy choices under various constraints, a numerical simulation analysis of five scenarios was conducted, as shown in Figure 2. The parameter settings are provided in Table 7, and the data sources are listed in Appendix A.
As shown in Figure 2, the numerical simulation results of five scenarios (Case 1 to Case 5) reveal that the tripartite evolutionary game system reached different stable equilibrium states. In Scenario 1, the system converged to the equilibrium point P 1 0 , 0 , 0 ; in Scenario 2, it converged to P 2 0 , 0 , 1 ; in Scenario 3, it converged to P 4 0 , 1 , 1 ; in Scenario 4, it converged to P 6 1 , 0 , 1 ; and in Scenario 5, the system stabilized at P 8 1 , 1 , 1 .
Next, we conduct a systematic sensitivity analysis (Section 5.1, Section 5.2 and Section 5.3) to quantify how critical operational parameters influence the evolutionary equilibria in the tripartite vehicle–grid interaction (VGI) system. The analysis focuses on seven key determinants: (i) peak–valley price difference, (ii) peak-shaving benefits, (iii) local government subsidies, (iv) regulatory costs, (v) upgrade costs, (vi) subsidy levels, and (vii) loss aversion coefficients, with Case 3 serving as the baseline scenario.

5.1. The Initial Phase: V0G Mode

In the initial phase (V0G), the peak–valley price difference Δ r plays a pivotal role in the formation of equilibrium.

5.1.1. Impact of Peak–Valley Price Difference on System Evolution

Figure 3 elucidates the dynamic mechanisms through which the peak–valley price difference Δ r influences the system’s evolutionary equilibrium and tripartite strategy selection. As shown in Figure 3a, the system equilibrium shifts from P 1 0 , 0 , 0 to P 4 0 , 1 , 1 as Δ r increases, confirming the significant positive incentive effect of electricity price differentials on EV users’ strategies. Furthermore, Figure 3b reveals a monotonic increasing relationship between EV users’ willingness to participate in VGI, and Δ r validates the effectiveness of price-based policies in guiding managed charging through cost modulation. Notably, when Δ r = 0.1 , the intensity of local government subsidies exhibits a distinct inverted U-shaped pattern. This finding suggests the existence of an optimal threshold effect in policy intervention: Subsidy policies can only achieve their intended effects when EV users’ participation exceeds a critical threshold.

5.1.2. Impact of Loss Aversion Costs on System Evolution

Figure 4 illustrates the effects of loss aversion costs C t on the system’s evolutionary trajectory and tripartite interactions. As shown in Figure 4a, with parameters Δ r = 0.5 and r 1 = 0.8 , the system converges to a stable equilibrium point P 4 0 , 1 , 1 . Furthermore, Figure 4b reveals a negative correlation between EV users’ loss aversion costs and their willingness to participate in VGI. Specifically, as loss aversion costs decrease, the system transitions from unmanaged charging mode (V0G) to unidirectional VGI mode (V1G). These findings suggest that reducing loss aversion costs—facilitated by enhanced social awareness and improved VGI infrastructure—can effectively promote EV users’ adoption of V1G strategies. Additionally, lower loss aversion costs and reduced entry barriers incentivize the local government to implement active policy measures, such as subsidies.
The simulation results presented in Figure 3 and Figure 4 collectively illustrate the impact and evolutionary patterns associated with the peak–valley price difference and loss aversion costs on the behavioral choices of game participants, including local governments, users, and aggregators, during the unmanaged charging phase. This study reveals that the peak–valley price difference acts as a critical driver for the transition of the VGI market from the unmanaged charging phase (V0G) to unidirectional VGI phase (V1G). There exist significant regional and seasonal variations in electricity pricing due to disparities among provinces and municipalities in economic development levels, industrial structure, energy mix, climatic conditions, electricity market maturity, and policy implementation intensity. Specifically, (1) regions characterized by moderate economic growth, low-energy-consumption industrial structures, stable power sources (e.g., thermal and nuclear), adequate flexible grid resources, and less developed electricity markets tend to exhibit smaller peak–valley price differences, thereby creating weaker market-driven incentives for VGI development and less favorable conditions for aggregators and local governments in deploying VGI infrastructure; (2) in contrast, regions that experience rapid economic growth, energy-intensive concentrated industries, dominance of climate-dependent hydro power, and advanced electricity markets possess inherent advantages for VGI market development, owing to the earlier implementation of time-of-use pricing or peak pricing policies. Notably, during the transition from unmanaged to managed charging, the EV users’ loss aversion costs significantly influence their willingness to participate. To address this, the local governments should enhance public awareness campaigns and actively guide users toward managed charging behaviors through educational initiatives, while EV aggregators should leverage existing charging infrastructure to improve service networks and optimize technical solutions—such as reducing service fees or enhancing bidirectional charging technologies—to enrich user experience and service convenience.

5.2. The Growth Phase: V1G Mode

In the growth phase (V1G), we examine how variations in key parameters r 1 , E g , C g , and γ influence the system’s evolutionary trajectories.

5.2.1. Impact of Peak-Shaving Benefits and Regulatory Costs on System Evolution

Figure 5 illustrates the effects of peak-shaving benefits E g and regulatory costs C g on the system’s evolutionary path and the local government strategy. As depicted in Figure 5a, under parameter settings Δ r = 0.5 and r 1 = 0.8 , the system stabilizes at the equilibrium point P 4 0 , 1 , 1 . Moreover, Figure 5b indicates a positive relationship between peak-shaving benefits and subsidy adoption, whereas regulatory costs exhibit a negative association with subsidy levels. Specifically, increasing peak-shaving benefits drive the local government to transition from a non-subsidy to a subsidy strategy, with growing willingness to subsidize. This implies that severe power supply–demand imbalances and substantial environmental advantages are critical factors motivating local governments to enact subsidy policies. Conversely, elevated regulatory costs reduce the government’s inclination toward subsidy strategies.

5.2.2. Impact of Subsidy Levels on System Evolution

Figure 6 demonstrates the influence of the local government subsidy levels r 1 on the system’s evolutionary trajectory. As depicted in Figure 6a, under parameter settings with peak-shaving benefits and regulatory costs of E g = 0.48 and C g = 600 , the system converges to equilibrium point P 4 0 , 1 , 1 . Figure 6b further reveals a phase-dependent evolutionary pattern: When r 1 0.1 , 0.3 , the system evolves toward a subsidized managed charging mode, while when r 1 0.4 , 0.5 , the local government withdraws subsidies due to fiscal constraints, leading to an unsubsidized managed charging mode. These results indicate that subsidies can promote orderly market development within optimal ranges, but excessively high subsidy standards may yield counterproductive policy effects, potentially impeding the sustainable growth of VGI markets.

5.2.3. Impact of Subsidy-Sharing Ratio on System Evolution

Figure 7 demonstrates the influence of the subsidy-sharing ratio γ for EV aggregators in the V1G mode on the system’s evolutionary trajectory. As depicted, when γ 0.1 , 0.2 , 0.3 , 0.4 , 0.5 , the system converges to equilibrium point P 4 0 , 1 , 1 . Specifically, at γ = 0.3 , the evolutionary rate increases, resulting in faster convergence to the equilibrium. The findings reveal that variations in the subsidy-sharing ratio under the unidirectional VGI mode (V1G) do not affect the ultimate convergence to a stable state. However, a lower subsidy-sharing ratio accelerates EV aggregators’ adoption of the managed charging strategy, while concurrently slowing EV users’ progression toward VGI participation.
The simulation results presented in Figure 5 and Figure 6 illustrate how peak-shaving benefits, regulatory costs, subsidy levels, and revenue-sharing ratios collectively influence stakeholder behavior during the unidirectional VGI phase (V1G). Key findings include: (1) a positive correlation between peak-shaving benefits and government incentives; regions with higher demands for grid flexibility—particularly those that are fossil fuel-dependent or reliant on electricity imports—exhibit stronger policy implementation due to greater system benefits; (2) an inverse relationship between regulatory costs and policy adoption; however, mature electricity markets achieve lower unit costs through well-established regulatory frameworks; (3) although subsidies effectively enhance user participation in V1G mode, they require careful calibration to avoid fiscal inefficiency, necessitating public–private coordination to maintain incentive effects, while promoting technological advancement; and (4) during market incubation, the sharing ratio for unidirectional VGI should remain within an optimal range to balance stakeholder interests, ensuring both user participation and market stability.

5.3. The Maturity Phase: V2G Mode

During the maturity phase of VGI, all three participates adopt bidirectional VGI strategy (V2G). This section investigates how variations in the key parameters r 2 , δ , and C s influence the system’s evolutionary trajectories.

5.3.1. Impact of Subsidy on System Evolution

Figure 8 demonstrates the influence of local government subsidies r 2 on the system’s evolutionary trajectory and EV aggregators’ strategies. When γ = 0.3 , the system converges more rapidly toward the equilibrium point P 4 0 , 1 , 1 . As depicted in Figure 8a, increasing subsidy levels accelerate the transition from V1G mode to V2G mode. Figure 8b reveals that when r 2 = 0.1 , subsidies remain inadequate to motivate EV aggregators to pay for V2G infrastructure upgrades. However, when r 2 0.2 , 0.3 , 0.4 , 0.5 , EV aggregator behavior exhibits a U-shaped response, initially declining, before rising substantially. This pattern suggests a critical subsidy window for triggering technological upgrades, where higher subsidies correspond to shorter transition periods. The observed dynamics stem from two competing effects: At lower subsidy levels, EV aggregators profit sufficiently from the unidirectional VGI mode, temporarily reducing upgrade incentives. However, as the long-term returns on infrastructure investments materialize, EV aggregators ultimately shift to bidirectional VGI mode.

5.3.2. Impact of Subsidy-Sharing Ratio on System Evolution

Figure 9 illustrates that variations in subsidy-sharing ratio significantly influence EV aggregators’ strategic choices. Specifically, when δ 0.1 , 0.2 , 0.3 , the system converges to the stable strategy E 8 1 , 1 , 1 , whereas for δ 0.4 , 0.5 , the equilibrium shifts to E 4 0 , 1 , 1 . This implies that an excessively high subsidy-sharing ratio leads EV aggregators to favor a unidirectional VGI strategy (V2G) due to revenue optimization motives. Furthermore, Figure 9b shows that the EV aggregators’ willingness to adopt the bidirectional VGI strategy (V2G) follows a U-shaped trend, with δ 0.1 , 0.2 , 0.3 . This trend indicates that initial adoption barriers, such as high upgrade costs and significant revenue sharing with EV users, temporarily reduce returns. However, expanding the EV user base and achieving bidirectional technological scale effects gradually enhance EV aggregators’ profitability, which in turn incentivizes the adoption of V2G strategies.

5.3.3. Impact of Upgrade Costs on System Evolution

Figure 10 demonstrates the influence of upgrade costs C s on the evolutionary trajectory. As depicted in Figure 10a, the system stabilizes at the equilibrium point P 4 0 , 1 , 1 with C s 300 , 450 , 600 and δ = 0.3 . The results suggest that upgrade costs significantly affect EV aggregators’ strategic decisions: When costs are prohibitively high, EV aggregators prefer the unidirectional VGI mode (V1G). Further examination of Figure 10b shows that EV aggregators’ adoption willingness for bidirectional VGI mode (V2G) follows a U-shaped pattern, while C s 300 , 450 . This implies that the V2G strategy has a critical adoption phase: in the early transition stage, the substantial upgrade costs and a constrained market size yield inadequate returns, causing a temporary reduction in EV aggregators’ willingness to engage. However, as the EV user base expands and revenues grow, this eventually drives the system toward V2G mode.

5.3.4. Impact of Subsidy Levels on System Evolution

Figure 11 illustrates the impact of local government subsidy levels on the system’s evolutionary trajectory and the strategic decisions of EV aggregators. As shown in Figure 11a, the system stabilizes at the equilibrium point P 8 1 , 1 , 1 while C s = 600 . The results further indicate that reducing subsidy levels for V1G mode or increasing subsidies for V2G mode enhances EV aggregators’ propensity to adopt the bidirectional VGI strategy. Figure 11b suggests that the relative disparity in subsidies exerts a greater influence than absolute subsidy values. Specifically, widening the subsidy gap between V2G and V1G (i.e., r 2 r 1 ) strengthens EV aggregators’ engagement with the V2G strategy. In other words, maintaining a high V1G subsidy hinders effective market transition, even with elevated V2G subsidies. In contrast, substantially raising the V2G subsidy, while moderately reducing the V1G subsidy, creates a significant incentive effect, significantly boosting participation in bidirectional interactions among EV aggregators and users.
The simulation results presented in Figure 8, Figure 9 and Figure 11 illustrate that during the bidirectional VGI phase (V2G), the upgrade costs for EV aggregators, the subsidy levels of local governments, and the subsidy-sharing ratio collectively influence the behavioral choices of all three participants. The study reveals that (1) in the early stages of V2G market development, upgrade costs are the key factor determining whether aggregators enter the bidirectional VGI mode. Local governments can effectively lower entry barriers for aggregators and accelerate market formation by implementing specialized subsidies for station construction or retrofitting; (2) government subsidies and the subsidy-sharing ratio require coordinated optimization. On the one hand, government subsidies significantly promote EV aggregators’ adoption of V2G modes; however, the subsidy levels must be appropriately calibrated—subsidies that are too low fail to stimulate technological upgrades, while excessively high subsidies may dampen enthusiasm for existing modes. On the other hand, the subsidy-sharing ratio should be maintained within a reasonable range to prevent suppression of aggregators’ willingness to participate when subsidies are low, while ensuring balanced benefits for all parties; (3) during the transition from V1G to V2G modes, differentiated subsidy policies are particularly crucial: when subsidies in V1G mode remain high, even equally high subsidies for V2G mode may not facilitate mode transition. However, appropriately reducing subsidies for V1G mode while increasing subsidies for V2G mode to create a reasonable subsidy differential will significantly incentivize EV aggregators and EV users to participate in the V2G strategy. Consequently, local governments must holistically consider subsidy policies for both modes, employing differentiated incentives to more effectively guide the market toward bidirectional interaction development.

6. Conclusions and Recommendations

6.1. Main Conclusion

The widespread adoption of electric vehicles significantly enhances power system operations through intelligent unidirectional charging and bidirectional charging/discharging technologies. These approaches effectively reduce the reserve capacity requirements of conventional thermal power plants, while improving overall grid stability. This dual-benefit strategy addresses two critical challenges: mitigating supply–demand imbalances caused by high renewable energy penetration, and optimizing grid asset utilization to reduce system upgrade costs. The resulting socioeconomic benefits can play a crucial role in supporting the achievement of carbon neutrality goals.
To overcome the limitations of traditional single-objective optimization and agent-based models in capturing bounded rational decision-making among multiple stakeholders in electricity markets, this study proposes an innovative, policy-sensitive dynamic game theory framework. Our tripartite evolutionary game model of VGI markets systematically identifies equilibrium conditions at various development stages and their dynamic evolution. This framework provides policymakers and market designers with a comprehensive evolutionary roadmap (Figure 1), demonstrating how key factors, such as subsidy levels, user-perceived value, battery degradation costs, and infrastructure upgrade costs, interact to shape government subsidy policies, aggregator strategies, and user participation behaviors. These insights offer a deeper understanding of VGI market development pathways, support decision-making for market participants in developing differentiated strategies, provide practical guidance for governments in designing economically efficient subsidy mechanisms, and lay the theoretical foundations for optimizing the economic transmission value of VGI systems. The main findings of this paper are as follows:
(1)
The quadrilateral game involving EV aggregators, local governments, and EV users lacks a stable equilibrium point, instead exhibiting five saddle points: P 1 0 , 0 , 0 , P 2 0 , 0 , 1 , P 4 0 , 1 , 1 , P 6 1 , 0 , 1 , and P 8 1 , 1 , 1 . Stable, sustainable cooperation among the three parties requires specific conditions.
(2)
The VGI market exhibits three distinct evolutionary phases: initial phase (V0G), growth phase (V1G), and maturity phase (V2G). Initially, EV users exhibit low willingness to participate in VGI. However, as social awareness improves, technology matures, and incentive mechanisms are refined, and the VGI market gradually evolves toward a more mature stage.
(3)
The transformation of the VGI market is mainly driven by (i) peak–valley price difference, (ii) peak-shaving benefits, (iii) local government subsidies, (iv) regulatory costs, (v) upgrade costs, (vi) subsidy levels, and (vii) loss aversion coefficients. The peak–valley price difference is the primary driver for the transition from V0G mode to V1G mode. EV aggregators may be reluctant to adopt the bidirectional interaction strategy due to high upgrade costs. Additionally, peak-shaving benefits and regulatory costs influence whether the local government implements subsidy policies. Furthermore, appropriately increasing subsidy levels can enhance the willingness of both EV users and EV aggregators to participate.

6.2. Policy Implications

Based on these conclusions, this paper offers the following managerial insights:
(1)
For local governments, implementing differentiated policy designs and dynamic regulatory mechanisms is critical to facilitate orderly development of the vehicle–grid integration (VGI) market. Specific measures include (i) adopting time-of-use electricity pricing schemes that account for regional economic conditions and energy structures; (ii) developing multi-dimensional subsidy programs with appropriate caps to encourage electric vehicle (EV) user participation, while avoiding policy dependency; (iii) optimizing regulatory frameworks to improve EV aggregators’ operational efficiency; (iv) supporting digital platform development to streamline policy implementation; and (v) conducting public awareness campaigns to promote VGI participation and social responsibility.
(2)
For EV aggregators, establishing sustainable user engagement mechanisms that combine economic incentives with service quality assurance is paramount. During the V1G phase, aggregators should enhance user benefits through equitable revenue-sharing models and reliable service offerings. When transitioning to V2G mode, firms must strategically evaluate upgrade costs against potential subsidy benefits, utilizing government support to overcome technological barriers. From a regional perspective, EV aggregators should focus operations on areas exhibiting substantial peak–valley electricity price differentials and more liberalized energy markets, to maximize profitability.

6.3. Future Research Recommendations

Building on this study, future work will focus on five key directions: (1) An integrated framework combining deep reinforcement learning with dynamic game theory could be developed. This framework would incorporate machine learning prediction modules, based on users’ historical charging data and mobility patterns, real-time grid status monitoring systems, and dynamic quantification modules for technical parameters (such as charging/discharging efficiency and battery degradation coefficients), to improve behavior prediction and strategy optimization. (2) Focused evaluations should examine the impact mechanisms of emerging technologies, such as smart charging stations and vehicle-to-home (V2H) systems, on grid regulation capacity and market structure, while developing quantitative models to analyze technology synergy effects. (3) Regarding policy design, there is a need to develop dynamic subsidy mechanisms that account for regional differences, create precise models for measuring V2G carbon reduction benefits, and optimize the designing of rules for capacity and ancillary service markets. (4) Particular emphasis should be placed on leveraging empirical data from Shenzhen’s V2G demonstration zone and the Netherlands’ Joule Project to build a multidimensional evaluation system encompassing technical feasibility, economic viability, and social acceptance, thereby providing real-world scenario validation for models. (5) Agent-based modeling approaches can effectively capture the heterogeneous behavioral characteristics of different user groups (e.g., commuters and ride-hailing drivers), simulating adaptive responses to policy interventions through embedded dynamic learning mechanisms. Advancing these research directions will significantly improve the predictive accuracy of vehicle–grid interaction systems and enhance their policy guidance value, thus providing more scientifically sound decision-making support for the development of new power systems.

Author Contributions

Conceptualization, Y.L.; Funding acquisition J.C.; Methodology, Q.S., Y.L., and J.C.; Project administration, Y.L.; Supervision, Q.S. and J.C.; Validation, Q.S., Y.L., and J.C.; Writing—original draft, Q.S., Y.L., and J.C.; Writing—review and editing, Q.S., Y.L., and J.C.; Visualization Q.S. and Y.L. All authors have read and agreed to the published version of the manuscript.

Funding

This research was funded by the Key Project of the National Social Science Foundation of China (Grant No. 22AZD127, funder: J.C.), and the National Natural Science Foundation of China (Grant Nos. 72274175 and 71874159, funder: J.C.).

Institutional Review Board Statement

Not applicable.

Informed Consent Statement

Not applicable.

Data Availability Statement

Data are contained within the article.

Conflicts of Interest

The authors declare no conflicts of interest.

Appendix A. Data Sources

This study utilized data from the 2024 China New Energy Vehicle Usage Report. Currently, 68.1% of the battery capacity of new energy passenger vehicles range between 30 kWh and 80 kWh, with an average of 2.9 charging sessions per week [59]. Of these vehicles, 69.9% initiate charging with over 30% battery capacity remaining, while 57.1% complete charging with more than 95% battery capacity. Assuming each electric vehicle undergoes unmanaged charging 10 times per month, with an average battery capacity of 64 kWh [60], an initial charge of 40%, and a final charge of 90% [61], the energy charged per vehicle per session is calculated at 32 kWh [62].
According to the Notice on Promoting the Large-Scale Application of Vehicle-Grid Integration Pilot Projects, the total discharge power of V2G projects must not be less than 500 kW [63]. Therefore, this study conducted a simulation involving a cluster of 50 electric vehicles, with the EV aggregator coordinating the vehicles to participate in VGI in either V1G or V2G mode. Based on electric vehicle usage and charging patterns, the peak-shaving depth was set between 30% and 70%, while the discharge depth was adjusted between 20% and 50%, and the discharge frequency n 5 , 15 [64].
Drawing from the findings of the 2023 China Electric Vehicle User Charging Behavior Study Report, the perceived utility for EV users participating in V1G and V2G under various government policies was set at 2 CNY, 4 CNY, 12 CNY, and 14 CNY per month, respectively [65]. This study also accounted for energy losses during the charging and discharging processes, as well as battery degradation costs. Research by Yue et al. [64] indicates that the energy loss cost for EVs participating in V2G is 0.19 CNY/kWh, while the battery lifetime degradation cost is 0.26 CNY/kWh.
In the context of government subsidies, the subsidy response coefficients were set to 1, with the subsidy benchmark established at the upper limit of Guizhou’s demand response price of 1.5 CNY/kWh, and the regulatory cost set at 600 CNY [66]. The environmental benefits generated by V1G and V2G modes were valued at CNY 1000 and CNY 2000, respectively. The subsidy-sharing ratios provided by the EV aggregator to EV users in both modes were set at 0.3. The unit peak-shaving benefit E g obtained by local governments was determined based on contemporaneous peak-shaving generator electricity price data [67]. Currently, the feed-in tariff for peak-shaving prices in China ranges from 0.4 to 1.0 CNY/kWh [68,69].
Time-of-use electricity prices and charging service fees were established according to real-world data from various provinces and municipalities in China. For instance, in February 2025, based on proxy procurement prices published by provincial grid companies, the peak electricity prices for general commercial and industrial users ranged from 0.4 to 1.5 CNY/kWh, while off-peak prices varied from 0.1 to 0.5 CNY/kWh. The maximum peak–valley price differentials ranged between 0.1 and 1.3 CNY/kWh, with 21 provinces exceeding 0.6 CNY/kWh. Since no unified pricing policy exists for discharging tariffs under the V2G mode, we assumed that r t = r d , following Pan et al. [67]. The time-of-use discharging price range was set at 0.2–1.4 CNY/kWh [64]. Charging service fees also exhibit significant variation across China, with Zhengzhou having the lowest service fees nationwide, maintained at a range of 0.05–0.35 CNY/kWh. According to the Government-Priced Operational Service Charge Catalog (2023 Edition), the guided pricing range for charging service fees is between 0.4 and 1.3 CNY/kWh [70].

References

  1. Wei, Y.F.; Han, X.B.; Lu, L.G.; Wang, H.W.; Li, J.Q.; Ouyang, M.G. Technology Prospects of Carbon Neutrality-oriented New-energy Vehicles and Vehicle-grid Interaction. Automot. Eng. 2022, 44, 444, 449–464. [Google Scholar] [CrossRef]
  2. Zhong, H.W.; Zhang, N.; Du, E.S.; Guo, H.Y.; Cai, Y.J.; Wang, P.; Gao, H.C.; Li, Y.W.; Liu, X.; Kang, C.Q.; et al. Planning, Operation and Market of New Power System: Research Progress and Practice. Proc. CSEE 2024, 44, 7084–7104. [Google Scholar] [CrossRef]
  3. Li, Z.; Li, W.Q.; Zhang, Z.W.; Chang, G.; Lyu, J.F.; Yue, G.X.; Li, L.C.; Ni, W.D. Development Strategy of Flexible Resources in China’s Power System under the Carbon Peaking and Carbon Neutrality Goals. Strateg. Study CAE 2024, 26, 108–120. [Google Scholar] [CrossRef]
  4. Li, Y.L.; Ouyang, M.G.; Zhao, Z.M. Charging Mechanism, System Configuration and Promotion Pathway of Vehicle to Grid for Electric Vehicles. Proc. CSEE 2024, 44, 6920–6940. [Google Scholar] [CrossRef]
  5. Wang, H.X.; Yuan, J.H.; Chen, Z.; Ma, Y.M.; Dong, H.N.; Yuan, S.; Yang, J.Y. Review and Prospect of Key Techniques for Vehicle-Station-Network Integrated Operation in Smart City. Trans. China Electrotech. Soc. 2022, 37, 112–132. [Google Scholar] [CrossRef]
  6. Jazaeri, J. Demand Side Management in China: Market, Policies, and Future Trends. In Proceedings of the 2022 IEEE Sustainable Power and Energy Conference (iSPEC), Perth, Australia, 4–7 December 2022; pp. 1–4. [Google Scholar] [CrossRef]
  7. Kang, M.; Lee, B.; Lee, Y. A Robust Optimization Approach for E-Bus Charging and Discharging Scheduling with Vehicle-to-Grid Integration. Mathematics 2025, 13, 1380. [Google Scholar] [CrossRef]
  8. Shen, X.; Tang, J.; Zhang, Y.; Qian, B.; Li, J.; Zhou, M.; Zhao, Y.; Yin, Y. Dynamic Evolution Game Strategy of Government, Power Grid, and Users in Electricity Market Demand-Side Management. Mathematics 2024, 12, 3249. [Google Scholar] [CrossRef]
  9. Mas’ud, A.A.; Wirba, A.V.; Mohammad-Sukki, F.; Sha’aban, Y.A. An Overview of Electrical Vehicle and Smart Grid Technology. In Key Themes in Energy Management: A Compilation of Current Practices, Research Advances, and Future Opportunities; Yunusa-Kaltungo, A., Ed.; Springer Nature Switzerland: Cham, Switzerland, 2024; pp. 71–90. [Google Scholar] [CrossRef]
  10. Hadian, E.; Akbari, H.; Farzinfar, M.; Saeed, S. Optimal Allocation of Electric Vehicle Charging Stations with Adopted Smart Charging/Discharging Schedule. IEEE Access 2020, 8, 196908–196919. [Google Scholar] [CrossRef]
  11. Ahmadi, S.E.; Kazemi-Razi, S.M.; Marzband, M.; Ikpehai, A.; Abusorrah, A. Multi-Objective Stochastic Techno-Economic-Environmental Optimization of Distribution Networks with G2V and V2G Systems. Electr. Power Syst. Res. 2023, 218, 109195. [Google Scholar] [CrossRef]
  12. Hakam, Y.; Gaga, A.; Tabaa, M.; El Hadadi, B. Enhancing Electric Vehicle Charger Performance with Synchronous Boost and Model Predictive Control for Vehicle-to-Grid Integration. Energies 2024, 17, 1787. [Google Scholar] [CrossRef]
  13. Lee, H.-G.; Choi, J.-W.; Ryu, S.-T.; Lee, K.-J. Life Degradation of Lithium-Ion Batteries under Vehicle-to-Grid Operations Based on a Multi-Physics Model. Int. J. Automot. Technol. 2025, 26, 315–326. [Google Scholar] [CrossRef]
  14. Sovacool, B.K.; Kester, J.; Noel, L.; Zarazua de Rubens, G. Actors, Business Models, and Innovation Activity Systems for Vehicle-to-Grid (V2G) Technology: A Comprehensive Review. Renew. Sustain. Energy Rev. 2020, 131, 109963. [Google Scholar] [CrossRef]
  15. Jaworski, J.; Zheng, N.; Preindl, M.; Xu, B. Vehicle-to-Grid Fleet Service Provision Considering Nonlinear Battery Behaviors. IEEE Trans. Transp. Electrif. 2024, 10, 2945–2955. [Google Scholar] [CrossRef]
  16. Wu, J.; Li, L.; Zhang, J.; Xiao, B. Flexibility Estimation of Electric Vehicles and Its Impact on the Future Power Grid. Int. J. Electr. Power Energy Syst. 2025, 164, 110435. [Google Scholar] [CrossRef]
  17. Zagrajek, K.; Paska, J.; Sosnowski, Ł.; Gobosz, K.; Wróblewski, K. Framework for the Introduction of Vehicle-to-Grid Technology into the Polish Electricity Market. Energies 2021, 14, 3673. [Google Scholar] [CrossRef]
  18. Zhao, X.; Zhang, Y.X.; Li, B.; Diao, X.H.; Li, T.Y.; Jiang, L.R.; Zhang, J. Effect Analysis and Development Suggestion of Domestic and Foreign Vehicle-Grid Integration Pilots. Electr. Power Autom. Equip. 2022, 42, 280–292. [Google Scholar] [CrossRef]
  19. Cheng, P.; Wang, T. Optimizing the Emission Control Policies and Trade-in Program Effects: A Carbon-Constrained Closed-Loop Supply Chain Network Model. Transp. Res. Part E Logist. Transp. Rev. 2023, 179, 103311. [Google Scholar] [CrossRef]
  20. Mediwaththe, C.P.; Smith, D.B. Game-Theoretic Electric Vehicle Charging Management Resilient to Non-Ideal User Behavior. IEEE Trans. Intell. Transp. Syst. 2018, 19, 3486–3495. [Google Scholar] [CrossRef]
  21. Brandt, T.; Wagner, S.; Neumann, D. Evaluating a Business Model for Vehicle-Grid Integration: Evidence from Germany. Transp. Res. Part D Transp. Environ. 2017, 50, 488–504. [Google Scholar] [CrossRef]
  22. Wang, X.; Wang, X.; Liu, Z.; Wang, W.; Sun, Q.; Pan, A.; Dou, J. A Stackelberg Game-Based Incentive Mechanism and Discharge Guidance Strategy for Private Electric Vehicles for Distribution Systems Load Restoration. Int. J. Electr. Power Energy Syst. 2024, 159, 110023. [Google Scholar] [CrossRef]
  23. Nagy, A.; Salama, M.M.; Abdelhadi, H.A.; Lotfy, M.E.; Abdelfattah, W. Optimizing DOCRs Coordination When Synergizing Energy Management with V2G Using Innovative Optimization Algorithms. Results Eng. 2024, 22, 102196. [Google Scholar] [CrossRef]
  24. Liu, D.; Wang, W.; Wang, L.; Jia, H.; Shi, M. Dynamic Pricing Strategy of Electric Vehicle Aggregators Based on DDPG Reinforcement Learning Algorithm. IEEE Access 2021, 9, 21556–21566. [Google Scholar] [CrossRef]
  25. Li, D.D.; Lin, W.Y.; Gao, W.W.; Shang, C.X. Optimal Investment Mode of New Energy Vehicle Charging Infrastructure under Public-Private-Partnership. Chin. J. Manag. Sci. 2024, 1–14. [Google Scholar] [CrossRef]
  26. Li, Y.; Su, H.; Chen, X.; Liu, J.; Shi, R. A V2G Scheduling Strategy Based on Electric Vehicle Users’ Willingness Model. In Proceedings of the 2021 IEEE 5th Conference on Energy Internet and Energy System Integration (EI2), Taiyuan, China, 22–25 October 2021; pp. 237–243. [Google Scholar] [CrossRef]
  27. Shi, L.F.; Lyu, S.N.; Lyu, T. Transaction Incentive Mechanism Design in V2G Market Considering Dynamic Loss Aversion. J. Ind. Eng. Eng. Manag. 2021, 35, 233–242. [Google Scholar] [CrossRef]
  28. Qi, J.; Li, L.; Hossain, J.; Lei, G. Optimizing Electric Vehicle Parking Lot Profitability through Vehicle-to-Grid Incentive Decision-Making in Multiple Energy Markets. Sustain. Energy Grids Netw. 2025, 41, 101595. [Google Scholar] [CrossRef]
  29. Cheng, Y.W. Energy Storage and Incentive Mechanism for New Energy Vehicles. Syst. Eng. Theory Pract. 2025, 45, 1621–1631. [Google Scholar]
  30. Smith, J.M.; Price, G.R. The Logic of Animal Conflict. Nature 1973, 246, 15–18. [Google Scholar] [CrossRef]
  31. Luan, W.P.; Wang, G.; Xu, D.Q. Advanced Metering Infrastructure Architecture Supporting Integration of Multiple Services and Applications. Proc. CSEE 2014, 34, 5088–5095. [Google Scholar] [CrossRef]
  32. Liu, X.F.; Gao, B.T.; Li, Y. Review of Game Theory Applications in Power Demand Side Management. Power Syst. Technol. 2018, 42, 2704–2711. [Google Scholar] [CrossRef]
  33. Karaki, A.; Al-Fagih, L. Evolutionary Game Theory as a Catalyst in Smart Grids: From Theoretical Insights to Practical Strategies. IEEE Access 2024, 12, 186926–186940. [Google Scholar] [CrossRef]
  34. Zhang, J.J.; Zhang, H.; Liu, Y. Evolutionary Game Analysis of Carbon Asset Pledge Financing Under Heterogeneous Emission Reduction Policies. Chin. J. Environ. Manag. 2021, 13, 70–80. [Google Scholar] [CrossRef]
  35. Fang, G.C.; He, Y.; Tian, L.X. Evolutionary Game Analysis of Government-Enterprise Carbon Emission Reduction Driven by Carbon Trading. Chin. J. Manag. Sci. 2024, 32, 196–206. [Google Scholar] [CrossRef]
  36. Chen, N.; Zhao, Y.; He, H.; Ma, X.; Xu, X.; Li, L.; Gang, S.; Xue, B. Stability Analysis of Carbon Emission Trading Mechanism in China Based on a Tripartite Evolutionary Game. Sci. Rep. 2025, 15, 7304. [Google Scholar] [CrossRef] [PubMed]
  37. Jiao, J.L.; Chen, J.; Li, L.L.; Li, F.Y. Evolutionary Game Analysis of Local Government and Enterprise Behavior Under Carbon Emission Reduction Reward-Punishment Mechanism. Chin. J. Manag. Sci. 2017, 25, 140–150. [Google Scholar] [CrossRef]
  38. Kang, K.; Zhao, Y.; Zhang, J.; Qiang, C. Evolutionary Game Theoretic Analysis on Low-Carbon Strategy for Supply Chain Enterprises. J. Clean. Prod. 2019, 230, 981–994. [Google Scholar] [CrossRef]
  39. Liu, K.D.; Yang, D.G.; Wang, G.H.; Zhou, Z.T. Policy Simulation and Modeling of Ecological Civilization Construction Based on System Dynamics. Chin. J. Manag. Sci. 2020, 28, 209–220. [Google Scholar] [CrossRef]
  40. Cheng, L.; Huang, P.; Zou, T.; Zhang, M.; Peng, P.; Lu, W. Evolutionary Game-Theoretical Approaches for Long-Term Strategic Bidding among Diverse Stakeholders in Large-Scale and Local Power Markets: Basic Concept, Modelling Review, and Future Vision. Int. J. Electr. Power Energy Syst. 2025, 166, 110589. [Google Scholar] [CrossRef]
  41. Liu, C.; Song, Y.; Wang, W.; Shi, X. The Governance of Manufacturers’ Greenwashing Behaviors: A Tripartite Evolutionary Game Analysis of Electric Vehicles. Appl. Energy 2023, 333, 120498. [Google Scholar] [CrossRef]
  42. Yuan, B.; Zhu, J.; Chen, Z.; Xu, C. How Can Stakeholders Collaborate to Promote the Interconnection of Charging Infrastructure? A Tripartite Evolutionary Game Analysis. Expert Syst. Appl. 2024, 255, 124798. [Google Scholar] [CrossRef]
  43. Wang, Y.; Fan, R.; Du, K.; Lin, J.; Wang, D.; Wang, Y. Private Charger Installation Game and Its Incentive Mechanism Considering Prospect Theory. Transp. Res. Part D Transp. Environ. 2022, 113, 103508. [Google Scholar] [CrossRef]
  44. Wei, Y.; Zhu, Y.; Qin, Y.; Li, Y.; Wang, H.; Han, X.; Lu, L.; Ouyang, M. A Hierarchical Framework for Vehicle-to-Grid (V2G) Distributed Control Combining Peer-to-Peer Blockchain with Systemic Scheduling. In Proceedings of the 2023 13th International Conference on Power and Energy Systems (ICPES), Chengdu, China, 8–10 December 2023; pp. 436–441. [Google Scholar] [CrossRef]
  45. Deng, R.; Shen, N.; Zhao, Y. Diffusion Model to Analyse the Performance of Electric Vehicle Policies: An Evolutionary Game Simulation. Transp. Res. Part D Transp. Environ. 2024, 127, 104037. [Google Scholar] [CrossRef]
  46. Zheng, P.; Pei, W.; Pan, W. Impact of Different Carbon Tax Conditions on the Behavioral Strategies of New Energy Vehicle Manufacturers and Governments—A Dynamic Analysis and Simulation Based on Prospect Theory. J. Clean. Prod. 2023, 407, 137132. [Google Scholar] [CrossRef]
  47. Gao, J.; Mao, M.; Yang, C.; Zhu, M.; Wang, Y.; Shi, Y.; Hatziargyriou, N. V2G Dynamic Tariff Strategy Based on Multiple Games. In Proceedings of the 2023 IEEE 6th International Electrical and Energy Conference (CIEEC), Hefei, China, 12–14 May 2023; pp. 4024–4029. [Google Scholar] [CrossRef]
  48. Zhu, Z.; Cheng, L.; Shen, T. Spontaneous Formation of Evolutionary Game Strategies for Long-Term Carbon Emission Reduction Based on Low-Carbon Trading Mechanism. Mathematics 2024, 12, 3109. [Google Scholar] [CrossRef]
  49. Cheng, L.; Zhang, J.; Yin, L.; Chen, Y.; Wang, J.; Liu, G.; Wang, X.; Zhang, D. General Three-Population Multi-Strategy Evolutionary Games for Long-Term on-Grid Bidding of Generation-Side Electricity Market. IEEE Access 2021, 9, 5177–5198. [Google Scholar] [CrossRef]
  50. Taylor, P.D.; Jonker, L.B. Evolutionary Stable Strategies and Game Dynamics. Math. Biosci. 1978, 40, 145–156. [Google Scholar] [CrossRef]
  51. Holmes, S.; Hofbauer, J.; Sigmund, K. Evolutionary Games and Population Dynamics. J. Am. Stat. Assoc. 2000, 95, 688. [Google Scholar] [CrossRef]
  52. Ritzberger, K.; Weibull, J.W. Evolutionary Selection in Normal-Form Games. Econometrica 1995, 63, 1371–1399. [Google Scholar] [CrossRef]
  53. Shi, Y.; Pan, M.; Peng, D. Replicator Dynamics and Evolutionary Game of Social Tolerance: The Role of Neutral Agents. Econom. Lett. 2017, 159, 10–14. [Google Scholar] [CrossRef]
  54. Cheng, L.; Huang, P.; Zhang, M.; Yang, R.; Wang, Y. Optimizing Electricity Markets through Game-Theoretical Methods: Strategic and Policy Implications for Power Purchasing and Generation Enterprises. Mathematics 2025, 13, 373. [Google Scholar] [CrossRef]
  55. Friedman, D. Evolutionary Games in Economics. Econometrica 1991, 59, 637–666. [Google Scholar] [CrossRef]
  56. Yuan, K.; Ma, L.; Wang, R. Research on Collaborative Governance Mechanism of Air Pollutant Emissions in Ports: A Tripartite Evolutionary Game Analysis with Evidence from Ningbo-Zhoushan Port. Mathematics 2025, 13, 2025. [Google Scholar] [CrossRef]
  57. Cheng, L.; Peng, P.; Huang, P.; Zhang, M.; Meng, X.; Lu, W. Leveraging Evolutionary Game Theory for Cleaner Production: Strategic Insights for Sustainable Energy Markets, Electric Vehicles, and Carbon Trading. J. Clean. Prod. 2025, 512, 145682. [Google Scholar] [CrossRef]
  58. Zhao, K.; Shi, K.F.; Zhang, X.; Ye, S.; Zhang, W.J.; Fu, Y.T. User Profiling for Vehicle-Grid Interaction Based on Big Data of Electric Vehicle Operation. Electr. Age 2025, 5, 20–25. Available online: https://link.cnki.net/doi/10.16081/j.epae.202208017 (accessed on 21 July 2025).
  59. Zhang, Z.Y.; Wu, Y.J.; Li, X.Q.; Zhang, L.; Nie, Z.C.; Ma, J. Islanded Microgrid Operation Strategy Supported by Aggregated EV Charging/Discharging. Mod. Electr. Power 2025, 1–12. [Google Scholar] [CrossRef]
  60. Hu, J.J.; Lu, J.Y.; Ma, W.S.; Li, G.Y.; Wang, W.; Yang, Y. Multi-Level Real-Time Control Strategy for EV Aggregators in Grid Peak Shaving. Autom. Electr. Power Syst. 2024, 48, 84–95. Available online: https://link.cnki.net/urlid/32.1180.TP.20240620.2013.005 (accessed on 21 July 2025).
  61. Xu, J.J.; Cheng, Y.L.; Zhang, T.F.; Liu, H.J.; Zhu, S.L.; Wu, Z.J. Optimal Dispatch of EV Clusters Considering Charging Behavior Characteristics and Adjustability. Autom. Electr. Power Syst. 2023, 47, 23–32. [Google Scholar] [CrossRef]
  62. Mobile Power Banks on Wheels Are Coming. Xinhua Net. Available online: https://www.xinhuanet.com/fortune/20250424/23447566ca794dcba53c0bd6c23e3436/c.html (accessed on 15 July 2025).
  63. Pang, S.L.; Zhao, Y.N.; Bi, K.F.; Yue, H.Z.; Zhang, Q. Pricing Strategy and Benefit Allocation for EV Aggregators in Demand Response. Adv. Technol. Electr. Eng. Energy 2024, 43, 41–50. Available online: https://ateee.iee.ac.cn/CN/10.12067/ATEEE2307016 (accessed on 21 July 2025).
  64. Yuan, J.H.; Wang, Z.H.; Xu, K.X.; Tan, Z.X.; Zhang, J.N. Dynamic User Preference-Driven Multi-Objective Cooperative Scheduling Strategy for EVs. Proc. CSU-EPSA 2025, 1–12. [Google Scholar] [CrossRef]
  65. Meng, C.Z.; Liu, M.; Chen, X.R.; Wang, K.; Pan, B.Y. Revenue Models and Benefit Analysis of User-Side Energy Storage in Guizhou Province. Distrib. Energy 2023, 8, 11–19. [Google Scholar] [CrossRef]
  66. Pan, Y.; Wang, M.S.; Miao, H.Y.; Yuan, X.D.; Han, H.C. Evolutionary Analysis of Incentive Mechanisms for Vehicle-Grid Interaction Technology. J. Shanghai Jiao Tong Univ. 2024, 1–20. [Google Scholar] [CrossRef]
  67. Li, Q.; Yu, B.; Zu, J.C.; Shangguan, X.G. Optimizing Natural Gas Power Pricing Mechanism: Shanghai’s Practice. Price Theory Pract. 2020, 40–43. [Google Scholar] [CrossRef]
  68. Huan, J.J.; Luo, S.X.; Liu, Z.C.; He, C.G.; Han, X.Y. Two-Part Tariff Mechanism for Natural Gas Power in Guangdong: Cost Analysis and Price Estimation Based on LCOE Model. Price Theory Pract. 2024, 111–116, 223. Available online: https://link.cnki.net/doi/10.19851/j.cnki.CN11-1010/F.2024.05.135 (accessed on 21 July 2025).
  69. Su, W. Determining a Reasonable Pricing Range is Imperative. China Electric Power News 2023, 2. Available online: https://link.cnki.net/doi/10.28061/n.cnki.ncdlb.2023.001060 (accessed on 21 July 2025).
  70. Liu, N.X. Multi-Region Charging Pile Electricity Price Surge Exceeds 20%: Multi-Party Game Between Time-of-Use Pricing and Industry Competition. 21st Century Business Herald 2023, 5. Available online: https://link.cnki.net/doi/10.28723/n.cnki.nsjbd.2023.003064 (accessed on 21 July 2025).
Figure 1. Dynamic evolution of VGI development.
Mathematics 13 02356 g001
Figure 2. The simulation results of the phase trajectory of the EV aggregators–local government–EV users tripartite evolutionary game system, taking 50 rounds of the repeated evolution game. (a) shows the phase trajectory of (x, y, z) in Scenario 1, (b) shows the phase trajectory of (x, y, z) in Scenario 2, (c) shows the phase trajectory of (x, y, z) in Scenario 3, (d) shows the phase trajectory of (x, y, z) in Scenario 4, and (e) shows the phase trajectory of (x, y, z) in Scenario 5.
Mathematics 13 02356 g002aMathematics 13 02356 g002b
Figure 3. Simulation analysis of peak–valley price difference, starting with initial values of (0.5, 0.5, 0.5). (a) shows the phase trajectory of (x, y, z) under different peak–valley prices, and (b) illustrates the corresponding strategy shares within the populations under these same parameter conditions.
Mathematics 13 02356 g003
Figure 4. Simulation analysis of loss aversion costs, starting with initial values of (0.2, 0.2, 0.2). (a) shows the phase trajectory of (x, y, z) under different loss aversion costs, and (b) illustrates the corresponding strategy shares within the populations under these same parameter conditions.
Mathematics 13 02356 g004
Figure 5. Simulation analysis of peak-shaving benefits and regulatory costs, starting with initial values of (0.2, 0.2, 0.2). (a) shows the phase trajectory of (x, y, z) under different peak-shaving benefits and regulatory costs, and (b) illustrates the strategy share of the local government under these same parameter conditions.
Mathematics 13 02356 g005
Figure 6. Simulation analysis of subsidy levels in V1G mode, starting with initial values of (0.5, 0.5, 0.5). (a) shows the phase trajectory of (x, y, z) under different subsidy levels, and (b) illustrates the strategy share of the local government under these same parameter conditions.
Mathematics 13 02356 g006
Figure 7. The phase trajectory of (x, y, z) under different subsidy-sharing ratios in V1G, starting with initial values of (0.5, 0.5, 0.5).
Mathematics 13 02356 g007
Figure 8. Simulation analysis of subsidy levels in V2G mode, starting with initial values of (0.5, 0.5, 0.5). (a) shows the phase trajectory of (x, y, z) under different subsidy levels, and (b) illustrates the strategy share of EV aggregators under these same parameter conditions.
Mathematics 13 02356 g008
Figure 9. Simulation analysis of subsidy-sharing ratio, starting with initial values of (0.4, 0.4, 0.4). (a) shows the phase trajectory of (x, y, z) under different subsidy-sharing ratio, and (b) illustrates the strategy share of EV aggregators under these same parameter conditions.
Mathematics 13 02356 g009
Figure 10. Simulation analysis of upgrade costs, starting with initial values of (0.4, 0.4, 0.4). (a) shows the phase trajectory of (x, y, z) under different upgrade costs, and (b) illustrates the strategy share of EV aggregators under these same parameter conditions.
Mathematics 13 02356 g010
Figure 11. Simulation analysis of subsidy levels, starting with initial values of (0.4, 0.4, 0.4). (a) shows the phase trajectory of (x, y, z) under different subsidy levels, and (b) illustrates the strategy share of EV aggregators under these same parameter conditions.
Mathematics 13 02356 g011
Table 1. Method for determining evolutionary stability.
Internal Equilibrium PointsCoordinateEigenvalue SymbolEvolutionary Stability Results
Point 1(0, 0, 0) λ 1 < 0 λ 2 < 0 λ 3 < 0 ESS
Point 2(1, 1, 1) λ 1 > 0 λ 2 > 0 λ 3 > 0 Unstable
Point 3 x * , y * , z * λ 1 = 0 λ 2 = 0 λ 3 = 0 Saddle point
Table 2. Parameter definitions.
PartyParameterDefinition
EV
aggregators
δ The subsidy-sharing ratio for EV users in V2G mode.
γ The subsidy-sharing ratio for EV users in V1G mode.
f s The service fee charged by the EV aggregators.
C a Management costs in the V1G strategy.
C s Upgrade costs for V2G charging infrastructure.
local
government
k 1 The subsidy response coefficient in V1G mode.
r 1 The subsidy standard in V1G mode.
k 2 The subsidy response coefficient in V2G mode.
r 2 The subsidy standard in V2G mode.
C g The regulatory cost for the subsidy strategy.
E g The peak-shaving benefit.
E 1 The environmental improvement benefits in the V1G mode without a subsidy.
E 2 The environmental improvement benefits in the V2G mode without a subsidy.
Δ E 1 The incremental environmental improvement benefits in V1G mode with a subsidy.
Δ E 2 The incremental environmental improvement benefits in V2G mode with a subsidy.
L The environmental losses borne in V0G mode.
EV users U 1 The perceived utility for users in V1G mode.
U 2 The perceived utility for users in V2G mode.
U s The additional perceived utility with a subsidy.
Q 0 The charging amount in V0G mode.
Q p The peak-shaving amount in V1G mode without a subsidy.
Δ Q p The incremental peak-shaving amount in V0G mode with a subsidy.
Q d The discharging amount in V2G mode without a subsidy.
Δ Q d The incremental discharging amount in V2G mode with a subsidy.
r t The peak electricity price.
Δ r The peak–valley price difference.
r d The reverse discharging price in V2G mode.
C 0 The charging cost in V0G mode.
k b The unit battery wear cost in V2G mode.
C t The loss aversion cost in V1G mode.
Δ C t The incremental loss aversion cost in V1G mode.
C l The loss aversion cost in V2G mode.
Δ C l The incremental energy loss aversion cost in V2G mode.
Table 3. Payoff matrix for the tripartite evolutionary game between EV aggregators, the local government, and EV users.
The Local
Government
EV Users
ParticipateDo Not Participate
EV
aggregators
Subsidy
strategy in V2G
1 δ k 2 r 2 Q d + Δ Q d + f s Q 0 + Q d + Δ Q d C s C a , Δ r Q 0 + f s Q 0 C s C a ,
E g Q 0 + Q d + Δ Q d k 2 r 2 Q d + Δ Q d C g L + E 2 + Δ E 2 , C g L ,
U 2 + U s + r d Q d + Δ Q d C 0 Δ r Q 0 + r t Δ r Q d + Δ Q d C l Δ C l + δ k 2 r 2 Q d + Δ Q d k b Q d + Δ Q d C 0
No-subsidy
strategy in V2G
f s Q 0 + Q d C s C a , Δ r Q 0 + f s Q 0 C s C a ,
E g Q 0 + Q d L + E 2 , L ,
U 2 + r d Q d C 0 Δ r Q 0 + ( r t Δ r ) Q d k b Q d C l C 0
Subsidy
strategy in V1G
( 1 γ ) Q p + Δ Q p k 1 r 1 + Δ r Q 0 Q p Δ Q p + f s Q 0 C a , Δ r Q 0 + f s Q 0 C a ,
E g Q p + Δ Q p k 1 r 1 Q p + Δ Q p C g L + E 1 + Δ E 1 , C g L ,
U 1 + U s + γ k 1 r 1 Q p + Δ Q p C 0 + Δ r Q p + Δ Q p C t Δ C t C 0
No-subsidy
strategy in V1G
Δ r Q 0 Q p + f s Q 0 C a , Δ r Q 0 + f s Q 0 C s C a ,
E g Q p L + E 1 , L ,
U 1 C 0 + Δ r Q p C t C 0
Table 4. Possible equilibrium points P 1 ~ 8 and their eigenvalues.
Points Eigenvalue   λ 1 Eigenvalue   λ 2 Eigenvalue   λ 3
P 1 0 , 0 , 0 C s C g U 1 + Δ r Q p C t
P 2 0 , 0 , 1 Δ r Q 0 Q p C s + f s Q d E g Δ Q p k 1 r 1 Q p + Δ Q p + Δ E 1 C g U 1 Δ r Q p + C t
P 3 0 , 1 , 0 C s C g γ k 1 r 1 + Δ r Q p + Δ Q p + U 1 + U s + C t Δ C t
P 4 0 , 1 , 1 1 δ k 2 r 2 + f s Q d + Δ Q d C s Δ r Q 0 Q p Δ Q p 1 γ k 1 r 1 Q p + Δ Q p E g Δ Q p + k 1 r 1 Q p + Δ Q p Δ E 1 + C g γ k 1 r 1 + Δ r Q p + Δ Q p + C t + Δ C t U 1 U s
P 5 1 , 0 , 0 C s C g r d + Δ r r t k b Q d + U 2 + Δ r Q 0 C l
P 6 1 , 0 , 1 f s Q d + Δ r Q 0 Q p + C s E g Δ Q d k 2 r 2 Q d + Δ Q d + Δ E 2 C g U 2 Δ r Q 0 + C l r d + Δ r r t k b Q d
P 7 1 , 1 , 0 C s C g U 2 + U s + Δ r Q 0 C l Δ C l + δ k 2 r 2 + r d + Δ r r t k b Q d + Δ Q d
P 8 1 , 1 , 1 1 δ k 2 r 2 + f s Q d + Δ Q d + C s + Δ r Q 0 Q p Δ Q p + 1 γ Q p + Δ Q p k 1 r 1 E g Δ Q d + k 2 r 2 Q d + Δ Q d Δ E 2 + C g U 2 U s Δ r Q 0 + C l + Δ C l δ k 2 r 2 + r d + Δ r r t k b Q d + Δ Q d
Table 5. Stability of P 1 ~ 8 .
PointESS ConditionSaddle Point ConditionUnstable Point Condition
P 1 A 8 < 0 A 8 > 0 DNE
P 2 A 5 C s < 0 A 6 C g < 0 A 8 > 0 A 5 C s < 0 A 6 C g < 0 A 8 > 0 ¬ A 5 C s < 0 A 6 C g < 0 A 5 C s 0 A 6 C g 0 A 8 0
P 3 DNEall conditionsDNE
P 4 A 1 + A 5 C s < 0 A 6 C g < 0 A 7 + A 8 > 0 A 1 + A 5 C s < 0 A 6 C g < 0 A 7 + A 8 > 0 ¬ A 1 + A 5 C s < 0 A 6 C g < 0 A 7 + A 8 > 0 A 1 + A 5 C s 0 A 6 C g 0 A 7 + A 8 0
P 5 DNEall conditionsDNE
P 6 A 5 C s > 0 A 2 + A 6 C g < 0 A 4 + A 8 > 0 A 5 C s > 0 A 2 + A 6 C g < 0 A 4 + A 8 > 0 ¬ A 5 C s > 0 A 2 + A 6 C g < 0 A 4 + A 8 > 0 A 5 C s 0 A 2 + A 6 C g 0 A 4 + A 8 0
P 7 DNE A 3 + A 4 + A 7 + A 8 < 0 A 3 + A 4 + A 7 + A 8 0
P 8 A 1 + A 5 C s > 0 A 2 + A 6 C g > 0 A 3 + A 4 + A 7 + A 8 > 0 A 1 + A 5 C s > 0 A 2 + A 6 C g > 0 A 3 + A 4 + A 7 + A 8 > 0 ¬ A 1 + A 5 C s > 0 A 2 + A 6 C g > 0 A 3 + A 4 + A 7 + A 8 > 8 A 1 + A 5 C s 0 A 2 + A 6 C g 0 A 3 + A 4 + A 7 + A 8 0
Table 6. Evolutionary equilibrium points and their conditions.
PointEigenvalues SymbolStabilityStrategy
P 1 (-, -, N)saddleEV aggregators choose V1G strategy, the local government does not provide subsidies, and EV users do not participate in VGI
P 2 (N, N, N)saddleEV aggregators choose V1G strategy, the local government does not provide subsidies, and EV users participate in V1G.
P 3 (-, +, N)unstableEV aggregators choose V1G strategy, the local government provides subsidies, and EV users do not participate in VGI.
P 4 (N, N, N)saddleEV aggregators choose V1G strategy, the local government provides subsidies, and EV users participate in V1G.
P 5 (+, -, N)unstableEV aggregators choose V2G strategy, the local government does not provide subsidies, and EV users do not participate in VGI.
P 6 (N, N, N)saddleEV aggregators choose V2G strategy, the local government does not provide subsidies, and EV users participate in V2G.
P 7 (+, +, N)unstableEV aggregators choose V2G strategy, the local government provides subsidies, and EV users do not participate in VGI.
P 8 (N, N, N)saddleEV aggregators choose V2G strategy, the local government provides subsidies, and EV users participate in V2G.
Table 7. Parameter settings of different scenarios.
r t Δ r r d f s r 1 r 2 E g C s n
Scenario 10.41570.120.300.20.30.500.4010005
Scenario 20.95860.38860.400.30.500.40.2010005
Scenario 31.22880.60360.300.40.20.20.488005
Scenario 40.9650.510.50.70.10.800.7325015
Scenario 51.26230.70.40.70.10.91.502505
Disclaimer/Publisher’s Note: The statements, opinions and data contained in all publications are solely those of the individual author(s) and contributor(s) and not of MDPI and/or the editor(s). MDPI and/or the editor(s) disclaim responsibility for any injury to people or property resulting from any ideas, methods, instructions or products referred to in the content.

