1. Introduction
All graphs considered in this paper are finite, simple, and connected. For the notions and terminology used from graph theory, but not defined here, the readers are referred to [
1,
2]. The vertex set and the edge set of a graph
G are denoted by
and
, respectively. The
order of the graph
G is
and the
size of the graph
G is
. Two adjacent vertices
and
are denoted by
and the edge
representing them is denoted by
. The
degree (or
) associated with the vertex
is the number of vertices adjacent to it.
Topological indices are numerical values of a molecular structure that are derived from a molecular graph G, where the atoms and the bonds are represented by the vertices and edges, respectively. They are referred to as
vertex-degree-based if they can be expressed in terms of the vertex degrees (valances of atoms) of the chemical graph, and as
bond-additive if they are expressed as the sum of edge (chemical bond) contributions. These graph invariants aid in the prediction of specific physicochemical characteristics, including stability, enthalpy of vaporization, and boiling point. They are also utilized in the study of molecular properties, including the structure–activity relationship (QSAR), the structure–property relationship (QSPR) and structural design in pharmacology, chemistry and nanotechnology [
3,
4].
Several topological indices are obtained as a result of the sum of the edge contributions. For instance, a
bond-additive topological index of a graph
G is defined as
where
is a function of some numerical characteristics
x and
y of the end-vertices
and
of an edge
of a graph
G. Although
x and
y are typically assumed to be the degrees
and
of
and
, respectively, they can also be other numerical values like their eccentricities, transmissions, etc. Numerous functions
have been examined thus far, leading to the invention of many different topological indices, the most well-known of which are the Randić index, the ABC index, and the two Zagreb indices [
5]. For more details on bond-additive topological indices, see [
6].
If
in Equation (
1), then
is called a
weighted degree-based topological index [
7]. Here,
; that is,
is a symmetric function. The function
was introduced by Vukičević and Gašperov [
6], generating a new graph invariant known as the
inverse sum indeg index (shortened to
index). They introduced the
Adriatic indices in 2010 [
6] which are derived from the analysis of notable indices like the Wiener index and the Randić index. With a total of 148 descriptors, the discrete Adriatic descriptors have outstanding predictive properties [
8,
9]. Among the several discrete Adriatic descriptors is the
index, which is an important predictor of the total surface area of octane isomers. A stream of research papers can be found with respect to the properties, generalizations, and applicability of the
index [
10,
11,
12,
13,
14,
15,
16].
The
weighted adjacency matrix [
7] associated with the weighted degree-based topological index of
G is a square matrix of order
n defined as
It is a real symmetric matrix and its multiset of eigenvalues with multiplicities is known as the
-
spectrum of
G. The eigenvalues of
are real and and can be indexed as
. The largest eigenvalue
is often called the
index or
spectral radius of
Associated to the weighted degree-based topological index, the
energy [
17] of the
matrix is defined as
By substituting different values of
in Equation (
2), we obtain different useful matrices leading to different invariants of
. For instance, if
, then we obtain
(ordinary) graph energy [
18]. For
,
is the
matrix, and the corresponding
energy,
, was put forward in [
16].
Originating in theoretical chemistry, graph energy is used to determine the total
π-electron energy associated with unsaturated hydrocarbons. For more about graph energy, see [
19,
20]. A lot of literature can be found on the
spectrum and on
energy as well. Havare [
13] obtained the bounds for the spectral radius of the
matrix and the
energy. The
spectrum and the
energy of some particular graph classes was considered by Hafeez and Farooq [
12]. Jamal et al. [
15] gave some properties of the
eigenvalues of graphs. They also obtained the bounds of the
eigenvalues and characterized the extremal graphs. Bharali et al. [
11] put forward the concept of the
Estrada index and derived some bounds for the
energy and the
Estrada index of
G. In [
10], Altassan et al. discussed the QSPR analysis and carried the statistical modelling of the physicochemical properties of anticancer drugs with the
index and the
energy. For some other types of graph spectra and graph energies, see [
17,
21,
22,
23].
This paper examines the
index and the
spectrum of
q-broom-like graphs, a variation of the graph that Tyomkyna and Uzzellem defined in [
24]. First, let us define the rooted broom
which is a tree of order
having its root in the vertex
of the path
and has
pendent edges at the vertex
of
. When
, the star
is the rooted broom
rooted at its central vertex. A
q-broom-like graph is a graph of order
that is derived from the complete graph
by using the root of a copy of
to identify each vertex of
. A
q-broom-like graph is denoted by
. Some
q-broom-like graphs are displayed in
Figure 1. Although
q-broom-like graphs are not commonly found as direct representations of molecular structures, they serve as valuable theoretical models in the study of topological indices. Their structured yet flexible form allows for meaningful analysis of index behavior and structural variations, contributing to a deeper understanding of graph-based molecular descriptors. Patuzzi et al. [
25] showed that the class of
n-vertex
q-broom-like graphs is total and strictly ordered by the index. In [
26], Rather et al. studied the Sombor index and the Sombor energy of the class of
q-broom-like graphs.
This paper is organized as follows. In
Section 2, we give closed formulas for the
index of
q-broom-like graphs and characterize graphs in this class with minimal and maximal
index. In
Section 3, the
spectrum for
q-broom-like graphs is considered and we provide a conjecture ordering the
q-broom-like graphs with respect to their
energy. In
Section 4, we discuss the QSPR analysis of two graph invariants (
index and
energy) with the physicochemical properties of sixteen alkaloids used to treat various kinds of diseases. In
Section 5, concluding remarks are made. While the
q-broom-like graphs considered in the first part of this study are primarily of theoretical interest, they offer insights into the structural behavior of the
index and
energy. The regression analysis in the latter part, although based on different molecular graph structures, illustrates the practical applicability of these indices in modeling physicochemical properties. This dual approach emphasizes both the theoretical development and potential real-world utility of the
index.
2. Index of -Broom-like Graphs
In this section, we examine the
index of a particular class of graphs called
q-broom-like graphs. First, let
be the vertex labelling of a
q-broom-like graph
such that
,
and
are the pendent vertices attached to roots, where
and
Also, observe that vertices
fuse with
for
Now, the degree sequence for
is
for
,
, for
and
, for
Now, we consider and its corresponding matrix for the index. The structure of and the aforementioned information allow us to derive the following result.
Theorem 1. Let be a given n-order q-broom-like graph. Then the following holds:
Proof. First, let us denote the common degree of
by
. Note that there are
edges having the common degree
,
q edges with degree 2 and
,
edges having common degree
q edges with degree
and 2, and
edges having degree 1 and
, respectively. Therefore, we have
By substitution, we have
Now, it is straightforward to derive part (i). For part (ii), observe that the common degree of
is
. Since each vertex of degree
has
a pendant edges attached to it, we thus have
edges with the common degree
and
edges with degree
and 1. Hence, the definition of
index gives us
Parts (iii) and (iv) can be proved in a similar manner. □
Next, we use Theorem 1 to perform some computational experiments and get
These computations show that the
index of
decreases as we increase the value of
t and decrease the value of
a. Thus, the next theorem proves that the
index of the family
decreases as
k increases, where
.
Theorem 2.
Consider a q-broom-like graph , where , and are fixed. Then the decreases as k increases, where
Proof. We will prove the theorem by showing that
. This suffices to demonstrate that the
decreases as
k increases. For this, we will consider all four cases for the value of
t. First, let
, then Theorem 1 gives us
Thus, for .
Next, let
, then Theorem 1 implies
Therefore, for .
Now for
, using Theorem 1, we obtain
Thus, for .
Lastly, if
, then Theorem 1 gives us
Hence, for . □
The following is an immediate consequence of Theorem 2.
Corollary 1. Consider a q-broom-like graph with fixed , , and , then G has minimal index when and maximal index when .
3. Spectral Properties of -Broom-like Graphs
Now, we investigate the
spectrum and the
energy of
q-broom-like graphs and mention an important result that is a direct consequence of Theorem 3.1 [
27], since the
matrix is a special type of weighted adjacency matrix.
Corollary 2 ([
27]).
Suppose that G is a graph of order n with vertex subset such that for any , where and is an independent set. Then 0 is an eigenvalue of with multiplicity at least . In the next theorem, we examine the spectrum of for .
Theorem 3.
Consider a q-broom-like graph , where and . Then the spectrum of iswhere Proof. The
matrix of
can be expressed as
where
J is a matrix whose each entry is
Given that an independent set of size
is formed by
in
and that each of these vertices shares the same vertex
for
and
, the hypothesis of Corollary 2 is satisfied. Hence, 0 is the eigenvalue of
with multiplicity
The eigenvalues of the following quotient matrix (for details, see [
1]) give us the remaining eigenvalues of
:
It can be easily verified that the eigenvalues of the matrix
Q, each with multiplicity
, are
and the remaining two are the eigenvalues of the matrix that follows
The eigenvalues of
are
This gives us the spectrum of
completely. □
The next result gives us the closed formula for the energy of q-broom-like graphs when .
Theorem 4. Consider a q-broom-like graph , where and . Then the energy of is given bywhere Proof. From Theorem 3, the result is evident. □
The matrix
Q in Equation (
3) can be expressed as follows with a little row and column transformation:
Expanding it by the last row, it can be shown that its determinant is
Now, we observe that
always has an eigenvalue of 0 with multiplicity
for
. Therefore, the quotient matrix
Q is the only factor that determines the energy of
. However, the problem of determining the eigenvalues of matrix
Q continues to be highly non-trivial. It is impossible to determine the eigenvalues of the quotient matrix using closed formulas, even for
. The quotient matrix of the
q-broom-like graph
is
where
is the zero matrix, and
Here,
J is a matrix whose each entry is 1 and
I is the identity matrix.
Lastly, we propose the following conjecture based on the aforementioned observation and computational studies.
Conjecture 1. Let be a q-broom-like graph, where , , and are fixed. Then the increases as k increases, where
If the above conjecture is true, then it will follow that
where
, and
are fixed.
4. QSPR Analysis of Index and Energy with Certain Alkaloids
Alkaloids are a broad class of organic compounds with nitrogen atoms in their structures that are found in nature. They are crystalline liquids that are colorless, odorless, and tinted yellow. They typically taste bitter. Alkaloids have been utilized as remedies for hundreds of years and are mostly found in plants. They are widely used in the agriculture sector as insecticides and herbicides and they affect both humans and animals physiologically in a variety of ways. With the aid of various molecular descriptors, six features of the structures of all the alkaloids can be estimated. Although there are many different kinds of alkaloids in nature, only sixteen are investigated using regression models and topological indices. QSPR modeling is used to analyze these 16 alkaloids, as presented in
Figure 2.
In chemistry, quantitative structure–property relationships or QSPR models are employed to forecast a chemical compound’s properties based on its molecular structure. In these models, the molecular structure is correlated with their biological, chemical, or physical properties using mathematical equations or algorithms. In fields like drug discovery, environmental studies, and material science, QSPR models provide insightful information about the properties of a compound without requiring a lot of experimental testing, saving time and money. They can assist in predicting the pharmacokinetic, toxicological, and biological activity of new compounds; evaluating the environmental fate of chemicals; forecasting the characteristics of catalysts, solvents, and polymers; and assisting in regulatory decision-making. To put it briefly, QSPR models reduce the need for expensive and time-consuming experimental testing while speeding up the design and development of new chemicals and materials. To learn more about QSPR models and their outcomes, refer to [
28,
29,
30,
31,
32,
33,
34].
The ability of a topological index to forecast a chemical compound’s behavior is assessed using the correlation coefficient
r between topological indices and physicochemical characteristics. The range of values for r is between
and 1. If r is close to zero, there is no relationship; if it is close to
or 1, there is a very strong correlation. In QSPR and QSAR analysis, topological indices with
are quite useful. The coefficient of determination
forecasts how well a statistical model will work or explains how the dependent variable changes in response to the independent variable. Its value is in the range of 0 and 1. The model accurately predicts the result if it is close to 1. A variety of regression models, including linear and quadratic, are utilized to analyze the efficacy of topological indices in order to comprehend the structures of alkaloids. The statistical technique has been used in numerous articles to discuss the significance of the degree-related indices. We were inspired to investigate the
index (
energy) and alkaloid structures as a result of this effort. We acknowledge that topological indices, including the
index, are generally dependent on the number of vertices in a graph. However, in our regression analysis, we considered distinct sets of molecular graphs with varying numbers of vertices. Therefore, comparisons were made within each respective group, effectively mitigating the direct influence of graph size on the predictive analysis. Farooq et al. [
29] employed eight definitions of degree-related indices to analyze the nine medications of cardiovascular disease. The results of the QSPR modeling of drugs showed that the GA index is useful for predicting the polarity of cardiovascular drugs, the R index is helpful in measuring molar refractivity, and the ABC index is useful for approximating molar volume. Using several regression models and degree-related indices, Gnanaraj et al. [
30] investigated the 10 most widely used painkillers. Recently, Zhang et al. [
34] conducted a study on the QSPR analysis of malaria medications. The study included nine medications for the regression analysis of six physicochemical properties. Using statistical analysis and degree-related indices, Parveen et al. [
33] investigated the medications used to treat rheumatoid arthritis.
In this section, we compute the
index and the
energy for the 16 alkaloids given in
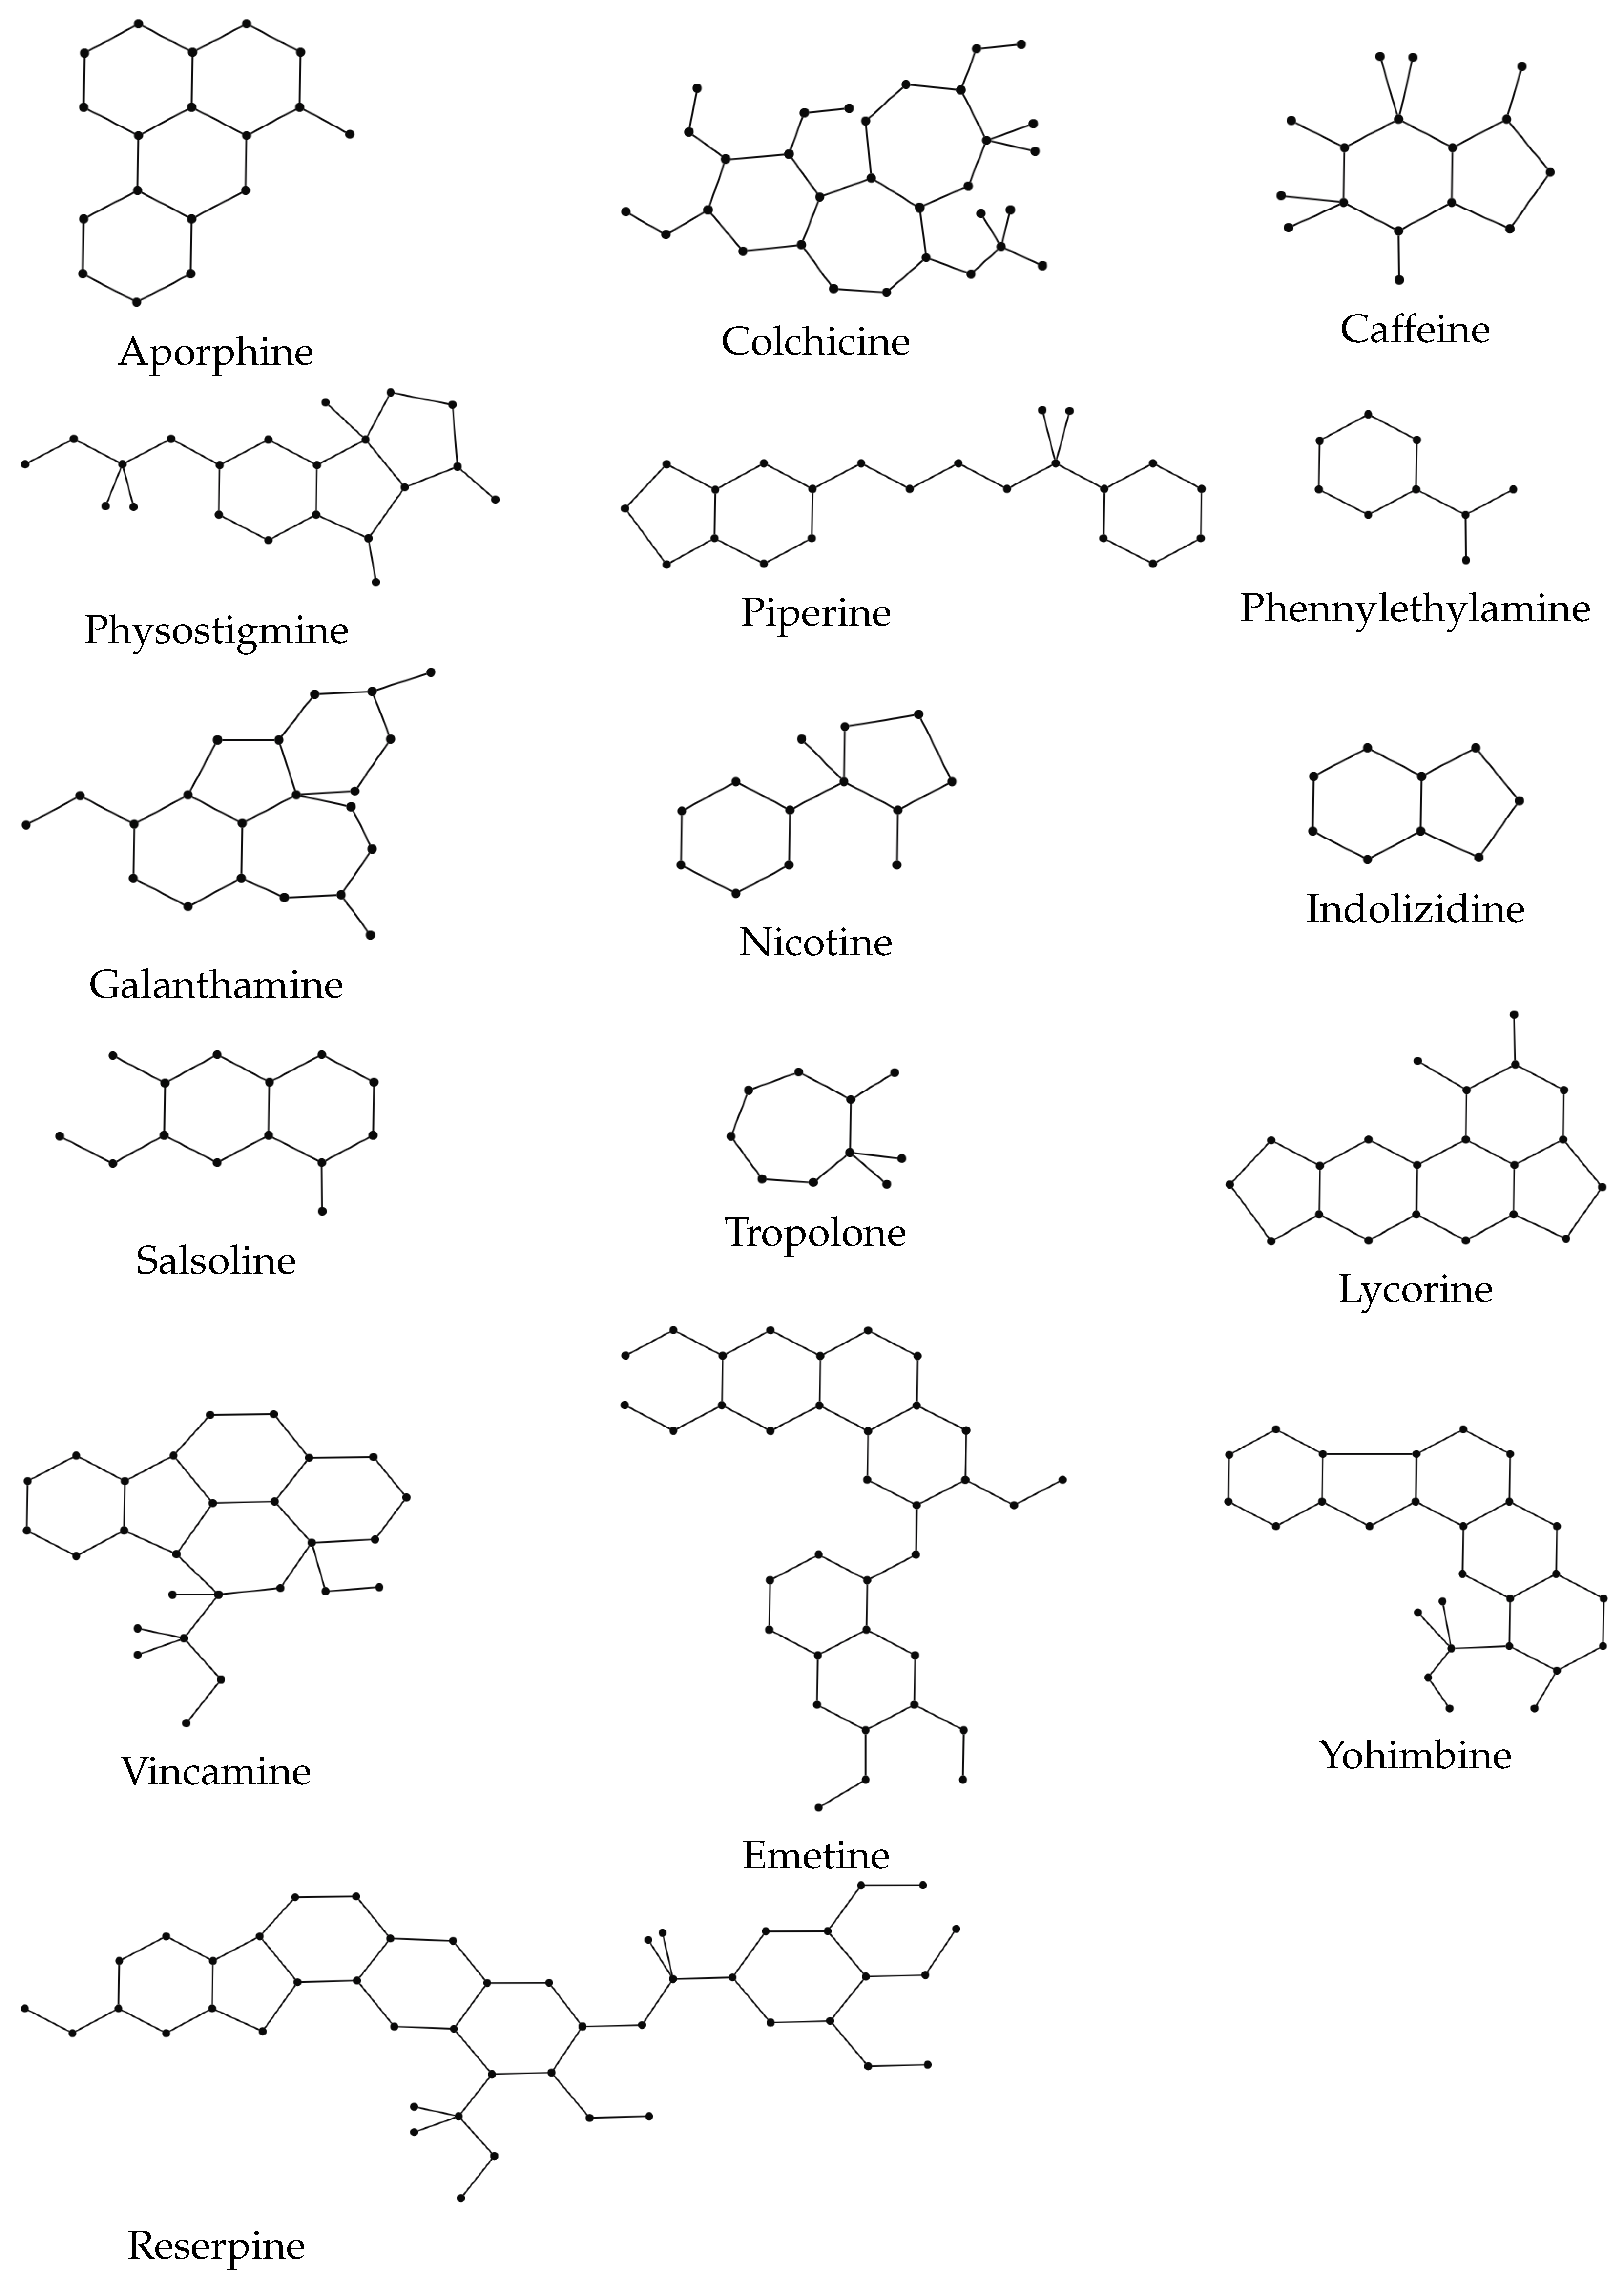
Figure 2. We analyze the correlation coefficient and coefficient of determination and conduct both linear and quadratic regression analysis. For our QSPR analysis, the graphical structures of the alkaloids displayed in
Figure 2 are presented in
Figure 3. Before proceeding further, we first describe some of these 16 alkaloids. Galanthamine helps to alleviate the symptoms of Alzheimer’s disease, a brain disorder that gradually impairs memory as well as cognitive function, learning, communication, and day-to-day functioning. Salsoline crystallizes in alcohol solutions, which acts as an antihypertensive medication. Piperine is produced from the fruit of the black pepper plant. It offers a wide range of pharmacological properties and health advantages, especially in the fight against chronic diseases including decreased insulin resistance, improved hepatic steatosis, and anti-inflammatory effects. One of the numerous lycorine derivatives utilized in cancer research is lycorine hydrochloride. Nicotine is found in potatoes, tomatoes, and tobacco plants. As a stimulant, it accelerates the flow of messages between the brain and the body, and therefore it is used to treat smoking addiction. Caffeine, which is mostly found in coffee plants, is used to treat obesity and migraines, enhance mental attentiveness, and improve athletic abilities. For further information on how alkaloids are used to make medications for various diseases, see [
35,
36].
The
index and the
energy of the alkaloids are calculated using Wolfram Mathematica, as shown in
Table 1. The physicochemical properties of the alkaloid structures were obtained from [
37], who originally retrieved the data from the ChemSpider database. We refer the reader to that publication for specific details and original source links. Where available, CAS numbers have also been provided in
Table 1 to enhance clarity. The physical properties and the
index (
energy) of the alkaloids serve as inputs for the regression models. The computations related to regression were performed with the help of Microsoft Excel.
The physicochemical properties of alkaloids include molar weight (MW), boiling point (BP), flash point (FP), enthalpy of vaporization (EV), molar refractivity (MR), and molar volume (MV), listed in
Table 2. Since their values may vary depending on experimental conditions, a range or predicted value of these properties is utilized. The molar weight of the alkaloids indicates the complexity and simplicity of their structures. This manuscript uses g/mol as the unit of molar weight.
Table 2 shows that phennylethylamine has the lowest molar weight and reserpine the greatest. The temperature at which a liquid’s vapor pressure equals the external atmospheric pressure causing it to turn into a gas is known as the boiling point. The maximum BP values are for colchicine
and the unit of BP is degrees Celsius. The lowest temperature at which a liquid produces enough flammable vapor to form an ignitable mixture with air near its surface is known as the flash point. The unit of FP is also degrees Celsius. Colchicine has the greatest FP values among all of the chosen alkaloids. EV, MR, and MV are measured in kJ/mol, cm
3, and cm
3, respectively. The correlation is unaffected by the units of parameters; however, the units must be the same for every chemical structure.
A simple linear regression is used to ascertain how two quantitative variables interact. It statistically characterizes the relationship between the independent or explanatory variable
X and the dependent or response variable
Y using a linear equation. Quadratic regression is a type of regression analysis used to model the relationship between a dependent variable
Y and an independent variable
X when the data follows a parabolic (U-shaped or inverted U-shaped) trend rather than a straight line. The regression equations used in calculations are as follows:
where
X stands for the independent or explanatory variable,
Y for the dependent or response variable,
b is the regression constant, and
a and
are regression coefficients. The power of the independent variable
X determines the number of coefficients,
. The graph invariants (
index or
energy) are denoted by
X, while the physicochemical properties of alkaloids are represented by
Y.
The next table gives the correlation coefficients of the physicochemical properties of the alkaloids (
Figure 2) with the graph invariants (
index and
energy). If the correlation coefficient is greater than
, then it is significant in predicting the dependence of physicochemical property on the respective graph invariant (
index or
energy).
Table 3 indicates that all of the correlation coefficients are significant.
In
Table 4, we calculate the coefficient of determination
for the physicochemical properties of the alkaloids (
Figure 2) against the
index and the
energy. These values of
are for the linear regression. Once more, a value greater than
is considered significant. As shown in the table below, the majority of the
are significant. Thus, there is a significant statistical correlation between the graph invariants (
index and
energy) and the physicochemical properties of the alkaloids.
Although the calculation method for
is the same for both linear and quadratic regression models, the models’ respective fits to the data may result in different
values. If the data is essentially linear, the quadratic model might not considerably increase
, as the additional complexity is unnecessary. However, a quadratic model usually fits better and explains more variability when the data has a non-linear trend, yielding a significantly higher
compared to the linear model.
Table 5 gives the coefficient of determination
for the quadratic regression. In relation to molar weight and molar refractivity, both
index and
energy yield the highest
. Overall, the table shows that all of the coefficients of determination are significant. Also, the data in
Table 5 is normally distributed.
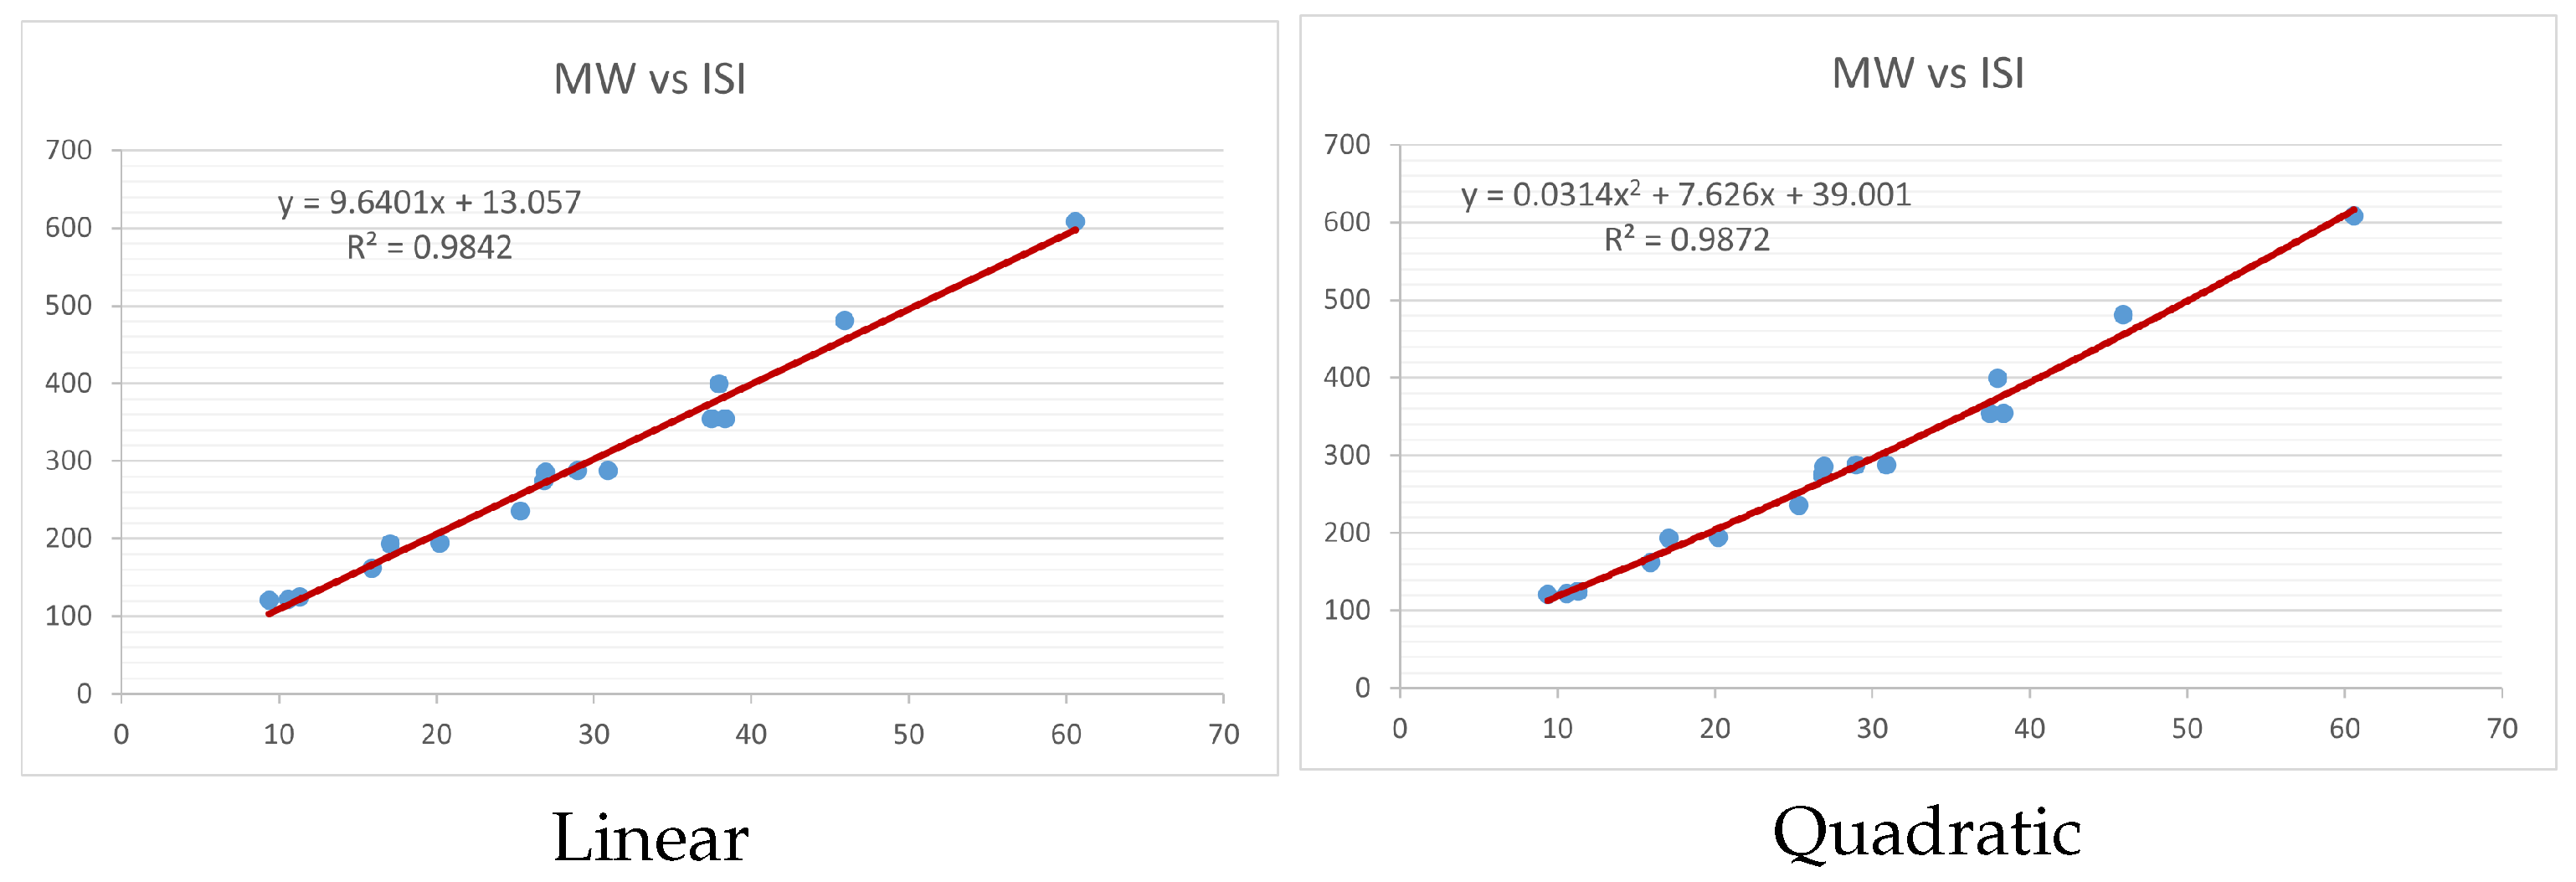
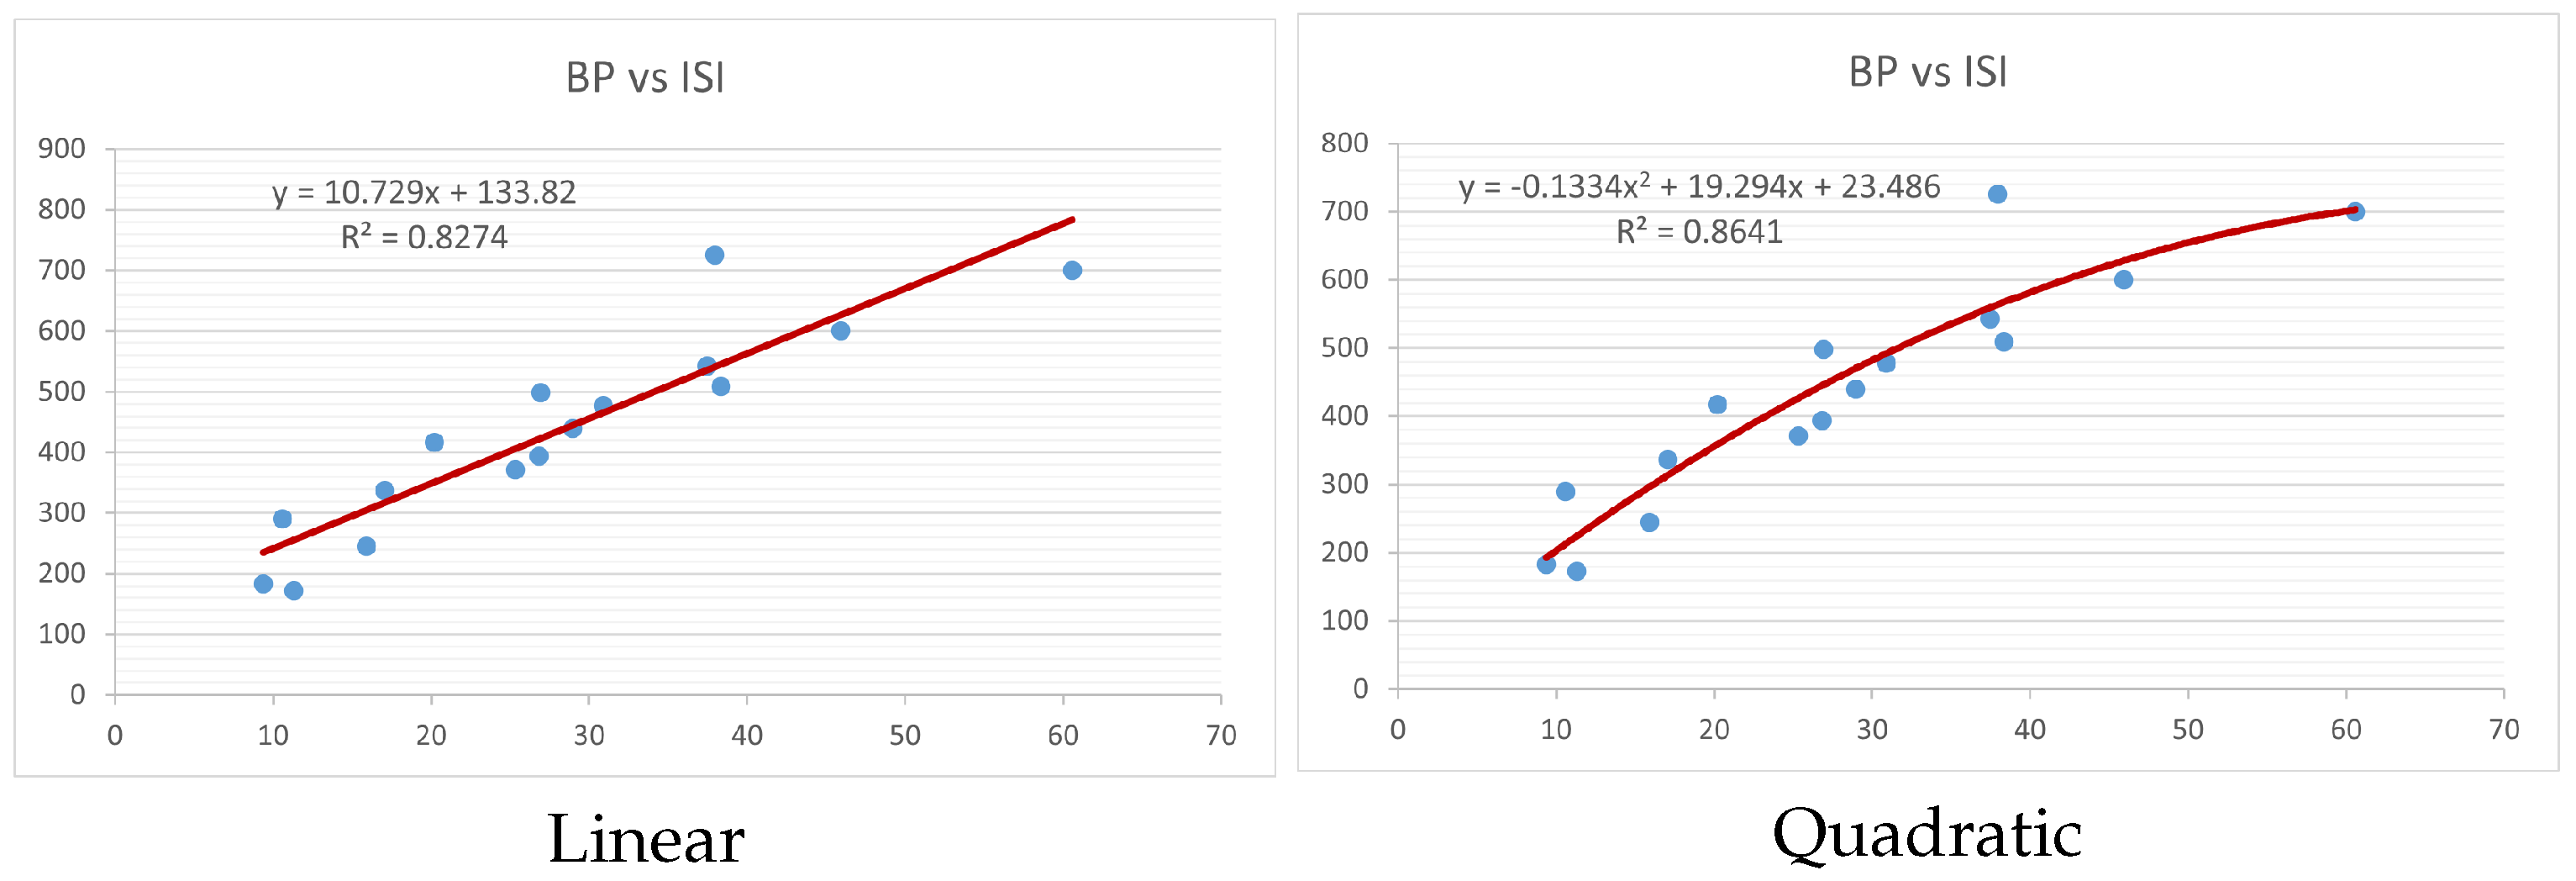
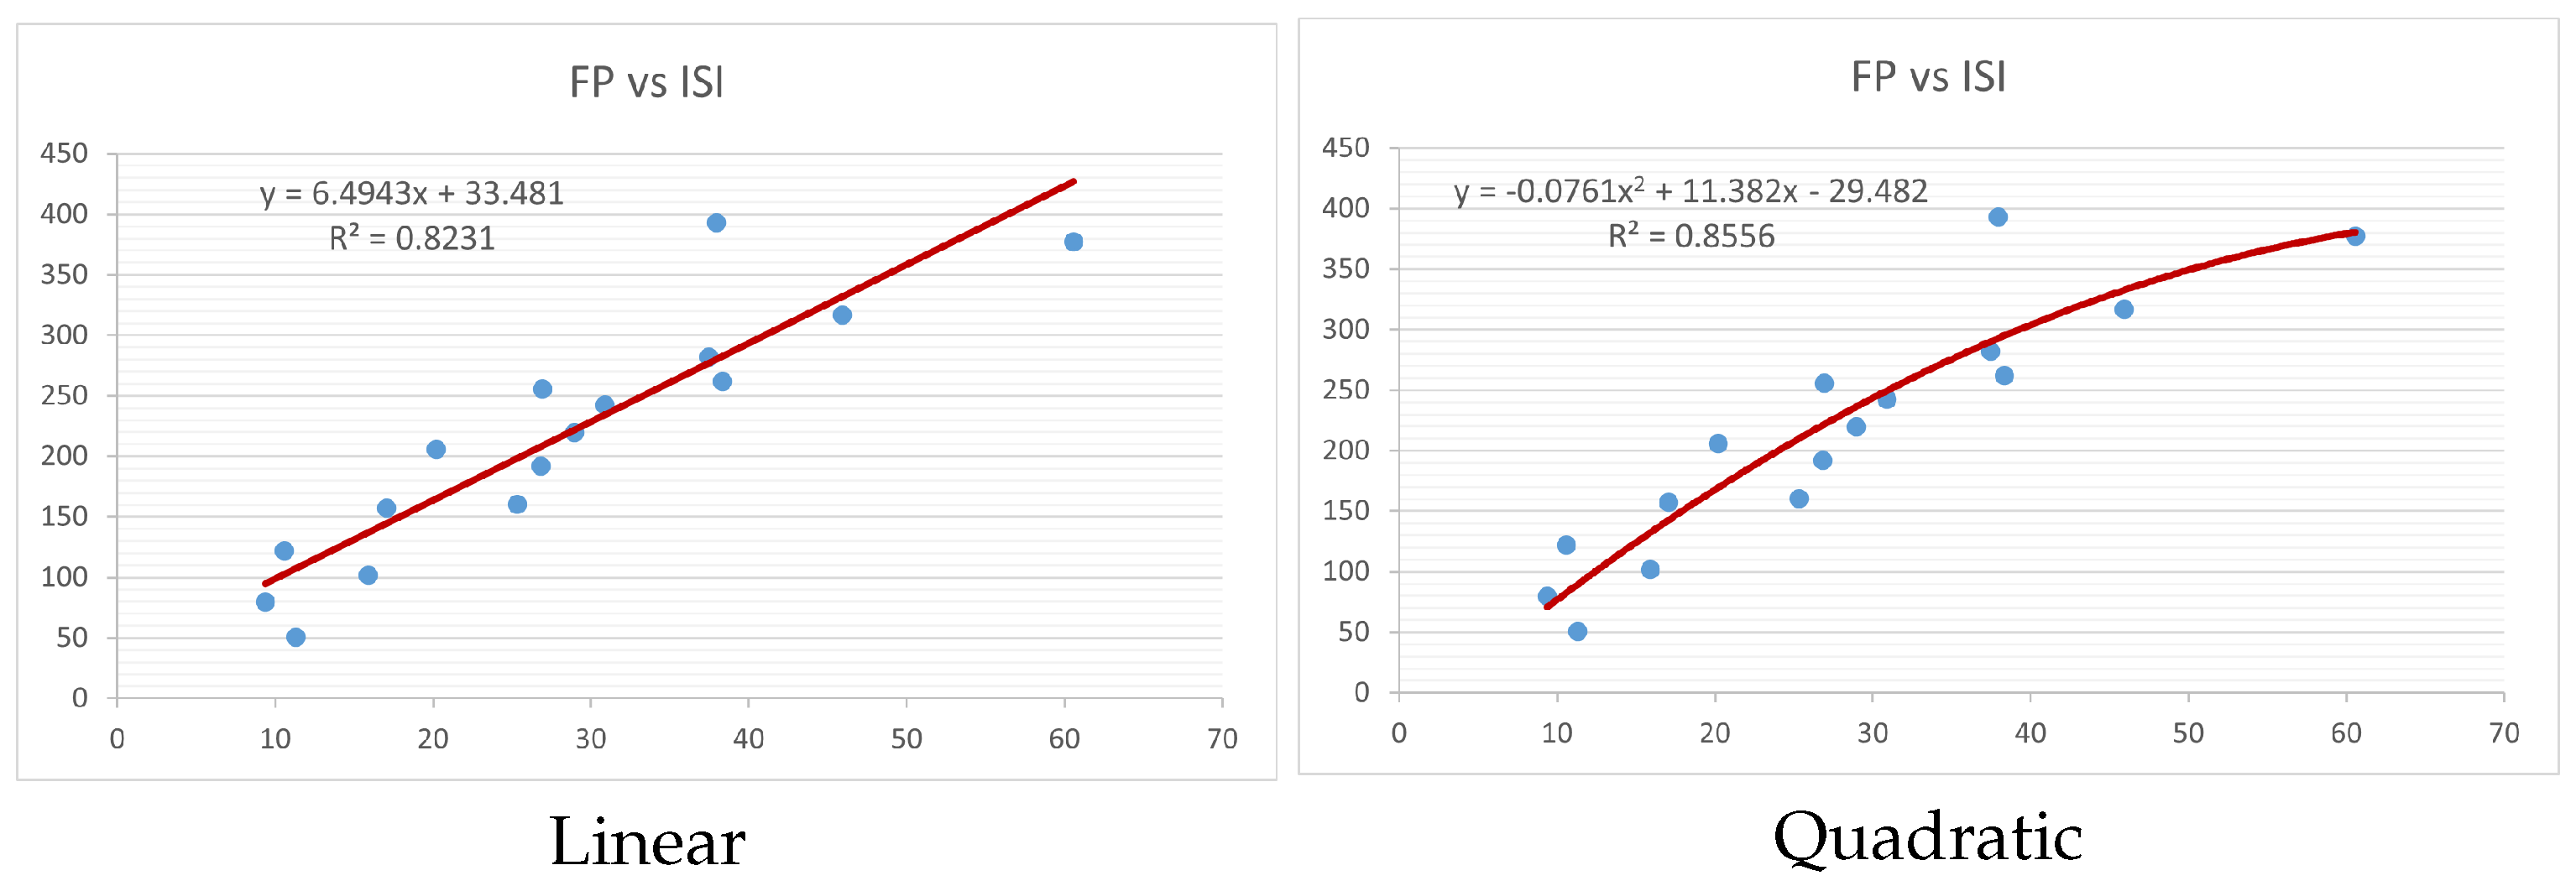
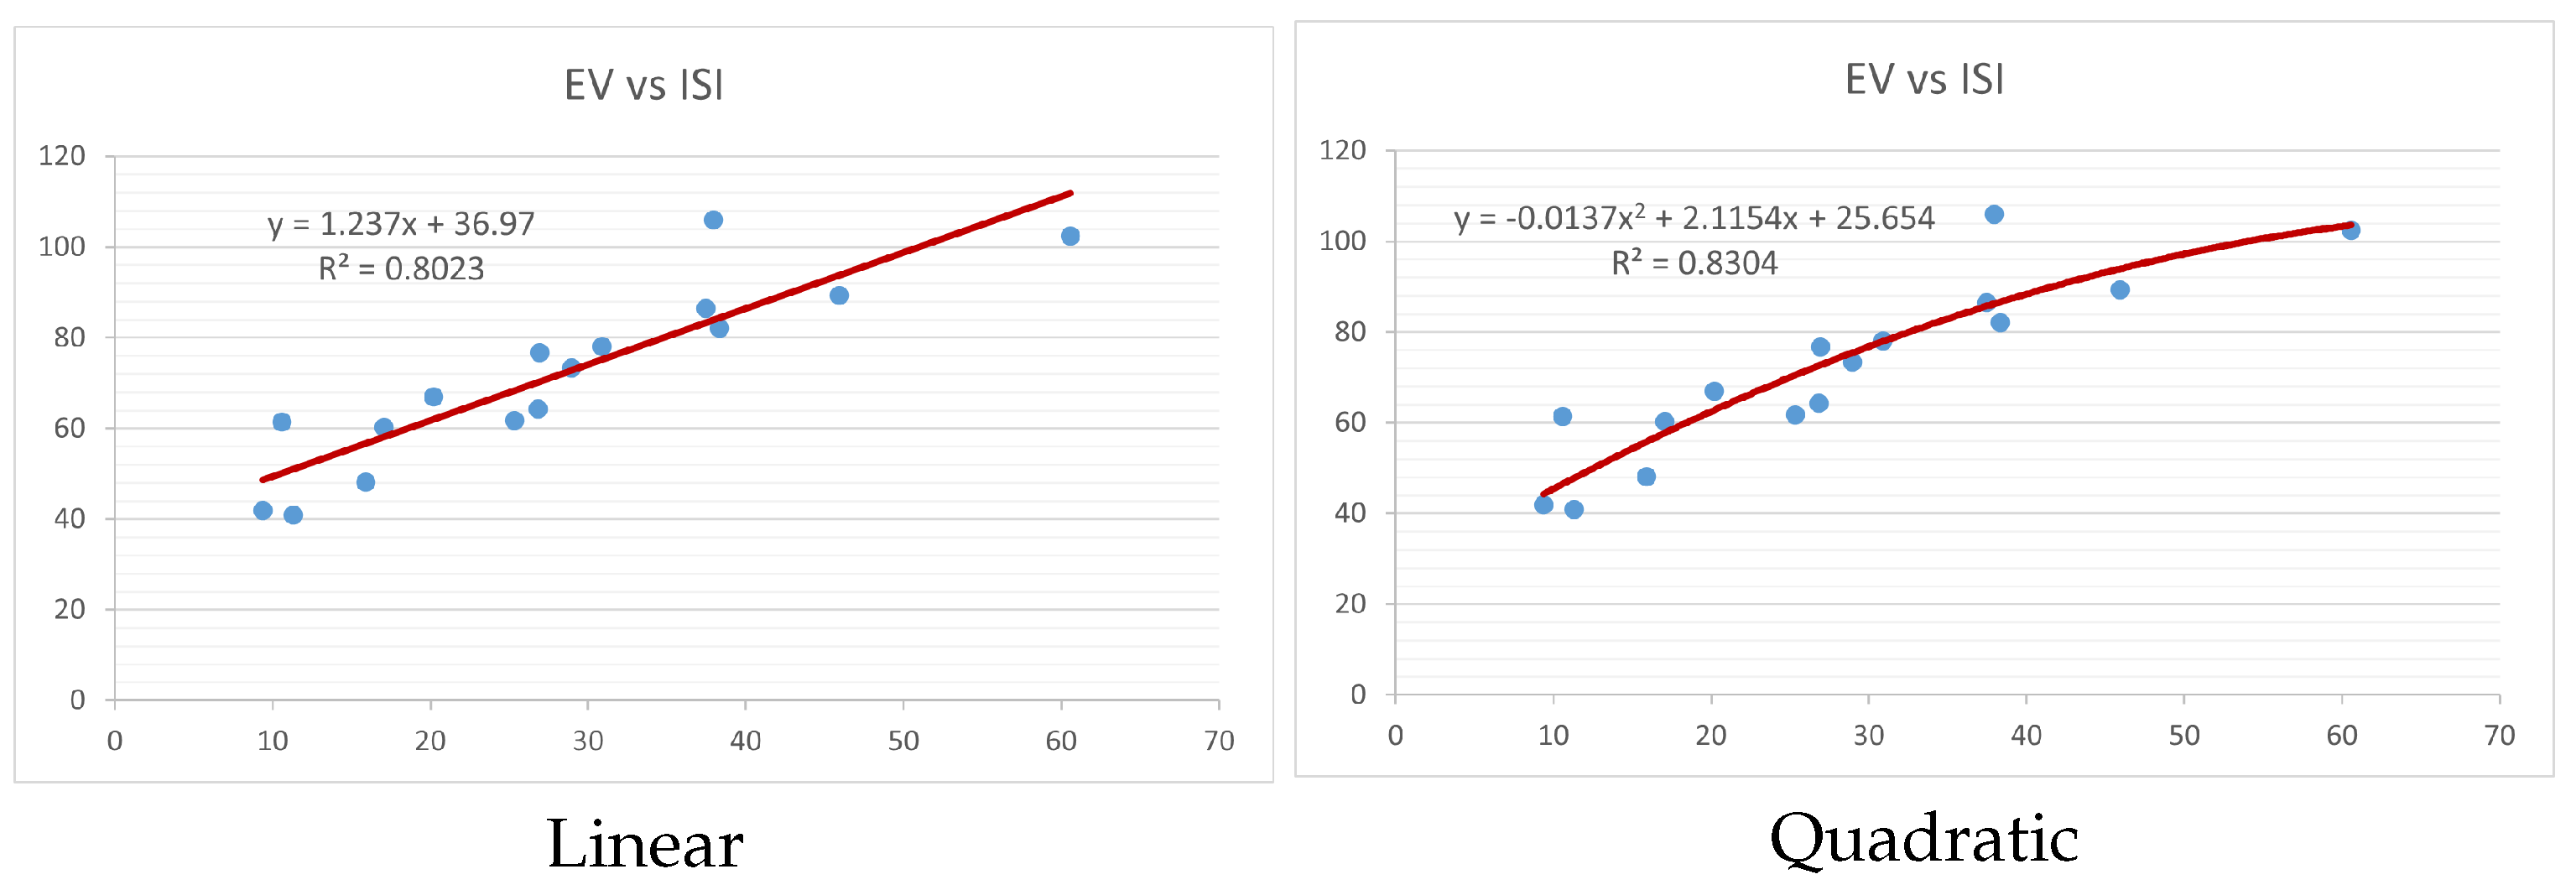
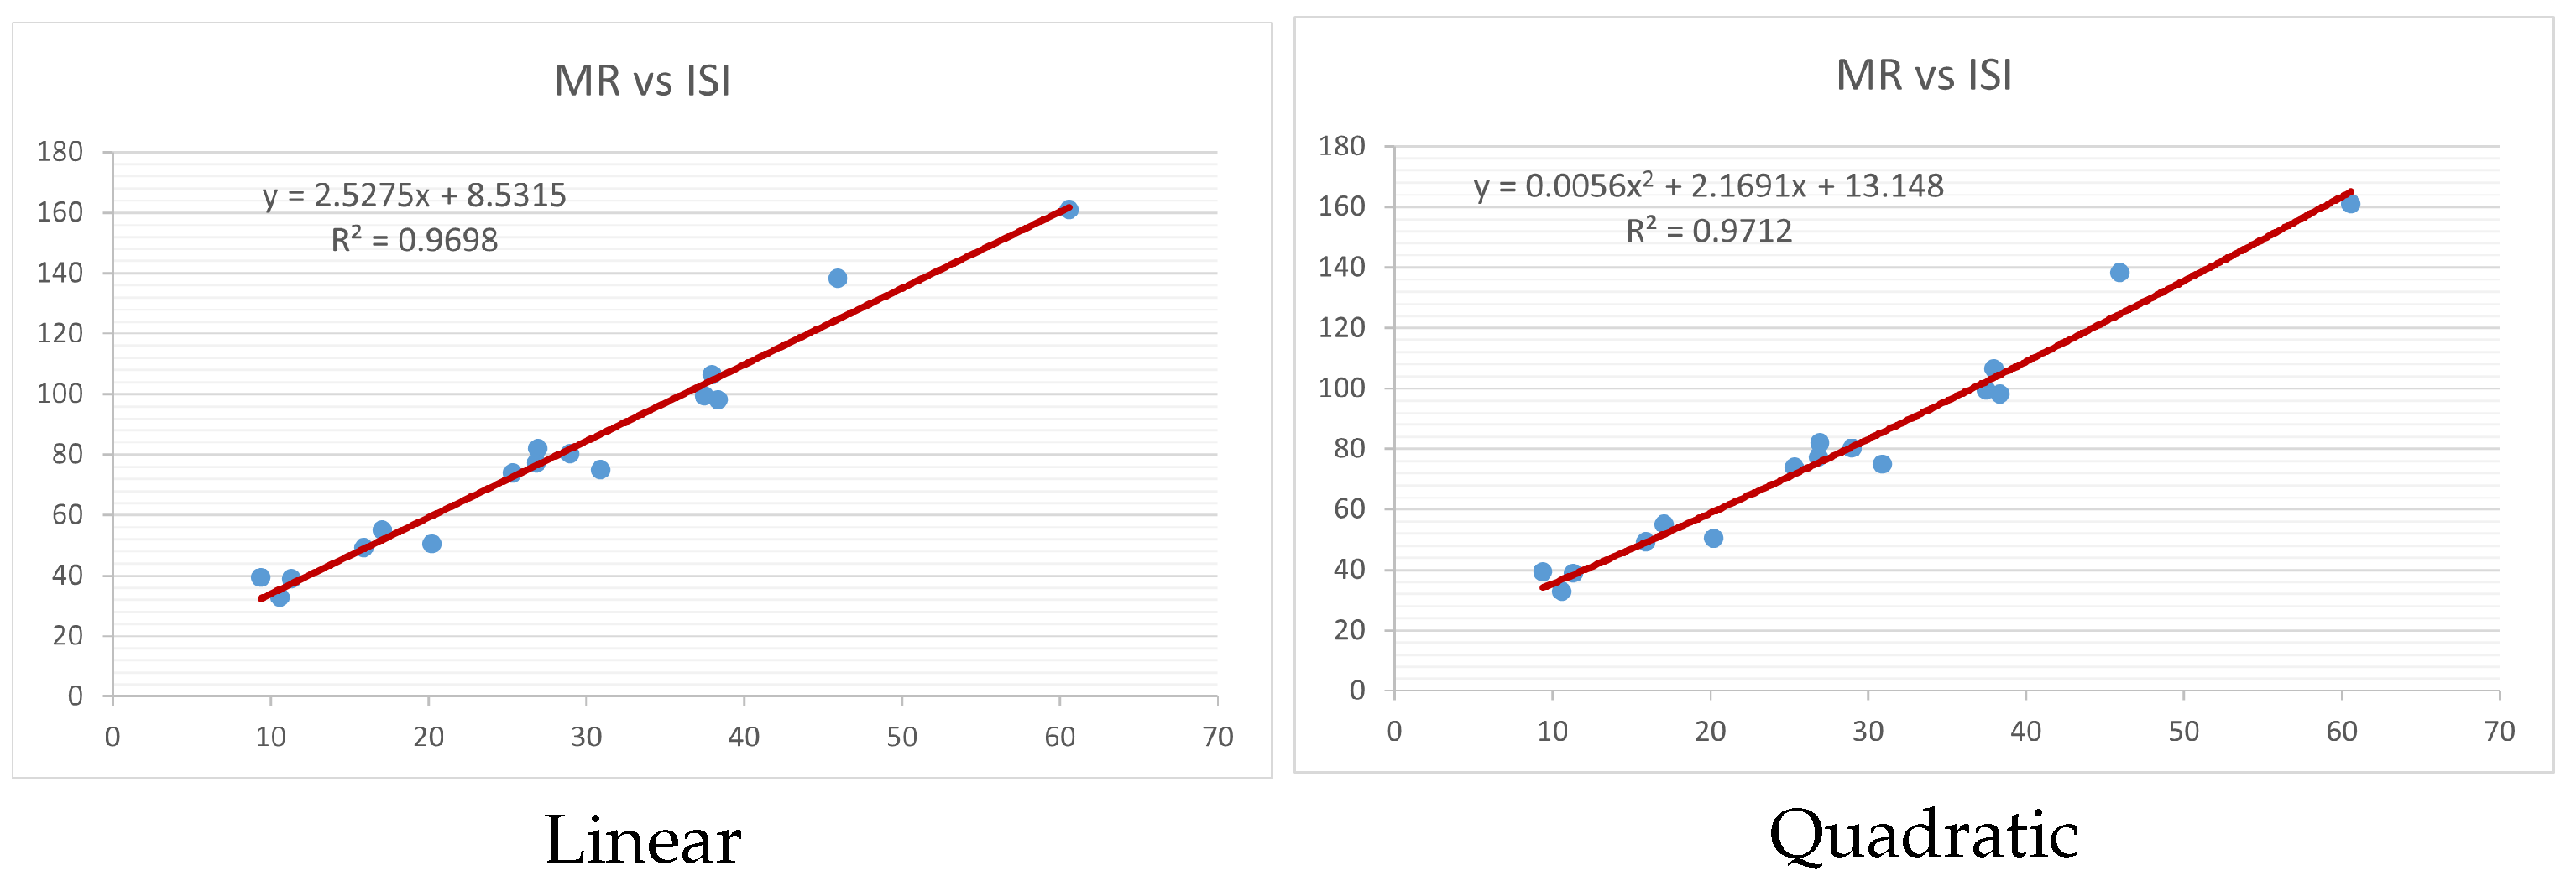
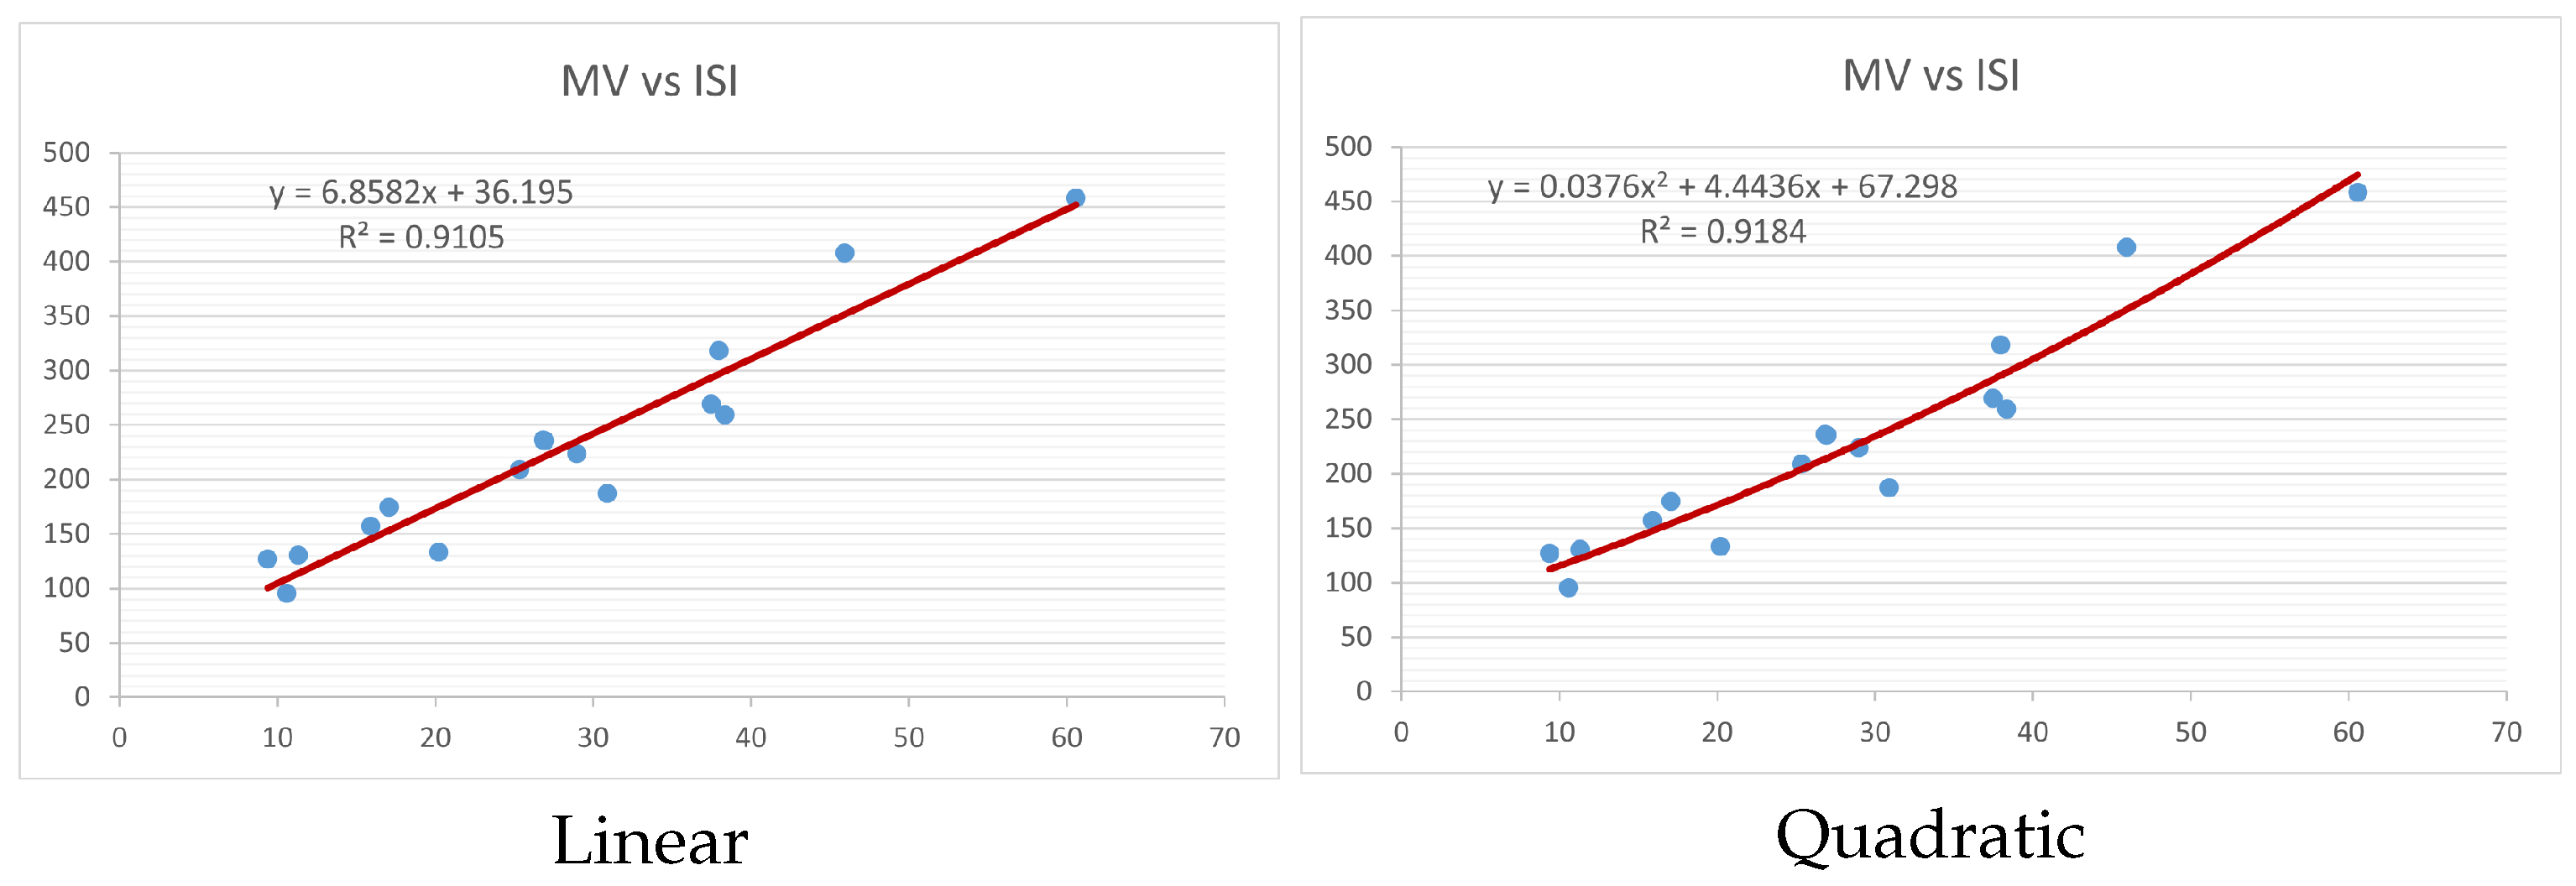
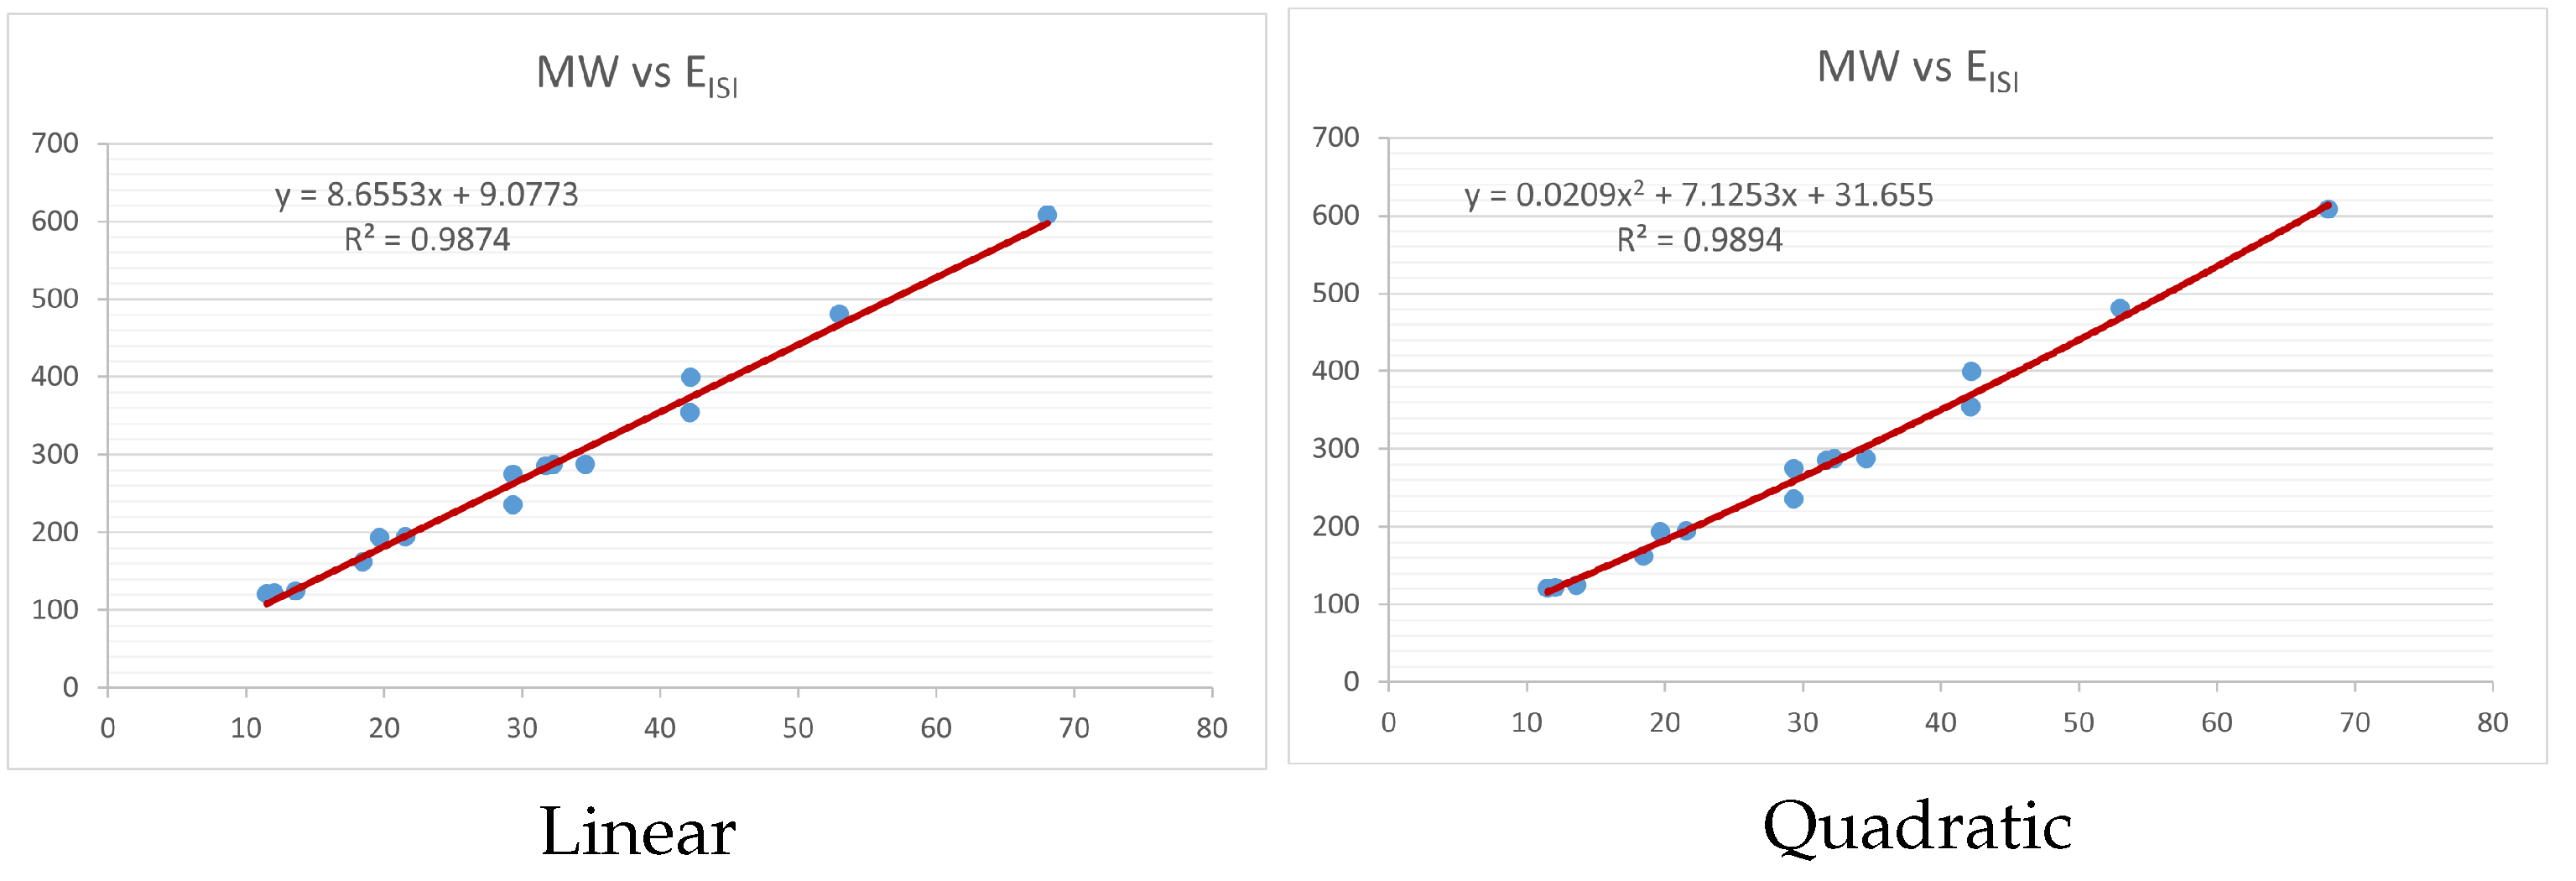
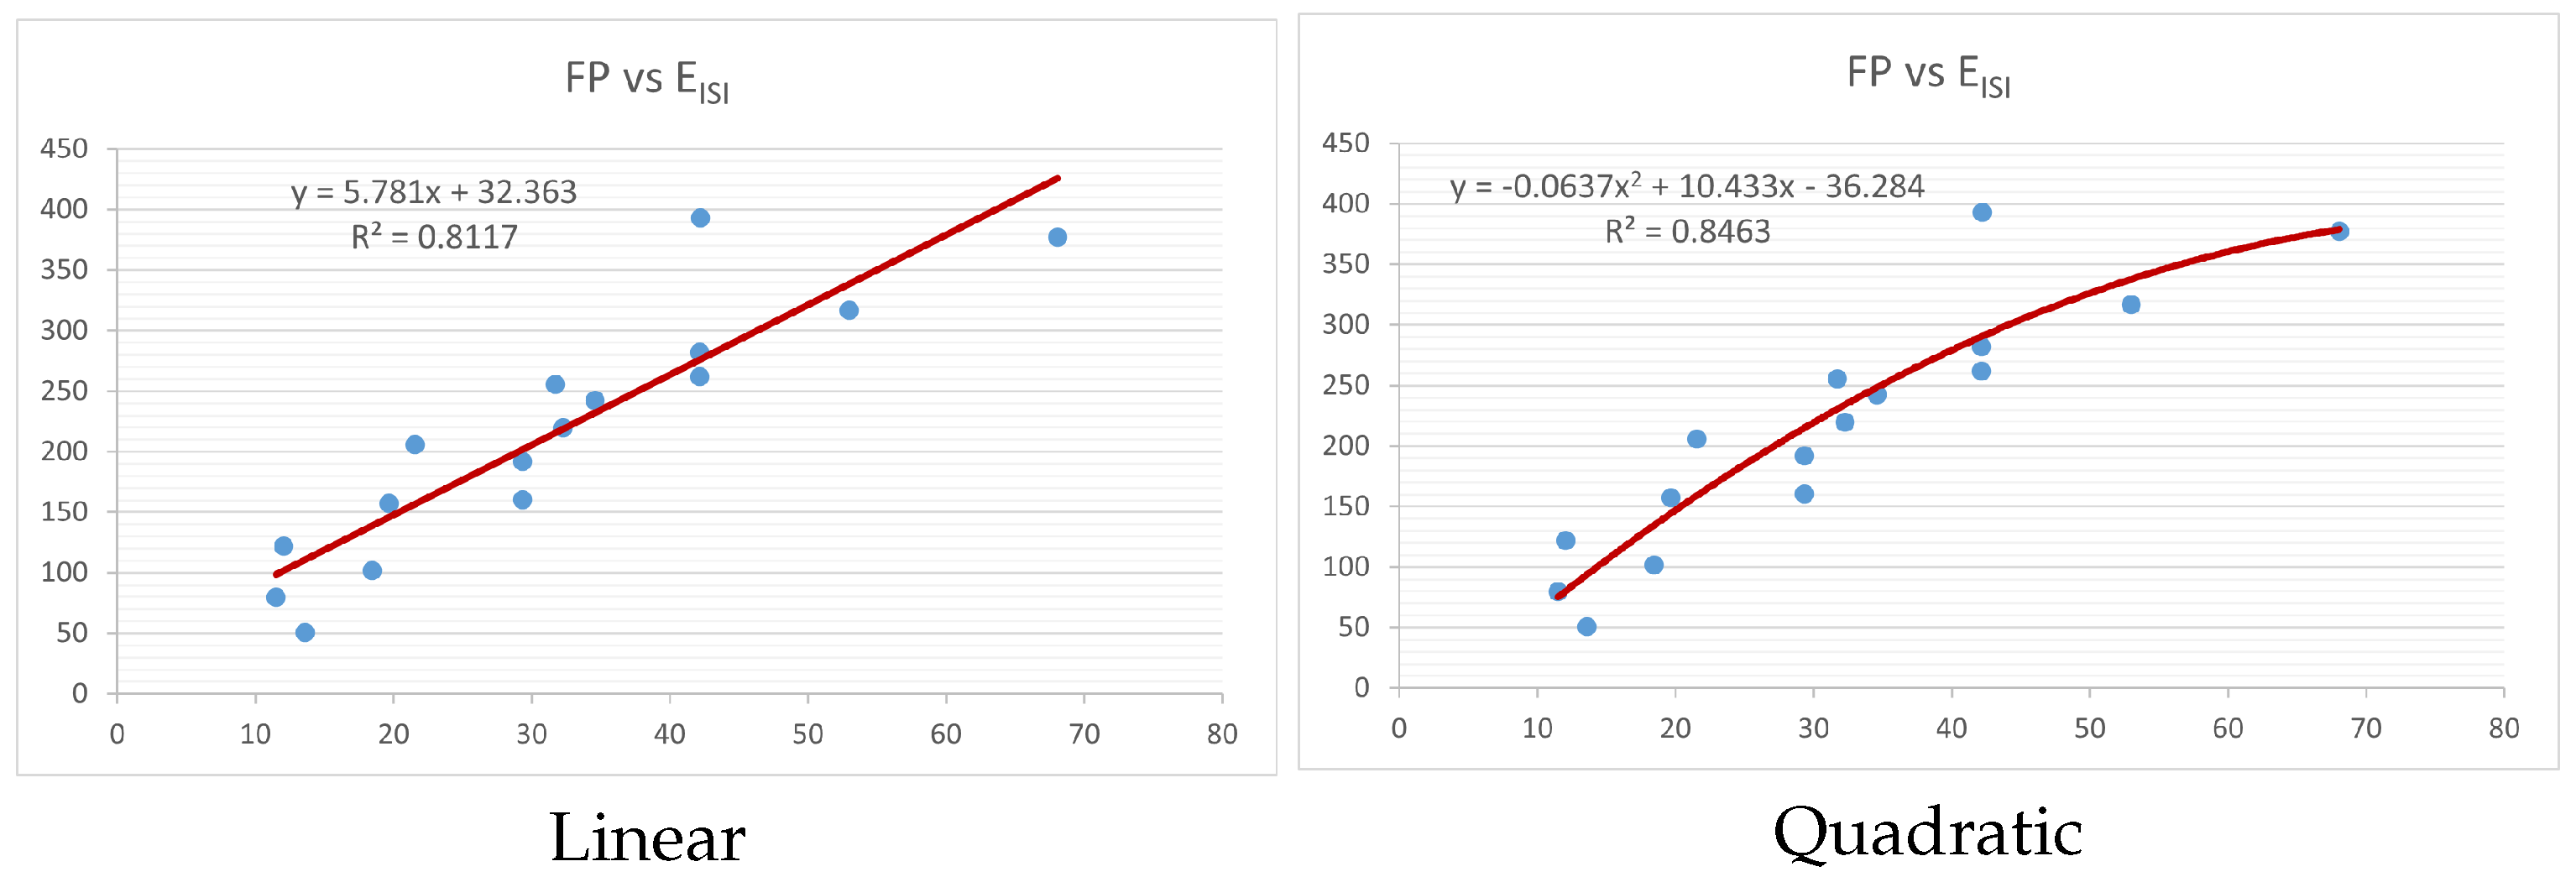
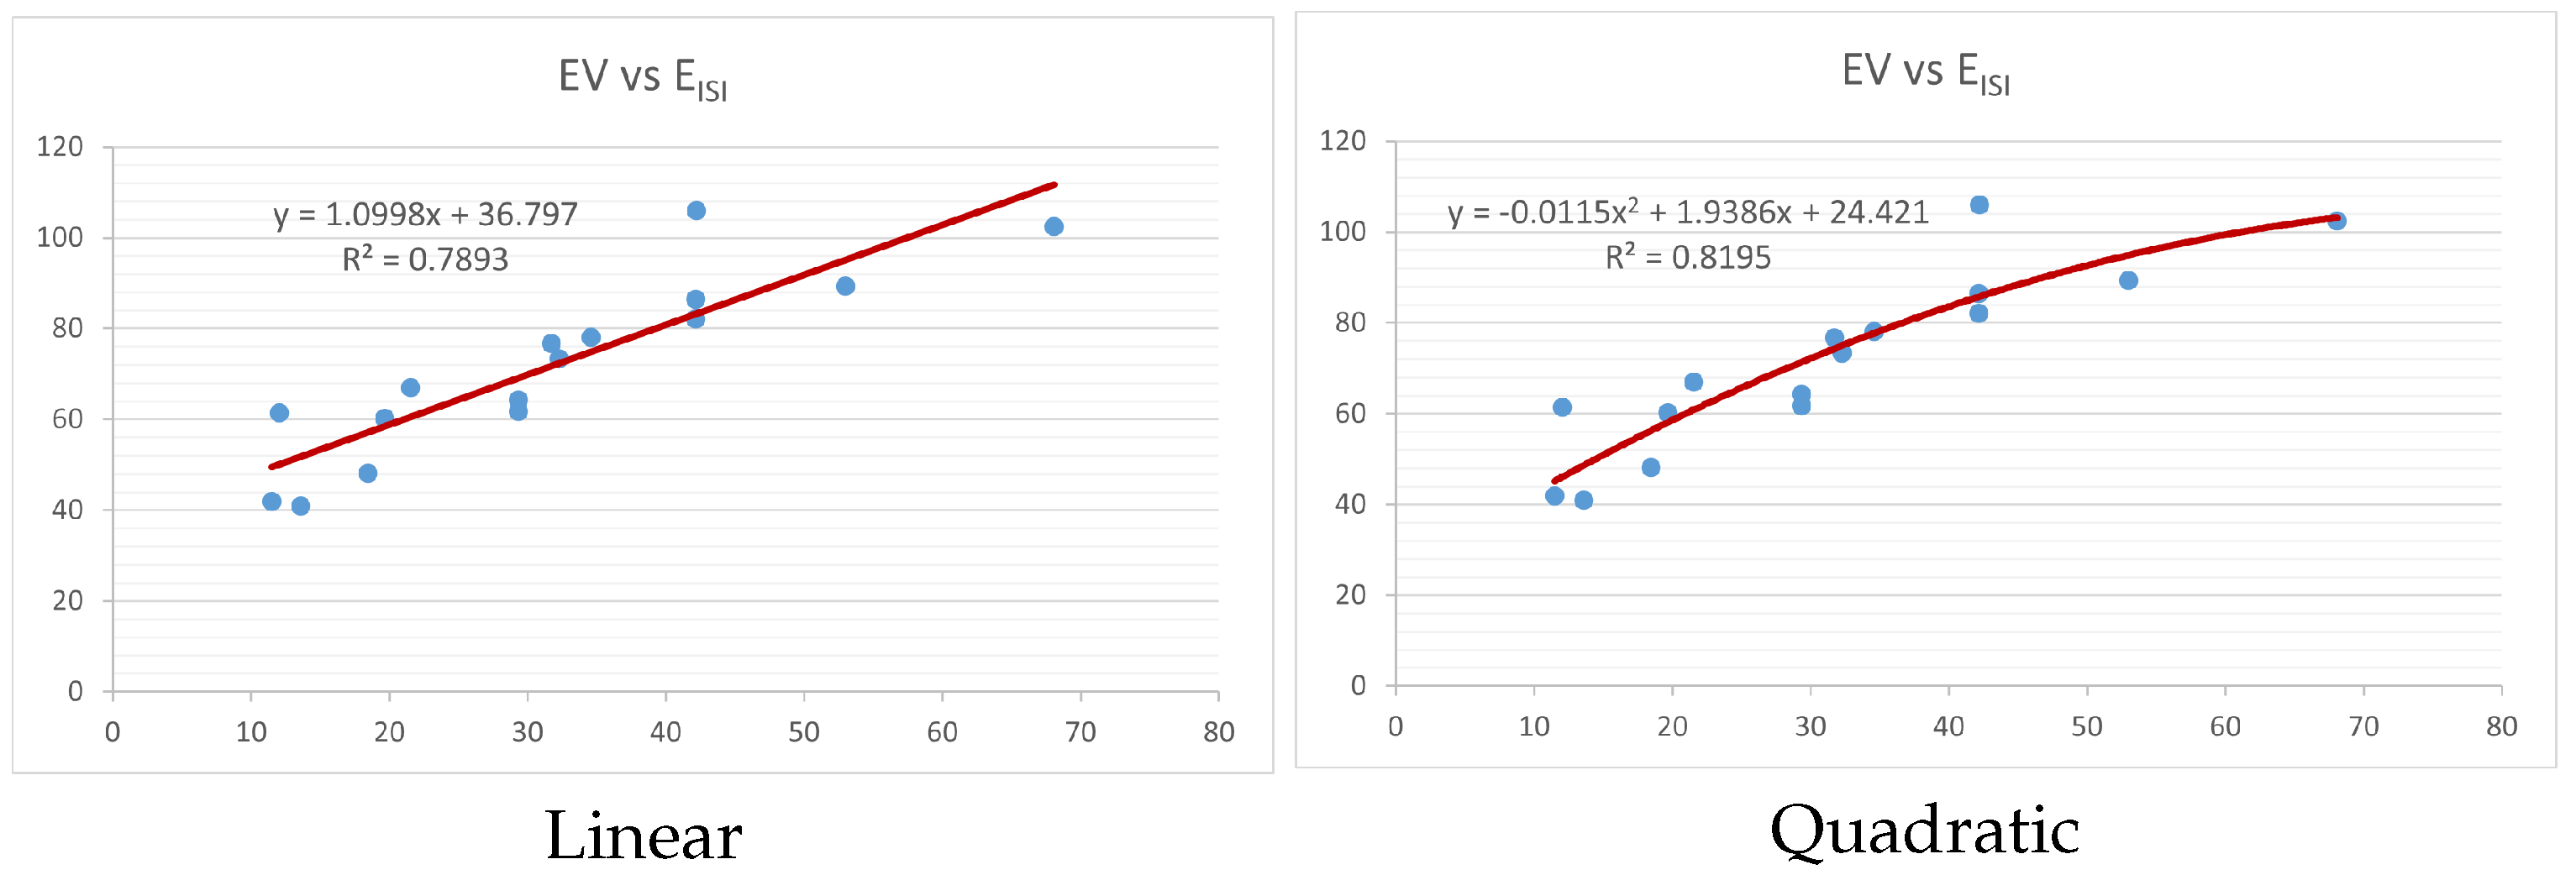
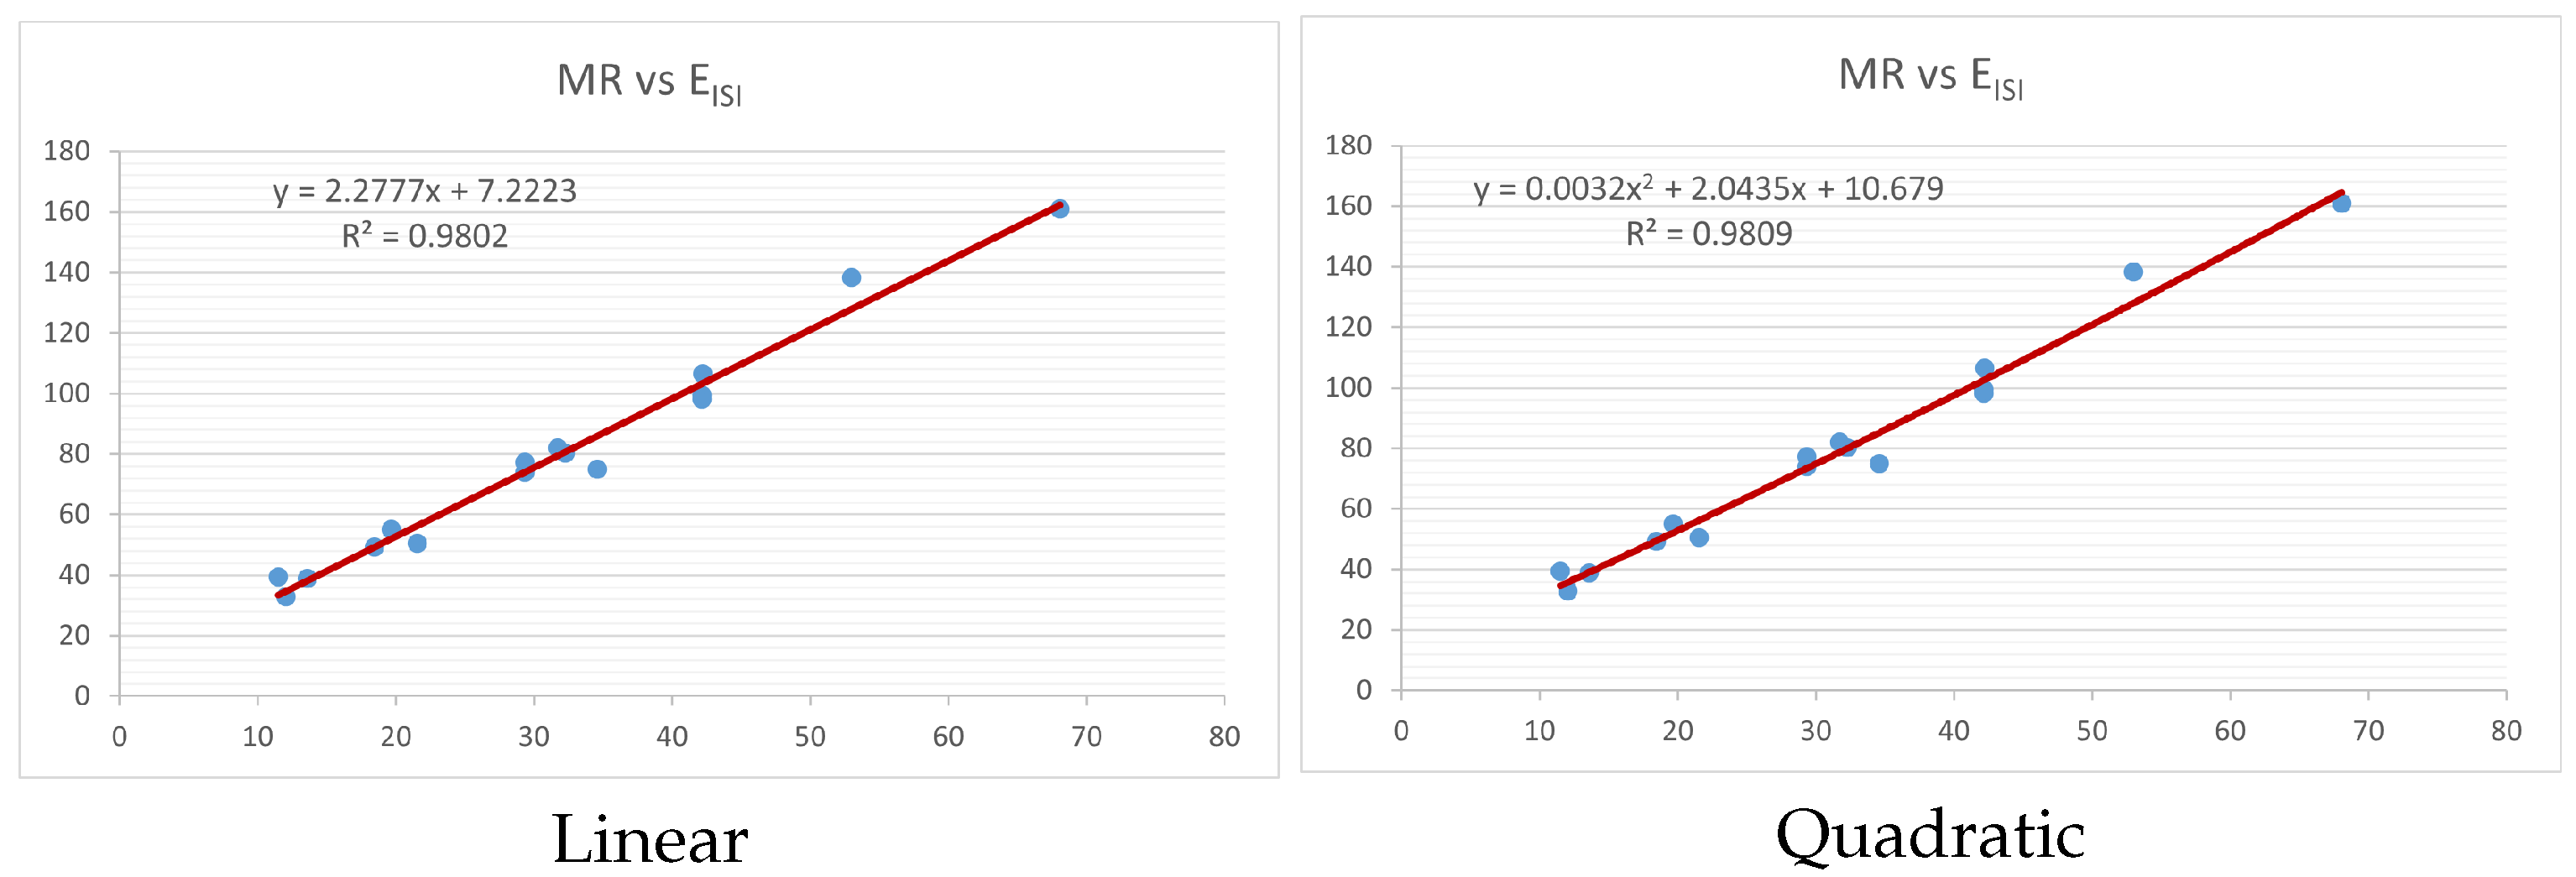
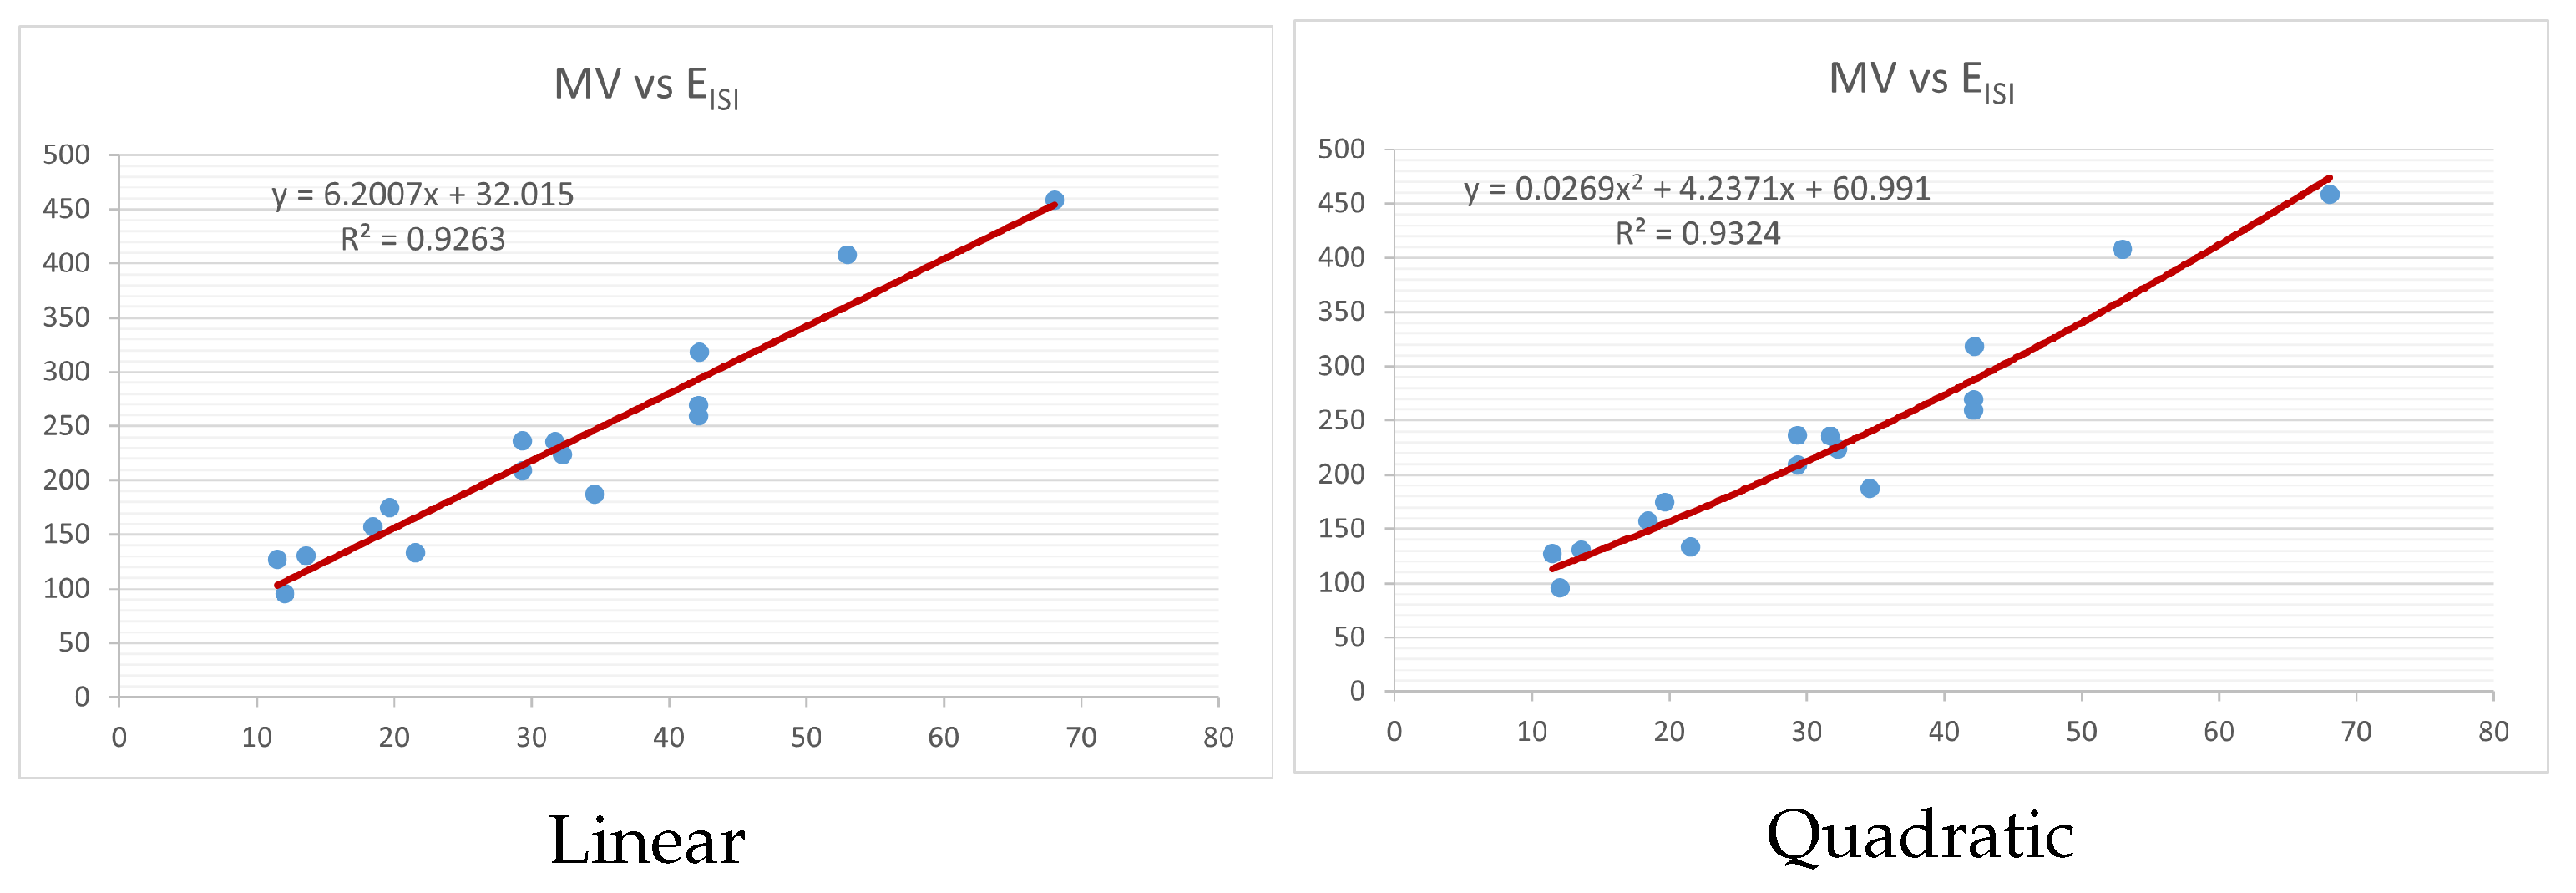
Figure 4,
Figure 5,
Figure 6,
Figure 7,
Figure 8 and
Figure 9 show the comparison of linear and quadratic regression analysis for the physicochemical properties of the alkaloids against the
index. Along the regression line, the data is dispersed. A dense scattering indicates strong correlations. The approximated linear and quadratic regression equations for the physicochemical properties with the
index are as follows:
Similarly, the comparison of linear and quadratic regression analysis for the physicochemical properties of the alkaloids against the
energy is displayed in
Figure 10,
Figure 11,
Figure 12,
Figure 13,
Figure 14 and
Figure 15. Below are the approximated linear and quadratic regression equations for the physicochemical properties with the
energy:
Models of linear and quadratic regression have distinct curves. We used two regression models in order to provide good, appropriate, and notable findings. It is evident from
Table 4 and
Table 5 that quadratic regression yields better and more useful results when examining the characteristics of alkaloids. There are several articles following the same pattern, that is, utilizing more than two regression models. By using two regression models, we can determine which is better and compare the results computationally. The use of multiple regression models in an article improves the depth, robustness, and reliability of the analysis, allowing researchers to examine various aspects of the data and reach more thorough conclusions. While the linear regression model is useful, the quadratic model is more applicable in the absence of alkaloid structural results. In real-world data, quadratic models are helpful for identifying nonlinearity, allowing for curved relations and capturing complex relationships. By enhancing model fit, they raise the accuracy of predictions and provide a deeper comprehension of the underlying activities. In addition to capturing curvature, quadratic models offer a more complex interpretation. Additionally, they are able to detect threshold effects, which are important in disciplines like environmental sciences and economics.
Figure 4,
Figure 5,
Figure 6,
Figure 7,
Figure 8,
Figure 9,
Figure 10,
Figure 11,
Figure 12,
Figure 13,
Figure 14 and
Figure 15 display the graphs for each of the six characteristics, including molar weight, boiling point, flash point, enthalpy of vaporization, molar refractivity, and molar volume. Although the relationship is significant in all graphs, quadratic regression appears to be a better fit for estimating alkaloids’ properties. Alkaloids are essential compounds that are utilized in the production of medications. Consequently, the findings presented in this article can be used by chemists to investigate alkaloids for various purposes. In other words, regression models and molecular descriptors are theoretical tools that help investigate chemical structures in a way that saves money and time.


