1. Introduction
Global air passenger demand is increasing annually, and this growth is expected to continue rising steadily in the future as air travel becomes more accessible due to economic development [
1]. The International Air Transport Association (IATA) predicts that the number of air travelers will surpass pre-COVID-19 levels in 2024 [
2], and is projected to reach 8.2 billion by 2037 [
3]. However, the construction or expansion of significant infrastructure, such as airports, can take many years. If airports fail to keep up with the growing passenger demand, travelers may face unprecedentedly long waiting times at airports.
The challenge of aviation security lies in balancing two conflicting objectives: enhancing aviation security while also improving the service for passengers. Given that minor errors can have catastrophic consequences, such as terrorism, great care must be taken in implementing aviation security measures. In response to the heightened awareness of aviation security following the 9/11 terrorist attacks, airports have implemented more comprehensive security protocols to ensure safety, including more rigorous screening procedures [
4]. Additionally, the occurrence of pandemics, such as COVID-19, has further complicated airport security screening procedures. For example, the United States Department of Homeland Security has introduced new entry requirements for international visitors to mitigate the spread of the disease [
5].
As the level of security has increased, the time required for security screening has also increased, leading to issues such as longer waiting times for passengers. The duration of waiting at security screening checkpoints is a crucial factor in determining passenger satisfaction [
6]. However, it is essential to maintain a high level of aviation security and not compromise it solely for the purpose of improving service quality. Therefore, it becomes necessary to enhance service efficiency while upholding stringent security measures. To address the pressing issue of passenger congestion, various approaches are being actively researched to enhance passenger satisfaction [
7]. Ongoing studies focus on the integration of diverse technologies to tackle airport-related challenges and devise innovative solutions using new technologies. For example, certain airports are implementing millimeter wave imaging, computerized tomography scanners, and facial recognition systems to expedite security screening procedures [
8]. However, it is important to note that these advancements primarily pertain to hardware improvements. While they alleviate congestion, further innovations at airports can be achieved through breakthroughs in software and policy implementation.
Despite technological advancements and the expansion of infrastructure, passenger congestion remains one of the most persistent challenges in airport operations. To address this issue, this study focuses on dynamically and optimally allocating passengers to departure areas under uncertainty and fluctuation. Specifically, it formulates a dynamic passenger allocation problem in airport security operations, aiming to balance workloads, minimize the number of waiting passengers and passenger travel distance. This study proposes an integrated approach that combines optimization using mixed integer linear programming (MILP) with performance evaluation through discrete event simulation (DES). The model focuses specifically on improving airport security screening procedures, which are known as the primary bottleneck processes at airport passenger terminals [
9]. Due to the inherent unpredictability of human behavior, the proposed model adopts a dynamic rescheduling strategy to accommodate uncertainties in the passenger handling process and adaptively update the operational plan, while also considering the frozen period. The effectiveness and validity of the proposed approach are verified by comparing the simulation results. The simulation experiment tests five different scenarios, including the current system and the proposed mathematical model. The scenarios are evaluated based on three criteria: workload balance between multiple departure areas, the number of passengers in the queue, and passenger travel distance. The results of the simulation analyze the enhancements achieved in the security screening areas. The contributions of this study are summarized as follows: (1) A novel mathematical model that optimally allocates passengers to specific departure areas is proposed. (2) A dynamic rescheduling strategy integrated with a DES model is proposed to enable realistic representation of airport operations. (3) An empirically informed operational framework is introduced to provide practical and implementable solutions under uncertainty.
The remainder of this paper is structured as follows.
Section 2 provides a detailed review of related works on workload balancing and congestion relief using different methodologies.
Section 3 aims to clarify the problem of congestion and presents the solution approach for this research.
Section 4 presents details of the MILP model and outlines the linearization process.
Section 5 explains the proposed dynamic rescheduling strategy.
Section 6 provides the details of the DES model.
Section 7 presents the results of numerical experiments and compares the performance of the proposed method with other scenarios. Lastly, conclusions are presented in
Section 8.
2. Literature Review
Workload balancing, in general, involves managing variations in task loads over time to prevent congestion and ensure stable system performance [
10]. By minimizing imbalances, organizations can better anticipate workload peaks and allocate resources more effectively, ultimately improving overall operational efficiency [
11]. Its importance has grown in large-scale public infrastructures such as airports, where irregular passenger flows often lead to long queues, bottlenecks, and inefficient resource utilization. In such environments, the ability to dynamically balance workloads across key processes—such as check-in, security screening, and boarding—has direct implications for passenger experience and operational reliability. As global air travel continues to increase, effective workload balancing strategies tailored to the unique dynamics of airport terminals have become crucial. This has led to growing interest in using simulation and optimization techniques to model and manage passenger flow in real-world airport settings.
Simulation-based approaches have been widely applied to improve passenger flow and operational efficiency at airports. Early efforts such as Ma et al. [
12], Enciso et al. [
13] focused on analyzing passenger flow under varying terminal layouts and service configurations. These studies employed simulation models incorporating passenger behavior and layout characteristics, providing valuable insights into optimal terminal design and waiting time reduction. Building on such approaches, many researchers have adopted DES techniques to evaluate and optimize specific airport processes. For example, Takakuwa and Oyama [
14] identified the check-in process as a major bottleneck and demonstrated that reallocation of counters and support staff could significantly reduce missed flights. Wang et al. [
15] proposed an optimization framework for minimizing passenger waiting times at airport security. By incorporating queueing theory and Monte Carlo simulations, they quantified average and variance of waiting times under varying gate setups. Refs. [
16,
17,
18,
19] have addressed issues across check-in, security screening, and resource allocation, consistently showing that simulation-guided adjustments lead to measurable performance improvements. To better capture passenger heterogeneity and dynamic behavior, some studies have employed agent-based simulation models. Notably, Schultz and Fricke [
20] used a grid-based stochastic approach calibrated with empirical data, while Anagnostopoulou et al. [
21] demonstrated that mobile app-guided routing strategies could effectively reduce terminal congestion. These simulation-based efforts collectively underscore the importance of incorporating both process-level and individual-level perspectives when modeling airport operations.
Beyond simulation, some researchers have proposed advanced mathematical and predictive models to further enhance airport operations. For instance, Liu and Chen [
22] introduced a deep learning-based framework combining stacked autoencoders and deep neural networks to predict hourly passenger flow, while Lin et al. [
23] developed a model estimating occupant distribution in terminal zones based on flight schedules and dwell times. Ebert et al. [
24] proposed a likelihood-free parameter inference framework for a dynamic queueing network model. Utilizing approximate Bayesian computation, their model enabled simulation-based inference for a dynamic queueing system. The study also demonstrated practical applicability in resource allocation and operational decision-making aimed at improving passenger satisfaction. Guo et al. [
25] proposed a two-phased predictive system that forecasts airport transfer passenger flows in real-time. The system was implemented at Heathrow Airport and demonstrated superior performance compared to traditional time series models and legacy systems. These predictive models offer valuable input for proactive decision-making. Meanwhile, optimization-based approaches have also been employed. Solak et al. [
26] developed a multistage stochastic integer programming model to guide terminal expansion under uncertain demand, modeling the airport as a multi-commodity flow network. Hsu et al. [
27] proposed a binary integer program for dynamically allocating check-in facilities based on real-time passenger needs, resulting in significantly reduced waiting times.
Dynamic rescheduling is essential in operational systems to respond to real-time uncertainty and fluctuating demand. It enables timely adjustments to initial plans by reallocating resources or modifying schedules based on the current system state. Recent studies across various domains have addressed dynamic rescheduling problems. Zhu and Goverde [
28] proposed an integrated MILP model for passenger-oriented timetable rescheduling and passenger reassignment during railway disruptions. The proposed model was efficiently solved using an Adapted Fix-and-Optimize algorithm. They demonstrated that the model significantly reduces generalized travel times for all passengers. de Queiroz et al. [
29] proposed a dynamic scheduling framework to minimize the total weighted tardiness of patients in emergency departments. The framework combines a simple re-optimization heuristic that uses urgent-level-based patient queues with a variable neighborhood search, and incorporates a scenario-based planning approach to anticipate future events to schedule patients. They demonstrated that the proposed method significantly outperforms traditional re-optimization heuristics in scheduling performance. Schmitt et al. [
30] proposed a two-stage framework to minimize both total check-in time and conveyor belt degradation. The framework operates an MILP model to assign passengers and uses a dynamic optimization heuristic considering baggage weight to reallocate passengers as they arrive. They demonstrated that the proposed method significantly improves both operational efficiency and conveyor belt durability, outperforming traditional first-in-first-out and greedy algorithms.
Workload balancing has also been extensively studied in domains beyond airports, including manufacturing, logistics, and service systems. These studies have explored various dynamic and reactive strategies to optimize resource allocation under fluctuating demand. Techniques such as temporal networks, partial optimization, feedback control loops, and penalty-based mechanisms have proven effective in managing congestion and workload variability [
31,
32,
33,
34,
35,
36,
37,
38]. The insights gained from these diverse applications highlight the value of adaptive and real-time workload management approaches, which are highly relevant for addressing operational challenges in airport environments.
The contributions of this study are as follows. First, unlike prior research that rarely addresses direct passenger allocation to specific departure areas, this study develops a novel mathematical model that optimally allocates passengers to these areas. While previous studies [
14,
15] focused on improving specific processes like check-in or security screening, they did not incorporate real-time rescheduling strategies or passenger allocation under uncertainty. Our approach enhances airport operational efficiency by reducing the need for additional infrastructure expansion or staff redeployment, while concurrently decreasing passenger waiting times and improving overall service quality. Second, recognizing the limitations of traditional queueing theory in capturing the complexities of real-world airport operations, this study proposes a dynamic rescheduling strategy integrated with a DES model. While some studies [
22,
23,
24] developed prediction models for passenger flow, they did not integrate the forecasting results into operational decision-making through optimization, nor consider dynamic passenger reallocation. Optimization-based approaches such as those by Solak et al. [
26], Hsu et al. [
27] mainly focus on deterministic planning and do not incorporate simulation models that capture real-time variability and stochastic characteristics of airport terminals. In contrast, our study incorporates a dynamic rescheduling strategy that enables real-time decision-making under uncertainty and realistically reflects operational dynamics. Third, this research advances the literature by introducing a novel operational framework that is grounded in empirically informed passenger behavior models, thereby offering practical and implementable solutions for airport workload management under uncertainty.
3. Problem Description
As depicted in
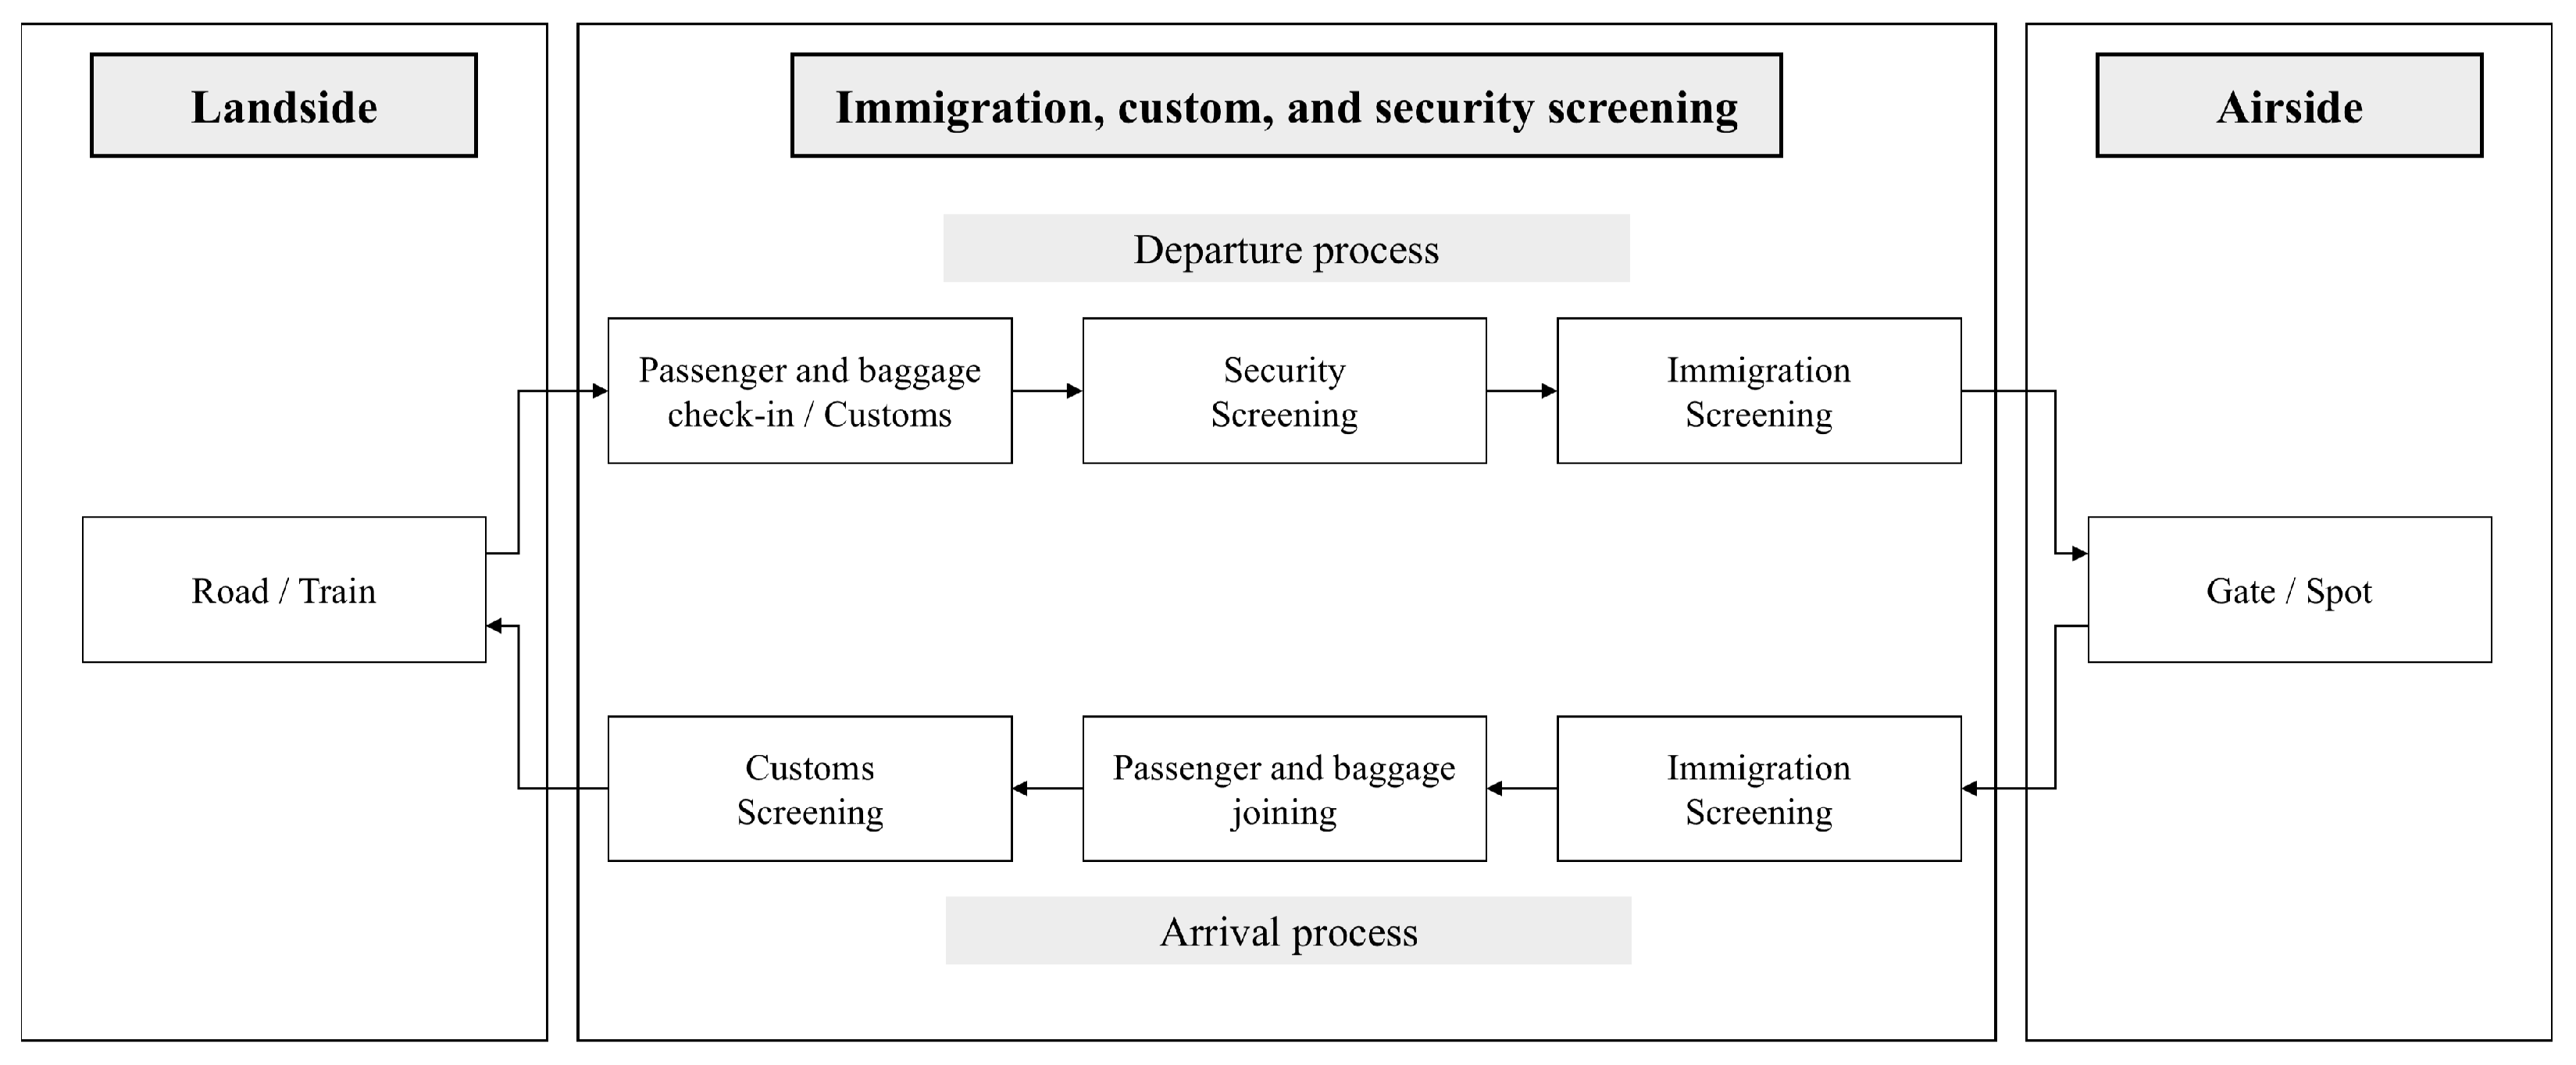
Figure 1, the airport can be divided into three main areas: landside, departure area (immigration, custom, and security screening), and airside. Airports implement three security screening processes for passengers. Firstly, each airline conducts security screening on checked baggage at the check-in counter. Next, at the departure area, security screening is carried out using door-shaped and portable metal detection equipment. Finally, there is an immigration screening process. However, due to long queues in the departure area for security screening, passengers experience unnecessary inconveniences such as excessive waiting times, which ultimately degrade the quality of service. This study aims to propose a method for enhancing service quality by distributing passengers across different departure areas, thus improving the allocation of departure areas in the aviation security process.
Most airline passengers tend to proceed to the nearest departure area immediately after check-in. However, this poses a problem as individual passengers are unaware of the waiting situation in other departure areas, resulting in a concentration of passengers in areas close to check-in counters of large airlines. Consider an airport with three departure areas and seven check-in counters, as shown in
Figure 2. Under the assumption that passengers are unaware of the waiting times at each departure area, which is typically the case, passengers served at check-in counters 1 and 2 are more likely to head to departure area A, the closest area to these counters. Conversely, passengers served at check-in counter 3 can observe and compare the waiting lines in both departure areas A and B since the counter is situated between the two areas. In such cases, a rational passenger would choose departure area A due to the shorter queue, thereby balancing out the waiting times between the two areas. However, the shortest waiting line in the entire airport may be found in departure area C, with only five passengers in the queue. If the passengers from check-in counter 3 had access to this information, they could have chosen departure area C, further optimizing the workload distribution across all departure areas. Providing information regarding waiting times can improve the workload balance of departure areas. However, if every passenger has access to queue information, many passengers will rush to departure area C, quickly overwhelming it and making areas A and B appear less occupied. Therefore, to address this issue, each passenger is allocated to a departure area based on historical data, ensuring optimal workload balance in this study.
To address this issue, some airports, including Incheon International Airport, provide a service that predicts the number of passengers at each departure area over time. Unfortunately, only a small number of experienced passengers utilize this system to find areas with shorter waiting times, and the alleviation of congestion is not significant. Even if this service becomes popular and widely used by most passengers, the prediction based on fixed time intervals (such as every hour) does not completely resolve the problem of uneven passenger distribution across specific departure areas.
This study aims to develop a mathematical model that distributes passengers across the departure area by allocating departure areas in advance, starting from the check-in counter, using data-based passenger prediction. In developing this mathematical model, it is assumed that the number of passengers arriving for each flight per hour is deterministically known through data-based prediction.
5. Dynamic Rescheduling Strategy
In this paper, we present a dynamic rescheduling approach that utilizes a deterministic scheduling solver to adaptively update the plan and accommodate uncertainties in the passenger process [
39].
Figure 3 illustrates the proposed conceptual framework for dynamic rescheduling.
The proposed approach is composed of a solver, a simulator, and a controller module. The solver generates an optimal schedule by (re)solving the deterministic scheduling problem for passenger congestion balancing in airport passenger terminals. The simulator is designed as a DES model that considers the probability functions for the arrival rate of passengers, the handling rate of check-in counters and security screening lanes, and the behavior of passengers. The schedule generated by the solver is reflected in the simulator to identify the effect in the real-life environment through simulation. The controller determines whether to trigger the solver by checking for the rescheduling condition. In the simulator containing a stochastic nature, the schedule derived from the deterministic scheduling problem gradually moves away from the optimum. Therefore, updating the plan is required for flexibly responding to situations with uncertainty. The plan is periodically rescheduled every fixed amount of time. Then, the initial schedule is replaced with the newly obtained re-optimized schedule by the solver.
The mathematical model creates plans at fixed time intervals, but its predictive accuracy tends to decrease as the planning window extends. To reduce the discrepancy between the estimated and actual number of arriving passengers, the plan is periodically updated using a dynamic rescheduling strategy. The proposed strategy is mathematically formulated as the MILP model over a planning window of length
, which includes the current time interval
t and the future intervals
, as defined in
Section 4.3. The model is formulated as follows:
Constraint (
11) defines
as the cumulative number of passengers assigned to departure area
g in all past intervals
. These intervals are considered as a frozen period, which means that they have already occurred and are excluded from future scheduling. In other words, the allocations during the frozen period are fixed and not subject to rescheduling. Additionally, since passengers autonomously choose their departure gates, the actual allocations
are subject to behavioral uncertainty and must be derived from observed data rather than model-based decisions.
As an illustrative example when
,
Figure 4 shows that at
, a total of 12 passengers, including
, arrive at the terminal. Based on the allocation decision made at
, five passengers are assigned to departure area A, four to B, and three to C. Although some passengers who are physically closer to departure area B may be allocated to A, and those closer to C may be allocated to B, the system achieves workload balancing by assigning 7 passengers to each departure area. However, in practice, passengers do not follow this deterministic allocation and instead select departure areas stochastically. As shown in
Figure 5, at
, the actual allocation may result in six passengers in A, seven in B, and eight in C. Without dynamic rescheduling, the model cannot respond to such uncertainty, which reduces prediction accuracy. If the system incorporates rescheduling based on the situation observed at
, the 15 passengers arriving at
can be reallocated accordingly. As a result, six passengers are assigned to A, five to B, and four to C, resulting in a balanced allocation with twelve passengers in each departure area.
6. Discrete Event Simulation Model
The DES model was built to compare the proposed dynamic rescheduling method with the current system from a process-oriented perspective. The aviation security process simulation for this study corresponds to the simulator component in
Figure 3 and can be divided into three parts: landside, departure area, and airside, as illustrated in
Figure 6.
Figure 6 illustrates the overall aviation security process. Among these parts, the proposed strategy plays a role in the interface between check-in counters and the departure areas, as highlighted in the red box. The proposed strategy dynamically allocates passengers from each check-in counter to departure areas based on real-time congestion information. This allocation aims to balance the workload across security processes and reduce bottlenecks before passengers enter the departure area.
6.1. Input Data
The distribution of passenger arrivals for each time interval was based on the expected number of passengers provided by IIAC. The expected passengers for each departure area were provided by the airport, and by summing them up, the distribution of arrivals for the total number of passengers could be confirmed.
Figure 7 illustrates the distribution of passenger arrivals for departures on a typical (representative) day, as provided by IIAC.
In the mathematical model, the passenger arrival distribution by airline was assumed to follow a Poisson distribution with a parameter value of 2, which was used for the simulation. This assumption was validated by analyzing historical arrival data from IIAC. A Chi-square goodness-of-fit test was conducted to assess the fit between observed passenger arrival counts and the Poisson distribution. The test results showed no significant difference at the 5% significance level (
), supporting the appropriateness of the Poisson distribution for modeling passenger arrivals in this context. Data for each flight of each airline were generated based on this distribution, and a dataset was constructed by summing up the number of individuals at each check-in counter. To ensure robustness, the simulation experiment involved generating 30 datasets in accordance with the central limit theorem. Some example datasets are presented in
Figure 8, and one dataset with more detail is exemplified in
Table 2.
6.2. Model Specifications and Assumptions
In the flight security process simulation, it is necessary to define and incorporate the processing time at different stages of the experiment. These stages include the passenger’s arrival at the check-in counter, the baggage check-in process, the movement to the departure area, the security screening process in the departure area, and the immigration check-in process. To determine the processing time for each stage, various factors such as aviation policy, the relevant literature, and actual data were considered. A triangular distribution was assumed with a minimum time of 15 s, a maximum time of 35 s, and a mode time of 22 s for passing through the door-shaped detection equipment, security screening conducted by security guards, and immigration screening [
40]. To address dynamic passenger flow and prevent congestion, the simulation model incorporates periodic rescheduling mechanisms [
39,
41,
42,
43,
44]. Specifically, rescheduling is triggered every 1 h of simulation time, during which the system reallocates passengers to departure areas. This fixed interval was selected because operational data from Incheon International Airport are provided on an hourly basis.
Figure 9 provides a simplified map of the passenger terminal at Incheon International Airport. In the simulation model, a total of 10 check-in counter areas were utilized, excluding counters A and B. Among the six departure areas, four were included, while departure areas 1 and 6, designated for fast-track services, were not considered. Within each departure area, eight security screening lanes, comprising door-shaped metal detectors and security guards, could operate concurrently. The operating hours for the departure areas are as noted in
Table 3. These assumptions were made to accurately represent the operational characteristics of the airport. The travel time from the check-in counters to the departure areas was measured in seconds (refer to
Table 4) and incorporated into the simulation model.
6.3. Model Formulation and Execution Algorithm
In the proposed strategy, the mathematical model served as the foundation for allocating check-in counters and departure areas on an hourly basis. An upper limit was set for the number of passengers in each departure area, and the passenger arrivals were predicted based on time intervals. Passengers arrived at the check-in counters following the Poisson distribution, and upon arrival, each passenger was allocated to the departure area with the fewest passengers among the departure areas allocated to the check-in counter. However, due to the inherent uncertainty in predictions, the actual number of passengers could either exceed or fall below the predicted values. When the number of arrivals was lower than expected, the allocation was maintained, and the current status of departure area was reflected in the subsequent planning. Conversely, when the number of arrivals exceeded the prediction, the excessive passengers were allocated to the departure area to the closest check-in counter, and this updated status of the departure area was also reflected in the subsequent planning. The overall process is repeated for each time interval.
Table 5 shows in detail the steps taken in the proposed strategy, and
Figure 10 visualizes the overall flow of the proposed strategy.
6.4. Evaluation Metrics
The performance of the strategies was evaluated using the DES model. As shown in
Table 6, the performance measures include workload balance between multiple departure areas, the number of passengers in the queue, and passenger travel distance.
The experiments were conducted on a computer with an Intel Core i7-7700HQ processor (Intel Corporation, Santa Clara, CA, USA), 2.80 GHz, and 16.0 GB of RAM working under the Windows 10 Server operating system. We used the commercial solver Gurobi 11.0.2 to solve the mathematical model. The proposed optimization model was consistently solved in less than 1 s per run, demonstrating fast convergence and computational efficiency. This performance indicates that the method is suitable for real-time online applications, even under realistic input sizes. The Python programming language was used in building the DES model.
7. Numerical Experiments
7.1. Experimental Setting
The developed mathematical model and simulation can be utilized for evaluating airport operational processes in the following ways. Firstly, they can be employed to identify issues within the current process. Secondly, they can assess the significance of information updates. Lastly, they can evaluate the efficiency achieved through planning.
To validate the performance of the proposed strategy, we compared it with strategies 1 to 4 as shown in
Table 7. Strategy 1 simulated the current process, which was designed based on the movement pattern of passengers from the check-in counter to the nearest departure area. In strategies 2 to 4, it is assumed that the number of passengers at the departure areas was visually presented to passengers, and the information was updated at intervals of 10 min, 5 min, and in real-time, respectively. Strategies 2 to 4 were designed to reflect the behavior of passengers checking information and selecting the departure area with the shortest waiting time. The proposed strategy involved a simulation based on the proposed mathematical model, which demonstrated a method of allocating departure areas based on a predicted number of passengers for each time interval. It was described in
Section 6.3 7.2. Experimental Results
In this security-screening-process simulation experiment, 30 replications were conducted for each strategy to reflect the stochastic characteristics of the simulation environment. According to the central limit theorem, when the sample size exceeds 30, the distribution of the sample mean approximates a normal distribution even if the underlying population distribution is not normal [
45]. The difference in the number of passengers allocated to the departure area can be obtained by calculating the difference between the maximum and minimum allocated number of passengers by time interval and adding them up to determine the difference in the number of passengers allocated to each departure area. The number of passengers waiting means the sum of the number of passengers waiting for the entire planned period, and lastly, the average passenger travel distance means the distance traveled by each passenger to the departure area.
Table 8 shows the results for each strategy. To statistically validate the effectiveness of each strategy, one-way analysis of variance was conducted for the three performance indicators. The results showed statistically significant differences among the strategies for all indicators (
).
Comparing Strategy 1 with strategies 2 to 4, Strategy 1 simply moves to the nearest departure area from the check-in counter, while for strategies 2 to 4, passengers were assumed to utilize information regarding the number of passengers waiting in the departure areas, directing themselves to the area with the fewest passengers. In strategies 2 to 4, as the update interval for information decreases (ten minutes for Strategy 2, five minutes for Strategy 3, and real-time for Strategy 4), the effect of passenger distribution becomes greater. Consequently, it appears effective to inform passengers about the number of passengers waiting at each departure area in order to alleviate congestion. However, this approach is less effective than Strategy 1 when the update interval is long, and since passengers may move to more distant departure areas, the average travel distance increases by over 110 m compared to Strategy 1.
In the proposed strategy, the objective equation incorporates two weights, namely and . represents the weight assigned to achieve an equal distribution of passengers (workload balancing) among departure areas, while takes into account the distance passengers travel from check-in counters to the departure areas. In the long-term perspective, reducing waiting time by distributing passengers across departure areas may be considered an improvement in service quality. However, passengers tend to react more sensitively to what they perceive immediately rather than considering the overall perspective. Consequently, if passengers are allocated to departure areas further away from those directly in front of them, they may perceive the service quality to be inadequate. Thus, the ratio between the two weights must be carefully determined.
The sensitivity analysis of the weights
and
in the proposed strategy can be conducted by altering the ratio between the two values. To assess the performance indicators, we set
to 1 and vary
within the range of 0.0199 to 1.00 × 10
−16. The range of
was selected to conduct the trade-off between workload balancing and travel distance. We observed that when
decreases below 0.0036, workload balance and the number of waiting passengers no longer improve meaningfully, while the average passenger travel distance increases sharply. Therefore, the selected range effectively reflects the point beyond which increasing the weight on workload balancing does not lead to meaningful improvements in performance. The results are presented in
Table 9 and
Figure 11. By significantly reducing
compared to
(such as
= 1 and
= 0.001), the discrepancy between the number of passengers allocated to the departure area and the number of passengers waiting can be minimized. On the other hand, adjusting the weights to
= 1 and
= 0.0199 allows for the minimization of the average passenger travel distance.
Table 10 and
Figure 12 provide a comprehensive comparison of all strategies, including a simulation of proposed strategy. In terms of the difference in the number of passengers allocated to each departure area per hour, the results of the proposed strategy were balanced when compared to strategies 3 and 4. Additionally, It is important to note that the proposed strategy actually demonstrated good performance for both the short-term plan and long-term plan, as indicated in
Table 10 and
Table 11. While the proposed strategy performed worse than Strategy 1 in terms of average passenger travel distance, it exhibited significant improvements in other indicators, making it the most efficient alternative. Therefore, despite the higher average passenger travel distance in the proposed strategy, its overall effects surpassed those of Strategy 1, suggesting that the proposed strategy was the optimal choice.
Table 11 provides a detailed comparison of the proposed strategy with the results of Strategy 4, examining the effectiveness of proposed strategy, which involves the allocation of passengers from a long-term perspective. In contrast to Strategy 4, the proposed strategy exhibited shorter average passenger travel distances. While real-time allocation in Strategy 4 directed passengers to departure areas with fewer passengers waiting, irrespective of travel distance, the proposed strategy considered average passenger travel distance when allocating passengers to departure areas from a long-term perspective, yielding significant benefits. Another notable difference was observed in the number of passengers allocated to the departure area and the number of passengers waiting. Despite the substantial difference in the number of passengers allocated to the departure area, the proposed strategy had a smaller number of passengers waiting. This outcome can be attributed to the long-term perspective employed in the passenger allocation process. The proposed strategy achieved exceptionally favorable outcomes in terms of the number of passengers waiting and average passenger travel distance.
8. Conclusions
In this study, we proposed a mathematical model for allocating passengers from check-in counters to departure areas in airport terminals, aiming to improve the efficiency of the security screening process. The model minimizes a weighted sum of workload imbalance across departure areas and the total passenger travel distance. To enhance its adaptability to operational uncertainties, we also developed a dynamic rescheduling strategy composed of a solver, a simulator, and a controller module. The strategy incorporates a frozen period to ensure operational feasibility and continuously updates schedules based on real-time information.
Through simulations using real-world data, the proposed model demonstrated significant advantages over benchmark strategies, such as nearest-area and shortest-queue allocation. It achieved superior workload balancing, reduced passenger waiting times, and shortened travel distances. These results highlight the practical value of our approach for enhancing both terminal efficiency and passenger satisfaction.
Building on these findings, future research could extend the model by incorporating additional operational factors, such as passenger group behavior, varying security screening times, or integration with gate assignments. The proposed framework also has potential for broader application in other resource allocation problems under dynamic and uncertain environments. However, its applicability may be limited in settings where systems for capturing cumulative passenger information are not in place, and it does not account for uncertain passenger behaviors, such as those who do not proceed directly to the security screening areas.


