Article

Dynamical Analysis and Optimization of Combined Vibration Isolator with Time Delay

1
Department of Mechanics, College of Mechanics and Engineering Science, Hohai University, Nanjing 211100, China
2
Department of Electronic Engineering, Shanghai Jiao Tong University, Shanghai 200240, China
*
Author to whom correspondence should be addressed.
Mathematics 2025, 13(13), 2188; https://doi.org/10.3390/math13132188
Submission received: 6 June 2025 / Revised: 26 June 2025 / Accepted: 2 July 2025 / Published: 4 July 2025

Abstract

Vibration control has long been a key concern in engineering, with low-frequency vibration isolation remaining particularly challenging. Traditional linear isolators are limited in their ability to provide high load-bearing capacity and effective low-frequency isolation simultaneously. In contrast, quasi-zero stiffness (QZS) isolators offer low dynamic stiffness near equilibrium while maintaining high static stiffness, thereby enabling superior isolation performance in the low and ultra-low frequency range. This paper proposes a novel vibration isolation system that combines a grounded dynamic absorber with a QZS isolator, incorporating time-delay feedback control to enhance performance. The dynamic equations of the system are derived using Newton’s second law. The harmonic balance method combined with the arc-length continuation technique is employed to obtain steady-state responses under harmonic force excitation. The influence of feedback gain and time delay on vibration isolation effectiveness and dynamic behavior is analyzed, demonstrating the ability of time-delay feedback to modulate system responses and suppress primary resonance peaks. To further enhance performance, a genetic algorithm is used to optimize the control parameters under harmonic force excitation. The force transmissibility is defined as fitness functions, and the effects of control parameters on these metrics are examined. The results show that the optimized time-delay feedback parameters significantly reduce the transmitted force, improving the overall isolation efficiency. The proposed system provides a promising approach for achieving high-performance vibration isolation in low-frequency environments.

1. Introduction

Vibration phenomena are ubiquitous in both daily life and engineering applications, exerting detrimental effects on human health, living environments, architectural structures, mechanical equipment, and precision instruments. In mechanical systems, fatigue failures in joints due to cyclic loading remain a critical concern, prompting ongoing research into enhancing joint durability and reliability [1]. Bridges are susceptible to vibrations from environmental and operational loads, which can compromise structural integrity and affect ride comfort, highlighting the need for effective vibration control measures [2]. In the automotive industry, vehicle vibrations impact ride comfort and stability, leading to the development of hybrid vibration isolators that significantly reduce displacement and acceleration under various driving conditions [3]. Aerospace structures, particularly those utilizing aluminum alloys, are vulnerable to vibration-induced fatigue, necessitating experimental studies to understand and mitigate these effects [4]. Marine vessels face challenges from wave-induced vibrations, which can lead to fatigue damage in hull girders and other structural components, underscoring the importance of accurate fatigue strength estimation methods [5]. Additionally, advancements in fatigue assessment methodologies for ships and offshore structures are crucial for ensuring structural integrity and safety in marine environments [6].
To mitigate the adverse effects of vibration within acceptable limits, effective control strategies are essential. These not only enhance the operational stability and service life of structures but also improve system reliability and safety. With the increasing trend toward lightweight and high-performance engineering systems, structural sensitivity to external disturbances has intensified. Consequently, vibration control has become a critical aspect in ensuring proper system functionality, rather than merely a supplementary technique.

1.1. Related Works

Current vibration control methodologies primarily encompass passive and active control approaches. Passive control implementations typically employ vibration isolators and dynamic vibration absorbers (DVAs). Conventional isolators utilize spring-damper configurations to decouple vibration sources from protected structures. However, linear isolators face inherent limitations in reconciling sufficient load-bearing capacity with effective low-frequency isolation performance. To address this, researchers have developed nonlinear quasi-zero-stiffness (QZS) isolators featuring high-static–low-dynamic stiffness characteristics. Carrella et al. [7] proposed a nonlinear high-static–low-dynamic stiffness (HSLDS) isolator based on a three-spring configuration. Through theoretical derivation and numerical analysis, they revealed the distinct characteristics between force transmissibility and displacement transmissibility and elucidated the influence of system parameters on the isolation performance. This work provides a novel solution to the inherent trade-off between high static stiffness and low dynamic stiffness in conventional linear isolators. Zhao et al. [8,9] enhanced isolation bandwidth and reduced force transmissibility through multi-oblique-spring configurations. Gatti [10] proposed a nonlinear vibration isolator based on an X-shaped spring structure, which achieves a quintic quasi-zero stiffness characteristic by eliminating both linear and cubic terms in the force–displacement relationship. The system was systematically analyzed, revealing a significantly broader isolation bandwidth compared to conventional cubic systems. Zou et al. [11] pioneered a scissor-like structural configuration replacing oblique springs to achieve nonlinear stiffness and damping, demonstrating simultaneous low-frequency vibration isolation and resonance amplitude suppression. Wang et al. [12] conducted comprehensive research on the static and dynamic characteristics of a six-degree-of-freedom QZS isolation platform incorporating blade spring structures. Their work analyzed both the vibration isolation performance and the dynamic stability of the system, providing valuable insights into the design and application of multi-directional low-frequency isolators. Chen et al. [13] investigated a semi-active suspension control strategy based on negative stiffness characteristics, aiming to enhance the vibration isolation performance of vehicles.
DVAs operate by attaching auxiliary subsystems to primary structures, dissipating vibrational energy through tuned mass-spring interactions when absorber natural frequencies match excitation frequencies. Ground-connected DVAs exhibit superior vibration attenuation, particularly in large-amplitude scenarios, while non-grounded configurations may demonstrate frequency-dependent performance limitations. Ren et al. [14] designed a grounded damper-type DVA in which the primary and secondary systems of the conventional Voigt-DVA are additionally connected to the ground through damping elements. Their findings demonstrate that this configuration yields improved effectiveness compared to classical designs. Liu et al. [15] revisited the optimal damping ratio of the grounded DVA by employing a perturbation-based theoretical framework. Through numerical simulations and model comparisons, they verified that the derived optimal conditions align well with those obtained via the fixed-point theory, thereby reinforcing the validity and robustness of their analytical approach. Shen et al. [16] introduced a nonlinear energy sink with inerter-grounding elements, demonstrating adaptability for large-scale structures under complex operational conditions. Nevertheless, passive control strategies remain constrained in addressing high-precision requirements and nonlinear vibration scenarios.
Active control methodologies employ real-time feedback forces to suppress structural vibration responses, exhibiting exceptional low-frequency performance for diverse engineering applications. However, inherent time-delay phenomena in control loops may compromise system stability, potentially inducing equilibrium point destabilization, bifurcation behaviors, and chaotic dynamics [17,18,19]. With the growing depth of research into time-delay systems, it has been increasingly recognized that appropriately introduced delays can enhance system stability. By carefully tuning the delay parameters, one can effectively suppress undesired vibrations and improve the overall dynamic stability of the system. Vyhlídal et al. [20] conducted optimization and analysis of a two-stage time-delay vibration isolator and proposed a novel multi-degree-of-freedom isolator incorporating active control. Their design demonstrated effective suppression of platform vibrations through the integration of time-delay feedback mechanisms. Gao et al. [21] proposed a method for real-time adjustment of the system’s natural frequency by introducing an additional non-delay control term. This approach significantly broadened the operational frequency range and provided novel design insights and theoretical support for the practical implementation of time-delay vibration isolators. Sun et al. [22] explored novel applications of internal resonance in delayed absorber–isolator hybrid configurations. Ji et al. [23] investigated a semi-active suspension system incorporating an improved time-delay compensation control strategy. By establishing a semi-active suspension model with inherent time delays, they designed a dynamic delay compensation controller and integrated it with a Takagi–Sugeno (T–S) fuzzy controller to achieve effective dynamic compensation of the time delay. This approach significantly enhanced both ride comfort and handling stability of the vehicle. Cai et al. [24] introduced a proportional-retarded (PR) control strategy for active QZS isolators, and, by employing a dominant pole placement algorithm, optimized the transient response and significantly improved the low-frequency isolation capability and control robustness. Liao et al. [25] proposed a quasi-zero stiffness vibration isolator incorporating time-delayed cubic displacement feedback and systematically investigated the effects of feedback gain and delay on isolation performance, yielding explicit optimal parameter ranges for enhanced low-frequency vibration attenuation.
Motivated by the aforementioned considerations, this paper proposes a combined vibration attenuation strategy by integrating a DVA with a vibration isolator. The objective is to achieve enhanced vibration suppression through the synergistic effects of energy dissipation by the absorber and motion isolation by the isolator. To further improve the system’s dynamic response under external excitations, a time-delay feedback control mechanism is introduced into the active control scheme. The incorporation of time delay not only broadens the control design space but also enables significant improvement in vibration isolation performance compared to conventional passive or active methods.

1.2. Contributions and Paper Organization

In this paper, a grounded dynamic vibration absorber is integrated with a QZS isolator, and an active control device incorporating time delay is introduced. The dynamical behavior and vibration isolation performance of the resulting system under harmonic excitation are investigated. In the proposed model, the QZS structure is composed of three linear springs, and the external force is applied vertically to the primary structure. The main contributions of this paper are summarized as follows:
  • We propose a combined vibration isolation system that combines a grounded dynamic vibration absorber with a quasi-zero stiffness isolator, augmented by a time-delay feedback control scheme to improve dynamic performance.
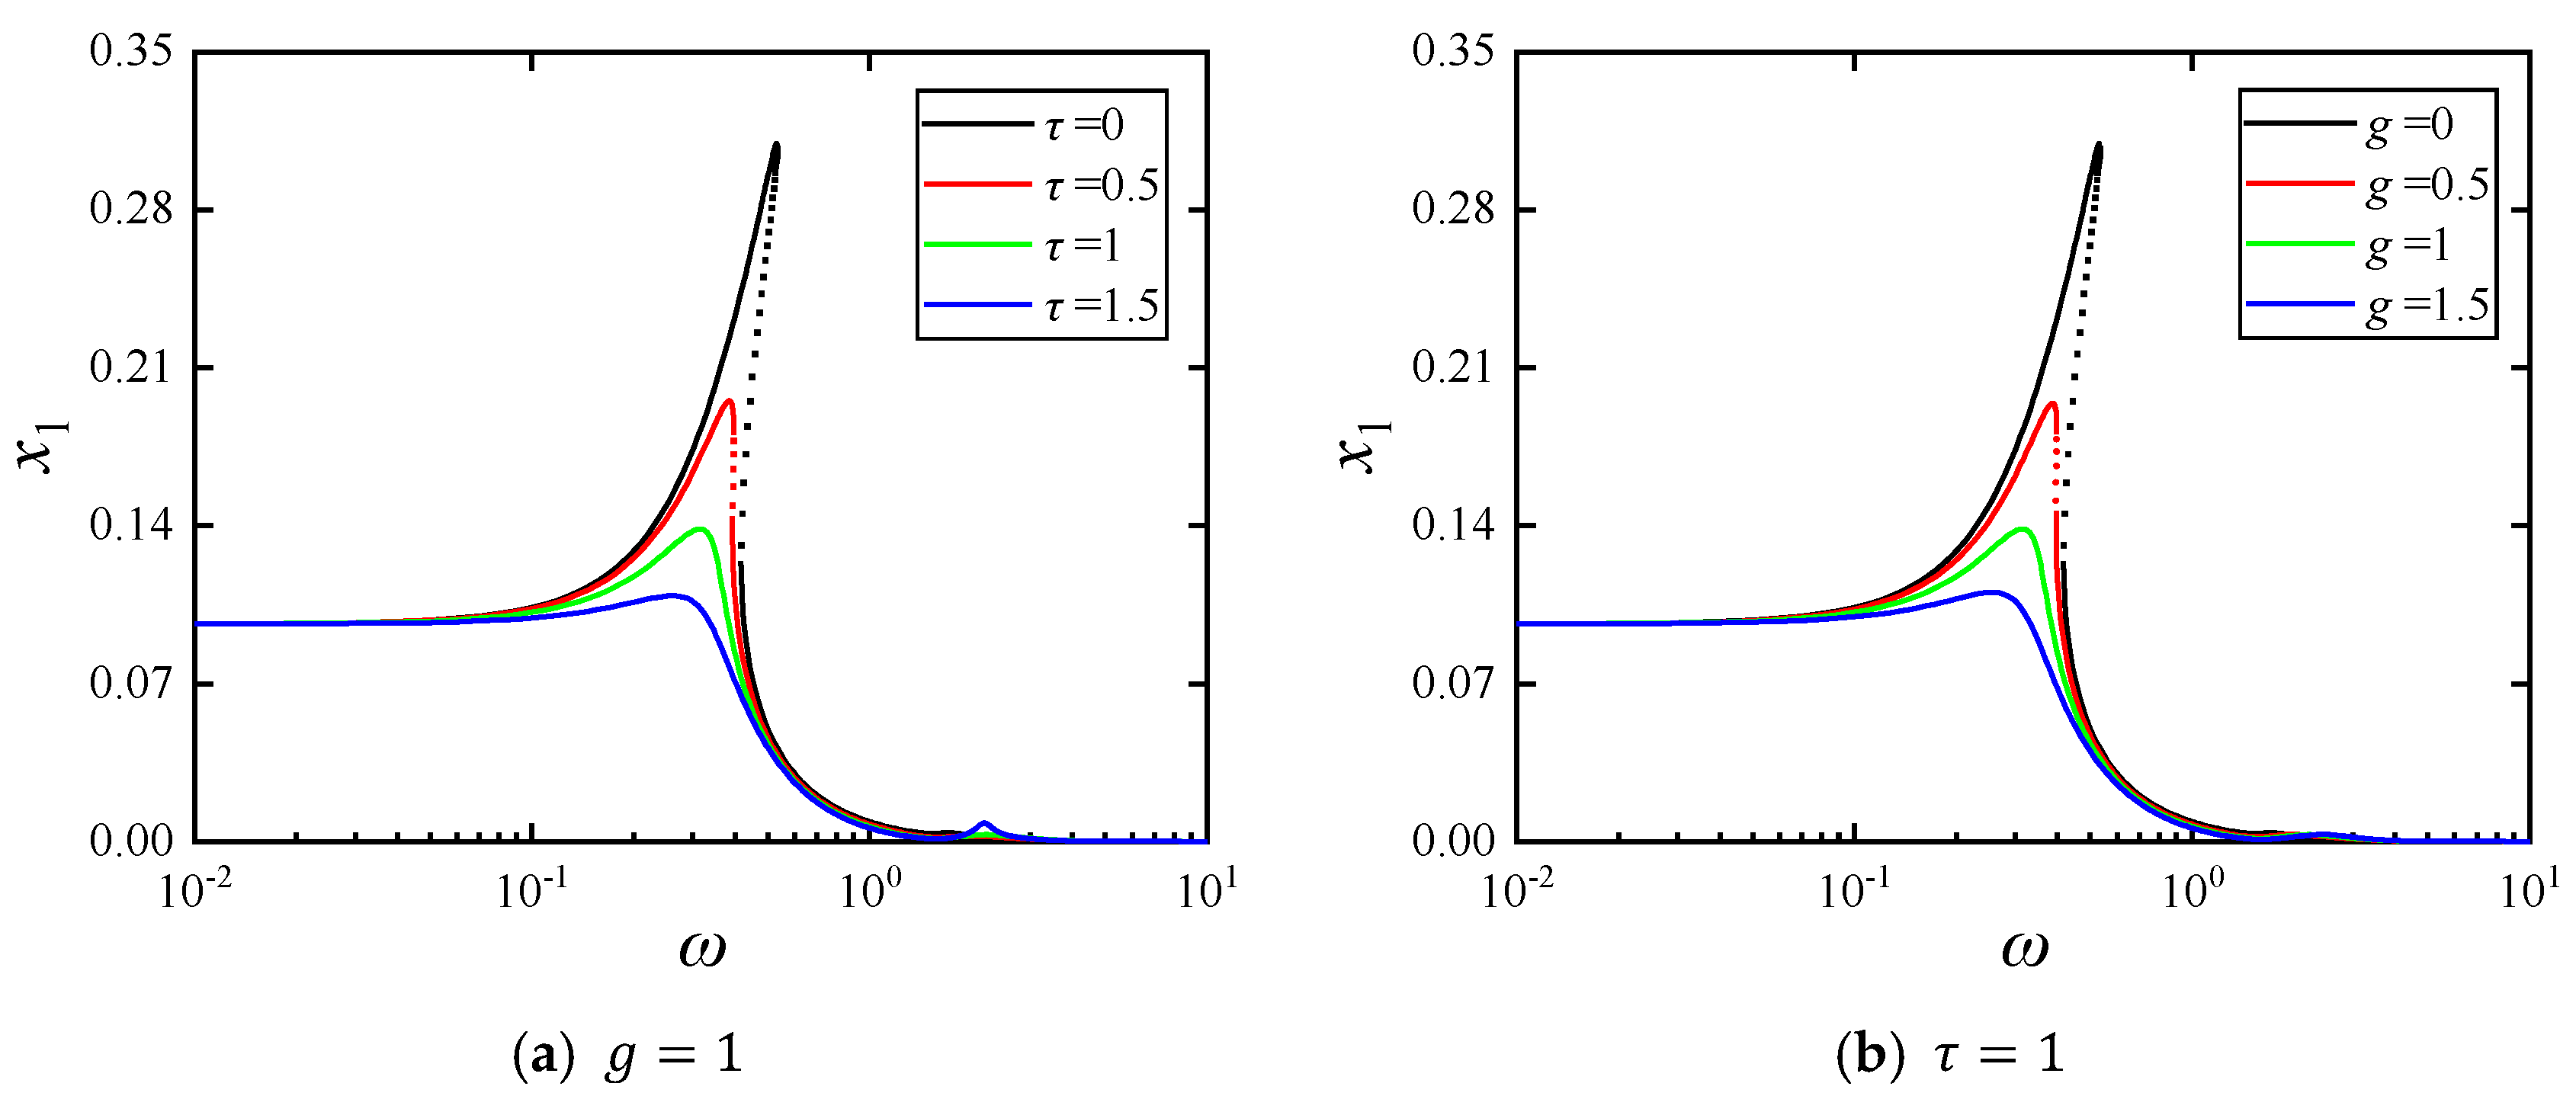
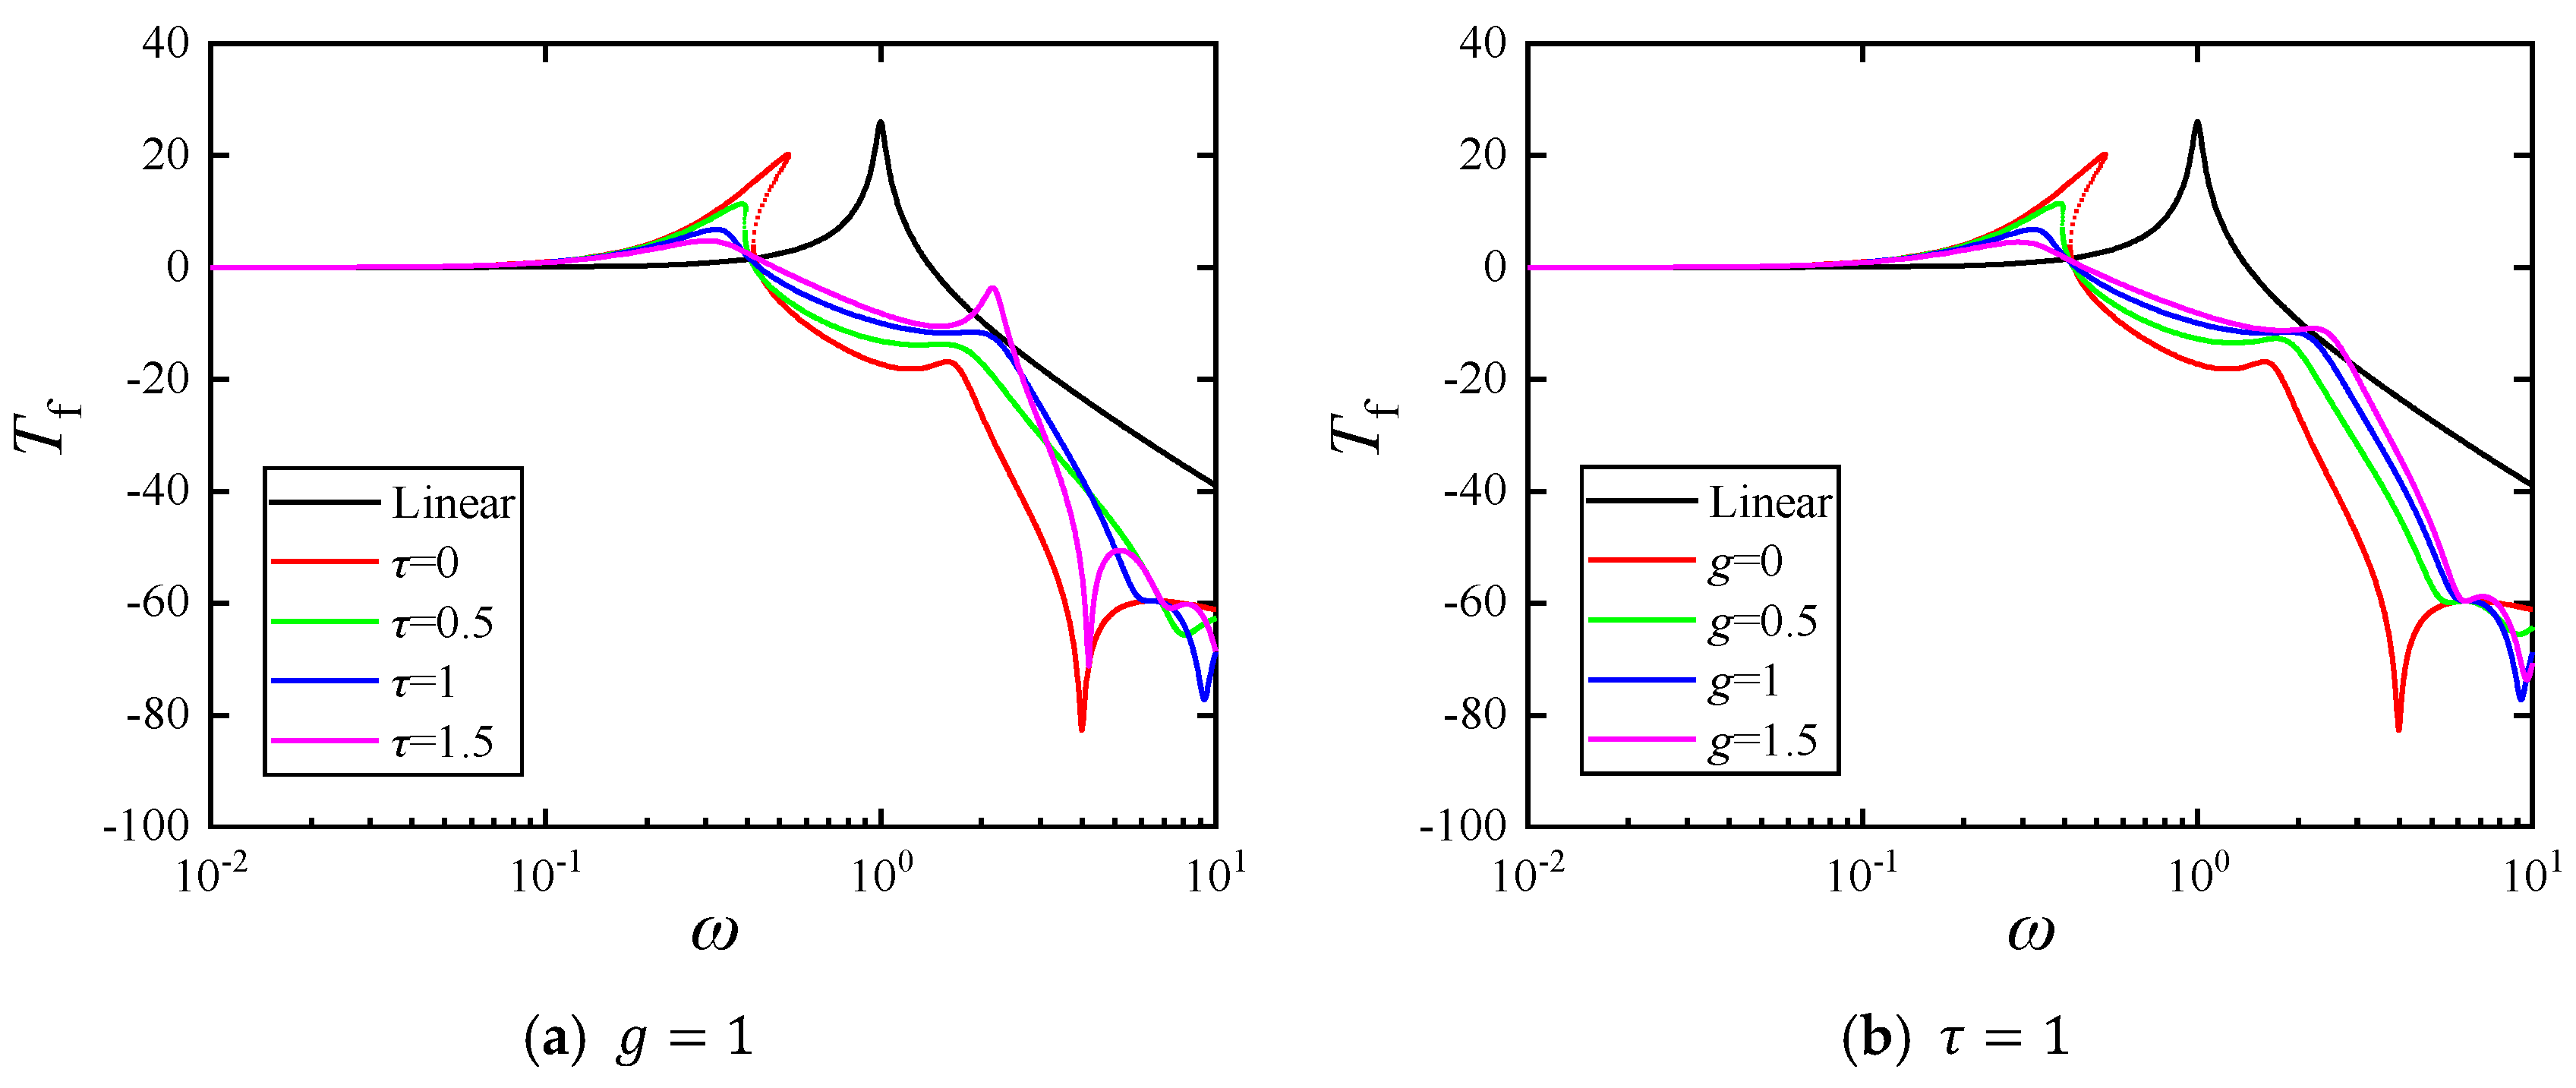
  • The harmonic balance method was employed to obtain the system’s dynamic response under harmonic excitation, yielding both amplitude frequency response curves and force transmissibility curves.
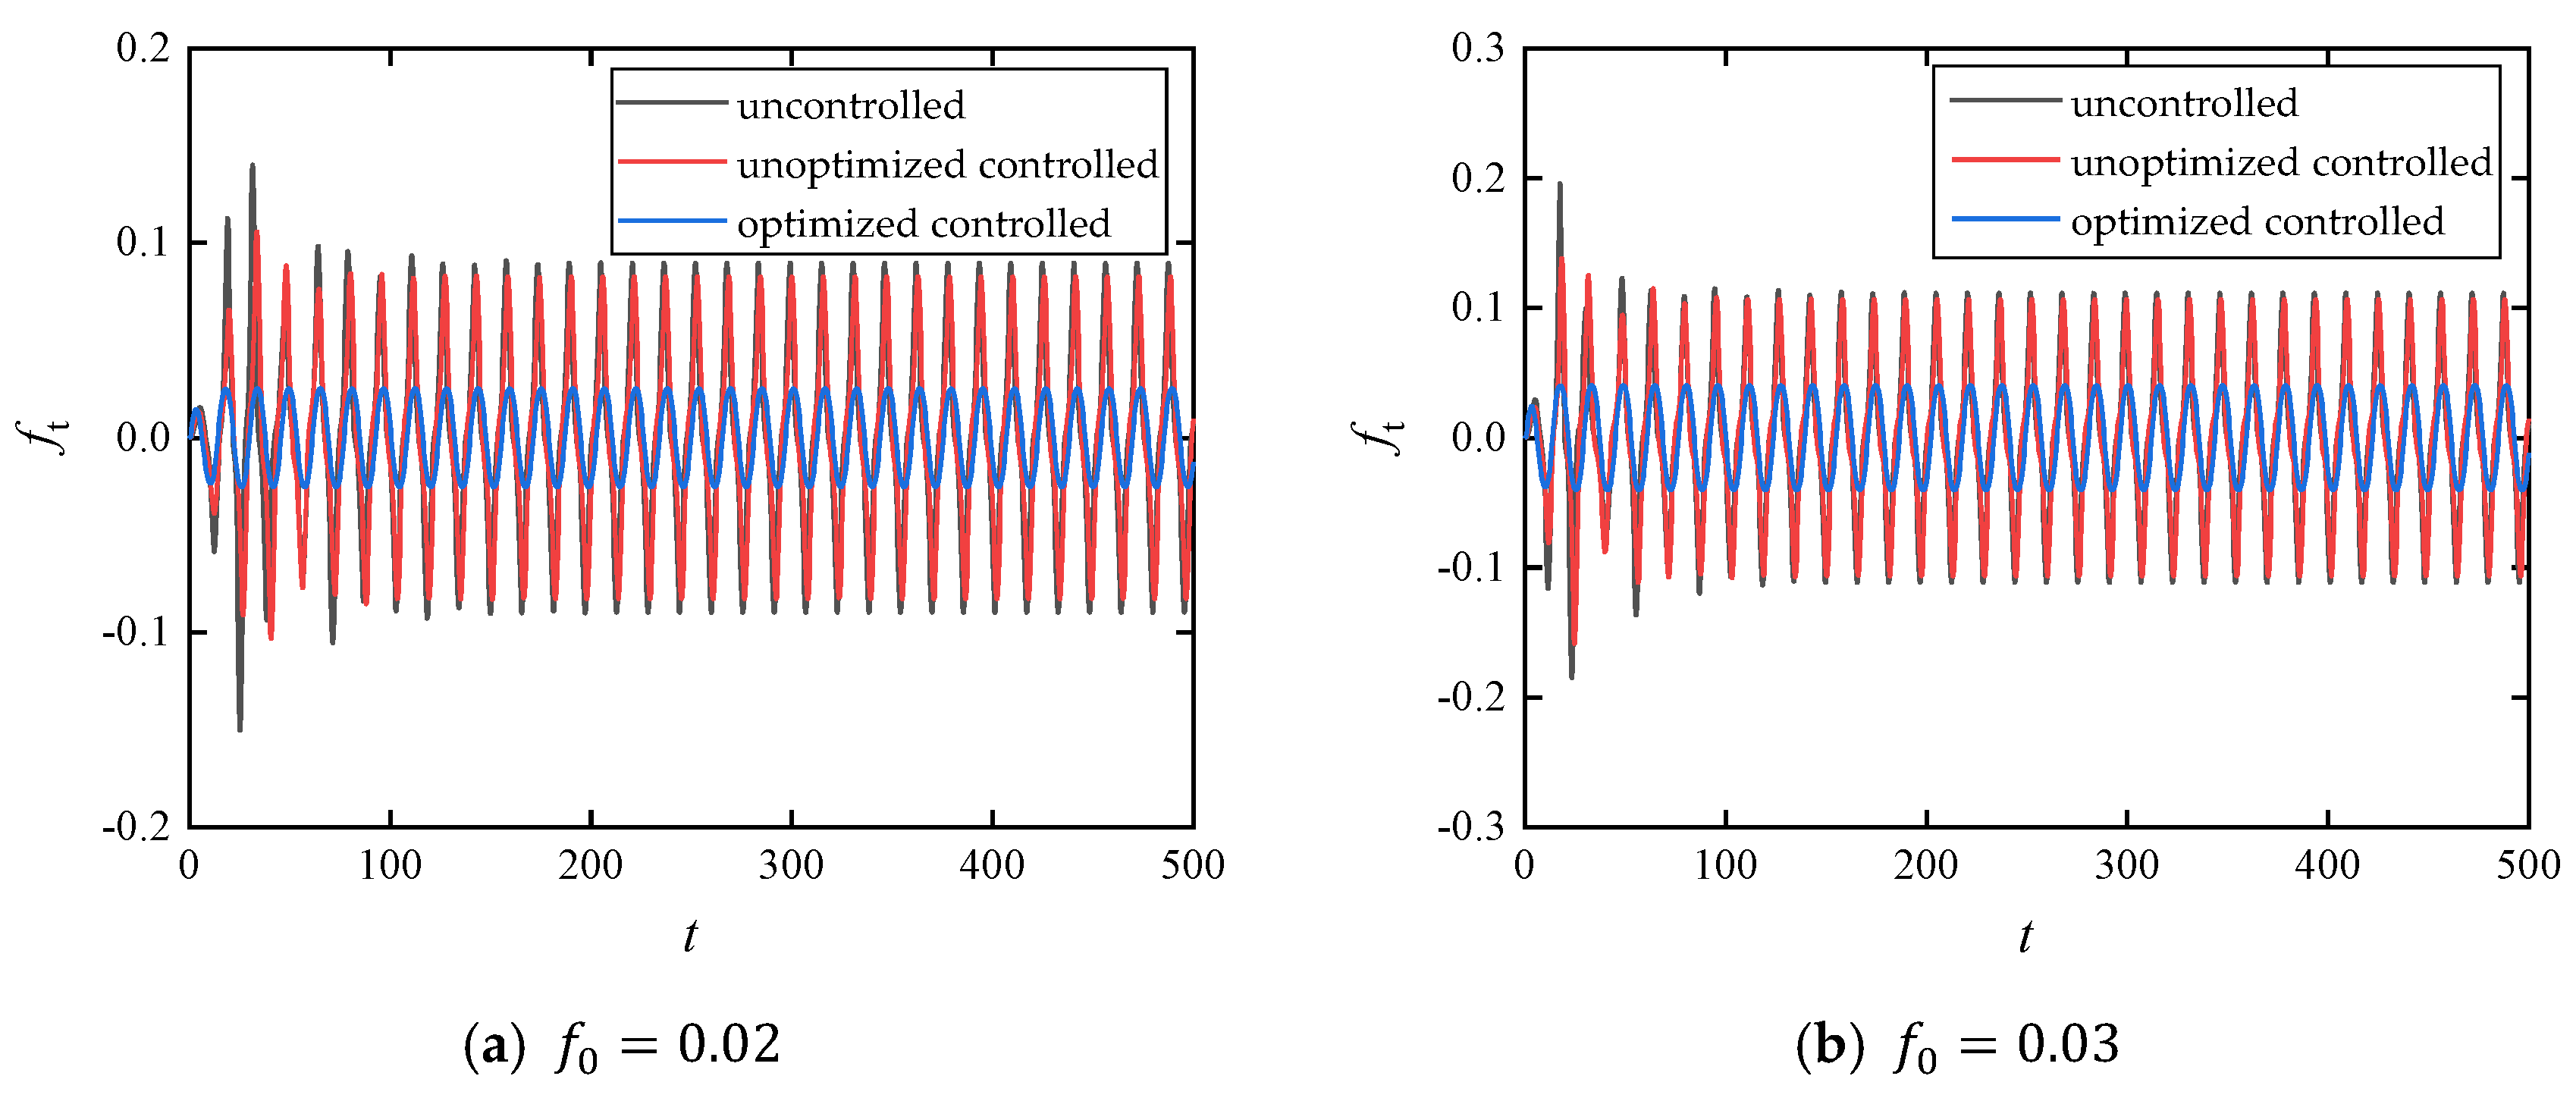
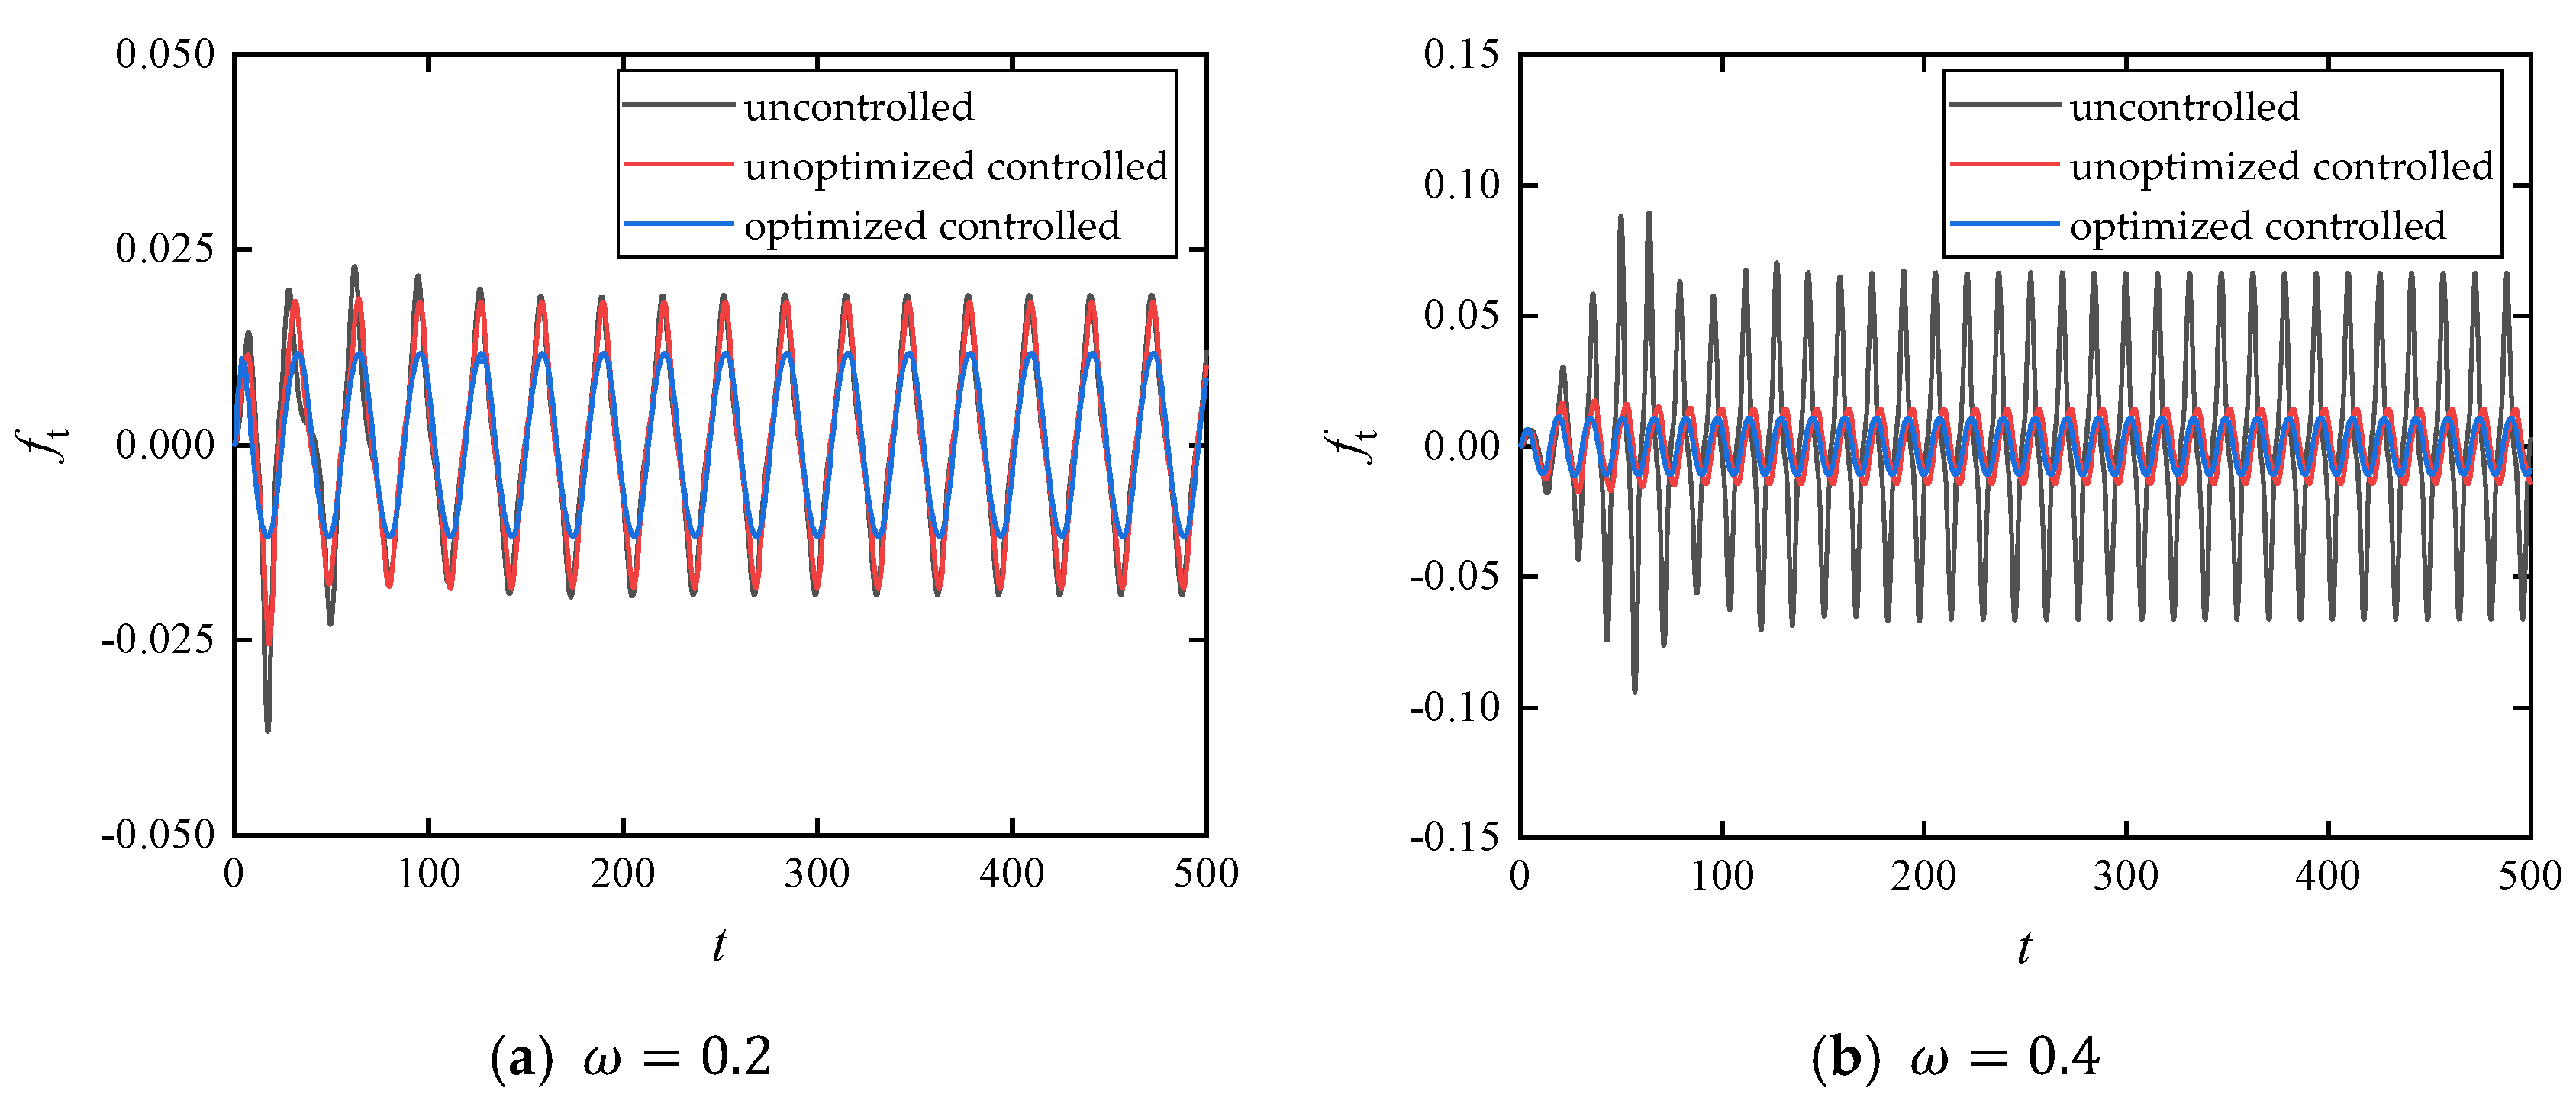
  • We observed that the introduction of time-delay feedback control significantly suppresses the primary resonance peak in the amplitude–frequency response curve, while the unstable jump phenomenon gradually vanishes. In comparison with the uncontrolled configuration and the non-optimized delay control system, the optimized delay parameters demonstrate superior performance in reducing force transmissibility and enhancing vibration isolation.
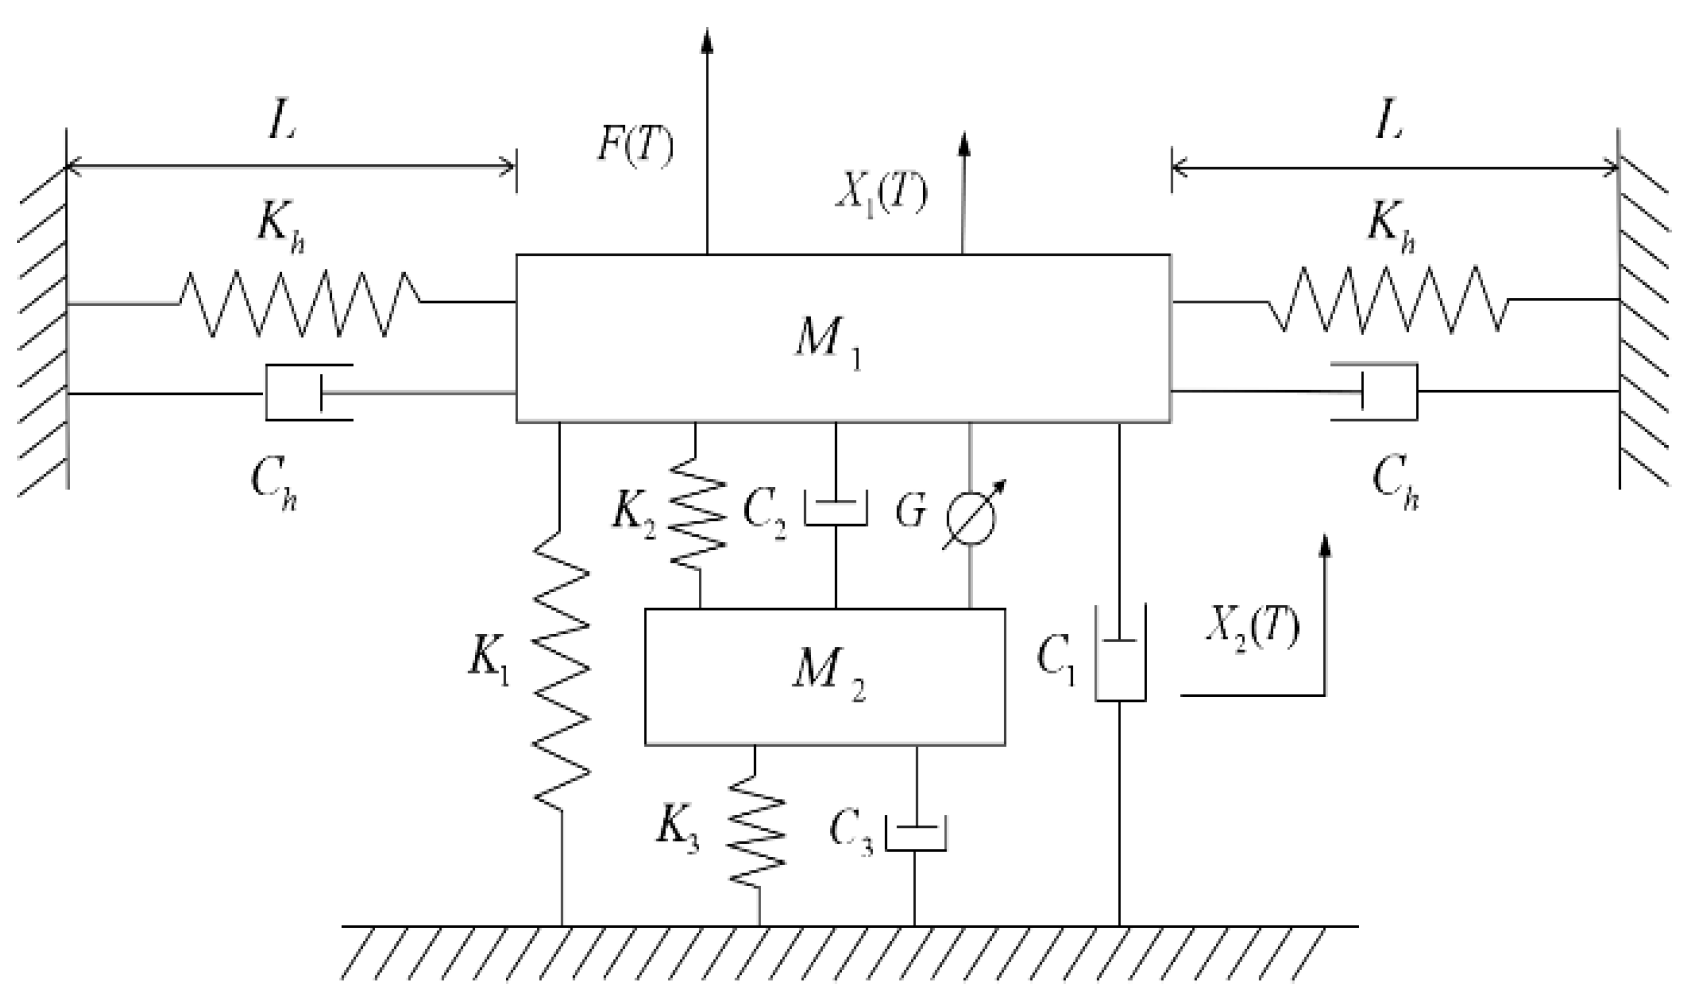
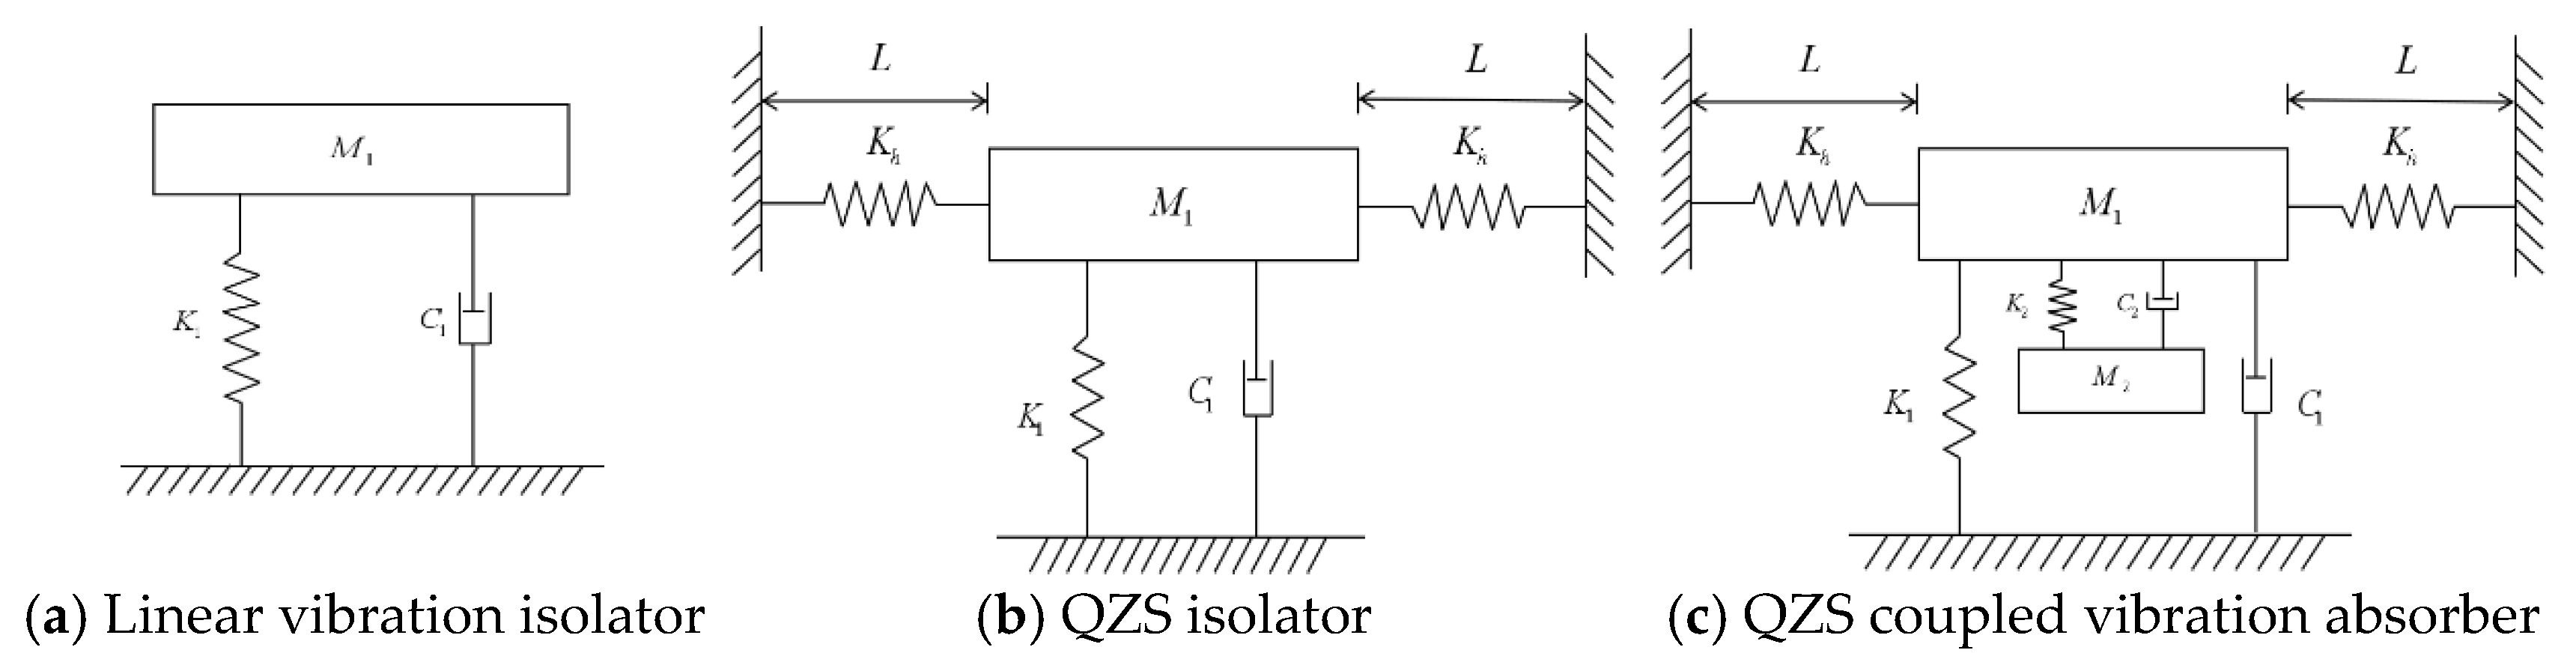
The remainder of this paper is organized as follows. Section 2 presents the model of the coupled vibration isolation system with time-delay feedback control and derives the corresponding dynamic equations. In Section 3, the stability of the system around the zero equilibrium point is analyzed. Section 4 investigates the amplitude–frequency response characteristics and the force transmissibility under harmonic excitation. Section 5 provides the optimization results for the time-delay feedback control parameters. Finally, conclusions are drawn in Section 6.

2. Mechanical Model

In this section, the proposed delayed composite vibration isolator model and its corresponding dynamic equations are established.
Figure 1 illustrates the configuration of the delayed composite vibration isolator. The quasi-zero stiffness (QZS) isolator constitutes the primary system, while the grounded dynamic absorber serves as the secondary system. Here, M 1 and M 2 denote the masses of the primary and secondary systems, respectively. The isolated object M 1 is connected to the ground via a pair of horizontal springs with stiffness coefficient K h , a pair of horizontal dampers with damping coefficient C h , a vertical spring with stiffness K 1 , and a vertical damper with damping C 1 .
The primary and secondary systems are coupled through a spring and damper characterized by stiffness K 2 and damping C 2 , respectively, in addition to an active control actuator. The secondary system is further grounded through a spring with stiffness K 3 and a damper with damping C 3 .
As part of the modeling assumptions, the system is set to be in static equilibrium, with the original unstressed length denoted by L 0 and the horizontal compression displacement by L . The static equilibrium position is designated as the origin for constructing the dynamic model. Let X 1 ( T ) and X 2 ( T ) denote the displacements of the QZS isolator and the absorber, respectively. The external excitation is given by F T = F 0 cos ( Ω T), and the control gain of the active actuator is denoted by G . The time-delay term is expressed as X 1 Δ X 1 = X 1 T Δ X 1 , where Δ represents the time delay.
When the system is in static equilibrium, the transverse springs are horizontally aligned. The resultant vertical force components generated by the two transverse springs and two transverse dampers can be expressed as
F N = 2 K h L 2 + X 1 2 L 0 X 1 L 2 + X 1 2 + 2 C h X 1 2 X ˙ 1 X 1 2 + L 0 2 .
The expression is expanded about the equilibrium position using a third-order truncated Taylor series approximation
F N = 2 K h 1 L 0 L X 1 + K h L 0 L 3 X 1 3 + 2 C h X 1 2 X ˙ 1 L 0 2 .
According to Newton’s second law, the equations of motion governing the delayed composite vibration isolation system can be formulated as follows
M 1 X ¨ 1 + C 1 X ˙ 1 + K 1 X 1 + C 2 X ˙ 1 X ˙ 2 + K 2 X 1 X 2 + 2 K 1 X 1 1 L 0 L 2 + X 1 2 + 2 C h X 1 2 X ˙ 1 L 0 2 = F 0 c o s Ω T + G X 1 Δ X 1 M 2 X ¨ 2 + C 2 X ˙ 2 X ˙ 1 + K 2 X 2 X 1 + C 3 X ˙ 2 + K 3 X 2 = G X 1 Δ X 1 .
By introducing the following dimensionless variables and parameters
Ω 0 = K 1 M 1 ,   t = Ω 0 T ,   ω = Ω Ω 0 ,   μ = M 2 M 1 ,   x 1 = X 1 L 0 ,   x 2 = X 2 L o ,   ζ 1 = C 1 Ω 0 M 1 ,   ζ 2 = C 2 Ω 0 M 1 , ζ 3 = C 3 Ω 0 M 1 ,   ζ h = C h Ω 0 K 1 ,   η = L L 0 ,   ν = K 2 K 1 ,   δ = K h K 1 ,   γ = K 3 K 1 ,   f 0 = F 0 K 1 L 0 ,   g = G K 1 L 0 , x 1 τ = X 1 Δ L 0 = x 1 ( t τ ) ,   τ = Ω 0 Δ ,
Equation (3) is thereby transformed into
x ¨ 1 + ζ 1 x ˙ 1 + x 1 + ζ 2 x ˙ 1 x ˙ 2 + ν x 1 x 2 + 2 δ x 1 1 1 η + 1 2 η 3 x 1 2 + 2 ζ h η 2 x 1 2 x ˙ 1 = f 0 cos ω t + g x 1 τ x 1 μ x ¨ 2 + ζ 2 x ˙ 2 x ˙ 1 + ν x 2 x 1 + ζ 3 x ˙ 2 + γ x 2 = g x 1 τ x 1 .

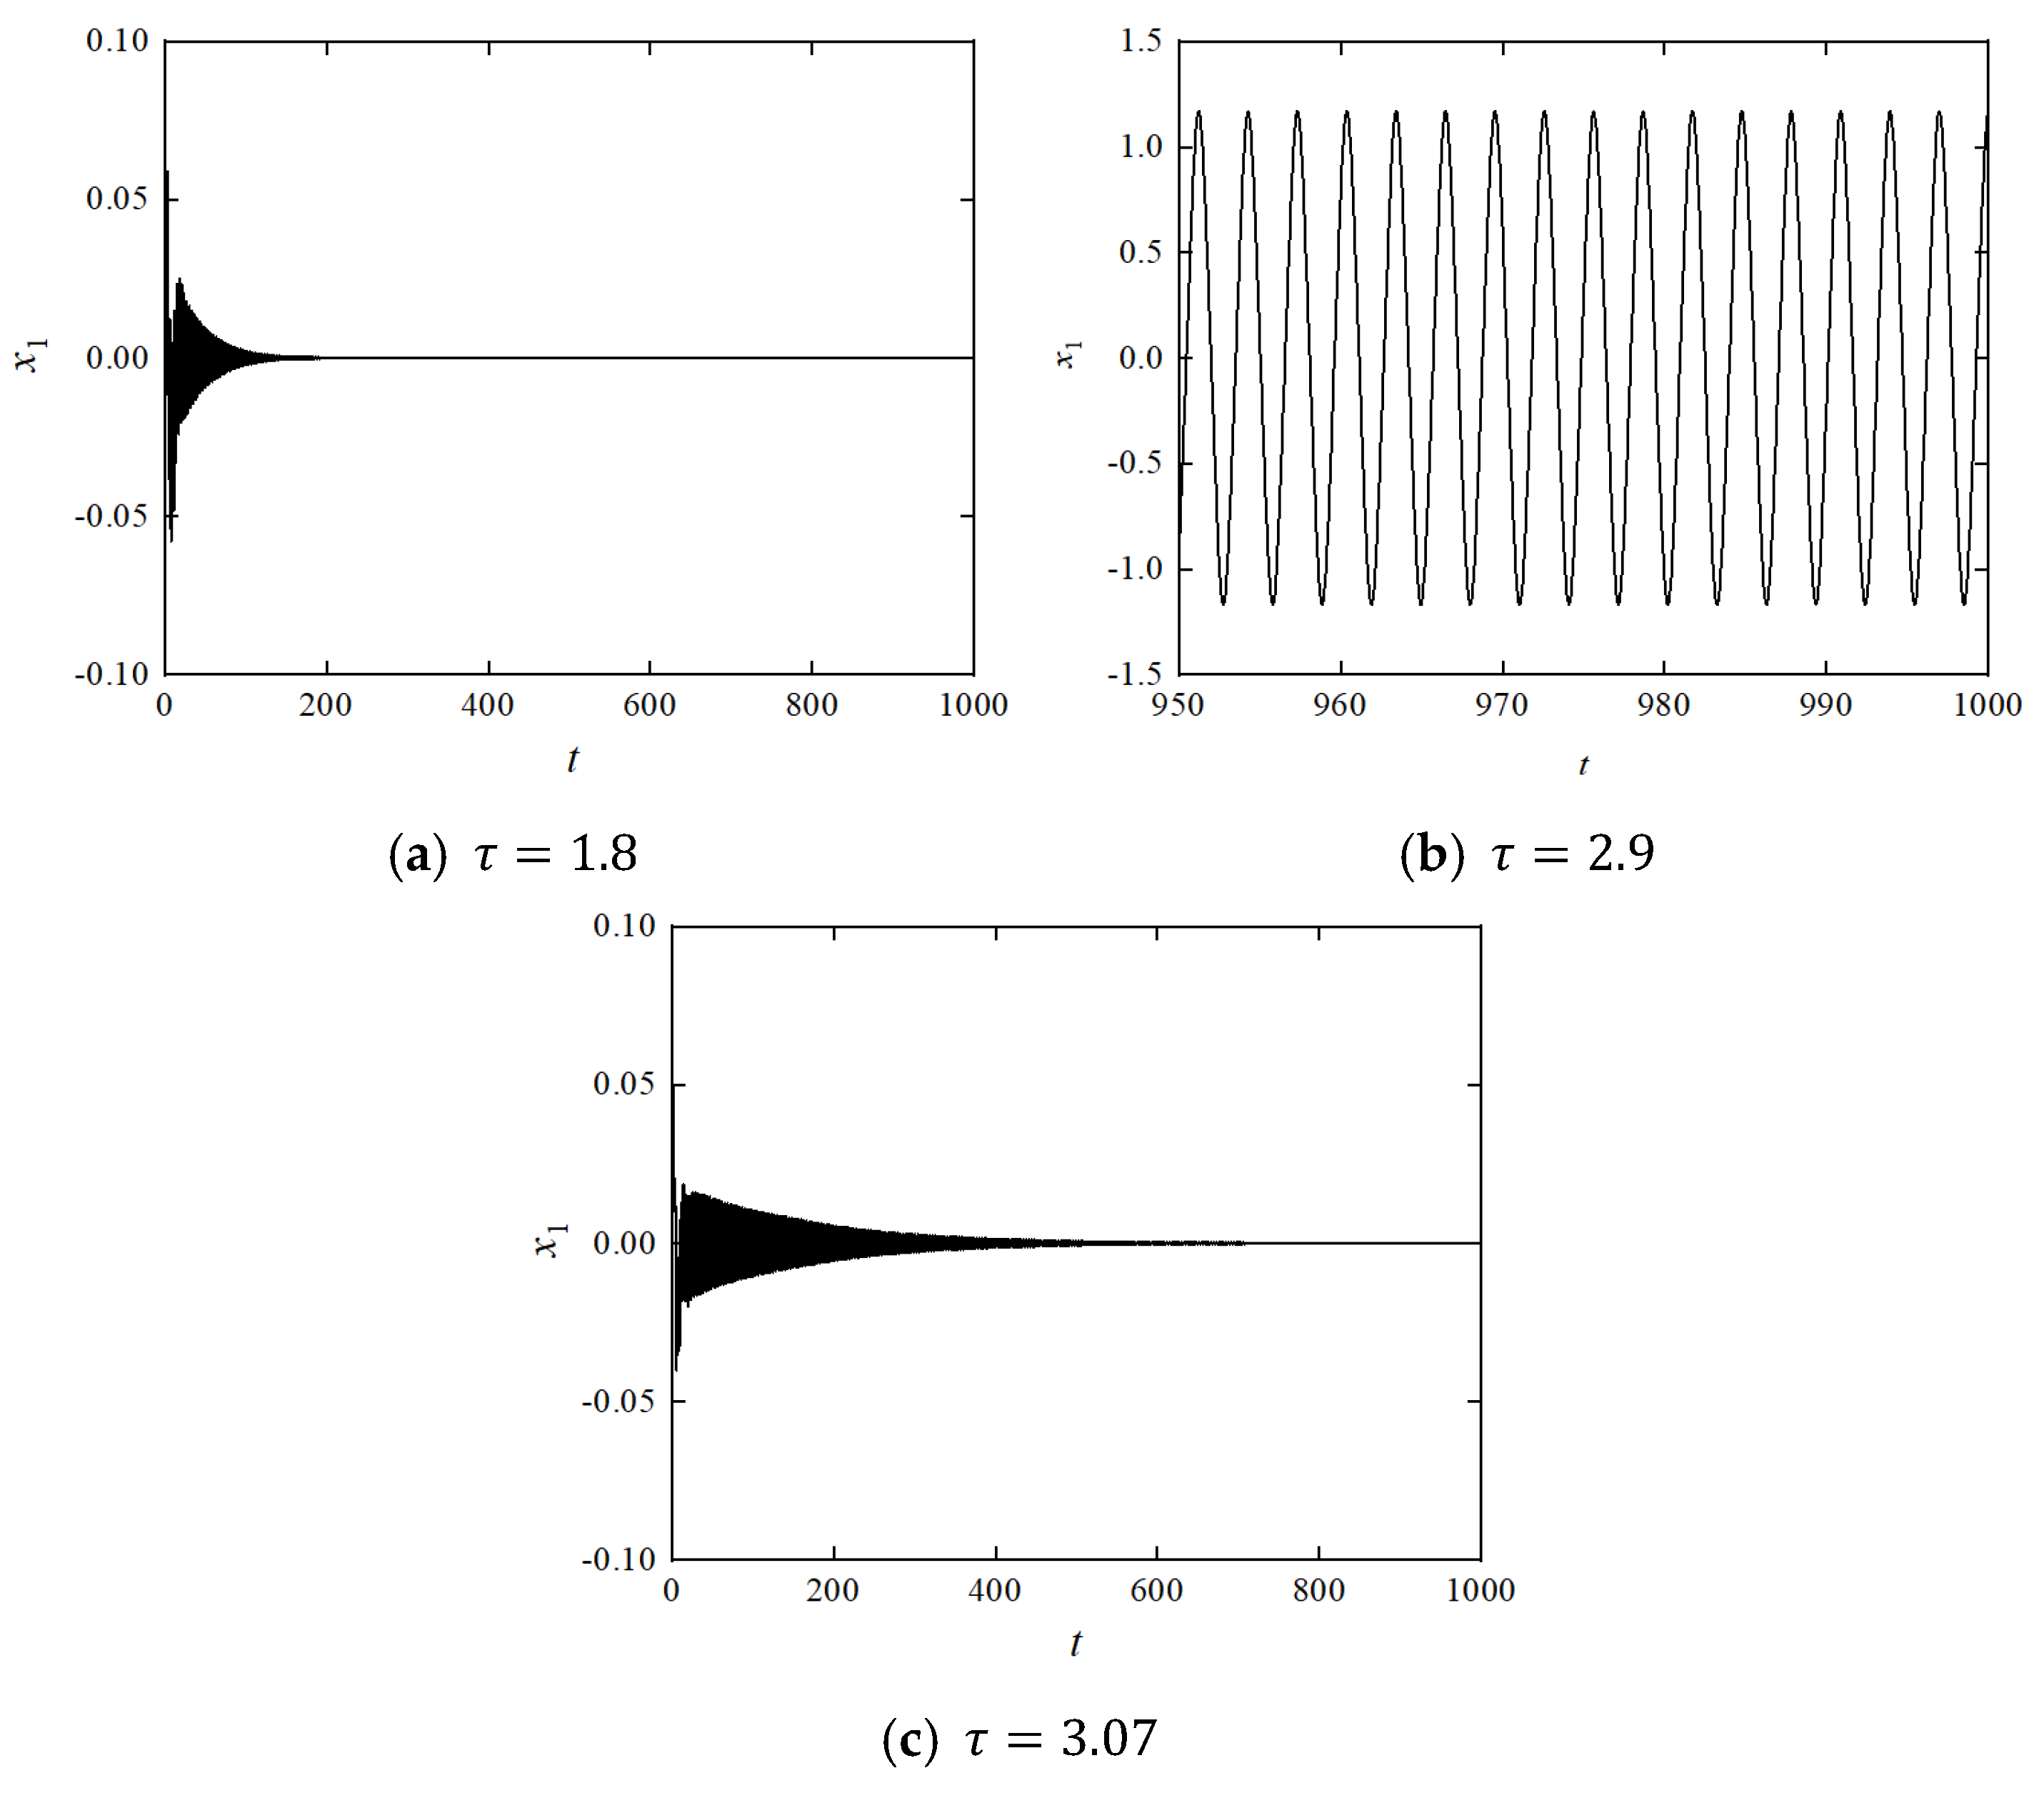
3. Stability Analysis

3.1. System Linearization

By reformulating the system dynamics in the state-space form and linearizing Equation (4) at the trivial equilibrium point under the condition f 0 = 0 , the local stability of the system can be systematically analyzed.
x ˙ 1 = y 1 x ˙ 2 = y 2 y ˙ 1 = a 31 x 1 + a 32 x 2 + a 33 y 1 + a 34 y 2 + g x 1 τ y ˙ 2 = a 41 x 1 + a 42 x 2 + a 43 y 1 + a 44 y 2 g ¯ x 1 τ   ,
where a 31 = 2 δ 1 1 η ν 1 , a 32 = ζ 1 ζ 2 , a 33 = ν , a 34 = ζ 2 , a 41 = ν / μ , a 42 = ζ 2 / μ , a 43 = ( ν + γ ) / μ , a 44 = ( ζ 2 + ζ 3 ) / μ , g ¯ = g / μ .
The characteristic matrix of the linearized form of Equation (5) is given by
d e t λ 0 1 0 0 λ 0 1 a 31 g e λ τ a 32 λ a 33 a 34 a 41 + g ¯ e λ τ a 42 a 43 λ a 44 = 0 .
By arranging the characteristic matrix, the corresponding characteristic equation is obtained as
Δ λ , τ = λ 4 + d 1 λ 3 + d 2 λ 2 + d 3 λ + d 4 λ 2 g e λ τ = 0 ,
where d 1 = a 33 a 44 , d 2 = a 33 a 44 a 34 a 43 a 42 , d 3 = a 32 a 43 + a 33 a 42 a 41 , d 4 = a 33 a 41 a 31 a 43 .

3.2. Stability Assessment

The curve in Figure 2 divides the plane into two regions. In order to ensure the stability of the zero equilibrium point of the combined vibration isolation system and to avoid instability caused by the time-delay control, the values of the time delay and gain should be confined within the stable region. The system parameters are set as ζ 1 = 0.01 , ζ 2 = 0.03 , ζ 3 = 0.06 , ζ h = 0.1 , μ = 0.2 , ν = 0.4 , γ = 0.1 , δ = 1 , η = 0.67 , f 0 = 0.01 [26]. With their corresponding physical values provided in Table 1.
Figure 3 illustrates the stability switching behavior of the time-delay coupled vibration isolation system as the delay parameter τ varies. As shown in Figure 3a, when τ = 1.8 , the system is asymptotically stable at the zero equilibrium point (corresponding to Point A in Figure 2). In Figure 3b, the displacement response becomes periodic at τ = 2.9 , indicating that the system loses stability at the zero equilibrium point (corresponding to Point B in Figure 2). Figure 3c demonstrates that the system regains asymptotic stability when τ = 3.07 (corresponding to Point C in Figure 2). These results confirm the consistency between numerical simulations and the theoretical stability analysis. Accordingly, in the following sections, the time-delay feedback control parameters are selected within the stability region to ensure reliable vibration isolation performance.

4. Dynamic Analysis of Systems

4.1. Harmonic Balance Method

The first-order harmonic balance method (HBM) is employed to obtain the amplitude–frequency response of the system. Assume the solution based on the harmonic balance method takes the form
x 1 t = a 1 t cos ω t + b 1 t sin ω t x 2 t = a 2 t cos ω t + b 2 t sin ω t x 2 t τ = a 2 t cos ω t τ + b 2 t sin ω t τ .
In Equation (8), a 1 ( t ) , a 2 ( t ) and b 1 ( t ) , b 2 ( t ) are assumed to be slowly varying functions of time t. By substituting the assumed solution into the nondimensionalized dynamic Equation (4) and neglecting higher-order terms, the following matrix form is obtained
m 11 m 12 m 13 m 14 m 21 m 22 m 23 m 24 m 31 m 32 m 33 m 34 m 41 m 42 m 43 m 44 a ˙ 1 b ˙ 1 a ˙ 2 b ˙ 2 = f 1 f 2 f 3 f 4 ,
where m 11 = 6 ζ h η 5 a 1 2 2 ζ h η 5 b 1 2 4 ζ 1 η 3 4 ζ 2 η 3 4 η 3 ; m 12 = 4 ζ h η 5 a 1 b 1 8 η 3 ω 4 η 3 ;
  • m 13 = ζ 2 ;   m 14 = 0 ;
  • m 21 = 4 ζ h η 5 a 1 b 1 + 8 η 3 ω 4 η 3 ;   m 22 = 6 ζ h η 5 b 1 2 2 ζ h η 5 a 1 2 4 ζ 1 η 3 4 ζ 2 η 3 4 η 3 ;
  • m 23 = 0 ;   m 24 = ζ 2 ;
  • m 31 = ζ 2 ;   m 32 = 0 ;   m 33 = ζ 2 + ζ 3 ;   m 34 = 2 μ ω ;
  • m 41 = 0 ;   m 42 = ζ 2 ;   m 43 = 2 μ ω ;   m 44 = ζ 2 + ζ 3 ;
  • f 1 = 1 4 η 3 ( 4 f 0 η 3 4 a 1 η 3 3 δ a 1 3 2 ζ h η 5 b 1 3 ω 4 ζ 1 b 1 ω η 3 4 ζ 2 b 1 ω η 3 + 4 ζ 2 d 1 ω η 3 2 ζ h η 5 a 1 2 b 1 ω 3 δ a 1 b 1 2 + 4 ν c 1 η 3 + 4 g a 1 η 3 c o s τ ω 4 g b 1 η 3 sin τ ω + 4 a 1 ω 2 η 3 4 ν a 1 η 3 8 δ a 1 η 3 4 g a 1 η 3 + 8 δ a 1 η 2 ) ;
  • f 2 = 1 4 η 3 ( 4 b 1 η 3 3 δ b 1 3 4 ζ 2 c 1 ω η 3 + 2 ζ h η 5 a 1 3 ω + 4 ζ 1 a 1 ω η 3 + 4 ζ 2 a 1 ω η 3 + 2 ζ h η 5 b 1 2 a 1 ω 4 g b 1 η 3 + 4 b 1 ω 2 η 3 4 ν b 1 η 3 8 δ b 1 η 3 + 8 δ b 1 η 2 3 δ a 1 2 b 1 + 4 ν d 1 η 3 + 4 g a 1 η 3 s i n τ ω + 4 g b 1 η 3 c o s τ ω ) ;
  • f 3 = g a 1 c o s τ ω + g b 1 s i n τ ω + g a 1 + ν a 1 ν c 1 γ c 1 + ζ 2 b 1 ω + μ c 1 ω 2 ζ 3 d 1 ω ζ 2 d 1 ω ;
  • f 4 = ν b 1 + g b 1 g a 1 s i n τ ω g b 1 c o s τ ω γ d 1 ν d 1 ζ 2 a 1 ω + ζ 3 c 1 ω + ζ 2 c 1 ω + μ d 1 ω 2 ;
Here, the matrix m corresponds to the coefficients of the first-order derivatives. f 1 , f 2 , f 3 and f 4 represent the coefficients of the first-order harmonic terms in Equation (9). Equation (9) is reformulated as a system of differential equations with respect to a 1 ( t ) , a 2 ( t ) and b 1 ( t ) , b 2 ( t )
a ˙ 1 = H 1 ( a 1 , b 1 , a 2 , b 2 ) b ˙ 1 = H 2 ( a 1 , b 1 , a 2 , b 2 ) a ˙ 2 = H 3 ( a 1 , b 1 , a 2 , b 2 ) b ˙ 2 = H 4 ( a 1 , b 1 , a 2 , b 2 ) ,
Let a ˙ 1 = b ˙ 1 = a ˙ 2 = b ˙ 2 = 0 be prescribed to determine the steady-state response of the system. By employing the arc-length continuation method, the amplitude–frequency response of Equation (10) can be obtained. The displacement amplitudes of each degree of freedom are denoted by X i = a i 2 + b i 2 . A solution is considered stable if all the eigenvalues of the Jacobian matrix associated with Equation (10) have negative real parts. Conversely, if any eigenvalue has a positive real part, the corresponding solution is unstable.
To assess the accuracy of the first-order harmonic balance method (HBM), its results are compared with those obtained using the fourth-order Runge–Kutta method (RKM). In Figure 4, the results obtained under both time-delayed ( g = 1 , τ = 0.5 ) and non-delayed feedback control show excellent agreement, indicating that the first-order HBM provides sufficient accuracy. Therefore, the first-order harmonic balance method is employed in the subsequent analyses.

4.2. Force Transmissibility

Under harmonic excitation, the dimensionless force transmitted to the ground by the system is expressed as
f t = ζ 1 x ˙ 1 + 2 ζ h x 1 2 x ˙ 1 + ζ 3 x ˙ 2 + ( 1 + 2 δ 2 δ η ) x 1 + δ η 3 x 1 3 + γ x 2 .
The force transmissibility of the system is defined as the ratio of the transmitted force to the external excitation force
T f = 20 l o g 10 f t f 0 = 20 l o g 10 1 f 0 i = 1 2 n f i 2 .
The force transmissibility curve provides a more intuitive means of assessing the vibration isolation performance of the system across different frequencies. When the force transmissibility T f < 1 , the force transmitted to the base is smaller than the external excitation, indicating vibration attenuation and effective isolation by the isolator.
Figure 5 illustrates the influence of different time-delay feedback gains g and time delays τ on the amplitude–frequency response of the primary system. The dotted lines represent unstable periodic solutions. The same convention is adopted in the other figures throughout the paper. Figure 5a presents the variation of the amplitude–frequency curves with respect to the time delay τ for a fixed feedback gain g = 1 . When τ = 0 , i.e., in the absence of time delay, the resonance peak reaches a maximum value of 0.31. As τ increases to 1, the unstable jump phenomenon disappears, and the jump interval vanishes. With a further increase in τ to 1.5, the resonance peak of the primary system is reduced to 0.1. Moreover, the resonance frequency associated with the primary peak initially shifts toward lower frequencies and subsequently toward higher frequencies. The secondary resonance peak increases progressively with the feedback gain. In Figure 5b, when τ = 1 and g = 0 , i.e., in the absence of feedback control, the resonance peak remains at 0.31. As the feedback gain g increases, the amplitude–frequency response exhibits a trend similar to that in Figure 5a. Both the increase in the time-delay feedback gain and the time delay contribute to the attenuation of the primary resonance peak and the elimination of the jump interval. These effects enhance the overall safety and reliability of the system and reduce the risk of failure.
Figure 6 illustrates the force transmissibility curves under various time-delay feedback control parameters. In Figure 6a, for a fixed feedback gain of g = 1 , the first resonance peak of the force transmissibility reaches 21.5 when the time delay τ = 0 , i.e., in the absence of time delay. The second resonance peak and valley are –17.71 and –82.73, respectively. As τ increases to 1.5, the first resonance peak decreases substantially to 6.1. Additionally, the resonance frequency associated with the first peak first shifts toward lower frequencies and then toward higher frequencies. Meanwhile, the second resonance peak and valley gradually diminish and eventually disappear. In Figure 6b, for a fixed time delay of τ = 1 , the increase in the feedback control gain g leads to changes in the force transmissibility curves similar to those observed in Figure 6a.
The above analysis indicates that the effectiveness of time-delay feedback in vibration isolation is highly dependent on the appropriate selection of control parameters. While properly tuned parameters can suppress primary resonance and enhance isolation performance, improper parameter choices may introduce detrimental phase lag effects, compromising the isolation efficiency in certain frequency ranges. Therefore, it is necessary to systematically optimize the control parameters to fully exploit the advantages of time-delay feedback. In the following section, a genetic algorithm is employed to optimize the feedback gain and time-delay parameters with the objective of maximizing the isolation performance under harmonic excitation.

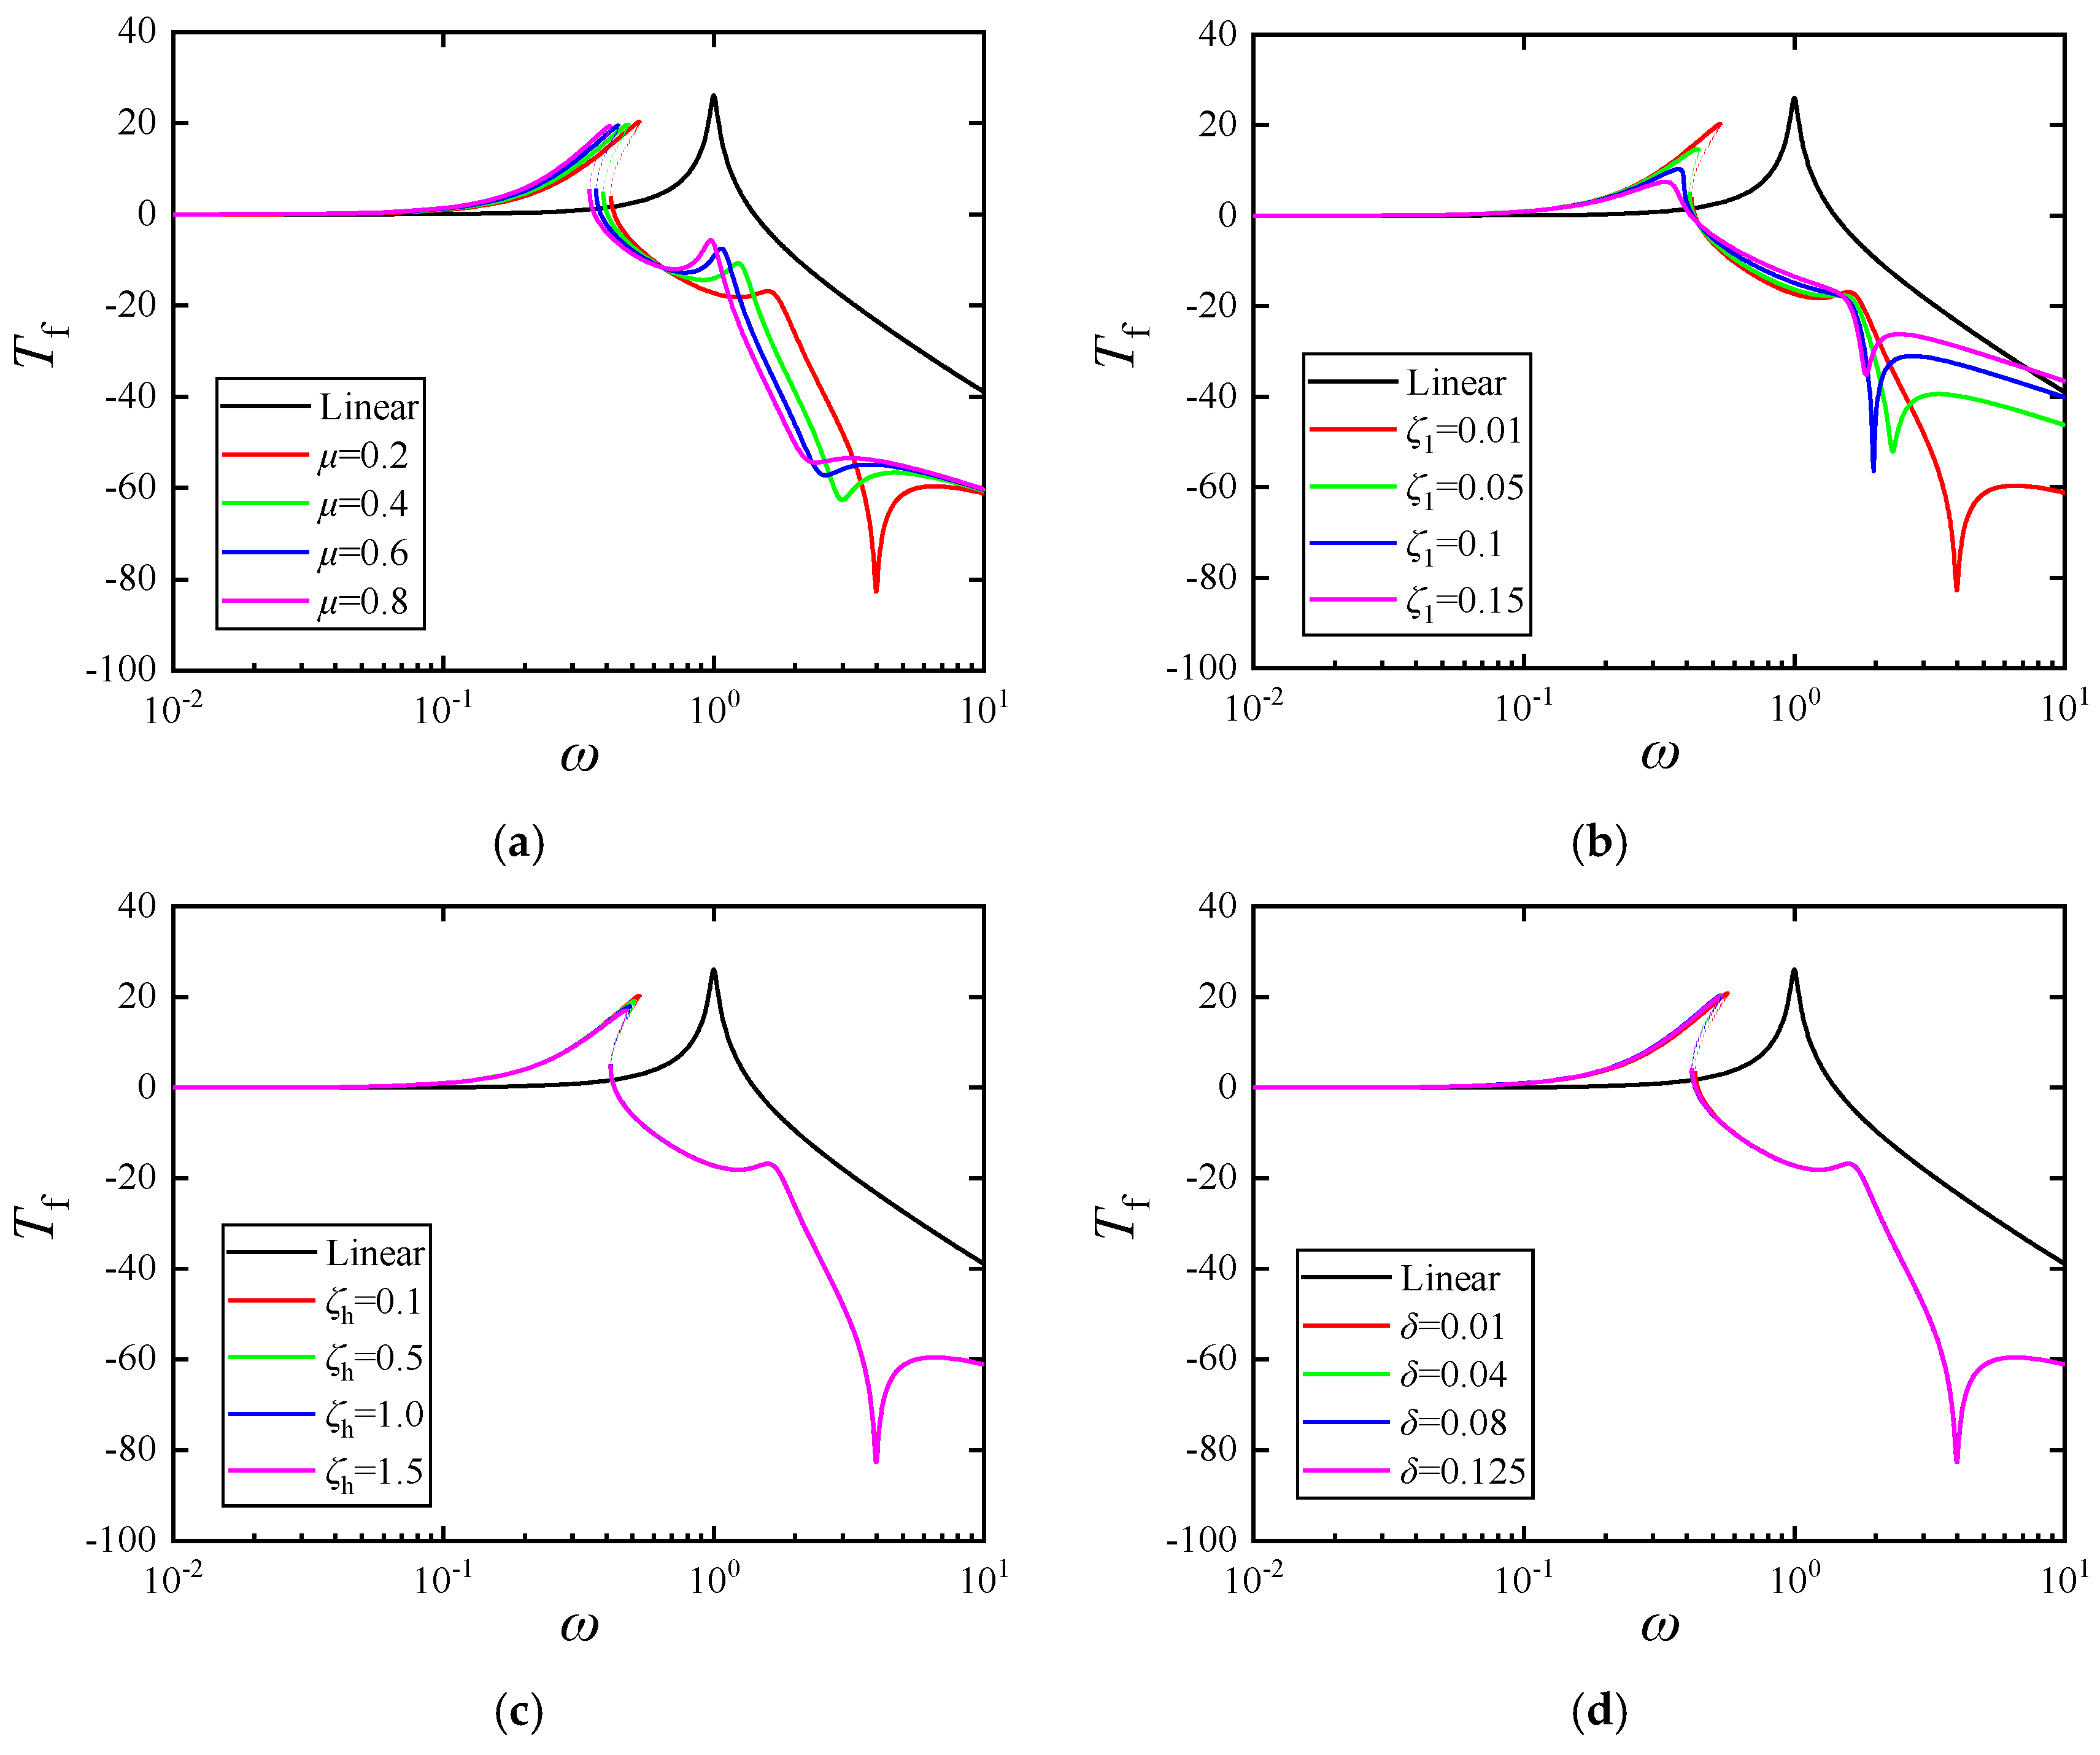
4.3. Influence of Primary System Parameters on Vibration Isolation Performance

The influence of primary system parameters on the amplitude–frequency response of the main structure was investigated under a constant external excitation amplitude f 0 = 0.01 . Specifically, the effects of mass ratio μ , vertical damping ratio ζ 1 , horizontal damping ratio ζ h , and horizontal stiffness ratio δ were examined. The simulation results are illustrated in Figure 7. With the introduction of an auxiliary DVA, the system exhibits two degrees of freedom. As a result, the amplitude–frequency response of the primary mass x 1 presents two resonance peaks. The first peak corresponds to the resonance of the primary system and represents the dominant vibration mode, typically occurring at a lower frequency. The second peak originates from the resonance of the attached absorber subsystem and occurs at a higher frequency.
Figure 7a shows the amplitude–frequency responses for different values of the mass ratio μ . When μ = 0.2 , the primary resonance peak reaches a maximum amplitude of 3.01, and the second resonance peak is negligible. As μ increases to 0.8, the primary resonance peak amplitude decreases significantly to 0.29, and the associated resonance frequency shifts to a lower range. Concurrently, the secondary peak gradually increases to 0.35, with its frequency also shifting leftward.
Figure 7b demonstrates the effect of the vertical damping ratio ζ 1 on the primary mass displacement response. As ζ 1 increases from 0.01 to 0.15, the primary resonance peak is notably suppressed from 3.01 to 0.15, and the corresponding resonance frequency shifts lower. The second resonance peak and its frequency remain unchanged. Notably, at ζ 1 = 0.1 , the unstable jump phenomenon disappears, indicating the elimination of the associated bifurcation.
Figure 7c depicts the impact of the horizontal damping ratio ζ h . With ζ h increasing from 0.1 to 1.5, the primary resonance amplitude is reduced from 3.01 to 0.26, and the associated resonance frequency is shifted to a lower value. The second resonance characteristics remain essentially unaffected.
Figure 7d presents the influence of the horizontal stiffness ratio δ . For δ = 0.4 , the primary resonance peak is approximately 0.28, with minimal presence of a secondary peak. As δ increases from 0.4 to 1.6, the primary peak initially rises slightly to 0.30 and then reduces to 0.29, while the corresponding resonance frequency moves toward lower values.
These results demonstrate that appropriately tuning the primary system parameters can significantly modify the system’s dynamic behavior, providing practical guidelines for improving vibration isolation performance.
This part investigates the effects of varying system parameters—namely, the mass ratio μ , vertical damping ratio ζ 1 , horizontal damping ratio ζ h , horizontal stiffness ratio δ , and excitation amplitude f 0 —on the force transmissibility characteristics of the proposed vibration isolation system. The simulation results are illustrated in Figure 8.
Figure 8a presents the force transmissibility curves for different values of the mass ratio μ . When μ = 0.2 , the first resonance peak reaches 19.92, the second resonance peak is −19.77, and the valley reaches −82.71. As μ increases to 0.8, the first resonance peak reduces to 18.75 with a corresponding leftward shift in resonance frequency. The second resonance peak increases substantially to −11.25, also shifting toward lower frequencies. The valley value increases to −54.38, indicating a reduction in isolation performance near this frequency. The effective isolation frequency drops from 0.70 to 0.45, representing a 35.7% decrease and implying a broader isolation bandwidth.
Figure 8b illustrates the influence of the vertical damping ratio ζ 1 . At ζ 1 = 0.01 , the force transmissibility curve exhibits a pronounced jump phenomenon, which vanishes when ζ 1 increases to 0.05, suggesting enhanced stability. Further increasing ζ 1 to 0.15 causes the first resonance peak to decline from 19.92 to 9.86 and shifts the corresponding resonance frequency lower. The second resonance peak remains nearly unchanged, while the valley rises significantly to −38.72. The effective isolation frequency shifts from 0.70 to 0.34, marking a 51.43% reduction. While the isolation bandwidth broadens, the depth of isolation performance is somewhat diminished.
Figure 8c shows the effect of horizontal damping ratio ζ h . Increasing ζ h from 0.1 to 1.5 leads to a modest reduction in the first resonance peak from 19.92 to 18.79, accompanied by a slight leftward shift in frequency. The second resonance peak and valley remain nearly unchanged, indicating minimal impact on isolation effectiveness. The effective isolation frequency decreases slightly from 0.70 to 0.64, a 6% reduction.
Figure 8d examines the influence of the horizontal stiffness ratio δ . At δ = 0.1 , the first resonance peak is 19.25, the second resonance peak is −19.88, and the valley is −83.31. As δ increases to 0.15, the first resonance peak first decreases and then slightly increases to 19.20, with a non-monotonic shift in resonance frequency. The second peak and valley remain essentially constant. The effective isolation frequency drops from 0.75 to 0.72, a modest 4% decrease.
Figure 9 illustrates the force transmissibility curves of the system under different amplitudes of harmonic excitation. When the excitation amplitude is f 0 = 0.005 , the first resonance peak reaches a value of 19.91, the second resonance peak is −19.82, and the valley reaches −82.53. As the excitation amplitude increases to f 0 = 0.02 , the first resonance peak gradually increases to 20.49, with the corresponding resonance frequency shifting toward higher values. Meanwhile, both the second resonance peak and the valley remain nearly unchanged, indicating that the vibration isolation performance near those frequencies is largely unaffected. However, the effective isolation frequency shifts from 0.55 to 0.86, representing a 56% increase. This shift leads to a noticeable narrowing of the effective isolation bandwidth.

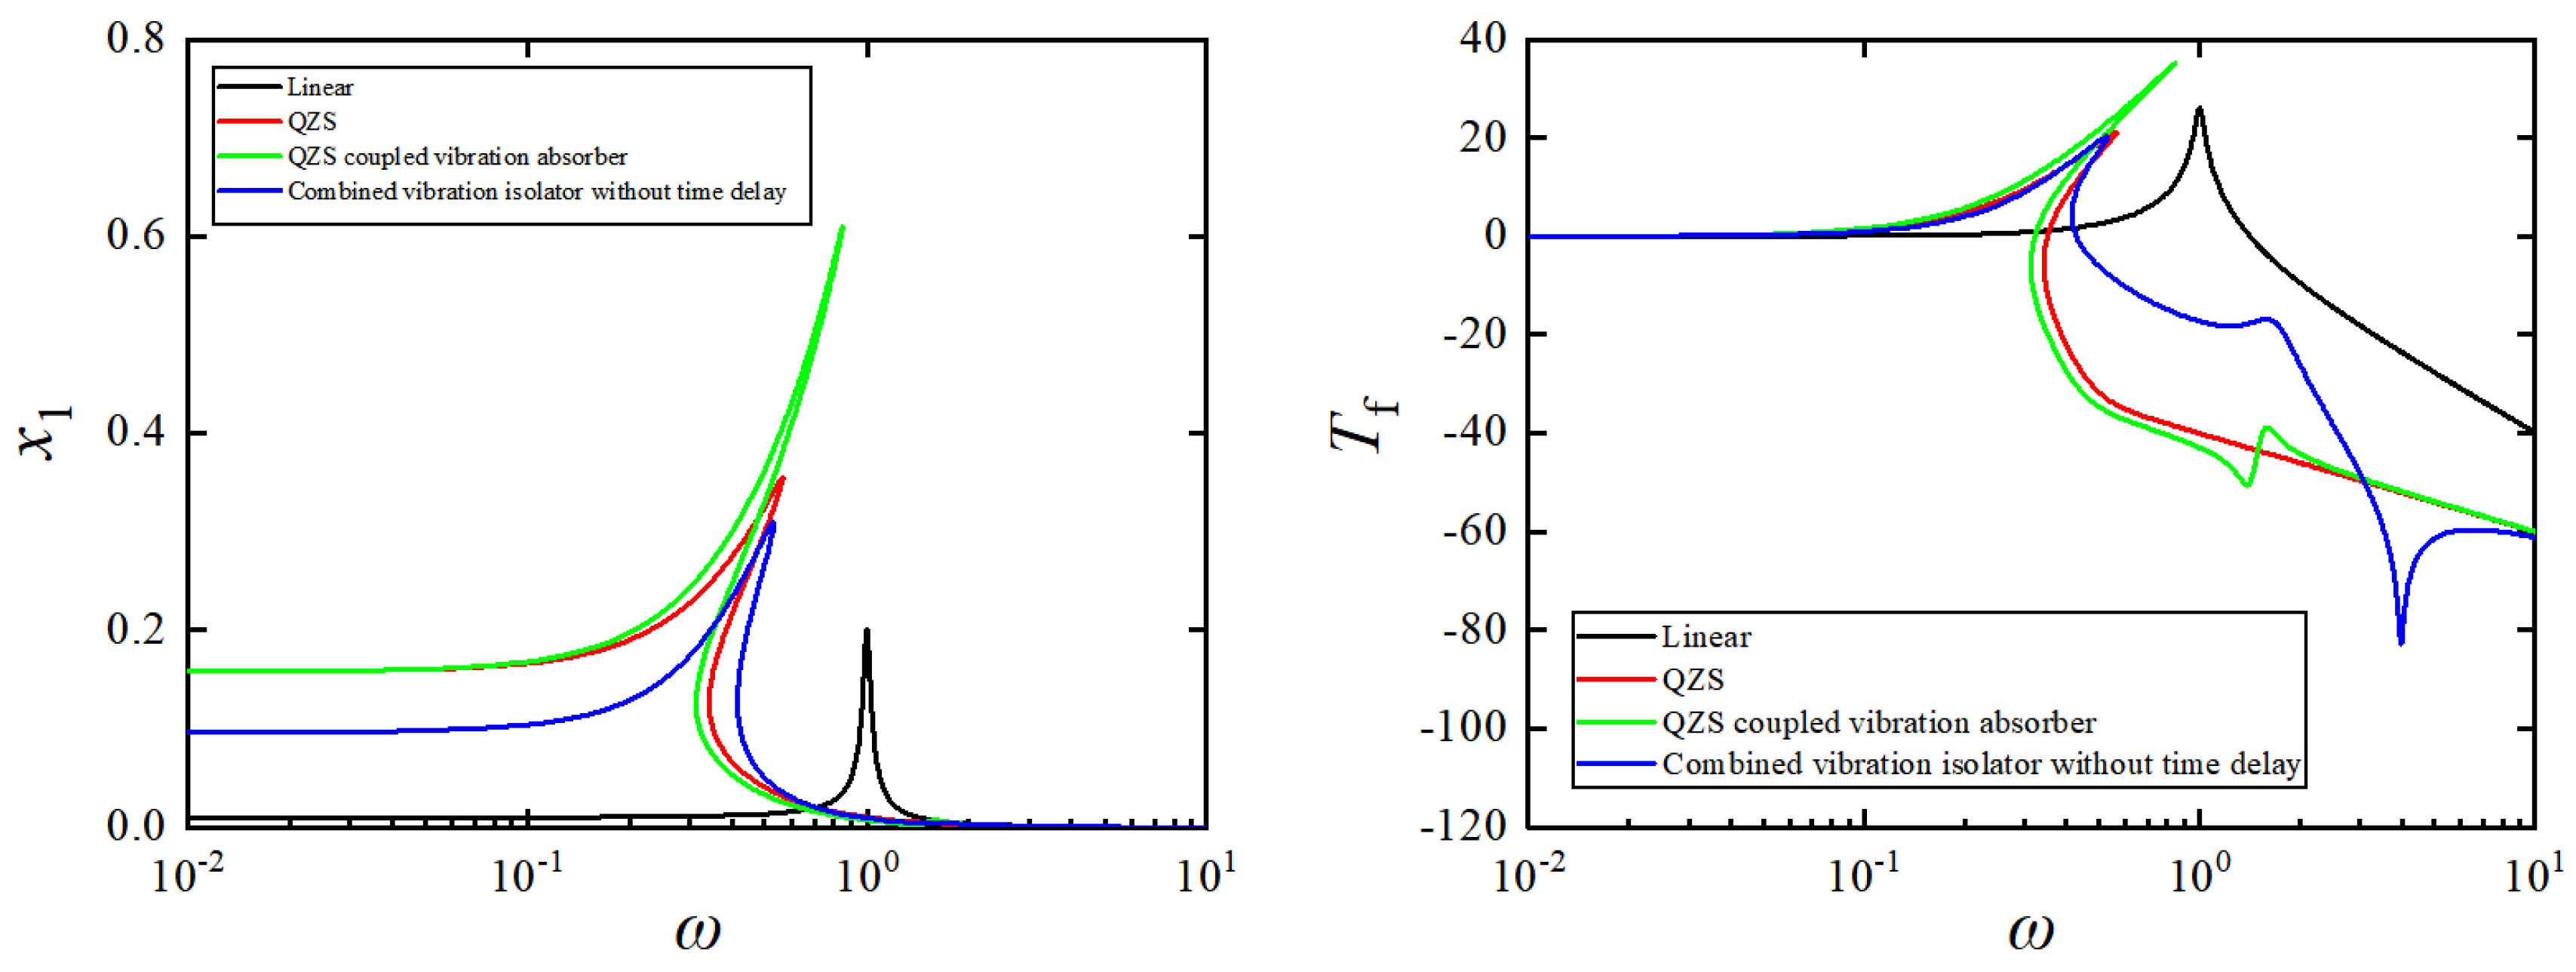
4.4. Comparison of Isolation Models

This section presents a rigorous comparative study of the proposed combined vibration isolation system against three alternative equivalent models, as depicted in Figure 10, with the aim of systematically assessing their vibration isolation efficacy. Specifically, the models include: Figure 10a a linear vibration isolator, characterized by parameters ( ζ 1 = 0.01 , f 0 = 0.01 ), Figure 10b a nonlinear quasi-zero stiffness (QZS) isolator, described by parameters ( ζ 1 = 0.01 , δ = 1 , η = 0.67 , f 0 = 0.01 ), and Figure 10c a nonlinear QZS isolator coupled with a dynamic vibration absorber, defined by parameters ( μ = 0.2 , ζ 1 = 0.01 , ζ 2 = 0.03 , δ = 1 , η = 0.67 , ν = 0.4 , f 0 = 0.01 ).
Figure 11 presents a comparative analysis of the vibration isolation performance of the four isolator configurations under harmonic excitation. As shown in the amplitude–frequency response curves in Figure 11a, the resonance frequency ratio of the quasi-zero stiffness (QZS) isolator shifts towards lower frequencies compared to the linear isolator, resulting in a broader isolation bandwidth and the emergence of nonlinear behavior. When a dynamic vibration absorber is coupled to the QZS isolator, the frequency ratio corresponding to the amplitude peak remains nearly unchanged, though the peak amplitude increases. By further connecting the absorber to the ground through additional springs and dampers—forming the hybrid isolator proposed in this study—the resonance peak is reduced from 0.34 to 0.20, corresponding to a 41% reduction, while the frequency ratio shifts further towards lower frequencies, thereby effectively broadening the isolation bandwidth.
The force transmissibility curves in Figure 11b reveal that, relative to the linear isolator, the QZS isolator exhibits a lower first resonance peak and a downward shift in the corresponding frequency ratio. The addition of a coupled absorber to the QZS system improves isolation performance near the peak-valley region. When the absorber is grounded, the first resonance peak is further suppressed and shifted to lower frequencies, while the second resonance peak increases; nevertheless, the isolation performance around the peak-valley region is significantly enhanced. These results demonstrate that the proposed hybrid isolator effectively improves vibration isolation performance and extends the operational isolation bandwidth.

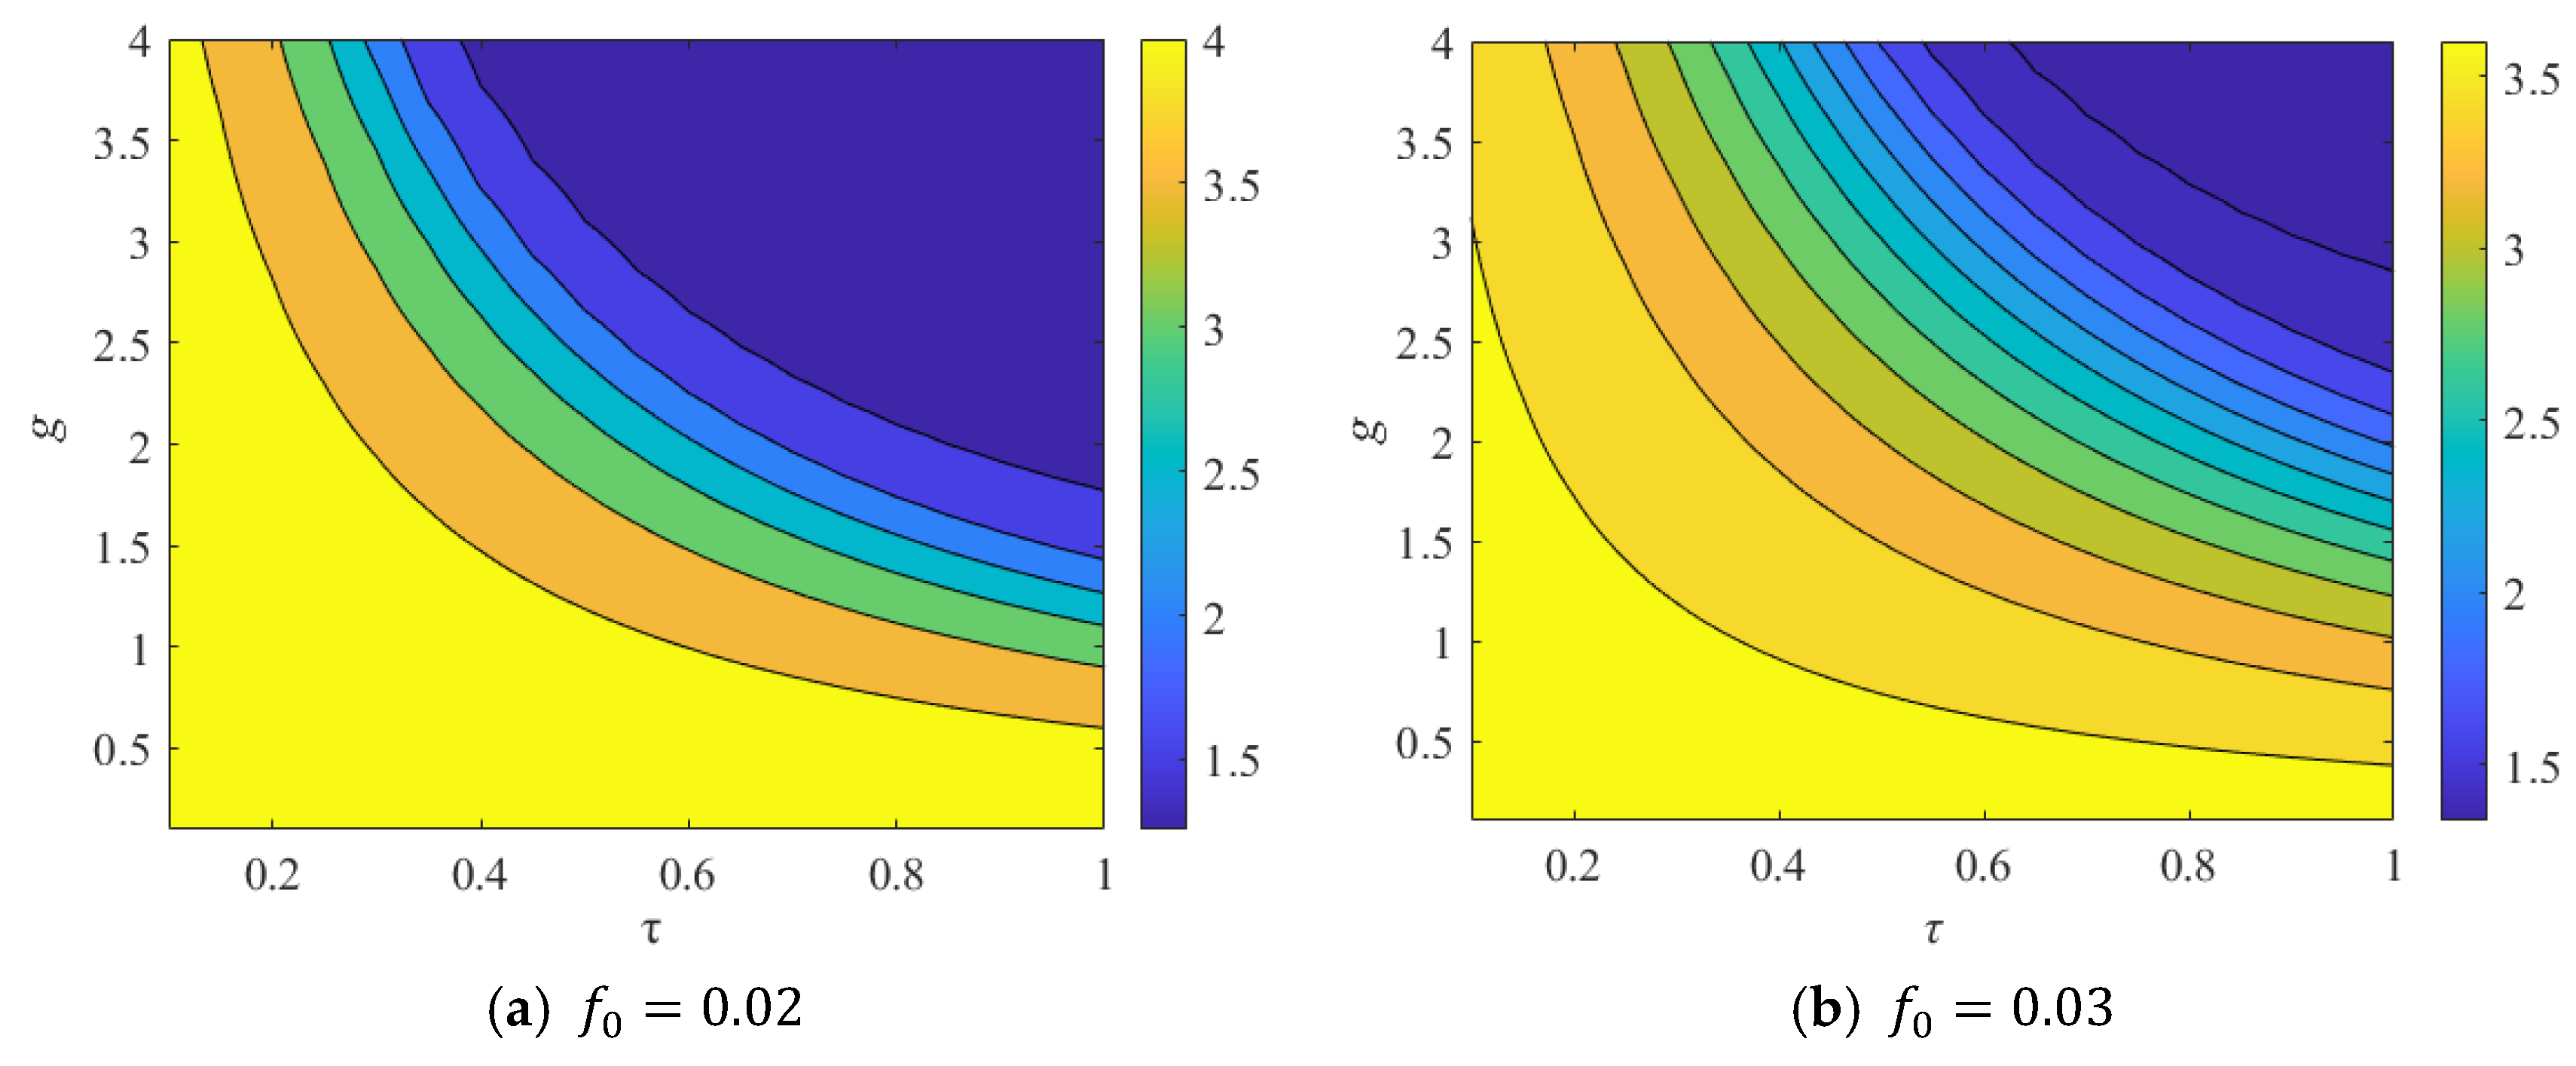
5. Parameter Optimization

In this section, the time-delay control parameters of the system are optimized using a genetic algorithm. With all other parameters held constant, the effects of the control gain g and the time delay τ on the transmitted force are investigated. The objective of the optimization is to minimize the transmitted force, thereby enhancing the vibration isolation performance.
The genetic algorithm is configured with a population size of 100, a maximum of 200 generations, a variable precision of 24 bits, a generation gap of 0.7, and a crossover probability of 0.7. The optimization ranges for the control gain g and the time delay τ are set to 0 g 4 and 0 τ 1 , respectively. For comparative purposes, the unoptimized time-delay feedback parameters were selected manually. Although these parameters were not derived through systematic optimization, they were chosen to ensure stable system operation while demonstrating the effectiveness of incorporating time-delay feedback control. This baseline facilitates a clear assessment of the performance enhancements achieved by the subsequent optimization.
Figure 12 depicts the force transmitted to the base under different amplitudes of external excitation at a frequency ratio of ω = 0.4 . The black, red, and blue curves represent the transmitted forces of the uncontrolled system, the unoptimized controlled system, and the optimized controlled system, respectively. In the unoptimized controlled case, the control gain g = 1 , and the time delay τ = 0.5 . In Figure 12a, when the excitation amplitude is f 0 = 0.02 , the optimized control parameters are g = 4 and τ = 0.56 . The magnitudes of the transmitted force for the uncontrolled system, the unoptimized controlled system, and the optimized controlled system are 0.089, 0.083, and 0.025, respectively. The optimized system transmits only 71.9% of the force transmitted by the uncontrolled system. Similarly, Figure 12b shows that when the excitation amplitude is f 0 = 0.03 , the optimal control parameters are g = 2 and τ = 0.64 . The corresponding transmitted force values are 0.111 (uncontrolled), 0.106 (unoptimized controlled), and 0.040 (optimized controlled), with the optimized system transmitting only 64% of the force of the uncontrolled system. These results demonstrate that the optimized time-delay feedback control significantly enhances the vibration isolation performance of the system.
Figure 13 shows the force transmitted to the base under varying resonance frequencies for an external excitation amplitude of f 0 = 0.01 . In this analysis, the unoptimized controlled system is configured with a control gain of g = 1 and a time delay of τ = 0.5 . In Figure 13a, when the frequency ratio ω = 0.2 , the optimized control parameters are g = 3.9 and τ = 0.95 . The magnitudes of the transmitted force for the uncontrolled system, unoptimized controlled system, and optimized controlled system are 0.020, 0.019, and 0.012, respectively. The optimized system transmits only 40% of the force transmitted by the uncontrolled system. Figure 13b demonstrates that when the frequency ratio is ω = 0.4 , the optimal parameters are g = 4 and τ = 0.34 . The transmitted force values are 0.066 (uncontrolled), 0.014 (unoptimized controlled), and 0.011 (optimized controlled), respectively. The optimized system transmits 83.3% less force than the uncontrolled system, representing a substantial improvement in vibration isolation performance.
The optimal control gain and time delay obtained via the genetic algorithm provide an effective basis for minimizing the transmitted force. In order to more clearly elucidate the impact of control parameters on the vibration isolation performance, exhaustive parametric sweeps are performed to generate force transmissibility contour maps in the ( g , τ ) plane as depicted in Figure 14 and Figure 15. Regions with darker shading correspond to significantly reduced transmissibility levels. Notably, the optimal parameter combinations obtained through genetic optimization are located precisely within these low-transmissibility regions. Further analysis reveals that appropriately selecting control parameters from these dark-shaded regions can substantially suppress system vibrations, thereby enhancing vibration isolation performance. However, this exhaustive search method is computationally expensive and time-consuming, especially as the number of parameters and their ranges increase.

6. Conclusions and Future Directions

This paper proposed a time-delay nonlinear vibration isolation system composed of a combined isolator and absorber. The dynamic behavior and vibration isolation performance of the system under harmonic force excitation were systematically investigated. The governing equations were established, and the stability of the system around the zero equilibrium point was analyzed. The harmonic balance method combined with the arc-length continuation technique was employed to obtain the amplitude–frequency response and force transmissibility curves. The results demonstrate that the introduction of time-delay feedback control effectively suppresses the resonance peaks and eliminates jump phenomena. Furthermore, a genetic algorithm was applied to optimize the control parameters. The optimization results reveal that the vibration isolation performance of the system is significantly improved compared to the unoptimized case. Quantitatively, the optimized control parameters lead to reductions in the force transmitted by 71.9% and 64% under external excitations of f 0 = 0.02 and f 0 = 0.03 , respectively. Moreover, for frequency ratios ω = 0.2 and ω = 0.4 , the force transmitted is decreased by 40% and 83.3%, respectively, indicating a substantial improvement in vibration isolation performance. Notably, the optimal control parameter combinations are located within the low-transmissibility (dark-shaded) regions of the parameter space, confirming the effectiveness of the proposed control strategy.
In our future work, we intend to further investigate the practical cost and optimization of control effort, with the aim of enhancing the engineering applicability and feasibility of the proposed system. Further optimization across broader frequency ranges will be considered in future work. The genetic algorithm shows potential for engineering applications, and future work will explore adaptive optimization and experimental validation to enhance its practical applicability. Although general trends can be observed from parameter sweeps, the genetic algorithm remains essential for efficiently identifying near-optimal solutions in complex, nonlinear systems with coupled performance requirements. Due to the scope of this study, a comprehensive investigation of broader parameter ranges and potential physical limitations will be left for future work.

Author Contributions

Conceptualization, Y.W.; methodology, Y.W. and X.L.; software, Y.W.; validation, Y.W. and X.L.; formal analysis, Y.W.; investigation, Y.W. and X.L.; resources, Y.W.; data curation, X.L.; writing—original draft preparation, Y.W.; writing—review and editing, X.L. and Y.W.; visualization, Y.W.; supervision, X.L.; project administration, X.L. All authors have read and agreed to the published version of the manuscript.

Funding

This research received no external funding.

Data Availability Statement

Data are contained within the article.

Conflicts of Interest

The authors declare no conflicts of interest.

References

  1. Basta, E.; Ghommem, M.; Emam, S. Flutter control and mitigation of limit cycle oscillations in aircraft wings using distributed vibration absorbers. Nonlinear Dyn. 2021, 106, 1975–2003. [Google Scholar] [CrossRef]
  2. Zhang, L.; Zhao, C.; Qian, F.; Dhupia, J.S.; Wu, M. A variable parameter ambient vibration control method based on quasi-zero stiffness in robotic drilling systems. Machines 2021, 9, 67. [Google Scholar] [CrossRef]
  3. Sun, Y.; Gong, D.; Zhou, J.; Sun, W.J.; Xia, Z.H. Low frequency vibration control of railway vehicles based on a high static low dynamic stiffness dynamic vibration absorber. Sci. China Technol. Sci. 2019, 62, 60–69. [Google Scholar] [CrossRef]
  4. Saeed, A.S.; Nasar, R.A.; Al-Shudeifat, M.A. A review on nonlinear energy sinks: Designs analysis and applications of impact and rotary types. Nonlinear Dyn. 2023, 111, 1–37. [Google Scholar] [CrossRef]
  5. Ding, H.; Chen, L.Q. Designs, analysis and applications of nonlinear energy sinks. Nonlinear Dyn. 2020, 100, 3061–3107. [Google Scholar] [CrossRef]
  6. Chen, D.; Wang, N.; Chen, Z.; Yu, Y. Parametrically excited vibrations in a nonlinear damped triple-well oscillator with resonant frequency. Vib. Eng. Technol. 2022, 10, 781–788. [Google Scholar] [CrossRef]
  7. Carrella, A.; Brennan, M.J.; Waters, T.P.; Lopes, V., Jr. Force and Displacement Transmissibility of a Nonlinear Isolator with High-Static-Low-Dynamic-Stiffness. Int. J. Mech. Sci. 2012, 55, 22–29. [Google Scholar] [CrossRef]
  8. Zhao, F.; Ji, J.; Ye, K.; Luo, Q. Increase of quasi-zero stiffness region using two pairs of oblique springs. Mech. Syst. Signal Process. 2020, 144, 106975. [Google Scholar] [CrossRef]
  9. Zhao, F.; Ji, J.; Ye, K.; Luo, Q. An innovative quasi-zero stiffness isolator with three pairs of oblique springs. Int. J. Mech. Sci. 2021, 192, 106093. [Google Scholar] [CrossRef]
  10. Gatti, G. A nonlinear quasi-zero stiffness vibration isolator with quintic restoring force characteristic: A fundamental analytical insight. J. Vib. Control 2024, 30, 4185–4198. [Google Scholar] [CrossRef]
  11. Zou, W.; Cheng, C.; Ma, R.; Hu, Y.; Wang, W. Performance analysis of a quasi-zero stiffness vibration isolation system with scissor-like structures. Arch. Appl. Mech. 2021, 91, 117–133. [Google Scholar] [CrossRef]
  12. Wang, Z.; He, C.; Xu, Y.; Li, D.; Liang, Z.; Ding, W.; Kou, L. Static and Dynamic Analysis of 6-DOF Quasi-Zero-Stiffness Vibration Isolation Platform Based on Leaf Spring Structure. Mathematics 2022, 10, 1342. [Google Scholar] [CrossRef]
  13. Chen, Y.; Shen, S.; Li, Z.; Hu, Z.; Li, Z. Semi-Active Suspension Control Strategy Based on Negative Stiffness Characteristics. Mathematics 2024, 12, 3346. [Google Scholar] [CrossRef]
  14. Ren, M.Z. A variant design of the dynamic vibration absorber. J. Sound Vib. 2001, 245, 762–770. [Google Scholar] [CrossRef]
  15. Liu, K.F.; Liu, J. The damped dynamic vibration absorbers: Revisited and new result. J. Sound Vib. 2005, 284, 1181–1189. [Google Scholar] [CrossRef]
  16. Shen, Y.J.; Sui, P.; Wang, X. Performance analysis and optimization of bimodal nonlinear energy sink. Nonlinear Dyn. 2023, 111, 16813–16830. [Google Scholar] [CrossRef]
  17. Long, X.; Zheng, P.; Ren, S. Active delayed control of turning and milling dynamics. J. Comput. Nonlinear Dyn. 2017, 12, 051022. [Google Scholar] [CrossRef]
  18. Udwadia, F.; VonBremen, H.; Phohomsiri, P. Time-delayed control design for active control of structures: Principles and applications. Struct. Control Health Monit. 2007, 14, 27–61. [Google Scholar] [CrossRef]
  19. Mao, X.; Ding, W. Nonlinear dynamics and optimization of a vibration reduction system with time delay. Commun. Nonlinear Sci. Numer. Simul. 2023, 122, 107220. [Google Scholar] [CrossRef]
  20. Vyhlídal, T.; Michiels, W.; Neusser, Z.; Bušek, J.; Šika, Z. Analysis and optimized design of an actively controlled two-dimensional delayed resonator. J. Mech. Syst. Signal Process. 2022, 178, 109195. [Google Scholar] [CrossRef]
  21. Gao, Q.; Liu, Y.; Cai, J.; Wu, H.; Long, Z. Complete stability analysis and optimization of the extended delayed resonator with virtual batural frequency adjustment. J. Dyn. Sys. Meas. Control 2023, 145, 011002. [Google Scholar] [CrossRef]
  22. Sun, X.T.; Xu, J. Vibration control of nonlinear Absorber–Isolator-Combined structure with time-delayed coupling. Int. J. Non-Linear Mech. 2016, 83, 48–58. [Google Scholar] [CrossRef]
  23. Ji, G.; Li, S.; Feng, G.; Li, Z.; Shen, X. Time-delay compensation control and stability analysis of vehicle semi-active suspension systems. Mech. Syst. Signal Process. 2025, 228, 112414. [Google Scholar] [CrossRef]
  24. Cai, J.; Gao, Q.; Zhang, X. Proportional-retarded control of a quasi-zero-stiffness vibration isolator. J. Sound Vib. 2024, 578, 118309. [Google Scholar] [CrossRef]
  25. Liao, X.; Liu, F.; Chen, L.; Lee, H.P.; Ma, X. On the optimal cubic feedback gain and time delay of quasi-zero stiffness vibration isolators: Analytical and numerical study. J. Vib. Eng. Technol. 2024, 12, 5007–5020. [Google Scholar] [CrossRef]
  26. Xing, Y.Z.; Yang, D.X. A combined vibration isolation system capable of isolating large amplitude excitation. Nonlinear Dyn. 2024, 112, 2523–2544. [Google Scholar] [CrossRef]
  27. Wang, F.; Xu, J. Parameter design for a vibration absorber with time-delayed feedback control. J. Acta Mech. Sin. 2019, 35, 624–640. [Google Scholar] [CrossRef]
Figure 1. Mechanical model of a combined vibration isolator with time delay.
Mathematics 13 02188 g001
Figure 2. Stability critical curves in the g , τ plane.
Mathematics 13 02188 g002
Figure 3. Time course of displacement response x 1 with different time delays at control gain g = 1 .
Mathematics 13 02188 g003
Figure 4. Comparison between analytical solution of HBM and numerical solution of RKM.
Mathematics 13 02188 g004
Figure 5. Amplitude frequency response curves with different time delay feedback control parameters.
Mathematics 13 02188 g005
Figure 6. Force transmissibility curves with different time delay feedback control parameters.
Mathematics 13 02188 g006
Figure 7. Amplitude–frequency response curves with different main system parameters. (a) Amplitude–frequency response under different mass ratios μ . (b) Amplitude–frequency response under different vertical damping ratios ζ 1 . (c) Amplitude–frequency response under different horizontal damping ratios ζ h . (d) Amplitude–frequency response under different horizontal stiffness ratios δ .
Mathematics 13 02188 g007
Figure 8. The force transmissibility curves of the system for different parameters. (a) Force transmissibility under different mass ratios μ . (b) Force transmissibility under different vertical damping ratios ζ 1 . (c) Force transmissibility under different horizontal damping ratios ζ h . (d) Force transmissibility under different horizontal stiffness ratios δ .
Mathematics 13 02188 g008
Figure 9. The force transmissibility curves of the system for different force excitation amplitudes.
Mathematics 13 02188 g009
Figure 10. Three isolator models.
Mathematics 13 02188 g010
Figure 11. Comparison of the performance of different vibration isolators under harmonic force excitation.
Mathematics 13 02188 g011
Figure 12. The force transferred from the system to the foundation for different amplitudes of external excitation when ω = 0.4 .
Mathematics 13 02188 g012
Figure 13. The force transmitted from the system to the foundation at different frequencies when f 0 = 0.01 .
Mathematics 13 02188 g013
Figure 14. The force transmissibility in the ( g , τ ) plane when ω = 0.4 .
Mathematics 13 02188 g014
Figure 15. The force transmissibility in the ( g , τ ) plane when f 0 = 0.01 .
Mathematics 13 02188 g015
Table 1. Physical quantity parameters of the system [27].
ParametersSymbolUnitsValue
Primary system mass M 1 kg1
absorber mass M 2 kg0.2
vertical stiffness K 1 N · m 1 2400
K 2 N · m 1 960
K 3 N · m 1 240
horizontal stiffness K h N · m 1 300
horizontal damping C h N · s · m 3 70
C 1 N · s · m 3 7
vertical damping C 2 N · s · m 3 20
C 3 N · s · m 3 40
spring compression length L m0.067
spring natural length L 0 m0.1
Disclaimer/Publisher’s Note: The statements, opinions and data contained in all publications are solely those of the individual author(s) and contributor(s) and not of MDPI and/or the editor(s). MDPI and/or the editor(s) disclaim responsibility for any injury to people or property resulting from any ideas, methods, instructions or products referred to in the content.

