1. Introduction
Under the global carbon neutrality strategy, lithium-ion batteries, as core components of electric vehicles and energy storage systems, are projected to reach an installed capacity of 4.7 TWh by 2030. The accurate prediction of their SOH has become a focal point of interest for both academia and industry. The progressive degradation of battery performance—such as capacity fade and impedance rise—directly affects system reliability and economic efficiency. Studies have shown that, when the SOH deviation among cells in a power battery pack exceeds 15%, the available system capacity may drop by over 22%, and battery replacement costs in energy storage stations can account for up to 34% of the total life-cycle cost. Therefore, accurately predicting the SOH of batteries is not only key to optimizing maintenance strategies but also a core technical challenge for enabling battery second-life applications and carbon footprint tracking.
SOH prediction methods for lithium-ion batteries mainly fall into two paradigms: mechanism-driven and data-driven approaches. Early studies were centered on electrochemical models and statistical learning methods. Li et al. [
1] improved the resampling strategy of the particle filter algorithm, reducing SOH prediction error to within 5%; however, the model relies on predefined capacity degradation equations, making it difficult to adapt to the dynamic charging strategies encountered in real-world scenarios. Wang et al. [
2] proposed a particle flow filtering framework combined with a gray model, which compensates for the capacity regeneration phenomenon and demonstrated superior performance over traditional Kalman filtering under laboratory cycling data. Nevertheless, its parameters must be calibrated for specific battery chemistries, limiting its generalizability across different materials. The fundamental bottleneck of such methods lies in the multi-scale coupled processes of battery aging, such as SEI film growth and lithium dendrite formation. Constructing precise physical models faces dual constraints of computational complexity and parameter identifiability [
3]. Moreover, frequent shallow charge–discharge cycles in real-world vehicle operations obscure features in ICA curves, rendering feature extraction methods based on complete charge–discharge cycles ineffective [
4].
The emergence of deep learning has opened new avenues for data-driven approaches. Ren et al. [
5] were among the first to apply DNN to RUL prediction, establishing an end-to-end mapping between voltage–current time series and capacity degradation. Their model achieved an MSE of 0.0023 on the NASA dataset. Zhao et al. [
6] proposed a hybrid architecture that further enhanced feature extraction capabilities: CNNs were used to capture local aging patterns, while BiLSTM modeled long-term dependencies. An attention mechanism dynamically weighted key time-step features, resulting in a 37% reduction in prediction error compared to conventional LSTM models. Hou et al. [
7] constructed a prediction model based on the ANN, but its performance was suboptimal in handling nonlinear temporal degradation under dynamic operating conditions. Mamo et al. [
8] demonstrated the effectiveness of LSTM in capturing long-term trends in capacity fade but noted its limited sensitivity to local transient features such as fast-charging pulses. Although these methods performed well on controlled laboratory datasets, they often overlooked the complexities of real-world scenarios—such as current fluctuations caused by dynamic charging strategies and internal temperature gradients within battery packs.
Zhang et al. [
9] developed a cross-cell deep learning framework that shared hidden layer parameters to enable knowledge transfer across different degradation paths, achieving an MAE of 1.8% under ten charging/discharging protocols. However, their model lacked sufficient representation of nonlinear effects from charging rates and electro-thermal coupling, with significantly increased prediction errors under local overheating conditions caused by fast charging.
To address the challenges of data scarcity and operating condition diversity, transfer learning and novel feature engineering methods have become research hotspots. Iftikhar et al. [
10] built a domain-adversarial deep model that maximized feature distribution alignment between source and target domains, reducing prediction error by 21% in cross-temperature experiments. Sun et al. [
11] proposed a TrAdaBoost-based transfer learning framework that leveraged laboratory data to support real-vehicle prediction. However, their feature alignment strategy failed to account for the asymmetric impact of the charging rate across different SOC ranges, leading to unquantified aging acceleration in the high-SOC fast-charging region. Wang et al. [
12] developed a cross-domain prediction model via degradation trend consistency analysis, and Ma et al. [
13] employed deep transfer learning for personalized health prediction. Nevertheless, these methods still face limitations in feature decoupling under dynamic conditions—particularly in modeling the interaction between ambient temperature fluctuations and charging/discharging strategies.
On the feature engineering front, Tang et al. [
3] used ICA to extract peak voltage shifts as degradation features and optimized nonlinear inflection point prediction with Gaussian kernel functions. However, this method depends on high-resolution voltage data and exhibits poor stability under real-world noise. Fan et al. [
14] constructed aging indicators using relaxation voltage time constants and successfully predicted degradation inflection points but required several hours of rest-state data, which limits real-time applicability. Krishna et al. [
15] combined IoT sensor data with machine learning, using surface strain signals to infer lithium plating levels—offering a novel approach for multiphysics modeling. However, their experiments focused solely on cylindrical cells, without validation for prismatic or pouch cells. Hu et al. [
4] were the first to build an SOH estimation model based on real-vehicle data, revealing correlations between behavior features such as the number of rapid accelerations and the initial SOC of charging with capacity fade. Yet, their linear regression model failed to capture the nonlinear effects of charging rates across SOC ranges, leading to reduced prediction stability under high-dynamic conditions.
Probabilistic prediction and real-time optimization have become prominent research directions in recent years. Li et al. [
16] developed an interpretable online prediction method that enhances model transparency through feature importance ranking. However, the improvement in interpretability comes at the cost of reduced prediction accuracy. Ly et al. [
17] proposed a T-shaped data structure and a quantile LSTM framework to achieve non-crossing quantile prediction, effectively quantifying RUL uncertainty. Nevertheless, its computational complexity limits its applicability in onboard systems. Huang et al. [
18] innovatively adopted an unsupervised learning method without labeled data by constructing a loss function based on the self-similarity of degradation curves, alleviating the high cost of data annotation. However, the reliability of predictions during the early degradation stage still requires validation. Jafari et al. [
19] combined the Harris Hawk Optimization algorithm with Random Forest/LightGBM models to enable automatic hyperparameter tuning, reducing prediction errors by 12% on public datasets, though they did not address the temporal non-stationarity present in real-world vehicle data. Addressing the phenomenon of capacity regeneration, Pang et al. [
20] proposed a detection algorithm based on transient relaxation features, effectively distinguishing between true degradation and capacity fluctuations. However, its threshold settings rely on empirical parameters, limiting its adaptability. Cheng et al. [
21] combined empirical mode decomposition with LSTM to enhance prediction stability through signal denoising, but the issue of mode mixing resulted in the incomplete suppression of high-frequency noise. Kwon et al. [
22] constructed a multi-level LSTM framework to simultaneously predict SOH and RUL while accounting for inconsistencies in cell voltage, yet they did not incorporate spatial distribution features such as temperature gradients, leaving the characterization of pack-level aging incomplete.
These developments highlight three core bottlenecks:
Existing models struggle with feature representation under real-world dynamic operating conditions. Traditional LSTM/CNN architectures lack temporal sensitivity to local degradation patterns, making it difficult to capture abnormal aging caused by transient behaviors such as fast-charging pulses or sudden temperature changes;
In cross-domain transfer learning, the distribution gap between laboratory and real-world vehicle data has not been effectively addressed through feature space reconstruction. In particular, the randomness in charging strategies leads to feature shifts that remain unmodeled;
The nonlinear modulation mechanisms of aging trajectories caused by multiphysics interactions—such as the dynamic coupling of current, temperature, and mechanical stress—remain insufficiently explored. Existing feature engineering mainly focuses on one-dimensional signal analysis and lacks the quantitative modeling of cross-scale effects such as electrothermal coupling.
To address the challenges of accurate SOH estimation and prediction under real-world operating conditions, this study proposes a novel framework, PWT, that integrates multi-scale time-frequency analysis and multiphysics-aware feature modeling. The approach significantly enhances the model’s ability to capture complex degradation dynamics, improve predictive accuracy, and generalize across diverse scenarios. The key innovations are as follows:
The proposed PWT architecture reorganizes temporal aging features into local patches and applies wavelet decomposition to multi-dimensional degradation signals. This enables multi-scale time-frequency analysis and reconstruction, strengthening local temporal correlations and enhancing the model’s capacity to learn from non-stationary sequences common in real-world battery data.
To capture the nonlinear effects of varying charging rates across different SOC intervals, a novel charging behavior scoring mechanism is designed using fuzzy membership functions. This quantifies degradation sensitivity under diverse charging conditions and embeds domain-specific knowledge into the model.
An interaction feature matrix of current and temperature is constructed to reflect the electrothermal coupling effects. Tensor decomposition is then applied to extract dynamic modulation patterns, allowing the model to incorporate multiphysics information and improving its generalization across complex operating environments.
2. Real Vehicle Data Processing
To address issues such as noise interference, outliers, and data incompleteness in real-world vehicle operation data, this chapter proposes a systematic data processing framework. The framework includes anomaly detection based on RRCF, a multi-dimensional abnormal data cleaning strategy, and a dynamic evaluation method for battery SOH labels based on ampere-hour integration and fuzzy Kalman filtering. This process aims to improve data quality and provide a reliable data foundation for battery SOH prediction models. The overall framework for SOH prediction is illustrated in
Figure 1.
2.1. Anomaly Data Detection Based on RRCF
Battery data collected from real vehicles—including voltage, current, temperature, and vehicle mileage—are often affected by complex operating conditions, sensor drift, and communication interference, resulting in nonlinear anomalous features. Traditional threshold-based methods and Isolation Forest algorithms have limited adaptability to dynamic time-series data. This study employs the RRCF algorithm for unsupervised anomaly detection. The core advantages of RRCF lie in
High-dimensional time-series adaptability: By randomly projecting multi-dimensional time series (such as combined voltage–current–temperature sequences) into a lower-dimensional space, it avoids the curse of dimensionality;
Dynamic robustness: An anomaly scoring mechanism based on local data density changes effectively identifies sudden anomalies caused by abrupt capacity drops or sensor failures during battery degradation;
Incremental computational efficiency: The tree structure supports online updates, enabling the real-time processing of streaming vehicle data.
Both Isolation Forest and RRCF algorithms evaluate anomaly scores based on the path length needed to isolate a data point. The path length refers to the number of steps from the root node to the leaf node where the data point is isolated. Specifically, the shorter the path length, the easier it is to isolate the point, and, thus, the higher the likelihood of it being an anomaly. For a given data point, the isolation path length is computed as follows:
where
is the path length required to isolate a data point
x in a single tree.
is a constant used to normalize the path length, representing the maximum possible path length of the tree. For a tree containing
samples,
is approximately
where
is a constant used to normalize the expected path length of the tree. This normalization constant ensures that the path lengths across all trees in the Isolation Forest are on a consistent scale.
Here, is the total number of trees, and is the path length of data point in the tree. is the normalization constant, representing the maximum possible path length of the tree. denotes the expected isolation path length of the data point across all trees, representing its average path length over multiple trees.
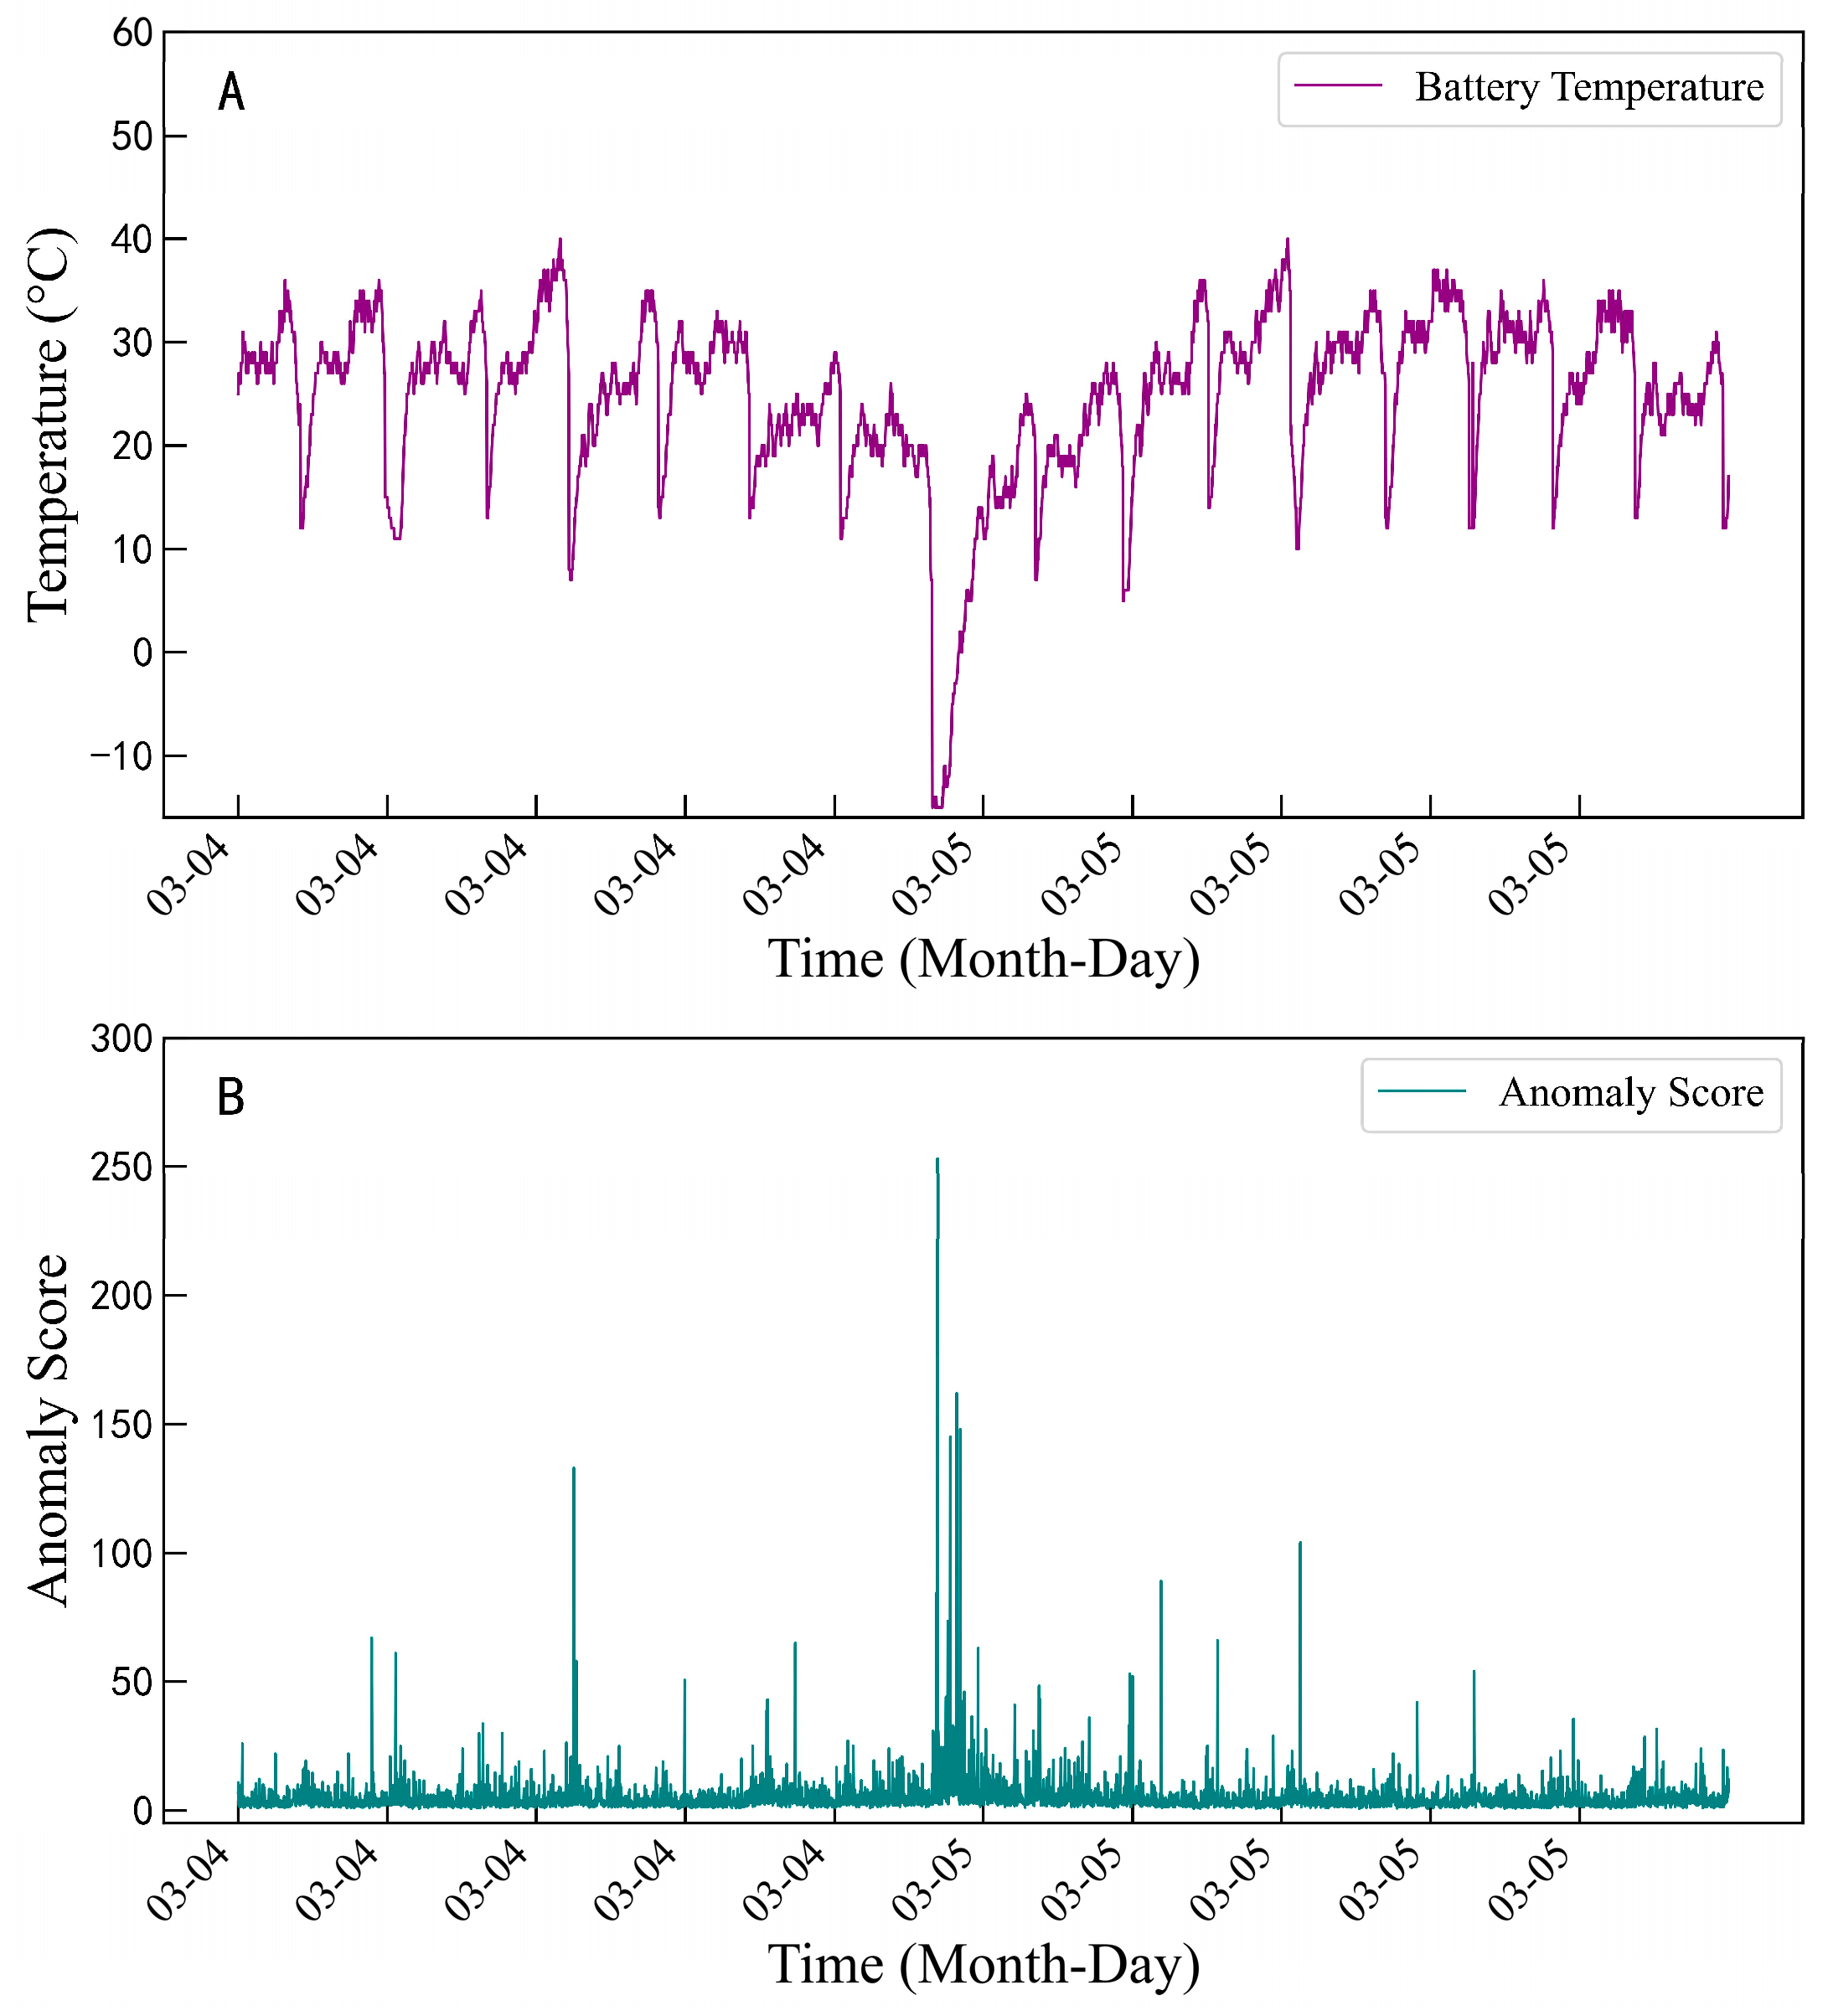
The specific implementation process is as follows: First, the raw data is segmented using a sliding window (with the window length set to a single charge–discharge cycle), extracting statistical features within each window (mean, variance, extreme values) as well as time series features (differenced sequences, rate of change). Next, the RRCF model is constructed, and anomaly scores are determined by calculating the collusive displacement distance between each sample point and other samples in the forest. A dynamic threshold (set at the fifth percentile) is used to mark abnormal segments. Using part of the data from a particular vehicle as columns, anomaly detection is performed via the RRCF algorithm, yielding the results shown in
Figure 2. Specifically,
Figure 2A shows the original data curve, while
Figure 2B displays the anomaly scores after detection. The higher the anomaly score, the greater the likelihood that the data point is an outlier.
2.2. Multi-Dimensional Anomalous Data Cleaning
For the anomalous data detected by RRCF, a set of multi-dimensional cleaning rules is designed based on the battery system mechanism and vehicle operation logic:
Battery SOC abnormality correction: Sudden jumps or prolonged stagnation in the battery SOC values are usually caused by Kalman filter estimation errors or sensor failures. Since SOC values have a significant impact on battery capacity assessment, abnormal SOC values must be corrected before capacity estimation. By combining the vehicle’s charging status and speed data, the reasonableness of SOC values can be evaluated. As shown in
Figure 3a, when the battery is in a non-charging state (charging status code 03) and the vehicle speed accelerates from zero, if the SOC value suddenly drops sharply to zero, it is considered abnormal and requires correction. Abnormal SOC values can be corrected using a three-point constraint method: using the SOC values at the start and end of the charging process as boundaries and applying smoothing interpolation combined with the ampere-hour integration results.
Charging status logical anomaly: The battery charging status directly affects SOC values, so abnormal charging states need to be corrected before further analysis. As shown in
Figure 3b, when the vehicle is in the start state (status code 01) and the vehicle speed is greater than or equal to zero, if the battery charging state shows 01 (indicating parking charging), the data is considered abnormal. At this point, corrections should be made based on vehicle speed, vehicle status, and the charging state information before and after.
Cumulative mileage anomaly handling: Mileage data during actual driving may exhibit non-monotonic increments due to CAN bus packet loss or odometer resets. As shown in
Figure 3c, segmented linear interpolation is applied to correct abnormal jump points, and the reasonableness of the interpolation is verified by integrating vehicle speed over time. If the deviation between the interpolation result and the integral calculation exceeds 5%, the data segment is considered invalid and should be discarded.
2.3. True Capacity Label Evaluation Based on Real Vehicle Data
This study uses real vehicle data. Due to the lack of laboratory-grade capacity testing conditions in real vehicles, multiple methods were preliminarily compared. The results indicate that the ampere-hour integration method demonstrates more stable performance in battery capacity assessment. Therefore, this paper proposes a dynamic capacity estimation method that combines the ampere-hour integration method with fuzzy Kalman filtering:
Ampere-hour Integration Estimation: Within a complete charging cycle (SOC 20–100%), the capacity is calculated by integrating the charging current:
where
is the current as a function of time,
is time,
and
represent the state of charge at the start and end of the charging cycle, respectively, and
is the battery capacity.
Figure 4 shows scatter plots of battery capacity calculated using the ampere-hour integration method for six selected vehicles. The results indicate considerable dispersion in capacity estimates, thus necessitating further correction using fuzzy Kalman filtering.
Fuzzy Kalman Filter Correction: The ampere-hour integration method is susceptible to errors from current sensor inaccuracies and SOC estimation errors, requiring further evaluation of battery capacity. Several methods were compared, as shown in
Figure 5, including LSTM, Kalman Filter, and Fuzzy Kalman Filter. Since the Kalman Filter results better capture the battery degradation trend, we introduce a fuzzy logic–enhanced Kalman filtering framework, in which the process noise covariance
and the measurement noise covariance RRR are dynamically adjusted according to the system’s real-time estimation performance. Instead of using fixed values for
and
, which often fail to reflect varying sensor quality or noise levels in real-world conditions, our method treats these parameters as outputs of a fuzzy inference system. This system uses the estimation residual
(i.e., the difference between the measured capacity and the Kalman-predicted capacity) and its first-order difference
as inputs, thereby enabling the filter to respond adaptively to different operating conditions.
The selection of fuzzy rules and membership functions is grounded in the expert knowledge of Kalman filter behavior and battery estimation dynamics. Specifically, triangular membership functions are used to categorize both and into linguistic variables such as “poor”, “average”, and “good”, reflecting the magnitude and stability of estimation errors. When large residuals and sharp fluctuations (i.e., poor estimation quality) are detected, the fuzzy logic controller increases the process noise covariance to allow the filter to respond more flexibly while decreasing to reduce the reliance on potentially unreliable measurements. Conversely, when the estimation residual is small and stable, indicating high confidence in both the model and measurements, is reduced, and is increased accordingly to improve filtering precision. The fuzzy inference system employs a Mamdani-type structure and uses a centroid defuzzification method to produce crisp outputs for and at each time step. This continuous adaptation enables the Kalman filter to maintain the accurate tracking of battery capacity despite the presence of noise, sensor drift, or model mismatch. Experimental results demonstrate that the fuzzy Kalman filter achieves superior performance compared to both traditional Kalman filtering and data-driven approaches such as LSTM.
This study achieves dynamic optimization of the observation noise covariance matrix in the SOH estimation process by integrating a fuzzy inference system with the Kalman filtering framework. To validate the effectiveness of the proposed method, multi-source data fusion was employed.
Validation Strategy: Laboratory-measured data from retired vehicle batteries were used to obtain baseline capacity values through standard charge–discharge tests. In addition, lithium-ion battery aging data from the publicly available dataset of the University of Maryland were integrated [
23]. As shown in
Table 1, compared with the traditional Kalman filter method, the proposed approach reduces the root RMSE by 9.6% across both datasets. This indicates that the fuzzy Kalman filter method, through its dynamic noise adjustment mechanism, significantly improves the robustness of capacity label estimation under complex operating conditions, thereby providing high-confidence supervisory signals for SOH prediction models.
3. Feature Engineering
This chapter focuses on the feature engineering framework for battery SOH prediction, establishing a multi-dimensional parameter correlation-based feature selection approach. The charging behavior and voltage consistency of the battery are evaluated, along with an in-depth analysis of the interaction between battery temperature and current, in order to extract features relevant to SOH prediction. To reduce computational complexity, the Pearson correlation coefficient method is employed to select features, ensuring both efficiency and conciseness in feature extraction.
3.1. Feature Construction
3.1.1. Evaluation of Charging Behavior
The charging conditions of real-world vehicles are influenced by driver behavior and differ from standard cycle tests conducted in laboratories. As a result, actual charging behavior has a significant impact on the health status of the battery. By analyzing the performance of power batteries under real charging conditions and properly evaluating their charging behavior, valuable insights can be gained for predicting the SOH of the battery.
To comprehensively characterize charging behavior and uncover patterns, it is necessary to define parameters that describe the actual charging conditions of the battery. During charging, the vehicle remains stationary, and parameters such as the charging current and the starting and ending SOC are closely related to the battery’s charging behavior. The specific parameters selected in this study are listed in
Table 2.
Due to the highly complex internal mechanisms of batteries, it is difficult to directly establish a model to evaluate charging behavior. Therefore, membership functions are employed to describe and assess the fuzzy relationship between charging parameters and charging behavior. The introduction of membership functions enables the scoring system to effectively handle uncertainty and fuzziness, making the evaluation of charging behavior more consistent with real-world conditions. Moreover, membership functions exhibit strong robustness in the presence of a small number of abnormal behaviors or deviations, helping to reduce the impact of noise and errors and thereby generating more stable scoring results. In addition, the relationship between battery charging behavior and battery health status has been experimentally validated. Thus, using membership functions to score charging behavior and incorporating the results as features into SOH prediction models is a reasonable approach [
24]. To quantify and evaluate the battery charging behavior in a structured and health-oriented manner, a novel assessment algorithm is proposed. This method combines multi-dimensional discretization of the charging state space with fuzzy membership weighting, enabling a more interpretable and health-aware scoring of charging patterns. The entire process involves five key steps, including state discretization, frequency-based mapping, fuzzy function design, matrix fusion, and score normalization.
To evaluate charging behavior, a discretized state-space framework is constructed using dual-dimensional partitioning over SOC and current. The continuous state space is mapped to an
grid:
The cumulative time spent in each grid cell forms the charging matrix
, and its normalized form approximates the charging trajectory’s probability distribution:
Fuzzy membership functions are defined to reflect battery health preferences. The SOC membership is modeled by a Gaussian function:
The current membership function uses a piecewise linear form:
A two-dimensional weight matrix
is generated by the outer product of the two membership functions. The final behavior score is computed as follows:
where
is a normalization factor for temporal comparability. Monthly scoring is performed by averaging valid membership products over time, enabling the robust, health-aware assessment of charging patterns.
The detailed evaluation process is illustrated in
Figure 6, and the evaluation results, using four vehicles as examples, are shown in
Figure 7.
3.1.2. Battery Voltage Consistency
Voltage consistency refers to the similarity and uniformity of the voltages of individual battery cells within a battery pack of a pure electric vehicle during charging and discharging processes. A battery pack is typically composed of multiple individual cells, each cell’s voltage variation reflecting its charge state and health condition. High voltage consistency indicates small voltage differences among the cells, suggesting that the cells operate in similar states and that the overall performance of the battery pack is stable. Conversely, low voltage consistency may imply significant voltage fluctuations in certain cells, which could lead to the overcharging or over-discharging of individual cells, thereby accelerating battery aging or causing premature failure.
The voltage consistency score effectively reflects the degree of voltage uniformity among the individual cells in the battery pack. This score primarily measures the magnitude of voltage differences between cells, thus representing the overall balance of the battery pack. The calculation formula for the voltage consistency score is as follows:
In the formula,
represents the standard deviation of the individual cell voltages, reflecting the degree of voltage fluctuation among the cells. It is the mean voltage of the individual cells, indicating the overall voltage level of the battery pack. The results of the voltage consistency score are shown in
Figure 8. As observed from
Figure 7, over the course of one year, the voltage consistency score shows a general declining trend. This indicates that, as the battery usage time increases, the voltage differences among individual cells gradually widen, resulting in reduced voltage consistency. The decline in voltage consistency reflects the gradual deterioration of the battery’s health status and indicates the degradation of the battery pack’s performance.
3.1.3. Interaction Between Current and Temperature
Battery capacity degradation is influenced not only by the individual effects of the current and temperature but also by their interaction, which accelerates capacity fade and internal resistance increase, significantly shortening battery life [
25,
26]. To analyze the variation trends of battery capacity under different temperature and current conditions, a pivot table aggregation method was used. By grouping data according to the maximum temperature and total current and calculating the mean capacity value for each combination,
Figure 9 reveals the adaptability performance under varying temperature and current conditions. It can be seen from the figure that the charging current magnitude is affected by temperature, decreasing as the temperature drops.
To incorporate the interaction between current and temperature into the battery SOH prediction model, polynomial interaction features combining current and temperature were constructed to capture nonlinear relationships. Considering that the relationship between current, temperature, and battery SOH is not simply linear, a gradient descent-based optimization method was used to determine the polynomial parameters. The specific formula is as follows [
27]:
Interaction feature
represents the nonlinear combination of current
and temperature
and is expressed as follows:
Here,
M and
N represent the highest polynomial degrees of current and temperature, respectively, and
are the polynomial coefficients to be optimized. The loss function
is expressed as follows:
The equation variables are as follows: represents the battery capacity of the sample, is the interaction feature value of current and temperature for the kk-th sample, and K is the total number of samples.
The coefficients
are optimized using gradient descent, with the gradient calculated as follows:
The parameters are iteratively updated to minimize the loss function, with the update formula given by the following:
In the formula, t represents the iteration number, and is the learning rate, which determines the step size for parameter updates.
To avoid gradient vanishing, regularization is introduced, resulting in the improved loss function:
The parameter update formula is as follows:
3.2. Feature Selection
In high-dimensional feature data, there may exist redundant, duplicate, or irrelevant features. These not only increase the computational complexity of the model but also may introduce noise, reduce the model’s predictive performance and stability, and even lead to overfitting or the curse of dimensionality. Therefore, performing feature selection before feature extraction is a crucial step. Its purpose is to filter out features closely related to the prediction task from the initially constructed feature set while removing ineffective features, thereby providing a more concise and high-quality input foundation for subsequent feature extraction and model training.
This study employs the Pearson correlation coefficient method to perform correlation analysis on the initially constructed features, quantitatively evaluating the degree of linear correlation between each pair of features. The Pearson correlation coefficient is a classic statistical measure used to assess the correlation between two variables, with values ranging from −1 to 1. A coefficient close to 1 indicates a strong positive correlation, meaning that the two features exhibit similar variation trends; a coefficient close to −1 indicates a strong negative correlation, meaning that the two features show opposite variation trends; and a coefficient close to 0 indicates almost no linear correlation between the two features.
During feature selection, if certain feature pairs exhibit high correlation (e.g., the absolute value of the correlation coefficient exceeds a set threshold), they are considered redundant. Typically, one important feature is retained while the others are removed to reduce input dimensionality. At the same time, features with very low correlation to the battery’s SOH are considered ineffective and are eliminated. Through this process, the retained feature set becomes more compact and efficient, helping to improve the model’s learning ability and generalization performance.
To better illustrate the correlation between features and the target variable, a correlation heatmap between the battery SOH and the remaining features was plotted, as shown in
Figure 10. The heatmap uses a color gradient to represent the degree of correlation between each pair of features, where darker colors indicate stronger correlations and lighter colors indicate weaker correlations. By observing the heatmap, highly correlated feature pairs as well as features unrelated to the target variable can be quickly identified, providing a basis for feature selection. This method not only significantly reduces feature dimensionality but also effectively alleviates redundancy and noise interference among features before model training. The selected features after screening are listed in
Table 3.
4. Patch Wavelet Transformer
To simultaneously capture both temporal and frequency-domain information in time series forecasting and preserve the strong local correlations inherent in time sequences, we designed a hybrid Transformer framework driven by two core concepts: frequency-domain enhancement and local attention. This framework retains the original Encoder–Decoder structure of the Transformer, with similar architectures for both.
In the Encoder, the original sequence first undergoes wavelet decomposition. The reconstructed signals containing rich information across various frequency bands are then fused with the original time series along the channel dimension, forming a multi-scale feature representation that captures both trends and fine-grained details.
Next, the fused long sequence is divided into multiple short segments (patches), and self-attention is applied at the patch level. This helps preserve the local dependencies within the sequence while significantly reducing the computational complexity of attention operations.
Finally, a carefully designed multi-scale spatial attention module is introduced to integrate features from different high-dimensional representations, thereby enhancing the model’s prediction accuracy. This design fully leverages the frequency-domain insights brought by wavelet decomposition and ensures model scalability and efficiency through patch-level attention (
Figure 11).
4.1. Wavelet Decomposition
The real-world operating data of battery electric vehicles exhibits significant non-stationarity and multi-scale characteristics. Traditional Transformer models often struggle to simultaneously capture both local details and long-term trends when modeling such complex time-series signals. In recent years, to address complex trends and local variations in time-series data, some studies have introduced decomposition mechanisms into the Transformer architecture to improve its long-term modeling capabilities [
28].
Inspired by this, we designed a wavelet decomposition-based module that decomposes the original time-series data into high-frequency and low-frequency sub-signals. This allows for the extraction of both instantaneous variations and overall trend features, enhancing the representation of temporal and frequency-domain information and enabling the fine-grained modeling of potential temporal dependencies [
29].
To strengthen the representation of temporal and frequency-domain information in the sequence data and to better capture subtle temporal dependencies, we propose a Wavelet Decomposition and Feature Concatenation Module. This module introduces multi-scale feature representations through decomposition and reconstruction of the original time series, thereby improving the model’s ability to capture both short-term details and long-term trends.
Specifically, let the original input time series be the following:
where B denotes the batch size, T represents the time step length, and F indicates the number of features.
First, the wavelet decomposition method is used to decompose the original sequence
X into a high-frequency component
Xh and a low-frequency component
Xl, which, respectively, capture instantaneous variations and overall trends. The decomposition process is as follows:
where
Xl and
Xh both have the shape
.
To fully integrate the original information with the sub-signals at different scales, X,
Xl, and
Xh are concatenated along the feature dimension (i.e., the last dimension), resulting in the enhanced feature representation
Xcat:
The dimension of the concatenated tensor is as follows:
The overall information flow process is as follows:
The Wavelet Decomposition and Feature Concatenation Module effectively integrates the original time series features with multi-scale fine-grained variation features, providing richer input information for subsequent modeling layers (such as the Transformer module). This contributes to enhancing the model’s performance in handling complex, non-stationary, and multi-scale time series data.
4.2. Patch-Based Time Series Segmentation
To effectively handle non-stationary and multi-scale time series data, this paper proposes a Patch-based time series segmentation method. This approach decomposes the time series into multiple small segments using a sliding window, enabling the Transformer model to more accurately capture both local details and long-term trends. By employing the sliding window technique, the data is divided into multiple patches. Each patch has a length of L and a stride of S. The
p patch can be represented as follows:
where
Pp has the size (L, 3d), meaning that each patch contains L time steps, and the feature dimension is 3d. The specific time series patching process includes the following steps:
Input data: Assume the input data is Xcat with dimensions (T, 3d).
Window partition: Use a sliding window method with fixed length L and stride S to segment Xcat into multiple patches.
Patch representation: Each patch p consists of L consecutive time steps of data, represented by Equation (22).
Patch input: All generated time series patches are fed into subsequent models for processing.
4.3. Temporal Attention Mechanism
The core advantage of the Transformer architecture in battery life prediction lies in its efficient modeling of long-range temporal dependencies. Through the self-attention mechanism, the model can flexibly capture cross-cycle correlation features within time series data, effectively integrating key degradation information during the charge–discharge process. Moreover, compared to recurrent structures, the Transformer is more efficient in parallel computation and handling long sequences, making it well-suited for high-frequency, long-duration real vehicle data.
In this model, both the encoder and decoder are constructed based on the Transformer architecture. Taking the standard “Scaled Dot-Product Attention” as an example, its calculation formula is as follows [
30]:
where Q, K, and V represent the Query, Key, and Value matrices, respectively, all obtained by applying linear transformations to the input features. Here,
dₖ denotes the dimension of the key vectors.
To enhance the model’s expressive capability, the Multi-Head Attention mechanism is introduced, which computes multiple attention subspaces in parallel and then concatenates and fuses the results:
Each attention head is computed as follows:
In this way, the model can learn diverse features in the sequence from different representation subspaces.
4.4. Multi-Scale Channel Attention Mechanism
Considering that the importance of components at different scales after wavelet transform varies, this paper further introduces a multi-scale channel attention mechanism to adaptively weight the feature responses at different scales. This mechanism draws on the design concept of the SE (Squeeze-and-Excitation) module and mainly includes global pooling, nonlinear activation, and channel recalibration processes:
Here, represents the feature of the c channel, and is the weight of that channel. This mechanism effectively enhances the model’s sensitivity to key frequency band features, further improving its feature extraction capability.
5. Model Validation
5.1. Validation Across Different Vehicles
This study uses real-world data from 86 vehicles. The real-world dataset used for model validation consists of operational data collected from 86 electric vehicles over approximately six months, spanning from December 2023 to June 2024. All vehicles are equipped with lithium iron phosphate (LiFePO4) battery packs, widely adopted in commercial electric vehicles for their safety and longevity. To ensure geographic and environmental diversity, the vehicles are distributed roughly evenly across six major cities in China Mainland: Kunming (14 vehicles), Leshan (10 vehicles), Guangzhou (22 vehicles), Changchun (6 vehicles), Tianjin (14 vehicles), and Hangzhou (20 vehicles). This distribution covers a broad spectrum of climatic conditions—from the subtropical climate in Guangzhou to the colder temperate environment in Changchun—and different traffic and usage patterns. In this study, the tested battery system is a lithium iron phosphate (LiFePO4) battery pack composed of prismatic cells, each with a nominal voltage of 3.2 V. The entire battery pack has a rated mass of approximately 200 kg and is structurally divided into nine regions. To monitor thermal behavior, each region is equipped with one temperature probe, enabling distributed temperature measurement across the pack during real-world vehicle operation.
Meanwhile, data from six vehicles operating in different environments (as shown in
Figure 12) were selected as the validation dataset to evaluate the model’s performance in predicting the battery SOH. The validation results of the model are presented in
Table 4. From the data in
Table 4, it can be seen that there are some differences in the model’s performance across different vehicles. However, based on the RMSE, MAPE, and R
2 metrics, the model used in this study demonstrates lower prediction errors on these six vehicles compared to other models, indicating that the model can effectively adapt to battery characteristics under different vehicles and operating conditions. In the experimental process, the parameters of the proposed PWT and their settings are as follows: the number of attention heads is 4, the patch window size is 3, and the batch size is 64. The Adam algorithm is adopted for optimization, with an initial learning rate set to 0.001 and decay based on 0.0001. All these parameters are tuned via grid search. All experiments, including model training and evaluation, were conducted on a workstation equipped with an Intel
® Xeon
® Gold 6130 CPU @ 2.10 GHz, 96 GB of RAM, and an NVIDIA Tesla T4 GPU with 16 GB of memory. This computational environment ensured efficient model development and the fair comparison of runtime performance across different methods.
To further analyze the effect of proposed method, this study conducted a visual comparison between the prediction results of the Transformer model and the Wavelet Transformer model.
Figure 13 shows the prediction results of the Transformer model, while
Figure 14 presents the results of the PWT model.
Compared with the Transformer model, the PWT model demonstrates higher prediction accuracy and stronger adaptability. In particular, in regions with abrupt changes, the PWT model is able to rapidly adjust its predictions to closely follow the variations in the actual values. At the same time, it also shows more accurate long-term trend capture. Under different time periods and data distributions, the model exhibits greater stability, fully reflecting its significant advantages in the SOH prediction task. It can accurately track short-term fluctuations while maintaining high overall prediction accuracy.
5.2. Comparative Validation of Models
To validate the predictive performance of the proposed PWT model, several commonly used models—including LSTM, Random Forest, Transformer, and PatchTST—were selected as baselines for comparison.
Table 5 presents the RMSE, MAPE, R
2, and computation time of each model on the test set, offering a comprehensive evaluation of their prediction accuracy and computational efficiency.
The experimental results clearly demonstrate that PWT outperforms all other models across all metrics. Compared with the Transformer, the RMSE and MAPE of PWT are reduced by approximately 83% and 96%, respectively, and the computation time is reduced by about 20%. Compared with the strong-performing PatchTST, PWT further reduces the error metrics by over 50% while maintaining a similar computation time. Overall, PWT achieves high prediction accuracy with notable computational efficiency, demonstrating strong comprehensive performance and practical application potential.
5.3. Experimental Data Validation
To further verify the practical effectiveness of the proposed battery SOH prediction model, a series of experiments were designed in this study. The experiments focused on disassembling the battery from a real vehicle that had been operating under various working conditions for several years. Full charge/discharge tests were conducted using a bench testing system to obtain more accurate battery state information than that collected directly via onboard sensors. This experiment is conducted independently of the earlier validation on the 86 vehicles. Unlike the previous dataset—collected over a six-month period (December 2023 to June 2024) from vehicles in the field—this battery pack was recovered from a different vehicle outside the training and validation set, featuring a different usage history, operating environment, and time span.
The experimental setup is shown in
Figure 15. It consists of a battery testing and simulation system used for battery performance validation and battery management system (BMS) research and testing. The black rectangular device in the image is the battery pack under test. The two devices in the background are battery testers, which charge and discharge the battery while monitoring parameters such as voltage, current, and temperature. With this equipment, this study could comprehensively evaluate battery performance and provide more reliable validation data for the SOH prediction model.
After collecting the experimental data, the actual battery data were compared with the SOH predicted by the model. In
Figure 16a, the experimental curve of the battery capacity evaluation method proposed in this study shows an estimated value of 42.3 Ah, while the experimentally calculated value is 41.92 Ah.
Figure 16b displays the prediction results based on experimental data: the actual collected SOH values (red curve) and the model-predicted SOH values (blue curve) exhibit a similar overall trend. The actual data show a gradual decline, and the overall trend closely matches the true values. According to model evaluation metrics, the RMSE is 0.0254, MAPE is 0.0204, and R
2 is 0.935, further demonstrating the accuracy of the prediction results.
6. Conclusions
This paper proposes a PWT model that integrates wavelet decomposition with Transformer architecture, aiming to address the limitations of existing battery capacity prediction models that overly rely on laboratory data and overlook the impact of real-world operating conditions. The proposed model utilizes wavelet decomposition for multi-scale temporal data processing, combined with attention mechanisms to effectively enhance the modeling of battery degradation patterns.
To address the challenge of hard-to-obtain capacity labels, a fuzzy Kalman filtering method based on ampere-hour integration is proposed. Validation results show a relative error of only 0.906%, significantly improving the accuracy of capacity labeling. In terms of feature engineering, a charging behavior scoring mechanism based on fuzzy membership functions and a current–temperature interaction feature matrix are introduced to further enhance the model’s sensitivity to battery degradation. Experimental results demonstrate that the PWT model maintains strong stability and generalization capabilities, with a worst-case RMSE of 0.0226, MAPE of 0.0725, and R2 of 0.903 under various operating conditions. Compared with models such as LSTM, Transformer, and PatchTST, the proposed approach achieves superior prediction accuracy, robustness, and computational efficiency.
Despite the promising results, this study has certain limitations. One key constraint is the limited diversity of the dataset, which currently includes only a single vehicle model, restricting the generalizability of the proposed method across various vehicle platforms and operating conditions. Future work will focus on building a more diverse dataset encompassing different vehicle types, usage conditions, and degradation patterns to improve the scalability and robustness of the model.
In addition, the current SOH estimation is primarily based on capacity-related features, without fully incorporating other health indicators such as internal resistance and power output consistency. A more comprehensive characterization of battery degradation that integrates multiple dimensions of information could further enhance the accuracy and stability of SOH predictions.
To improve the adaptability and deployment efficiency of the model in practical scenarios, future research will also explore the integration of pre-trained foundation models and fine-tuning techniques. By leveraging transfer learning, it is expected that the model can be quickly adapted to individual vehicle characteristics within large fleets, without the need for extensive retraining. This approach offers a promising path toward efficient, scalable, and personalized SOH prediction across real-world electric vehicle populations.
In summary, the method presented in this study exhibits promising potential in both theoretical innovation and practical application, providing an effective solution for power battery health management.


