Article

Power Dispatch Stability Technology Based on Multi-Energy Complementary Alliances

1
School of Cyber Science and Engineering, Southeast University, Nanjing 210000, China
2
Nicholas School of the Environment, Duke University, Durham, NC 27708, USA
3
School of Artificial Intelligence, Chongqing Technology and Business University, Chongqing 400067, China
*
Author to whom correspondence should be addressed.
Mathematics 2025, 13(13), 2091; https://doi.org/10.3390/math13132091
Submission received: 19 May 2025 / Revised: 21 June 2025 / Accepted: 23 June 2025 / Published: 25 June 2025
(This article belongs to the Special Issue Artificial Intelligence and Game Theory)

Abstract

In the context of growing global energy demand and increasingly severe environmental pollution, ensuring the stable dispatch of new energy sources and the effective management of power resources has become particularly important. This study focuses on the reliability and stability issues of new energy dispatch considering the complementary advantages of multiple energy types. It aims to enhance dispatch stability and energy utilization through an innovative Distributed Overlapping Coalition Formation (DOCF) model. A distributed algorithm utilizing tabu search is proposed to solve the complex optimization problem in power resource allocation. The overlapping coalitions consider synergies between different types of resources and intelligently allocate based on the heterogeneous demands of power loads and the supply capabilities of power stations. Simulation results demonstrate that DOCF can significantly improve power grid resource utilization efficiency and dispatch stability. Particularly in handling intermittent power resources such as solar and wind energy, the proposed model effectively reduces peak shaving time and improves the overall network energy efficiency. Compared with the preference relationship based on selfish and Pareto sequence, the PGG-TS algorithm based on BMBT has an average utility of 10.2% and 25.3% in terms of load, respectively. The methodology and findings of this study have important theoretical and practical value for guiding actual energy management practices and promoting the wider utilization of renewable energy.

1. Introduction

The global energy sector is undergoing a profound transformation, with new energy-generation technologies playing a crucial role. As fossil fuel resources gradually deplete and their environmental and climate impacts become increasingly evident, the global demand for clean, renewable energy has risen sharply. New energy generation, including solar and wind power, has become a significant force driving the global energy structure towards a greener and more sustainable direction due to its renewable and low-carbon characteristics. The rapid development of new energy technologies and their significant cost reductions are changing the competitive landscape of the global electricity market. For instance, solar and wind technologies have made tremendous technological advances over the past decade, dramatically reducing the cost of electricity generation from these sources, even falling below that of traditional coal and natural gas power plants in many regions. This trend has not only promoted the widespread adoption of new energy generation but also facilitated the diversification of the global energy supply. With technological advancements and policy support, new energy generation can not only provide a reliable power supply but also drive job growth and economic development, especially in the solar and wind energy sectors. Many countries have made new energy generation a core part of their national energy strategies to promote economic restructuring and upgrading. Therefore, new energy generation is not only an effective way to address environmental and energy challenges but also a major trend in the global energy future.
The integration of renewable energy photovoltaic and energy storage systems in industrial parks can significantly reduce electricity costs while reducing carbon emissions. The strategic configuration of photovoltaic and energy storage systems is essential to promote low-carbon sustainable development [1]. The integration of photovoltaic and energy storage brings significant economic benefits to industrial parks. In order to reduce greenhouse gas emissions, the automotive industry has begun to promote electric vehicles (EVs) to replace gasoline vehicles [2]. Electric vehicles emit more than 50% less carbon per kilometer than traditional fuel vehicles. Zhang et al. [3] focused on the economic and environmental issues of different types of energy scheduling in microgrids, integrated photovoltaic power generation prediction results, and optimized the scheduling of microgrid power systems. Mao Yang et al. [4] proposed a WFC short-term power prediction method based on numerical weather forecast (NWP) correction and adaptive spatiotemporal graph feature information fusion, which is conducive to improving wind power utilization efficiency and alleviating power system scheduling pressure. Wind power forecasting (WPF) is used to integrate new energy technologies into the power system safely [5], stably, and reliably; apply risk identification models and avoid risks; reduce errors; reduce the adverse effects of wind power grid connection; reduce grid operation costs; and improve the operational reliability of the power system.
Cumulative carbon dioxide emissions since the Industrial Revolution are closely related to the 1.2 °C warming that has already occurred. Since 1850, humans have emitted a total of about 2.5 trillion tons of carbon dioxide into the atmosphere. Currently, there is less than a 500 billion remaining budget to keep the temperature rise below 1.5 °C. Zhang, SL [6] proposed an unloading mechanism based on task characteristics to optimize the latency and energy consumption of unmanned vehicle network bandwidth. Wei, M [7] proposed a multi-objective optimization model for the aircraft flight scheduling problem (AFSP) to assign a group of aircraft located at different airports to perform all flight trips. Examples show that the model can effectively improve the operational efficiency of the fleet from a scheduling perspective. Qinglin Meng et al. [8] proposed a novel two-layer, four-stage optimization framework to address the operational challenges brought about by renewable energy volatility and uncoordinated charging of electric vehicles (EVs) in active distribution networks (ADNs) that can reduce load and cut costs compared with traditional methods. Ke Wang [9] proposed a multi-stage resilience enhancement strategy that considers the coordinated reconstruction of the power distribution system (PDS) and the district heating system (DHS), coordinating the post-disaster degradation, fault isolation, and service recovery stages, which can effectively illustrate the performance impact of the coordinated reconstruction of the PDS and DHS on resilience enhancement. Huaizhi Yang et al. [10] proposed a new energy storage system (ESS) planning method to improve the emergency response capacity of the ESS during hurricanes, strengthen the grid connection of renewable energy generation under normal weather conditions, and reduce the losses caused by wind abandonment and load reduction in all scenarios. Torge Wolff et al. [11] proposed the use of the Dynamic Alliance of Electricity Markets (DYCE) to optimize the overlapping alliance of distributed energy resources (DERs) that can be applied to virtual power plants, active distribution networks, and microgrids.
Despite the numerous advantages of new energy generation, one of its biggest challenges lies in the stability and reliability of the power dispatch, primarily due to the uncontrollable nature and dependency of the new energy sources themselves. New energy sources such as solar and wind are significantly influenced by natural conditions like sunlight, wind speed, and climate changes, resulting in large fluctuations and unpredictability in power generation. Firstly, solar power generation heavily depends on lighting conditions. For example, cloudy days or short daylight hours in winter directly affect the power output of solar panels. Moreover, even on clear days, changes in the sun’s position cause fluctuations in power generation. This dependency and volatility mean that it is difficult for solar power generation to serve as a major stable power supply for the grid. Secondly, wind energy generation faces similar instability issues. The power output of wind farms is directly affected by wind speed, with both too low and too high wind speeds leading to decreased generation efficiency. For instance, when the wind speed falls below a certain threshold, wind turbines cannot start, while at excessively high wind speeds, turbines need to be shut down to avoid equipment damage. This instability, which varies with wind speed, makes the prediction and scheduling of wind power generation complex.
The instability of these new energy generation methods not only challenges grid load management but also affects the continuity and predictability of the power supply, which are crucial for maintaining stable operation of the power system. Therefore, addressing the instability issue of new energy generation is key to achieving its wider application and integration into mainstream energy systems.
Current research and applications mostly focus on optimization strategies for single-type energy dispatching. While these strategies have made significant progress in improving the efficiency of specific energy sources and have reached a relatively mature level in terms of stability, they still have limitations in addressing the inherent instability and discontinuity issues of new energy sources. For example, research on solar power generation primarily concentrates on improving the conversion efficiency of photovoltaic cells and reducing costs as well as maximizing sunlight utilization through advanced weather prediction technologies and intelligent tracking systems. Although these technological advancements have improved the economics and efficiency of solar power generation to some extent, making it relatively stable under favorable light conditions, they have not resolved the fundamental problem of solar power generation being limited by lighting conditions and cannot ensure stable power generation when light is insufficient. In the wind energy field, research similarly focuses on designing more efficient turbines and optimizing wind farm layouts to improve wind energy capture efficiency [12]. These technological improvements have enhanced the output performance of wind power generation and enabled relatively stable operation within a certain wind speed range. However, the unpredictability of wind speeds and equipment safety issues under extreme weather conditions remain major challenges for its stable operation. Although single-resource optimization methods have achieved significant results in stability and efficiency, this approach overlooks the potential complementarity between different new energy sources. For instance, in many regions, solar and wind energy exhibit complementary periodicity—sunny, windless days are suitable for solar power generation, while cloudy days or nights may have stronger winds. However, current technologies and strategies have not fully utilized this complementarity, resulting in failure to achieve optimal resource allocation and comprehensive utilization.
In this context, demand-side management strategies are particularly crucial. To more effectively address the challenges of new energy, it is necessary to conduct fine-grained classification of the demand side based on the energy needs and consumption patterns of different users. Through the precise identification and classification of various user demands, supply strategies for different energy sources can be better matched, thereby optimizing energy use efficiency and overall system stability. For example, large industrial users and residential household users have significant differences in the stability and elasticity of energy demand, thus requiring different dispatching strategies. By implementing targeted demand response measures and intelligent dispatching systems, not only can the flexibility of energy utilization be improved, but also the risks and costs of system operation can be reduced while ensuring stable supply. The importance of this approach lies in its comprehensive consideration of the characteristics of new energy sources and specific demand-side needs, which is key to achieving an efficient and sustainable energy system. The adoption of the overlapping alliance mechanism in heterogeneous energy networks enhances the efficiency of resource allocation through the following three approaches: (1) Resource reuse: Solar/wind power stations can simultaneously participate in multiple alliances to serve complementary demands (such as continuous industrial loads and intermittent residential loads), and the utilization rate is improved compared with the non-overlapping alliance model (see Section 4). (2) Risk sharing: The geographical dispersion of alliance members effectively mitigated local power generation fluctuations, and the model can effectively reduce output variance through cross-regional alliances. (3) Adaptive reconfiguration: Based on the BMBT ranking mechanism, it can dynamically respond to changes in requirements and still achieve an excellent requirement satisfaction rate even in extreme weather events.
Therefore, considering the limitations of existing technologies in addressing the inherent instability and discontinuity of new energy sources, optimizing the coordination between various new energy sources and heterogeneous load demands has become a significant challenge in achieving a more stable and reliable integrated power dispatch system. To address this issue, this paper proposes an overlapping coalition game mechanism capable of achieving complementarity among multiple types of new energy sources. This mechanism fully considers the types of power resources possessed by new-energy power stations and the types of resources required by loads, identifying and utilizing the temporal and efficiency complementarities of various energy types such as the joint dispatching of solar, wind, hydro, and geothermal energy. Through resource integration and cooperative game strategies, it achieves complementary advantages between different energy sources to improve the stability and efficiency of the entire dispatch system. By implementing the overlapping coalition game mechanism, new-energy power stations can more effectively manage and utilize their power resources to meet different types of load-side demands and ensure the stable satisfaction of load demands under various environmental conditions, not only improving power dispatching efficiency but also enhancing the entire power system’s resilience to uncertain factors. However, in real-time or large-scale systems, the proposed model approach may be too slow and unable to respond dynamically to changes.
The main contribution of this paper, compared with existing new-energy power dispatch allocation methods, is the proposed distributed overlapping coalition game that enables new-energy power stations to make more flexible resource allocation decisions based on the types of power resources they hold and on load demands, thereby significantly improving load utility and stability.
The paper is structured into five sections, with the structure and content arrangement of each section as follows: Section 1, the introduction, presents the research background, current status, research methods and objectives of new energy grid dispatch, and reviews and comments on existing related research. Section 2 reviews research related to the stability of new-energy power dispatch. Section 3 presents system modeling, process, and optimization issues. An overlapping alliance of power stations to meet load demand is formed, and the questions raised are formulated as an OCF game. Algorithm design and implementation of a method for the formation of overlapping alliances is designed for the tabu search algorithm with preference modification and illustrated by pseudocode and a flow diagram. Section 4, Experiments and Performance Analysis, compares it with mainstream algorithms to verify the effectiveness of the proposed model and algorithm, followed by result analysis. Section 5 concludes the paper by summarizing the research findings.

2. Related Research

Traditional research on new-energy power station resource optimization tends to focus on optimization strategies for single resource types, such as maximizing utilization and stability studies for solar or wind energy. These studies often use the output and efficiency of a single resource as the optimization objective. Wu et al. [13] proposed a microgrid peak shaving technique for solar power generation fluctuations. By establishing a quantitative model of solar power output fluctuations and using an improved particle swarm optimization algorithm to optimize load allocation, they aimed to minimize load variance and operational costs. Yi et al. [14] explored the stability characteristics of wind power systems when connected to the grid by establishing corresponding simulation models. Based on this and combining the actual situation of a wind farm, they constructed a doubly-fed wind turbine grid-connected model using Simulink software. They conducted grid-connected stability simulations at different wind speeds under both voltage control and reactive power control modes, deriving the corresponding technical characteristics. The results showed that the terminal voltage, terminal current, active power, reactive power, and motor speed of wind turbines are closely related to wind speed changes, with all indicators able to reach a new stable state after fluctuations. Li et al. [15] comparatively analyzed the principles of different geothermal power generation technologies, including geothermal steam, geothermal water, hot dry rock, and magma, and explored the possibility of combining geothermal with other renewable energy sources for power generation. Xu [16] proposed a global control method for solar power generation stability based on active fault-tolerant sliding mode prediction. Using a gray prediction model to forecast faults in solar power generation systems, they established an active fault-tolerant sliding mode controller to achieve global control of the solar power system, thereby improving its stability. To address the economic emission dispatch problem caused by wind power generation, Guesmi [17] proposed an approximate method to handle the stochastic characteristics of wind energy, introducing a chaotic sine-cosine algorithm to optimize generation costs and emissions.
Past research has largely focused on optimizing single resources, overlooking the interactions between resources and their combined effects. With the continuous development of new energy technologies, multi-resource comprehensive optimization methods have begun to gain attention. MAALI [18] conducted an energy analysis on a solar and geothermal jointly driven organic Rankine cycle power plant, optimizing system stability and losses using polynomial regression analysis. Chen et al. [19] proposed a novel wind–solar joint energy storage power generation system combining wind-powered compressed-air energy storage technology with solar thermal storage technology, not only improving the efficiency of the combined cycle system but also providing a stable power supply. Cheng, LF et al. [20] adopted the principles of dynamic evolutionary game theory to analyze various strategic behaviors in the electricity market and proposed a novel game theory approach—specifically, the integration of evolutionary game theory (EGT), Stackelberg game, and Bayesian game—with deep reinforcement learning (DRL), which provided the authors with many ideas. Li [21] proposed a short-term optimal dispatch model for wind–solar–storage joint power generation systems in areas with high renewable energy penetration. After comprehensively considering battery life, energy storage unit, and load characteristics, a hybrid energy storage operation strategy was developed. An improved particle swarm optimization algorithm was used to solve dispatch schemes under different objectives and operation strategies. The results showed that the proposed model could ensure stable operation of the joint system, while the operation strategy effectively reduced battery life loss while lowering total system generation costs. Lu, W. [22] proposed a fully distributed OPF algorithm for multi-region interconnected power systems based on a distributed interior point method. This decentralized algorithm reflects the advantages of interconnection between various systems.
Combined with the current overlapping coalition-related algorithms, some algorithms are listed in Table 1 below. After research and discussion, a relatively low-complexity preference gravity-guided tabu search (PGG-TS) distributed overlapping coalition can be applied to the game optimization between renewable energy power generation.
Although existing studies have proposed various stability optimization strategies, these strategies often lack consideration of the diversity and classified management of new-energy power generation resources. This study aims to explore a new stability optimization model, the Distributed Overlapping Coalition Formation (DOCF) model. This model fully considers the types of power resources in new-energy power stations, identifies and utilizes the temporal and efficiency complementarities of various energy types, and achieves complementary advantages between different new energy sources through resource integration and cooperative game strategies to improve the stability of the entire power generation system. While ensuring stability, a tabu search algorithm is used to seek the optimal resource allocation strategy. Through case analysis, the effectiveness and practicality of the proposed model and algorithm are verified.

3. Overlapping Coalition Formation Game Design

This section is divided into three parts: system model and problem formation, an overlapping alliance game in which power stations jointly meet load demand, and overlapping alliance formation guided by tabu search algorithm. The overall context is shown in Figure 1 below.

3.1. System Model and Problem Formulation

This section details the network system model, consisting of new-energy plants and loads, and the challenges faced by this model. Firstly, how the power station network can meet the power resource demand of various loads is described, and the load demand and power resource are classified. Subsequently, the overlapping alliance model is introduced, and how new-energy power stations can meet the load demand by partially allocating power resources so as to form multiple overlapping alliance structures is described. In addition, this paper also designs a load utility function, analyzes the heterogeneity of the load and its tolerance to the quality of demand completion, and proposes power resource regulation targets mainly based on demand completion and line loss. Finally, a formal model of the problem is constructed, and how to stably optimize the resource allocation in the distributed multi-agent decision-making process to maximize the load demand is discussed.
Consider a network composed of multiple new-energy power stations that needs to meet the power resource demands of M loads. The sets of new-energy power stations and loads are represented as N = { 1 , , n , , N } and M = { 1 , , m , , M } separately. Different loads have various types of power demands. The distribution of power stations and loads is shown in Figure 2, where PS denotes a renewable energy power station containing multiple energy types, Load represents an electricity load with multiple types of power demands, and each number indicates a different type of power resource, and continuous and intermittent resources are distinguished by colors, where white represents continuous power resources and colors represent different types of intermittent power resources It can be observed that there are differences in the energy types possessed by different power stations as well as variations in the power demands of different loads. This cross-type power station–load distribution structure provides favorable conditions for subsequent power stations to form overlapping coalitions through resource allocation and collaboratively meet load demands.

3.1.1. Resource and Demand Classification

Demand Classification
Suppose there are n types of demand, and the set of load demand types can be expressed as T = { T 1 , , T z s , , T z i , T Z } , where z s and z i represent continuous and intermittent power demands, respectively. Sub-demands are classified into two categories: One is continuous demand, corresponding to geothermal power generation, hydropower generation, and biomass power generation methods. The other is intermittent demand, corresponding to wind power generation and solar power generation.
Power Resource Classification
The power resources required by load m are represented as L = { l m 1 , , l m z s , , I m z i , I m Z } . Here, l m z s and I m z i represent the continuous and intermittent power resources needed by load m, respectively. We broadly classify power resources into two categories: continuous and intermittent. B n = { b n 1 , , b n z s , , μ n z i , μ n Z } represents the available resource quantity of the nth new-energy power station. Among these, b n z s and μ n z i represent the allocatable quantities of continuous and intermittent power resources of the nth new-energy power station, respectively.

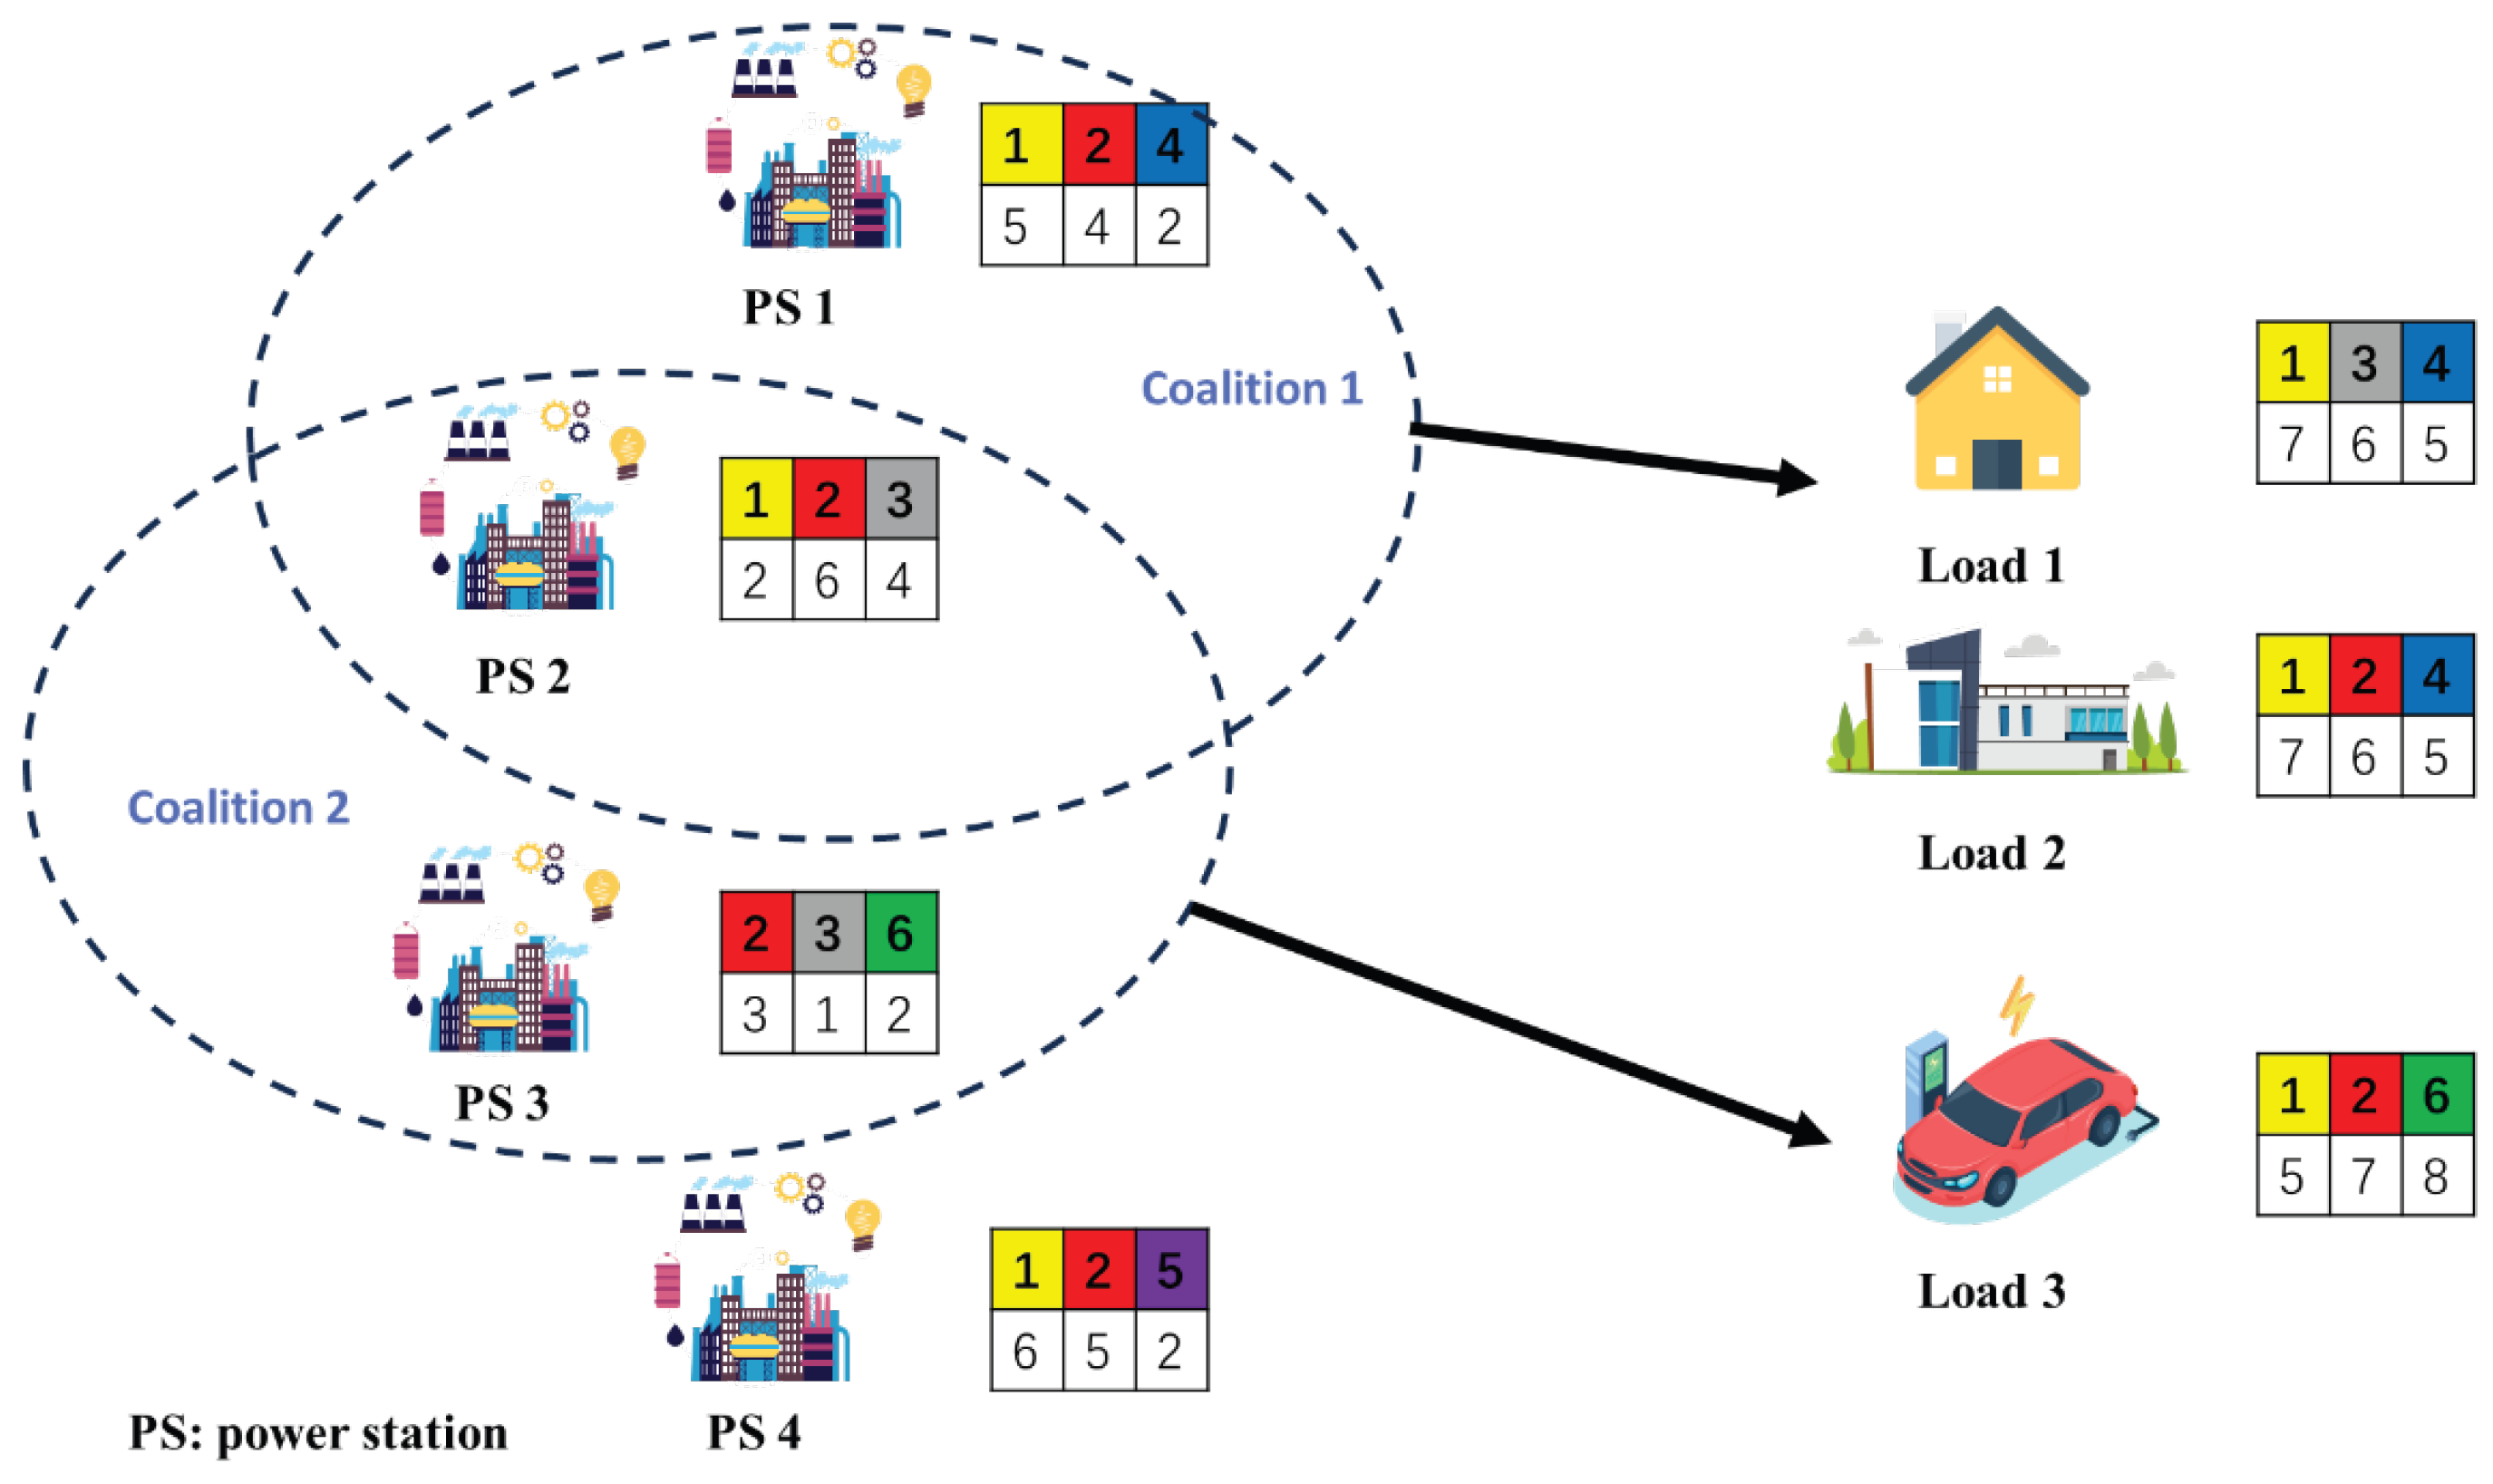
3.1.2. Overlapping Coalition Model

Due to limited and diverse power resources, a single power station cannot adequately meet load demands. Therefore, new-energy power stations form coalitions by partially allocating power resources to collaboratively satisfy load demands. Each new-energy power station can allocate power to different coalitions, facilitating the formation of overlapping coalition structures. This is shown in Figure 2. The resource allocation vector of each power station at load m is represented as a m = { A m 1 , , A m n , , A m N } , where A m n represents the resource quantity allocated by power station n to load m and can be further expressed as follows:
A m n = { τ n , m 1 , , τ n , m z s , , ε n , m z i , , ε n , m Z }
Here, τ n , m z s represents the quantity of the z s type of power resource allocated by new-energy power station n to load m, and ε n , q z i is the quantity of the z i type of power resource allocated by new-energy power station n to load m.
Furthermore,
Mem ( a m ) = { n N | A m n }
Represents the members in the coalition set of new-energy power stations allocating power to load m.
As shown in Figure 3, under the cross-type power station–load distribution of resources and demands, all renewable energy power stations dynamically form coalitions based on the matching degree between their own resources and each load’s required power resource types. For example, PS1 and PS2 jointly establish Coalition 1 for power resource allocation.
Furthermore, the figure shows that PS2 simultaneously serves as a member of both Coalition 1 and Coalition 2, demonstrating the overlapping coalition feature of this study. Subsequent experimental results indicate that, compared with non-overlapping coalitions, the overlapping renewable-energy power station coalitions can better utilize the diverse power resources owned by each station. This approach not only collaboratively satisfies load demands but also improves the overall network utility.

3.1.3. Load Utility Function

Loads exhibit heterogeneity, i.e., different resource demands and priorities, resulting in varying tolerance levels for demand completion quality among different loads. Therefore, this study designs a sigmoid function U m ( A m ) to measure the demand completion quality for load m. Specifically, the utility of demand completion quality for load m can be represented as follows:
U m ( A m ) = 1 1 + exp β m ( C m ( A m ) C r e q + w / β m )
where C r e q represents the expected demand completion quality for load m, and β m is the priority of load m. A smaller β m indicates a lower slope of the sigmoid curve, which indicates that the load does not have an urgent need for power resources; otherwise, it represents an urgent demand for power resources. C m ( A m ) is the actual finished mass of the load m requirement. The objective of regulating power resources is to promptly and effectively meet load demands. Therefore, C m ( A m ) is designed to include the following two performance indicators: (1) demand completion degree, and (2) line losses, which can be expressed as
C m ( A m ) = D + ω 1 r ( A m ) ω 2 P l o s s
where D is a constant to ensure C m > 0 , ω 1 , ω 2 is a weight coefficient used to adjust the relative impact of demand completion degree and line losses on utility, and r ( A m ) is the demand completion degree of load m. The design of the first performance indicator encourages coalition members to meet the power resource demands of loads as much as possible, while the second performance indicator considers power losses during the allocation process. The specific definitions of the performance indicators are as follows:
(1)
Demand Completion Degree:
In the process of power allocation by new-energy power stations, the quantity and quality of completion of sub-demand types will be considered. The degree of demand completion studied represents the ratio of the actual resource allocation to the resource requirement for demand m. When the total power resources allocated by the power station coalition exceed the load demand, the demand completion degree will reach 100%; otherwise, it will be less than 100%. The average demand completion r ( A m ) of load m is expressed as
r ( A m ) = z s T z s λ m z s l m z s + z i T z i σ m z i I m z i | L m | , l m z s , I m z i 0
where λ m z s l m z s and σ m z i I m z i represent the ratio of continuous (intermittent) power actually allocated to load m divided by the continuous (intermittent) power needed by load m, respectively, λ m z s = n M e m ( A m ) τ n , m z s represents the total amount of the z s type of continuous power resource allocated by all power stations to load m, and λ m z s = n M e m ( A m ) τ n , m z s represents the total amount of the z i type of intermittent power resource allocated by all power stations to load m.
(2)
Line Losses:
Line losses are power losses that occur during the transmission process in the power system, typically arising from line resistance, inductance, and reactive power consumption of various electrical equipment in the system. This loss parameter is crucial for ensuring effective operation of the power system and optimizing system design. In this paper, the Kronecker loss formula has been improved to some extent, treating each new-energy power station and load as a node. The final line loss can be represented as follows:
P l o s s = i = 1 k j = 1 k G i j ( V i V j ) 2
where G i j is the real part of the admittance matrix between node i and node j , k is the total number of nodes in the system, and V i and V j represent the voltages of new-energy power station nodes and load nodes, respectively.
Due to the diversity and scattered distribution of load demand types, new-energy power stations with different power resources build multiple coalitions to complete power allocation. A distributed coalition formation scheme has been designed. Specifically, the new-energy power station that detects a new demand acts as the coalition leader for transmitting demand information and forming the coalition. To ensure only one leader in the coalition, a token mechanism used by Qi in [27] is employed, where new-energy power stations with strong decision-making capabilities are assigned a larger token number, and the power station with the largest token number in the alliance becomes the alliance leader. The process of implementing the distributed coalition formation is as follows: The flow chart is shown in Figure 4 below.
Phase 1 (Demand Detection): The power station that detects new demand acts as a leader, gathering demand details and forming alliances.
Phase 2 (Coalition-Building Request): Lead the new power station broadcast consortium to build the message.
Phase 3 (Feedback on Coalition Request): Other new-energy power stations respond with the resources they can provide.
Phase 4 (Coalition-Formation Process): During the formation process, the new-energy power stations decide the amount of resources allocated to each consortium based on the order of decision proposed in this paper.
Phase 5 (Resource Allocation Result Notification and Final Coalition Formation): After forming a stable coalition structure, the leader power station notifies the selected other power stations of the resource allocation results.

3.1.4. Problem Formulation

The proposed scheme for new-energy power stations to collaboratively meet load demand can be regarded as a typical distributed multi-agent decision-making process. New-energy power stations make decisions through information exchange and execute actions based on utility evaluation to achieve the optimal solution. In the rules of the overlapping alliance formation game, participants invest part of their resources to form an alliance and gain utility from joining the alliance. It is worth noting that participants may allocate power resources to different alliances due to the power load situation, thereby promoting the formation of an overlapping alliance structure. Overlapping alliances form a game with each other, and the overlapping alliance formation game is used to determine how the new-energy power stations collaborate to meet load demand. To maximize the utility of satisfying load demands, the optimization objective is to form the optimal resource allocation overlapping coalition structure S C ( * ) = { A 1 * , , A m * , , A M * } , expressed as follows:
( OP ) :   S C ( * ) = arg max m M U m ( A m ) ,
s . t . m M τ n , m z s b n z s , n N , m M ,
m M ε n , m z i μ n z i , n N , m M ,
P i ¯ P i P i ¯ , i N ,
i N ( P i ¯ P i ) P f ,
New-energy power stations generally need to consider resource consumption constraints, power generation capacity constraints, and safety constraints. For resource consumption constraints, Equations (8) and (9) ensure that the resources invested by new-energy power stations do not exceed their remaining resources. For power generation capacity constraints, Equation (10) constrains the maximum and minimum generation levels of new-energy power stations, where P i represents the active power output of the new-energy power station. For safety constraints, Equation (11) constrains the operational power of new-energy power stations in the grid to ensure sufficient reserve capacity for emergency response control, where P f represents the system’s safety reserve capacity. Due to the combinatorial nature of the coalition-formation problem, obtaining the optimal coalition structure solution is evidently an NP-hard problem. Therefore, a relatively low-complexity DOCF algorithm is designed, which can be used to achieve a near-optimal solution.
A bilateral mutually beneficial transfer (BMBT) order is proposed. Compared with the Pareto order and selfish order, which are too restrictive and focus only on individual utility, the BMBT order focuses more on the total utility of the relevant alliance. This order encourages cooperation with other power stations in the same alliance. In order to avoid falling into a poor local optimal solution, a bilateral mutually beneficial transfer (BMBT) order is proposed to evaluate the preferred alliance structure of power stations.

3.2. Overlapping Coalition Game for Power Stations Jointly Meeting Load Demands

This section explores how to design fair, robust, and efficient alliance-building strategies through the overlapping alliance game model to jointly meet load demand and achieve the optimal solution. First, the basic structure and definition of the OCF game model are introduced, and how new-energy power stations form overlapping alliance structures based on load demand during resource allocation is explained. Subsequently, the key concepts of the game model are described in detail, including overlapping alliance structure, preference relations, exchange operations, and bilateral mutual benefit transfer (BMBT) order. These concepts together constitute the OCF game model, which guides resource allocation through preference order, thereby optimizing alliance utility. Finally, the convergence of the alliance structure is discussed, explaining how different preference orders affect the final alliance formation.

Game Model

The collaboration mode based on the OCF game is modeled as G = { N , U m , S C , X } , where U m is the utility function of task coalition m , N is the set of new-energy power stations, S C is the overlapping coalition structure, and X = { x 1 , , x n , , x N } is the resource decision vector of new-energy power stations, and where r = (r_1, r_2, …, X n = { A 1 n , , A m n , , A M n } . In order to continue studying the OCF game model, make the following definitions:
(1)
Overlapping alliance structure: Determine the resource allocation vector of the current new-energy power station. The overlapping alliance structure is defined as
S C = { A 1 , , A m , , A M } , Mem ( A m ) N ,
where A m = { A m 1 , , A m n , , A m N } . Additionally, each new-energy power station has a share of utility in the coalition, represented as
u n = | A m n | n Mem ( A m n ) | A m n | U m ( A m )
According to the utility division rule in the bilateral mutually beneficial transfer (BMBT) order in Equation (3), the model will support new-energy power plants to allocate more power resources to alliances with greater utility.
(2)
Preference Relation [28]: For any new-energy power station, S C Q is preferred to S C p , denoted as S C Q n S C p . This means that new-energy power plants are more inclined to allocate power resources in the form of an alliance structure S C Q .
(3)
Exchange Operation: An exchange operation is defined as the transfer of a portion of power resources between coalitions A i p and A j p , resulting in the formation of a new coalition S C Q = S C P \ { A i p , A j p } { A i q , A j q } , where A i q = A i p \ { δ z s } , A j q = A j p { δ z s } .
The convergence of coalition structures is determined by the preference order, with different preference orders leading to convergence to different coalition structures.
(4)
Bilateral Mutually Beneficial Transfer (BMBT) Order: For any new-energy power station n and two alliance structures S C Q and S C P generated by an exchange operation the BMBT order is defined as follows:
S C Q n S C P u n ( S C Q ) + g Mem ( A j ) \ { n } [ u g ( S C Q ) u g ( S C P ) ] + o Mem ( A ( n ) ) \ { n } u o ( S C Q ) > u n ( S C P ) + h Mem ( A i ) \ { n } [ u h ( S C P ) u h ( S C Q ) ] + o Mem ( A ( n ) ) \ { n } u o ( S C P )
where A ( n ) = { A n S C | A m n , m M } is the set of other coalitions in which new-energy power station n participates in power allocation.
According to the BMBT order, each new-energy power station will give more consideration to cooperation with other new-energy power stations in the same alliance. Specifically, changes in the power distribution of one power station may lead to structural changes in other, related coalitions. Each power station will be more likely to perform exchange operations, thus providing more opportunities to increase the utility of the aforementioned changed coalitions.

3.3. Tabu Search Algorithm Guided Overlapping Coalition Formation

This section proposes a preference gravity-guided tabu search (PGG-TS) algorithm for optimizing the formation of overlapping coalitions in resource scheduling. First, a full-process task-driven resource allocation algorithm based on the DOCF game model is studied, which mainly includes three stages: task information collection, distributed coalition formation, and task execution. Next, we detail the design and implementation of the PGG-TS algorithm, emphasizing the role of tabu search in escaping local optima and accelerating the convergence process. By establishing a tabu list and calculating preference gravity, the algorithm guides the tabu search process, ensuring efficient and stable resource allocation. Finally, we demonstrate the entire coalition-formation process, illustrating how to optimize resource allocation and improve overall network utility through preference gravity calculations and exchange operations.

3.3.1. Full-Process Task-Driven Resource Allocation Involving Overlapping Coalition Formation

The full-process task-driven resource allocation algorithm based on the DOCF game is studied. The full process of DOCF algorithm includes three main stages: task information collection, the distributed coalition formation stage, and task execution.
(1)
Task Information Collection: When a new demand is discovered, new-energy power stations collect task execution information (such as required resources) and notify other power stations.
(2)
Distributed Coalition Formation Stage: All new-energy power stations perform exchange operations based on the proposed PGG-TS algorithm. The specific process is shown in Algorithm 1. Given the current alliance structure, if Equation (14) is satisfied, the exchange operation is performed, and the alliance structure of resource allocation is continuously adjusted until convergence.
(3)
Task Execution: New-energy power stations satisfy load demands based on the stable coalition structure. When new load demands arise, new alliances are formed to carry out new tasks. New-energy power stations refer to the load demand type and the remaining power resources to decide whether to allocate electricity to the new demand.
As shown in Figure 5, when performing resource allocation exchange operations in the proposed distributed coalition-building method, each new-energy power station ultimately needs to communicate only with the coalition leader node to determine whether the proposed preference order is satisfied. If satisfied, the exchange operation is performed; otherwise, no exchange occurs, thus avoiding repetitive information interactions between power station members.

3.3.2. Preference Gravity-Guided Tabu Search Algorithm for Overlapping Coalition Formation

Existing research mostly employs unguided best-response algorithms and other similar random algorithms to form coalitions [29]. In CF game models where power stations decide only whether to leave or join a coalition, the performance of best-response algorithms can be guaranteed due to the small strategy space. However, these algorithms have the disadvantage of slow convergence and are prone to becoming trapped in local optima, making them unsuitable for the DOCF game scenario with a large strategy space.
Algorithm 1: Joint Power Resource Allocation and Preference Gravity-Guided Tabu Search Coalition Formation Algorithm
Initialization: Power resource allocation parameters: N , M , T , B n , L , β m
PGG-TS algorithm input: L t a b u , K max , K len , T ( 0 ) , k = 0, k t a b u = 0
Initialize power grid admittance matrix parameters, calculate the remaining required resource vector for loads L m l e s s ( k = 0 ) = L ( 0 )
Calculate initial preference vector F n ( 0 ) and probability vector P n ( 0 )
Power stations allocate power resources according to probability vector P n ( 0 ) , obtaining initial coalition structure S C ( 0 )
Initialize tabu list as T a b u S C 1 = S C ( 0 )
Repeat
   Step 1: Update preference vector F n ( k ) and probability vector P n ( k ) based on the remaining required resource vector L m l e s s ( k ) . Obtain the current coalition structure S C ( k ) from probability vector P n ( k ) .
   Step 2: Power station n performs exchange operations according to probability vector P n ( k ) , resulting in a new coalition structure S C n e w ( k ) .
   Step 3: Determine if S C n e w ( k ) is in T a b u S C :
(a)
If not, and if S C n e w ( k ) n S C ( k ) , then the power station is more inclined to allocate resources to S C n e w ( k ) .

S C ( k + 1 ) = S C n e w ( k ) ;
T a b u S C m o d k ,   L t a b u + 1 = S C ( k + 1 ) ;
k t a b u = k t a b u + 1 ;
(b)
If it is, S C ( k + 1 ) = S C ( k ) ;
k = k + 1 ;
Until k > K max or k t a b u > K l e n .
Tabu search (TS) is a metaheuristic algorithm designed to escape local optima [30]. The most crucial idea in tabu search is to establish a tabu list to mark some of the local optima that have been searched. In subsequent exploration, tabu search can avoid these previously searched local optima solutions. Therefore, tabu search may explore better solutions, and a preference gravity-guided tabu search (PGG-TS) algorithm for distributed overlapping coalition formation is proposed. Table 2 lists the comparison of tabu search with other metaheuristic algorithms.
Specifically, after each exchange operation, a tabu list is established to record the coalition structure to avoid repeated operations. Furthermore, since the tabu search algorithm is sensitive to the search strategy [32], preference gravity is designed to guide the tabu search process, thereby accelerating convergence and improving performance.
(1)
Tabu List:
Tabu S C = { S C ( k L t a b u ) , , S C k }
The tabu list is established based on resource allocation under historical coalition structures, where L t a b u is the tabu length, representing the existence time of the coalition structure. It should be noted that new-energy power stations cannot repeatedly execute exchange operations for coalition structures already present in the tabu list.
(2)
Preference Gravity Calculation:
In order to make reasonable resource allocation decisions, consider introducing the concept of preference gravity based on the load and the remaining unallocated power resources of new-energy power stations. The power allocation vector of new-energy power station n for the m load is defined as follows:
A m n = { τ n , m 1 ( k ) , , τ n , m z s ( k ) , , ε n , m z i ( k ) , , ε n , m Z ( k ) }
The coalition structure in the k iteration is defined as S C k = { A 1 k , , A m k } , and the remaining resource vector needed by load m is defined as L m l e s s ( k ) = { L e m 1 ( k ) , , L e m z s ( k ) , , Re m z i ( k ) , , Re m Z ( k ) } , where L e m z s ( k ) = max { 0 , l m z s n N τ n , m z s ( k ) } and R e m z i ( k ) = max { 0 , ε m z i n N ε n , m z i ( k ) } . Preference gravity can be understood as the priority between the power resources still required by load m and the power resources that can be allocated by the new-energy power station. The preference gravity of the z type of power resource of new-energy power station n for all loads is defined as
F n z ( k ) = [ f 1 , n z ( k ) , , f m , n z ( k ) ]
where, f m , n z ( k ) = ( β m ) 2 L e m z s ( k ) δ n z b d m , n .
As shown in Figure 6, if the power resources owned by a power station better match the resource needs of a load, the greater the preference attraction between the two, the more willing the power station is to allocate power resources to the load. For example, load m requires two types of power resources, type 1 and type 2. Power station 1 happens to carry both resources, while power station 2 carries only one resource required by task m, namely, type 2 resources. Therefore, the preference attraction between power station 1 and load m is greater than the preference attraction between power station 2 and load m.
(3)
Search Strategy:
Define the probability vector for the z type of power resource provided by new-energy power station n to be allocated to load m:
P n z ( k ) = [ p n , 1 z ( k ) , , p n , m z ( k ) , , p n , M z ( k ) ]
where p n , m z ( k ) = exp [ f m , n z ( k ) T ( k ) ] m M exp [ f m , n z ( k ) T ( k ) ] and T ( k ) serve as balancing factors for exploration and exploitation. The update rule for T ( k ) is designed as: T ( k + 1 ) = T ( k ) + k ( T max T ( k ) ) / K max . It can be observed that as T ( k ) decreases, new-energy power stations tend to explore more, and as T ( k ) increases, they tend to exploit locally to find the optimal solution. This means that new-energy power stations are more willing to explore solutions that have not been tried before in the early stages, and then gradually tend to solutions that can bring greater benefits.
(4)
Coalition-Formation Process:
Selection probabilities are based on preference gravity; new-energy power stations perform defined exchange operations. If the preference order is satisfied, new-energy power stations will conduct power resource exchange operations, thereby improving the total utility of the network. Otherwise, new-energy power stations will maintain the original coalition structure.

4. Experimental Results

To validate the effectiveness of the proposed DOCF scheme and PGG-TS algorithm in hybrid power resource optimization and scheduling, first we compared their performance with the cooperative-rule OCF algorithm, Non-preferred CF algorithm, and exhaustive optimal algorithm in terms of average load utility under different numbers of power stations and loads. In the Non-preferred CF algorithm, all load areas have their own allocation probability vector in the coalition structure, which determines the non-overlapping single coalition structure of the system. The cooperative-rule OCF not only has overlapping relationships between load areas but also complementarity, with the cooperation rule aimed at maximizing the utility of the entire coalition. To make the results more convincing and reduce the impact of changes in the number of transmission lines on the final results, we compared the changes in average load satisfaction among the three algorithms. Furthermore, to illustrate the decision-making role of the BMBT order in selecting preference relations for loads on coalition structures, we compared its effects with two other order selection methods, Pareto order and selfish order, as well as the convergence of the PGG-TS algorithm under these three different preference orders.

4.1. Parameter Settings

In this section, refer to the installed capacity limits for different types of power stations as in [33]. The specific power generation parameters are shown in Figure 7 for four types of power stations: solar-type, wind-type, hydro-type, and thermal-type, set for 24 h/day power generation. Wind and solar power stations can generate only intermittent power resources due to the limitations of geographical location and weather conditions, while hydropower and thermal power stations have more flexible generation conditions and can produce continuous power resources. Additionally, the power generation throughout the day follows people’s daily life patterns, so the simulation data sets three peak generation time periods. The relevant parameters of the power grid lines and the algorithm are shown in Table 3. The parameters for the admittance matrix in the power grid are derived from [27]. The computing equipment used is MATLAB 2024a.

4.2. Performance Evaluation

This paper selected two other benchmark schemes, the cooperative-rule OCF algorithm and Non-preferred CF algorithm, to compare with the proposed PGG-TS DOCF algorithm to verify its advantages.
(1)
Cooperative-rule overlapping coalition formation (OCF) algorithm: Within each cyclic unit time, a certain number of power stations are selected to change their coalition choices until any change in decision by a power station cannot bring about an increase in the total utility of the coalition. At this point, each load area forms a stable overlapping coalition structure.
(2)
Non-preferred coalition formation (CF) algorithm: All power stations do not consider any preference relations and form coalition structures solely based on the probability allocation vector of load areas, thereby allocating power resources.
Figure 8 shows the variation curves of the number of power stations and average load utility. It is easily observable that the PGG-TS-based DOCF scheme achieved significant improvements in utility compared with the cooperative-rule OCF scheme and Non-preferred CF scheme, reaching up to 13.1% and 31.8%, respectively, at their peaks. Simultaneously, the performance of the PGG-TS-based DOCF scheme is closest to the theoretical optimal solution under the exhaustive optimal algorithm, indicating that it is a more promising method for practical applications. Further analysis shows that as the number of power stations increases, the average utility of the load increases, reaching a peak before starting to decline. This trend reflects the negative impact of increased transmission line losses on system utility. As the number of power stations increases, although available power resources increase, the length and complexity of transmission lines also grow, leading to higher line losses, which ultimately affects the utility of the entire system. The experimental results clearly illustrate the importance of algorithm selection in power resource optimization scheduling and point out potential limitations on system efficiency. Furthermore, these results also provide possible directions for improving algorithms and system design to reduce losses and enhance overall utility.
Figure 9 illustrates the relationship between the number of power stations and the average satisfaction of loads. The analysis results show that as the number of power stations increases, the average load satisfaction using the PGG-TS DOCF scheme significantly outperforms the Non-preferred CF scheme, with a final increase in average satisfaction of 40.9%. When the number of power stations is sufficiently large, the exhaustive optimal algorithm (Optimal) provides a theoretical benchmark for utility maximization, with the average load satisfaction reaching the ideal value of 1, implying that power resource demands are fully met. The performance of the PGG-TS DOCF strategy approaches this theoretical optimal value as the number of power stations increases, indicating that the PGG-TS DOCF algorithm demonstrates high effectiveness in resource allocation and exhibits good scalability and adaptability in large-scale power networks. The average load satisfaction rate continues to increase with the increase in the number of power stations. This phenomenon can be attributed to two factors: (1) More power stations mean more abundant power resources, reducing competition among loads and making it more likely for each load to obtain its required power resources. (2) The distribution of power stations may become more reasonable, contributing to reduced power transmission losses and improved reliability of power supply.
Figure 10 shows the convergence performance of the PGG-TS algorithm under different priority orders by setting the number of power stations to n = 4 and the load area to m = 20. These curves represent the average total utility of load areas obtained after nearly 500 independent experiments. As the number of iterations K_max increases, the PGG-TS algorithm using all three preference orders can quickly converge to a stable state. In the early stages of iteration, the algorithms under the three preference orders perform similarly, indicating that the loads’ preferences for coalition structures do not significantly affect the convergence process during the initial optimization. However, in subsequent iterations, although the BMBT sequence converges slightly slower than the selfish and Pareto sequences, it achieves a higher total system utility. This suggests that the BMBT sequence pays more attention to the overall improvement of system utility during the iteration process. Specifically, the selfish sequence may overemphasize the utility improvement of individual loads while neglecting the maximization of total system utility. The Pareto sequence may easily fall into local optima due to its excessive pursuit of fairness, i.e., not harming the utility of any load, and thus fail to reach the global optimal solution. In contrast, the BMBT sequence, despite a slight sacrifice in convergence speed, ultimately achieves a higher total system utility. This result indicates that the BMBT strategy strikes a better balance between iteration speed and utility maximization.
Figure 11 shows the trend of average load utility with respect to the number of power stations under three preference orders. As the number of power stations increases, the average load utility under all three preference orders initially increases and then decreases. This phenomenon indicates that while more power stations indeed bring more power resources, improving the initial average load utility, they also lead to increased transmission line losses, hindering utility growth and eventually causing a decline. This result heuristically suggests that in power system planning, the balance between the number of power stations and transmission losses should be carefully considered. When comparing different preference orders, the BMBT preference order shows significant improvements in average load utility compared with the selfish and Pareto sequences, increasing by 10.2% and 25.3%, respectively. Moreover, the utility curve of the BMBT sequence is closer to the curve of exhaustive optimal utility. These improvements are attributed to the strategic choices in algorithm design for the BMBT preference order: it sacrifices some convergence speed in exchange for higher global optimal load utility. This strategy of BMBT reflects that in resource allocation optimization problems, an appropriate balance between iteration and exploration is more important than merely pursuing rapid convergence.
Figure 12 represents the variation curves of the average load utility and the number of loads. The increase in the number of loads leads to a decrease in the average load utility. Under limited power resources, the challenges of resource allocation intensify as the number of loads increases, resulting in reduced resources for individual loads and consequently affecting the average utility. The DOCF using the PGG-TS algorithm shows improvements in average load utility of 11.7% and 44.1% compared with cooperative-rule OCF and Non-preferred CF, respectively. This significant improvement indicates that PGG-TS DOCF can more effectively distribute limited power resources among loads. Furthermore, we observe that the utility curve of PGG-TS DOCF decreases more slowly compared with Non-preferred CF as the number of loads increases. The reason behind this might be that DOCF focuses on the uniform distribution of power resources, striving to avoid unfairness in resource allocation even as the number of loads increases. In contrast, Non-preferred CF may focus more on the demands of individual or partial loads, leading to a more noticeable decrease in overall utility when the number of loads increases.

5. Conclusions and Future Work

Main Contributions
(1) A relatively low-complexity preference gravity-guided tabu search (PGG-TS) algorithm for distributed overlapping coalition formation is proposed. It is used to optimize the formation of overlapping coalitions in resource scheduling.
(2) Algorithm implementation: Compared with the cooperative-rule DOCF scheme and the non-preferred CF scheme, the proposed PGG-TS algorithm improves the average utility of the load by 13.1% and 31.8%, respectively.
(3) The effect of the PGG-TS algorithm on the selection of preference relations in the bilateral mutually beneficial transfer (BMBT) order is verified. Compared with the effects based on the selfish order and the Pareto sequence order, the BMBT-based PGG-TS algorithm improves the average utility of the load by 10.2% and 25.3%, respectively.
This paper studies the problem of collaborative resource allocation in a demand-driven heterogeneous renewable energy power station network. By adopting the proposed overlapping coalition (DOCF) game, the renewable energy power station can determine the amount of power resources allocated to each load, make full use of the characteristics of complementary resources, and optimize the trade-off between the benefits and power losses of resource allocation while improving system stability. In addition, a bilateral mutually beneficial transfer (BMBT) sequence is proposed to maximize the utility of the alliance. A relatively low-complexity preference gravity-guided tabu search (PGG-TS) algorithm for distributed overlapping alliance formation is innovatively proposed, which can obtain an approximate optimal solution. Simulation results show that while improving system stability, the proposed PGG-TS algorithm improves the average utility of the load by 13.1% and 31.8%, respectively, compared with the cooperative-rule DOCF scheme and the non-preferred CF scheme. Compared with the preference relationship based on selfish and Pareto sequence, the BMBT-based PGG-TS algorithm improves the average utility of the load by 10.2% and 25.3%, respectively. In order to use new energy economically and serve the power grid, overlapping alliances will be combined with various methods in the future. It is conceivable to use multi-agent learning to study the methods of forming overlapping alliances.
Looking forward to the future, overlapping alliances will show slow response speed and inability to respond dynamically under high concurrency and large data volume conditions. Faced with the requirement of real-time transmission of electricity, it is difficult to achieve timely response. This is also one of the defects in the scalability of the algorithm. The author will conduct in-depth research on such issues in the future. As renewable energy power generation is affected by many factors such as season, sunshine, environment, geography, etc., power generation may result in unstable output of renewable energy. How to respond to optimal resource reallocation is worthy of our follow-up research.

Author Contributions

Writing—original draft preparation, Y.Z. and C.Z.; Validation, Y.Z., J.H. and W.L.; Investigation, D.D. and W.L.; Writing—review & editing, C.W. and J.H.; Supervision, W.L. All authors have read and agreed to the published version of the manuscript.

Funding

This research received no external funding.

Data Availability Statement

The original contributions presented in this study are included in the article. Further inquiries can be directed to the corresponding author.

Conflicts of Interest

The authors declare no conflict of interest.

Nomenclature

Variable NameMeaning
N = { 1 , , n , , N } A collection of new-energy power stations
M = { 1 , , m , , M } A collection of loads requiring power resources
T = { T 1 , , T z s , , T z i , T Z } A collection of load demand types
z s Continuous power demand
z i Intermittent power demand
L = { l m 1 , , l m z s , , I m z i , I m Z } Power resources required by load m
l m z s Continuous power resources required by load m
I m z i Intermittent power resources required by load m
B n = { b n 1 , , b n z s , , μ n z i , μ n Z } Available resources of the n new-energy power station
b n z s Available continuous power resources available for allocation by the n new-energy power station
μ n z i The amount of intermittent power resources available for allocation by the n new-energy power station
a m = { A m 1 , , A m n , , A m N } The resource allocation vector for each power station at load m
A m n = { τ n , m 1 , , τ n , m z s , , ε n , m z i , , ε n , m Z } The amount of resources allocated by power station n to load m
τ n , m z s The amount of the z s type of power resources allocated by new-energy power station n to load m
ε n , q z i The amount of the z i type of power resources allocated by new-energy power station n to load q
Mem ( a m ) = { n N | A m n } The members of the renewable energy power station alliance that allocate power to load m
U m ( A m ) = 1 1 + exp β m ( C m ( A m ) C r e q + w / β m ) U m ( A m ) To measure the demand completion quality utility of load m
C r e q Expected demand fulfillment quality of load m
β m Priority of load m
C m ( A m ) Actual demand fulfillment quality of load m
D Ensured C m > 0 constant
ω 1 , ω 2 Weight coefficient
r ( A m ) Degree of demand fulfillment of load m
λ m z s l m z s Continuous power allocated to load m divided by continuous power required by load m
σ m z i I m z i Intermittent power allocated to load m divided by intermittent power required by load m
λ m z s = n M e m ( A m ) τ n , m z s The total amount of the z s continuous power resources allocated to load m by all power stations
σ m z i = n M e m ( A m ) R n , m z i The total amount of the z i intermittent power resources allocated to load m by all power stations
G i j The real part of the admittance matrix between nodes i and j in the admittance matrix
k The total number of nodes in the system
V i , V j V i , V j represent the voltage of the new-energy power station node and the load node, respectively
P i The active output of the new-energy power station
P f System safety reserve capacity
N The set of new-energy power stations
U m The utility function of the task alliance m
S C Overlapping alliance structure
X = { x 1 , , x n , , x N } The resource decision vector of the new-energy power station
L t a b u Tabu length, representing the existence time of the alliance structure
T ( k ) Balance factor of exploration and mining

References

  1. Shi, Z.; Chen, J.; Wang, Y.; Zhao, Y.; Xu, B. Credibility copula-based robust multistage plan for industrial parks under exogenous and endogenous uncertainties. CSEE J. Power Energy Syst. 2025, 11, 987–998. [Google Scholar] [CrossRef]
  2. Feng, J.; Yao, Y.; Liu, Z. Developing an optimal building strategy for electric vehicle charging stations: Automaker role. Environ. Dev. Sustain. 2025, 27, 12091–12151. [Google Scholar] [CrossRef]
  3. Zhang, T.; Zhao, W.; He, Q.; Xu, J. Optimization of Microgrid Dispatching by Integrating Photovoltaic Power Generation Forecast. Sustainability 2025, 17, 648. [Google Scholar] [CrossRef]
  4. Yang, M.; Han, C.; Zhang, W.; Fang, G.; Jia, Y. A short-term power prediction method based on numerical weather prediction correction and the fusion of adaptive spatiotemporal graph feature information for wind farm cluster. Expert Syst. Appl. 2025, 274, 126979. [Google Scholar] [CrossRef]
  5. Yang, M.; Xu, C.; Bai, Y.; Ma, M.; Su, X. Investigating Black-Box Model for Wind Power Forecasting Using Local Interpretable Model-Agnostic Explanations Algorithm. CSEE J. Power Energy Syst. 2025, 11, 227–242. [Google Scholar] [CrossRef]
  6. Zhang, S. Feature-aware task offloading and scheduling mechanism in vehicle edge computing environment. Int. J. Veh. Inf. Commun. Syst. 2024, 1, 10066239. [Google Scholar] [CrossRef]
  7. Wei, M.; Yang, S.; Wu, W.; Sun, B. A multi-objective fuzzy optimization model for multi-type aircraft flight scheduling problem. Transport 2024, 39, 313–322. [Google Scholar] [CrossRef]
  8. Meng, Q.; He, Y.; Gao, Y.; Hussain, S.; Lu, J.; Guerrero, J.M. Bi-Level Four-Stage Optimization Scheduling for Active Distribution Networks with Electric Vehicle Integration using Multi-Mode Dynamic Pricing. Energy 2025, 327, 136316. [Google Scholar] [CrossRef]
  9. Wang, K.; Xue, Y.; Guo, Q.; Shahidehpour, M.; Zhou, Q.; Wang, B.; Sun, H. A Coordinated Reconfiguration Strategy for Multi-Stage Resilience Enhancement in Integrated Power Distribution and Heating Networks. IEEE Trans. Smart Grid 2022, 14, 2709–2722. [Google Scholar] [CrossRef]
  10. Yang, H.; Zhang, C.; Li, J.; Zhu, L.; Zhou, K. A Novel Robust Energy Storage Planning Method for Grids With Wind Power Integration Considering the Impact of Hurricanes. IEEE Trans. Sustain. Energy 2025, 16, 1388–1400. [Google Scholar] [CrossRef]
  11. Wolff, T.; Nieße, A. Dynamic Overlapping Coalition Formation in Electricity Markets: An Extended Formal Model. Energies 2023, 16, 6289. [Google Scholar] [CrossRef]
  12. Ali, S.; Park, H.; Lee, D. Multi-Criteria Optimization of Wind Turbines in an Offshore Wind Farm with Monopile Foundation Considering Structural Integrity and Energy Generation. J. Mar. Sci. Eng. 2024, 12, 2313. [Google Scholar] [CrossRef]
  13. Wu, H.W.; Zhang, L.P.; Zhang, W. A study on peak load regulating methods of high proportion solar energy connected to distribution terminal microgrid. Power Syst. Clean Energy 2023, 39, 122–127. [Google Scholar]
  14. Yi, X.B.; Ji, S.Q.; Dai, S.H. Modeling and grid stability simulation of wind power generation systems. Autom. Appl. 2024, 65, 106–108. [Google Scholar]
  15. Li, K.X.; Zong, M.Z.; Wei, G.S. Overview of geothermal power generation and joint power generation with other new energy sources. Power Gener. Technol. 2020, 41, 69–77. [Google Scholar]
  16. Xu, X.D.; Liao, J. Research on the global control of solar power stability based on active fault tolerant sliding film pre-diction. Adv. Power Syst. Hydroelectr. Eng. 2024, 40, 142–148. [Google Scholar]
  17. Guesmi, T.; Farah, A.; Marouani, I.; Alshammari, B.; Abdallah, H.H. Chaotic sine–cosine algorithm for chance-constrained economic emission dispatch problem including wind energy. IET Renew. Power Gener. 2020, 14, 1808–1821. [Google Scholar] [CrossRef]
  18. Maali, R.; Khir, T.; Arici, M. Energy and exergy optimization of a combined solar/geothermal organic Rankine cycle power plant. J. Central South Univ. 2023, 30, 3601–3616. [Google Scholar] [CrossRef]
  19. Chen, H.; Xue, Z.; Ma, Z. Performance analysis on wind and solar power generation system combined with energy storage system. Therm. Power Gener. 2019, 48, 103–109. [Google Scholar]
  20. Cheng, L.; Huang, P.; Zhang, M.; Yang, R.; Wang, Y. Optimizing Electricity Markets Through Game-Theoretical Methods: Strategic and Policy Implications for Power Purchasing and Generation Enterprises. Mathematics 2025, 13, 373. [Google Scholar] [CrossRef]
  21. Li, Y.; Wang, H.; Zhang, Z.; Li, H.; Wang, X.; Zhang, Q.; Zhou, T.; Zhang, P.; Chang, F. Optimal Scheduling of the Wind-Photovoltaic-Energy Storage Multi-Energy Complementary System Considering Battery Service Life. Energies 2023, 16, 5002. [Google Scholar] [CrossRef]
  22. Lu, W.; Liu, M.; Lin, S.; Li, L. Fully Decentralized Optimal Power Flow of Multi-Area Interconnected Power Systems Based on Distributed Interior Point Method. IEEE Trans. Power Syst. 2017, 33, 901–910. [Google Scholar] [CrossRef]
  23. Yan, F.; Wang, F.; Chu, J.; Xu, Z.; Zhang, L.; Zhou, L. Heterogeneous Multi-agent Overlapping Coalition Formation Method Under Resource Constraints. In Proceedings of the 4th 2024 International Conference on Autonomous Unmanned Systems (4th ICAUS 2024), Shenyang, China, 19–21 September 2024; Lecture Notes in Electrical Engineering. Liu, L., Niu, Y., Fu, W., Qu, Y., Eds.; Springer: Singapore, 2025; Volume 1379. [Google Scholar]
  24. Chen, J.; Wu, Q.; Xu, Y.; Qi, N.; Guan, X.; Zhang, Y.; Xue, Z. Joint Task Assignment and Spectrum Allocation in Heterogeneous UAV Communication Networks: A Coalition Formation Game-Theoretic Approach. IEEE Trans. Wirel. Commun. 2020, 20, 440–452. [Google Scholar] [CrossRef]
  25. Zhang, G.; Song, X.; Su, Z.; Yue, F. Computational complexity of task-oriented overlapping coalition structure generation. Control Theory Appl. 2024, 41, 163–171. [Google Scholar]
  26. Huang, Y.; Qi, N.; Huang, Z.; Jia, L.; Wu, Q.; Yao, R.; Wang, W. Connectivity Guarantee Within UAV Cluster: A Graph Coalition Formation Game Approach. IEEE Open J. Commun. Soc. 2022, 4, 79–90. [Google Scholar] [CrossRef]
  27. Qi, N.; Huang, Z.; Zhou, F.; Shi, Q.; Wu, Q.; Xiao, M. A Task-driven sequential overlapping coalition formation game for resource allocation in heterogeneous UAV networks. IEEE Trans. Mob. Comput. 2022, 22, 4439–4455. [Google Scholar] [CrossRef]
  28. Chen, J.; Chen, P.; Wu, Q.; Xu, Y.; Qi, N.; Fang, T. A game-theoretic perspective on resource management for large-scale UAV communication networks. China Commun. 2021, 18, 70–87. [Google Scholar] [CrossRef]
  29. Luan, H.; Xu, Y.; Liu, D.; Du, Z.; Qian, H.; Liu, X.; Tong, X. Energy efficient task cooperation for multi-UAV networks: A coalition formation game approach. IEEE Access 2020, 8, 149372–149384. [Google Scholar] [CrossRef]
  30. Yang, J.; Yang, S.; Ni, P. A Vector Tabu Search Algorithm With Enhanced Searching Ability for Pareto Solutions and Its Application to Multiobjective Optimizations. IEEE Trans. Magn. 2015, 52, 2483521. [Google Scholar] [CrossRef]
  31. Dokeroglu, T.; Sevinc, E.; Kucukyilmaz, T.; Cosar, A. A survey on new generation metaheuristic algorithms. Comput. Ind. Eng. 2019, 137, 106040. [Google Scholar] [CrossRef]
  32. Ezugwu, A.E.; Shukla, A.K.; Nath, R.; Akinyelu, A.A.; Agushaka, J.O.; Chiroma, H.; Muhuri, P.K. Metaheuristics: A comprehensive overview and classification along with bibliometric analysis. Artif. Intell. Rev. 2021, 54, 4237–4316. [Google Scholar] [CrossRef]
  33. Basu, M. Group search optimization for combined heat and power economic dispatch. Int. J. Electr. Power Energy Syst. 2016, 78, 138–147. [Google Scholar] [CrossRef]
Figure 1. Overlapping coalition formation game design.
Mathematics 13 02091 g001
Figure 2. Classification of new-energy power stations and load resources.
Mathematics 13 02091 g002
Figure 3. Overlapping coalition structure. The heterogeneity of load demand directly shapes the overlapping coalition structure through two mechanisms: (1) Temporal Complementarity: Intermittent loads (e.g., EV charging) preferentially form coalitions with storage-equipped solar/wind stations, creating time-shifted resource pools. (2) Spatial Matching: Geographically concentrated continuous demands (e.g., factories) trigger coalitions dominated by hydro/thermal stations, while distributed intermittent demands favor wind–solar hybrid alliances.
Mathematics 13 02091 g003
Figure 4. The process of forming and implementing distributed alliances.
Mathematics 13 02091 g004
Figure 5. Illustration of the overlapping coalition structure generation process.
Mathematics 13 02091 g005
Figure 6. Preference gravity between loads and new-energy power stations.
Mathematics 13 02091 g006
Figure 7. The 24-h/day power generation capacity of four different types of power stations.
Mathematics 13 02091 g007
Figure 8. Curve of average utility variation with the number of power stations under different solutions.
Mathematics 13 02091 g008
Figure 9. The curve of average satisfaction with the number of power stations under different solutions.
Mathematics 13 02091 g009
Figure 10. Convergence of PGG-TS DOCF solution under three preference orders. The numbers of power stations and load areas are set to Q = 4 and M = 20, respectively.
Mathematics 13 02091 g010
Figure 11. Variation curves of average utility with number of power stations under three preference orders.
Mathematics 13 02091 g011
Figure 12. Variation curves of average utility with the number of loads under different solutions.
Mathematics 13 02091 g012
Table 1. Comparison of related algorithms.
Name Advantages Disadvantages
1A method for forming overlapping coalitions formation based on negotiation mechanisms [23]Resolves resource conflicts between agents in different alliances by sequentially assigning tasks.It is not possible to obtain the optimal solution quickly.
2A joint bandwidth allocation and coalition formation (JBACF) algorithm [24]The coalition expected altruistic order was superior to traditional Pareto order and selfish order.The algorithm separates the coupling relationship between subcarrier allocation and alliance formation.
3A task-oriented optimal overlapping alliance structure generation problem model [25]The time complexity of searching for the optimal overlapping coalition structure is exponentially related to the number of agents and tasks.It takes up huge memory and computing overhead, which is difficult to meet in practical applications.
4A graph coalition formation game algorithm based on the shortest path tree (SPT-GCF) [26]Achieved fast alliance partitioning of clusters.Wireless communication environment is prone to interference.
5A relatively low-complexity preference gravity-guided tabu search (PGG-TS) algorithm for distributed overlapping coalition Obtains the best solution as soon as possible, improves performance.Under large-scale concurrency, the real-time response speed is slow.
Table 2. Comparison of tabu search with other metaheuristic algorithms.
AcronymParametersStages Involving Exploration and ExploitationThe Availability of HybridizationThe Availability of Local Search Mechanisms
BFO (Bacterial Foraging) [31]highreplication, chemotaxis, dispersal, swarming×
CSA (Cuckoo Search Algorithm)highflight, nest selection, removal, and breeding×
HS (Harmony Search)highpitch adjustment, improvisation, randomization×
WOA (Whale Optimization Algorithm)highencircling, prey search, maneuvering
TS (Tabu Search)highEncoding, constraints, neighborhoods, blending
Table 3. Simulation parameter settings.
ParameterValue
Continuity resource requirements l m z 10~20 MWh
Intermittent resource requirements I m z 0~15 MWh
Power station installed capacity P n z 50~250 MW
Continuous resource generation b n z 60~175 MWh
Intermittent resource generation μ n z 20~50 MWh
Satisfaction factor ω 1 0.1~0.6
Line loss factor ω 2 0.005~0.01
Power station voltage V s 12~30 kV
Load area voltage V l 220~240 V
Boltzmann coefficient T max 5~10
Completion quality constant D0.2~1
Tabu list length20~50
Disclaimer/Publisher’s Note: The statements, opinions and data contained in all publications are solely those of the individual author(s) and contributor(s) and not of MDPI and/or the editor(s). MDPI and/or the editor(s) disclaim responsibility for any injury to people or property resulting from any ideas, methods, instructions or products referred to in the content.

