4.1. Systemic Risk Measurement
This study first measures the systemic financial risk index, ∆CoVaR, for each industry based on the DCC-GJR-GARCH model.
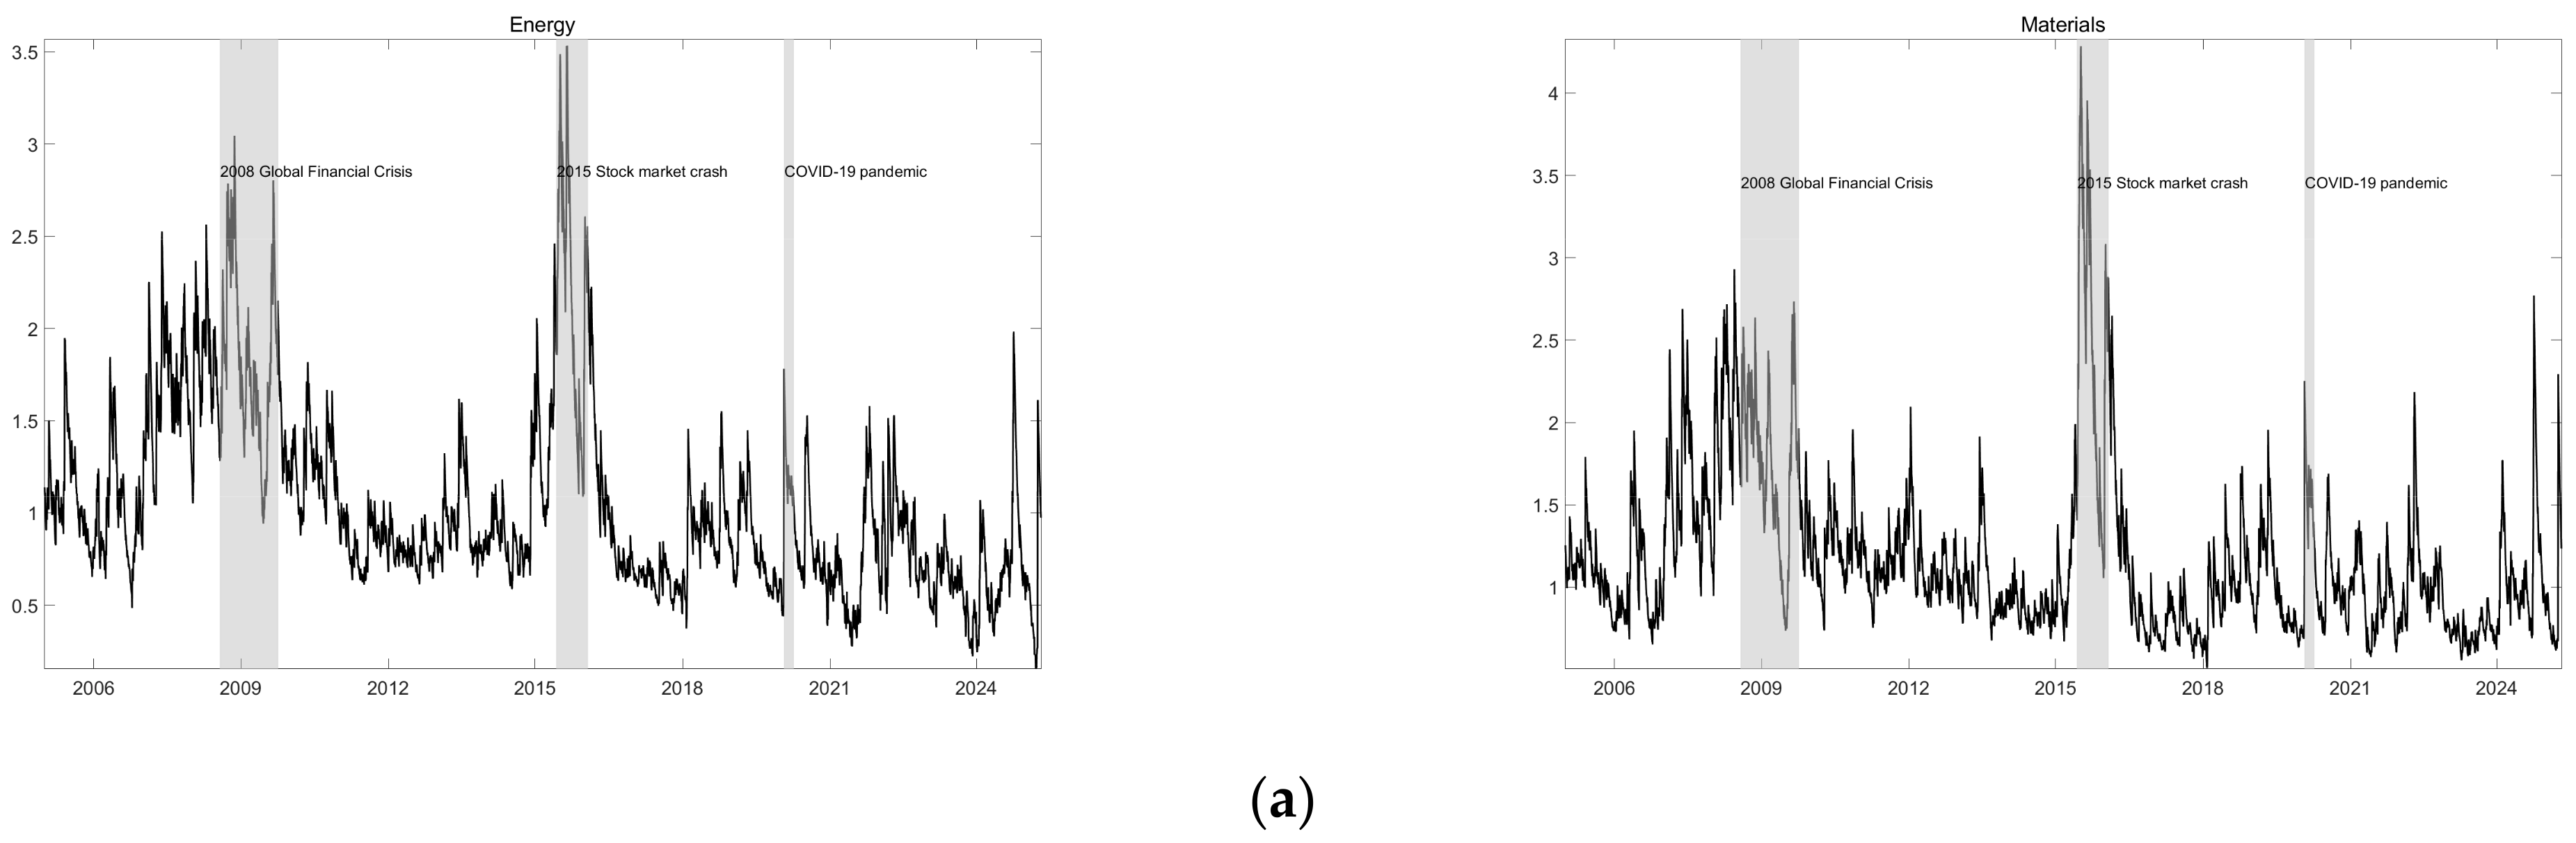
Figure 1a,b illustrate the risk fluctuations of the 11 sampled industries during the observation period. As illustrated in
Figure 1, the horizontal axis represents time, while the vertical axis plots the ∆CoVaR values for each industry. The gray-shaded areas highlight three major crises in the Chinese stock market: the 2008 Global Financial Crisis, the 2015 Chinese stock market crash, and the COVID-19 pandemic. As clearly shown in
Figure 1, extreme risks demonstrate distinct volatility clustering, with systemic risk peaking during both the 2008 financial crisis and the 2015 market crash, marking the two highest risk levels in the sample period. These crises inflicted severe shocks on the stock market, triggering massive capital erosion and exerting substantial adverse effects on the economy.
A closer examination reveals that all industries exhibit dynamic, time-varying risk patterns. Cross-industry comparisons indicate that systemic financial risks surged around both the 2008 and 2015 crises, though the magnitude of impact varied across sectors. The 2008 crisis, sparked by the U.S. subprime mortgage collapse and subsequent investor panic, escalated into a global liquidity crunch. Given the deep interlinkages among industries and financial markets, the crisis rippled through all sectors, driving risk levels to unprecedented highs. Notably, liquidity shocks directly destabilized industry stock markets, as evaporating investor confidence and potential bank runs precipitated a sharp spike in systemic risk.
In contrast, the 2015 crash catapulted industry risks from moderate levels to record peaks, marked by an abrupt, explosive surge. Unlike other crises, risk transmission during this episode was exceptionally rapid, amplified by the prevailing one-sided market sentiment, which accelerated risk accumulation and sudden unwinding. Following the 2020 COVID-19 outbreak, systemic risks rose moderately across industries, yet the impact paled in comparison to the 2008 and 2015 crises. This underscores that catastrophic events—financial crises, market collapses, and pandemics—consistently amplify financial risks throughout the industrial landscape.
To provide a comprehensive analysis of industry-specific risk exposures,
Table 2 presents the mean values and standard deviations of ΔCoVaR across four distinct market regimes: the full sample period, the 2008 Global Financial Crisis, the 2015 stock market crash, and the COVID-19 pandemic. The Materials sector (highest full-sample mean at 1.1804) and Information Technology (1.1749) emerge as the most systemically risky industries, while Utilities (0.8850) and Health Care (0.9381) demonstrate the greatest resilience. This ranking holds during normal periods but shifts dramatically under stress. Notably, extreme events significantly amplify risk across all sectors—during the 2008 financial crisis, Real Estate (1.8466), Energy (1.8424), and Financials (1.8396) suffered the most severe contagion, whereas the 2015 stock market crash drove Industrials (2.5909) and Information Technology (2.5815) to record risk levels, nearly doubling their full-sample averages.
These findings demonstrate that both internal and external factors influence the systemic risk of industry markets, with external shocks having a more pronounced and severe impact. The significant influence of extreme events on industry financial risk indices aligns with societal perceptions and macroeconomic data, validating the effectiveness and reliability of the constructed systemic risk indicator in measuring the magnitude and fluctuation of systemic risk within Chinese industry stock markets.
The Granger causality test results in
Table 3 demonstrate a complex network of systemic risk spillovers across Chinese industries. The information technology industry is the main risk transmitter, with a high level of risk output, and there is a relatively obvious one-way transmission phenomenon in consumer staples (12.32 ***). Interestingly, while the Financials sector receives strong risk inflows from Consumer Discretionary (2.98 *), Consumer Staples (2.67 *), Telecommunication Services (5.22 ***) and Real Estate (3.09 **), it simultaneously transmits risks to Energy (3.94 **), Materials (3.12 **) and Industrials (2.87 *), revealing its dual role as both risk recipient and transmitter. The Energy sector shows a distinctive pattern as a net risk absorber, being significantly influenced by Materials (6.25 ***) but exhibiting limited outward spillovers. These findings highlight an asymmetric risk transmission structure where Information Technology serve as primary risk sources, while Energy act as risk sinks, with Financials functioning as a crucial intermediary node in China’s systemic risk network.
4.2. Static Spillover Effects Analysis of the Full Sample
Following Baruník and Křehlík [
5], this paper adopts a 100-day forecast horizon (H) and 120-day rolling window to quantify systemic financial risk spillovers across Chinese industry markets under three frequency bands: short- (1–5 days), medium- (5–22 days), and long-term (22–250 days) (The three frequency bands were chosen to align with standard equity-market trading cycles: 1–5 days corresponds to a one-week horizon (five trading days per week), 5–22 days approximates a one-month horizon (around 22 trading days per month), and 22–250 days represents a one-year horizon (roughly 250 trading days per year)).
Table 4,
Table 5 and
Table 6 present the static spillover effects of industry financial risks under extreme conditions from short-term, medium-term, and long-term perspectives. The diagonal values represent the self-impact of lagged effects, while off-diagonal values represent directional spillovers of financial risks between two markets. To improve readability, we have presented the level of risk spillover between the two markets in heatmaps (
Figure 2). “To” represents outgoing spillovers from one industry to other markets, while “From” represents incoming spillovers received by one industry from others. “Net” represents the net risk spillover level for a given industry, calculated as “To” minus “From”. The bolded Total Connectedness (TC) value in the bottom right corner represents the total risk spillover level for that frequency band. The total spillover indices within the three frequency bands depict the proportion of spillovers in the short, medium, and long term, indicating the extent to which overall industry systemic financial risk fluctuations are driven by cross-market spillovers at each time horizon. The overall extreme risk across industries is high, with total spillover indices reaching 79.30% (short-term), 84.50% (medium-term), and 85.60% (long-term). This indicates that over 79% of the variation in systemic risk within the sample period is attributable to cross-market spillover effects of systemic risk, while less than 21% originates from within the system itself.
Specifically, from the perspective of receiving systemic financial risk (“From”), Energy (8.00% short-term), Materials (10.09% long-term), and Utilities (8.37% long-term) are the primary risk recipients across horizons. This indicates that these industries are more susceptible to risk contagion following extreme shocks. Materials ranks among the top three receivers in all horizons (short-term: 2nd at 11.65%; medium-term: 1st at 11.22%), reflecting its downstream susceptibility. Materials typically has a certain degree of cost-passing capability, enabling it to pass on some of the pressure from rising raw material prices to downstream enterprises. The demand for Energy products is relatively inelastic, meaning that even during economic downturns, basic energy needs persist. Additionally, Energy is typically highly concentrated and often receives government policy support, such as energy security strategies and green energy subsidies. The demand for Telecommunications Services and Utilities is relatively stable, with strong monopolistic characteristics, and is less affected by economic cycles. Therefore, these industries possess strong risk-resistance capabilities.
From the perspective of transmitting systemic financial risk (“To”), Information Technology dominates across all horizons (short-term: 11.96%; medium-term: 13.86%; long-term: 11.35%), followed by Industrials and Consumer Discretionary, consistently serving as major risk sources during extreme events. Information Technology exceeds 11% outward spillovers in all periods, underscoring its heightened systemic role. The Financials sector consistently demonstrates low spillover activity (Net: –1.51% short-term; –0.14% long-term), indicating enhanced stability and risk resilience during systemic financial risk. Information Technology is characterized by rapid technological iteration, high valuations, significant market volatility, and high sensitivity to changes in the macroeconomic environment, resulting in high risk. Demand for Consumer Discretionary is highly sensitive to economic cycles, and external shocks can easily lead to insufficient demand, triggering the risk of overcapacity. Industrial is highly correlated with the macroeconomic cycle. During an economic downturn, demand and prices for industrial products are impacted, making it prone to exporting risks.
In summary, Consumer Discretionary, Industrials, Healthcare, and Information Technology industries are more prone to extreme risks due to their characteristics of high demand volatility, intense market competition, high policy risks, and rapid technological updates. On the other hand, Energy, Materials, Consumer Staples, Financials, Telecom Services, Utilities, and Real Estate industries are more likely to absorb extreme risks due to their characteristics of inelastic demand, policy support, high industry concentration, and cost-shifting capabilities.
4.3. Dynamic Spillover Effects Analysis of Industry Risk
To compare the time-varying characteristics of financial risk spillover effects across different frequency domains, this paper employs a rolling window approach to investigate the dynamic spillover effects of industry financial risks in both the time and frequency domains, focusing on total spillover levels, net spillover levels, and network spillover relationships. The total spillover level represents the overall magnitude of extreme financial risk spillover effects across the 11 industry markets. The net spillover level indicates whether an individual industry, in the time and frequency domains, is a net transmitter of extreme risk to other industries or a net recipient of extreme risk from other markets. Positive or negative values in the network spillover represent, respectively, the level of risk spilled from or received by an individual financial market to/from other markets in the time and frequency domains.
Figure 3 (comprising three subplots for short-, medium-, and long-term horizons) illustrates the spillover levels of industry financial risk in China across different time scales. The magnitude of risk spillover effects varies substantially across frequencies, with short-term fluctuations showing the highest volatility (0–35 range), medium-term peaks reaching up to 45, and long-term levels maintaining the highest sustained values (10–80 range).
Firstly, from a time-domain perspective on the total spillover index, the interconnectedness of risk spillovers across industries increased significantly during and before the financial crisis, peaking at approximately 27 in the short-term band. As the impact of the crisis subsided, the interconnectedness gradually weakened. Before the 2015 stock market crash, the degree of risk spillover among industries steadily climbed and remained at a high level, before rapidly declining after the crash. In 2017, against a backdrop of renewed deleveraging efforts and tightening liquidity in China, frequent credit events such as debt defaults occurred, propelling medium-term interconnectedness to a new high of 34. Since the outbreak of the COVID−19 pandemic in 2020, the total spillover level initially increased rapidly. However, it has subsequently declined over 40% by 2024, contrasting with the continued development of the pandemic. This suggests that China’s sustained implementation of monetary and fiscal policies aimed at stabilizing the market and economy, by providing ample liquidity, has effectively mitigated extreme risk spillover effects while reducing systemic risk levels.
Secondly, from a frequency-domain perspective on the total spillover index, although risk spillover levels across different frequencies exhibit relatively synchronized trends in the time domain, there are substantial differences in their magnitudes and persistence. Cross-industry extreme risk spillover effects are primarily driven by long-term extreme risk spillovers, which consistently maintain the highest levels (>50 throughout most periods). Short-term spillover effects are mainly driven by noise trading, such as herding behavior and investor sentiment, while long-term spillovers are more influenced by economic fundamentals and persistent uncertain events. Therefore, cross-industry spillover effects of extreme risk in China are characterized by long-term (low-frequency) drivers, which demonstrate greater persistence and contribute to approximately 60–80% of total spillovers, with more persistent and enduring real impacts.
Additionally, this paper examines the net spillover effect of industry risk, with the analysis results shown in
Figure 4. As depicted in
Figure 4, the net spillover effect of industry risk exhibits notable time-varying and heterogeneous characteristics across different horizons, while also displaying a trend of co-movement among industries that remains consistent across various time periods. At certain key points—such as the financial crisis, European debt crisis, 2015 stock market crash, U.S.–China trade war, and the onset of the COVID−19 pandemic—the net spillover and total spillover effects reveal similar patterns, both demonstrating substantial fluctuations. Specifically, industries demonstrate synchronized regime shifts during crises: the 2015 market crash triggered simultaneous transitions to net transmission in Real Estate (+2.8 mid-run) and Financials (+1.5 short-run), while the U.S.–China trade war forced Technology into abrupt net reception (−4.2 long-run). In terms of spillover direction, all industries are shown to alternately emit and absorb risk during extreme events, with these shifts becoming more pronounced following major shocks. The impact of the COVID-19 pandemic in 2020 stands out for its severe and persistent effect across industries, with the Energy, Materials, Consumer Staples, and Real Estate sectors experiencing particularly notable volatility. Notably, after the onset of the pandemic, Energy shifted from a net receiver to a net transmitter of risk, a transition also observed in Materials, Finance, Real Estate, and Health Care. More specifically, COVID-19 induced unprecedented sectoral realignments: Energy’s transformation into a net transmitter (+4.8 short-run) reflected supply chain disruptions, while Financials’ shift (+1.9 net) revealed liquidity redistribution pressures. Crucially, Utilities consistently functioned as a system stabilizer with near-zero net spillovers across horizons, whereas Industrials acted as a crisis amplifier, exhibiting high-magnitude spillovers (>|5.0|) in all events. These findings suggest that industry risk spillover effects are likely to undergo significant shifts over time and in response to specific events, underscoring the importance of monitoring systemic risk with attention to its time-varying characteristics.
In summary, the heterogeneous spillover profiles across horizons reflect distinct underlying drivers: in the short run, liquidity shocks, noise trading, and shifts in investor sentiment precipitate rapid but fleeting risk transmissions, particularly in high-beta, retail-driven sectors; over the medium term, policy actions and credit-cycle dynamics extend the duration of spillovers, most notably in Financials and Real Estate as stimulus or tightening measures filter through credit markets; and in the long run, fundamental linkages—such as capital-intensive cycles and global supply-chain dependencies—sustain and propagate risk over months, especially in sectors like Energy and Materials.
The transmission of market sentiment and risk contagion among industries has resulted in a complex network of risk spillovers, forming an industry-wide risk spillover network. In this paper, we apply complex network methods to depict extreme risk transmission relationships between pairs of industries, aiming to clarify the structural characteristics of risk spillover. This method treats each industry within the national economy as a node in a complex network, considers the risk spillover relationships as network edges, and uses variance contributions calculated through variance decomposition as the adjacency matrix of the volatility spillover network. We construct an extreme risk spillover network among Chinese industries by treating each sector as a node and using variance-decomposition contributions as the weighted edges, yielding an 11-node, 55-edge graph (
Figure 5).
First, the average pairwise spillover coefficients in the long run exceed those in the short and mid runs, indicating that under extreme conditions, long-term risk contagion within the industrial system becomes more pronounced. Second, across all three horizons, Consumer Discretionary, Industrials, Healthcare, and Information Technology consistently act as net transmitters of extreme risk, while Energy, Materials, Consumer Staples, Financials, Telecom Services, Utilities, and Real Estate primarily serve as net receivers. Third, the sign distribution of the spillover coefficients varies over time: there are 20 positive vs. 35 negative pairs in the short run, 25 positive vs. 30 negative in the mid run, and 21 positive vs. 34 negative in the long run. In each case, fewer than half of the industry pairs register positive spillovers, and this proportion declines further over longer horizons, suggesting that as the horizon lengthens, industries are increasingly on the receiving end of extreme shocks, while their outward transmission weakens.
Finally, when examining individual pairwise strengths, Energy consistently exhibits its strongest risk transmissions toward Consumer Discretionary, Industrials, and Materials, and these three sectors remain among the top five recipients of shocks from Energy in every frequency band. This highlights the pervasive and enduring influence of the Energy sector in propagating extreme risk—particularly over the long term—and underscores the need to monitor risk buildup in this sector. Conversely, Telecom Services transfers significant risk to Information Technology, Consumer Discretionary, and Healthcare under extreme conditions, though these reception patterns shift as one moves from short to mid and long horizons, with Consumer Staples, Financials, Healthcare, and Consumer Discretionary emerging as key receivers in the latter periods.
4.4. Robust Test
Table 7 reports the MES-based systemic risk measures for each industry over the full sample and three extreme-event windows (the 2008–2009 Global Financial Crisis, the 2015–2016 stock-market crash, and the 2020 pandemic), presenting both means and standard deviations. Over the full sample, Energy, Materials, Consumer Discretionary, and Financials exhibit the highest average MES values (approximately 1.14, 1.17, 1.18, and 1.16, respectively), indicating that these sectors are most sensitive to systemic market shocks. In each event window, MES levels rise sharply: during the financial crisis, Energy’s MES increases from 1.14 to 1.96; in the stock-market crash, it climbs further to 2.36; and although it recedes somewhat in the pandemic period, it remains elevated at about 1.58. These patterns perfectly mirror those obtained under ΔCoVaR (
Table 2): the same industries in the same windows display high concentration and volatility of systemic risk, confirming the robustness of our results to the choice of risk metric.
Figure 2 depicts the total spillover index over short-, medium-, and long-run horizons as computed with ΔCoVaR, while
Figure 6 shows the analogous dynamics when MES replaces ΔCoVaR. In the short run, both metrics peak sharply during 2008–2009 and in 2015, and they exhibit a marked uptick at the onset of the 2020 pandemic; thereafter, they gradually subside and remain relatively stable through 2023–2024. In the medium run, both ΔCoVaR and MES capture a sustained high-spillover regime in the latter stage of the financial crisis and a pronounced extreme in 2015, whereas pandemic-period medium-run spillovers are milder but more volatile. In the long run, both plots display a “three-peak” pattern—2008–2009, 2014–2016, and 2020—with nearly identical peak magnitudes and durations, indicating that the long-run contagion dynamics are unaffected by the choice of systemic-risk measure.
Taken together, both the cross-sectional summary statistics and the multi-frequency dynamic spillover trajectories demonstrate that MES and ΔCoVaR yield highly consistent conclusions: the Energy, Materials, and Consumer Discretionary sectors bear the greatest systemic exposure during major market shocks; risk events amplify inter-industry spillovers and reshape their distribution across short, medium, and long horizons; and, overall, the MES-based results strongly validate the robustness of our earlier ΔCoVaR findings.


