Abstract
In this work, we aim to adjust vehicle speeds in real time by predicting the surrounding population density based on the spacing of customer locations. We comprehensively consider fixed costs, cargo loss costs, fuel costs, penalty costs, and environmental costs; build a cold chain distribution vehicle path optimization model with the goal of minimizing the total cost and maximizing customer satisfaction; and design a hybrid genetic algorithm solution optimization model. The algorithm dynamically adjusts the tournament scale through the standard deviation of the fitness value, uses the OX cross operator, determines the position of variation based on the customer information matrix, and performs local search optimization with the removal and insertion operators. Through comparison to other algorithms in the literature, the results show that the hybrid genetic algorithm not only improves customer satisfaction, but also maintains a lower total cost, which is obviously superior when solving the complex cold chain distribution path optimization problem; further comparison and analysis of the mathematical model in this paper with the single-dimension satisfaction model reveals that under the same satisfaction constraint threshold, the model in this paper can significantly reduce the system operating cost; we also deeply discuss the influence mechanism of vehicle traveling mode and customer point sparsity radius on distribution path planning.
Keywords:
cold chain logistics; vehicle routing problem; satisfaction; adaptive velocity; genetic algorithm MSC:
68W50; 90C59
1. Introduction
Cold chain logistics [1], as a special logistics model, was first proposed by Albert Einstein and Leo Szilard in 1926. This problem involves the rational planning of transportation routes in the distribution process while meeting distribution requirements in different time windows to ensure that the goods can reach the target location in a timely and efficient manner. With the continuous development of cold chain logistics, many scholars have carried out in-depth research on this problem, which involves a number of hot areas such as cold chain technology [2], cold chain efficiency [3,4], distribution time window [5,6,7], cold chain carbon emission [8,9,10], etc. Zhang et al. [11] proposed an effective scheduling scheme for cold chain vehicles by considering various constraints through the forbidden search and gray wolf optimization algorithms; Zhang et al. [12] constructed a cold chain logistics path optimization model for traffic conditions in China by considering the multiple impacts of traffic conditions on the total cost of distribution, product freshness, and low carbon emissions; Gao et al. [13] designed an improved genetic algorithm to solve the perishable cold chain distribution vehicle path optimization model with the objective of minimizing the total cost from the perspective of customer satisfaction; Guo and Liu [14] constructed the least-cost cold chain logistics path optimization model and analyzed it, using clustering and annealing algorithms; Jiang et al. [15] constructed a two-stage cold chain distribution optimization model with the objective of minimizing the total cost in order to quickly respond to the dynamic needs of customers and solved it using enhanced genetic algorithm; Zhang and Li [16] considered a class of vehicle path problems affected by the spread of epidemics with the aim of minimizing the total distribution time and the transmission risk of the distribution network; Chen et al. [17] studied the vehicle path problem of a real cold chain distribution company and modeled it as a multi-compartment vehicle path problem with some practical constraints.
Cold chain logistics, as a variant problem of the vehicle routing problem (VRP) [18], is a typical NP-hard problem [19]. Genetic algorithms (GAs) [20] are meta-heuristic algorithms inspired by biological evolution that are commonly used to solve complex combinatorial optimization problems, especially the traveling salesman problem (TSP) [21] and so on. While VRP can be regarded as a generalization of TSP, many scholars applied genetic algorithms to the solution of VRP to improve the optimization performance of the algorithm. Liu et al. [22] introduced the longest common substring of elite and inferior individuals in the crossover and mutation operators of genetic algorithms to speed up convergence and help individuals exit local optima; Mu et al. [23] combined the Gaussian matrix variation operator to improve the genetic algorithm’s efficiency; Dubey and Tanksale [24] proposed a genetic algorithm combining elite selection and local search; Teng [25] used three-vector chromosome coding method and four heuristic resource selection rules, and also introduced a neighborhood search operator with four neighborhood search operators, which enhanced the local search ability of the improved genetic algorithm.
The following scholars have contributed to solving the multi-objective problem. Leng et al. [26] integrated the elements of soft time window, heterogeneous fleet, and route flexibility, and at the same time applies six evaluation functions to quantitatively evaluate the system objectives from the core dimensions of logistics cost, fuel consumption, carbon emission, perishable goods quality damage, and customer satisfaction. The Pareto solution is obtained by organically integrating domain operators with a generalized multi-objective evolutionary algorithm (MOEA) to achieve comprehensive multi-objective optimization. Shi and Fu [27] introduced the time window constraints to carry out vehicle path optimization research based on minimizing distribution cost, minimizing empty vehicle cost and maximizing customer satisfaction, adopted a two-stage solution strategy of pre-optimization and real-time optimization, decomposed the problem by using decomposition method, and designed a minimum envelope cluster analysis method and hybrid genetic algorithm to solve the problem.Li et al. [28] simultaneously optimized the costs associated with siting, transportation, inventory, and carbon trading, and improved the Non-dominated Sorting Genetic Algorithm II ( NSGA-II) to solve the model. Zheng et al. [29] proposed a novel location inventory routing model for solving the cold chain logistics network problem in uncertain demand environments and employed a non-dominated sorting algorithm in the genetic algorithm to solve the problem. Wang and Wen [30] focusing on the cold chain third-party logistics service scenario, a low-carbon two-level heterogeneous fleet vehicle path problem model incorporating hybrid time window characteristics is constructed, which proposed an adaptive genetic algorithm to solve the problem with multiple objectives: realizing reductions in both cost and carbon emissions and the enhancement of total customer satisfaction.
In this paper, based on the time window, vehicle load, and other factors, the cold chain logistics path optimization problem is studied, and the main results are as follows:
- (1)
- We construct the sparse radius according to the customer point density and control the vehicle driving speed in real time, which is more in line with the real life.
- (2)
- We construct the fuel cost by using the vehicle’s mechanical power and running time, design the penalty cost by combining it with the current customer value, and construct the optimization model of the cold chain logistics path with the goal of minimizing the total cost and maximizing the customer satisfaction.
- (3)
- A hybrid genetic algorithm is proposed to dynamically adjust the size of tournament scale by combining the standard deviation of fitness, control the variation operation by utilizing the customer information matrix; we also design two removal operators and one insertion operator to perform local search and confirm its improved optimality.
The rest of the paper is structured as follows: Section 2 describes the fresh cold chain logistics vehicle path optimization problem with adaptive speed. Its mathematical problem modeling is described in detail in Section 3. The solution method is elaborated in Section 4. The experimental results are given in Section 5. Finally, considerations for future work are summarized in Section 6.
2. Problem Description
In the distribution of fresh products, in order to ensure the quality of the products, it is necessary to reasonably plan the driving speed and route planning of the vehicle. In actual distribution, transportation is often affected by many uncertain factors, such as traffic safety, weather conditions, etc. Now, consider a cold chain logistics vehicle routing problem based on adaptive speed. During the distribution process, the speed of the vehicles is adjusted in real time according to the density of neighboring customer points. Under the circumstances, optimize the distribution path to minimize the total cost of distribution and maximize customer satisfaction. To ensure the integrity of the model build, make the following assumptions:
- (1)
- The coordinates of the warehouse and all customer points are known.
- (2)
- Consider a single distribution center for fresh food distribution to multiple customer points, and the starting and ending points of the vehicles are warehouse.
- (3)
- All customers need the same type of goods, the demand is known, and each customer can only be serviced once by one car.
- (4)
- All customer time windows are known to incur penalty fees for early arrivals and late arrivals, and the penalty per time for late arrivals changes based on customer value.
- (5)
- The number of vehicles, the load, the maximum travel speed are known, and all delivery vehicle types are the same.
3. Problem Modeling
3.1. Model Parameters
We developed a mathematical model to describe cold chain logistics using the notation of Table 1.

Table 1.
Model Parameters.
3.2. Objective Function
3.2.1. Fixed Costs
Fixed costs refer to the fixed expenses incurred by vehicles during transportation, regardless of distance or length of time [31]. Vehicle fixed costs are expressed as follows:
3.2.2. Cargo Loss Costs
In cold chain distribution, improper temperature control can cause damage to goods, which is divided into two categories: damage when the door is unopened and damage when air circulation is caused [31]. Cargo loss costs are expressed as follows:
3.2.3. Fuel Costs
The fuel consumption of a vehicle is mainly due to two factors: the fuel consumption caused by the vehicle driving during transportation and the fuel consumption of the refrigeration system required to maintain a low temperature environment.
The energy consumption generated by vehicle driving is expressed in terms of fuel power and time consumed by the engine per unit time [32]. First the mechanical power of the vehicle k on travel arc is expressed:
In the formula, indicates the air resistance coefficient of the vehicle, which is used to describe the effect of air resistance on the vehicle; indicates the air density; S indicates the area of the front face of the vehicle, which affects the magnitude of air resistance when traveling; g indicates the coefficient of gravity; and indicates the coefficient of rolling friction of the vehicle.
The fuel consumption per unit of time when the vehicle is in motion is expressed as follows:
In the formula, indicates the mass ratio of fuel to air; indicates the calorific value of the fuel, the capacity released per unit mass of fuel; indicates the fuel consumption conversion factor, which is used to represent the actual capacity to which fuel consumption is converted; indicates the engine friction factor; indicates the technical parameters of the engine; and indicates the efficiency of the drive system, the efficiency with which the engine’s rotational capacity is converted to the vehicle’s power.
Fuel consumption is expressed as follows:
Fuel consumption due to refrigeration during the three processes of transportation, waiting, and unloading of vehicles is expressed as follows:
In the formula, indicates fuel consumption per unit time due to refrigeration during transportation and waiting and indicates fuel consumption per unit time due to refrigeration during unloading.
Fuel costs are expressed as follows:
3.2.4. Penalty Costs
Considering the customer’s demand and the degree of satisfaction of the time window, the current customer value calculation formula is designed, which is expressed as follows:
In the formula, indicates factors reflecting the time window for customer satisfaction; indicates the maximum length of the whole time window; and indicates the width of the customer i time window.
Considering the penalty cost of early and late arrival and the current customer value , we construct a penalty function based on the time window deviation as follows:
In cold chain distribution, the penalty costs of the vehicle are expressed as follows:
3.2.5. Environmental Costs
Cold chain transportation mainly uses refrigeration equipment and fuel-powered transport vehicles to maintain a cold environment, and the operation of this equipment consumes a lot of energy, which directly leads to the emission of greenhouse gases such as carbon dioxide. Environmental costs are expressed as follows:
3.2.6. Customer Satisfaction
Customer satisfaction is comprehensively assessed from the aspects of time satisfaction and quality satisfaction, and the timeliness is measured by time window. The expression for customer i satisfaction with the timeliness of fresh products is defined as follows:
In the formula, indicate the psychological factor reflecting the customer’s tolerance of different types of delays, set such that ; is the tolerance level for early arrival, which has a value of 0.9; is the tolerance level for slight tardiness, which has a value of 0.8; and is the tolerance level for severe tardiness, which has a value of 0.7. This not only takes into account timeliness but also captures the customer’s psychological perception of the differences so as to more comprehensively assess the customer’s satisfaction with the delivery time [33].
Quality is measured using the degree of freshness loss and customer demand for fresh produce. The expression of the quality satisfaction function for all customers for fresh products is defined as follows:
where indicates the degree of damage to fresh produce from the warehouse to the time when the customer i starts service, . Assigning weights to time satisfaction and quality satisfaction respectively, the overall satisfaction S is constructed as follows:
In the formula: and are weights. Since the impact of quality loss on customer experience in fresh food logistics is usually more significant (e.g., product spoilage may lead to returns or bad reviews), this paper sets and (higher weight).
3.2.7. Adaptive Speed
The speed design of the vehicle dynamically adjusts based on the number of adjacent customers of the customer. Specifically, the speed is inversely proportional to the number of adjacent customers, i.e., the more adjacent customers, the slower the vehicle. At the heart of this design principle is the simulation of real-world road network congestion and customer-dense areas that can lead to a decrease in vehicle speed. The number of adjacent customers can be seen as an indicator of regional complexity or traffic congestion [34]. Among them, the sparse radius is a key parameter used to measure the sparse distribution of customers in the vehicle driving area, and its core role is to dynamically adjust the vehicle driving speed by simulating the impact of congestion and customer-intensive areas of the real road network on the vehicle speed. The following is an example: In city centers (high customer density), vehicles need to slow down to avoid pedestrians or deal with congestion; in suburban areas (where customers are sparse), vehicles can maintain higher speeds. Sparse radius is the core parameter connecting “spatial distance” and “density perception”. By setting the distance threshold R, the customer distribution is transformed into a calculable number of neighbors, and then the vehicle speed is dynamically adjusted to realize the intelligent simulation of real traffic congestion. The essence is to transform the abstract “sparsity” into a concrete speed control strategy through the quantization of spatial scale. Vehicle speed is defined as follows:
In the formula, indicates the number of customers adjacent to the customer i, which can be considered a quantitative indicator of regional complexity or traffic congestion; is an indicator function, 1 when the condition is true, otherwise it is 0; and and indicate the coordinates of customer i and customer j. When the vehicle passes through the area of customer i, the vehicle is slowed down accordingly in advance, based on the number of neighboring customers and the estimated population density.
3.2.8. Model Building
To summarize, the optimization model of cold chain logistics distribution path is as follows:
where Equation (17) represents the minimization of the total distribution costs. Total costs consist of fixed costs, cargo loss costs, fuel costs, penalty costs, and environmental costs. Equation (18) represents the objective function of the model. It is a comprehensive evaluation function that takes into account total costs and customer satisfaction (balanced by the inverse of satisfaction and weighted by w). Equation (19) represents that each vehicle departs from the warehouse and returns to the warehouse after completing the distribution task. Equation (20) represents that the warehouse has a sufficient number of vehicles to complete the distribution task. Equation (21) represents that each vehicle must not be overloaded when performing distribution. Equation (22) represents that each customer can only visit once. Equation (23) indicates the time when the vehicle arrives at the customer’s point. Equation (24) indicates the time when the vehicle starts to serve the customer’s point. Equation (25) indicates that the vehicle’s start time must be within the customer’s acceptable time window.
4. Algorithm Design
Genetic algorithms are widely used in various optimization problems due to their strong global search ability. However, when dealing with large-scale complex problems, GA tends to fall into locally optimal solutions. In order to solve this shortcoming, a hybrid genetic algorithm (HGA) is proposed. The main improvements of the algorithm include the following: We use integer coding and the use of greedy ideas to initialize the population. By calculating the standard deviation of the fitness value, the scale in the tournament selection operation is dynamically adjusted to adapt to the search needs of different stages and avoid premature convergence. The OX crossover operator [35] can effectively maintain the gene order of the parent individual and enhance the search efficiency. Based on the customer information matrix, the cumulative probability is used to drive the mutation operation so as to enhance the diversity of the algorithm and the ability to escape local optima. In each iteration, the optimal individual is selected, the removal operation is performed by randomly applying the improved Shaw removal operator or the distance ratio removal operator, and the removed clients are reinserted with the rule that minimizes the distance increment, thus improving the quality of the overall solution. The flowchart of the algorithm is shown in Figure 1.
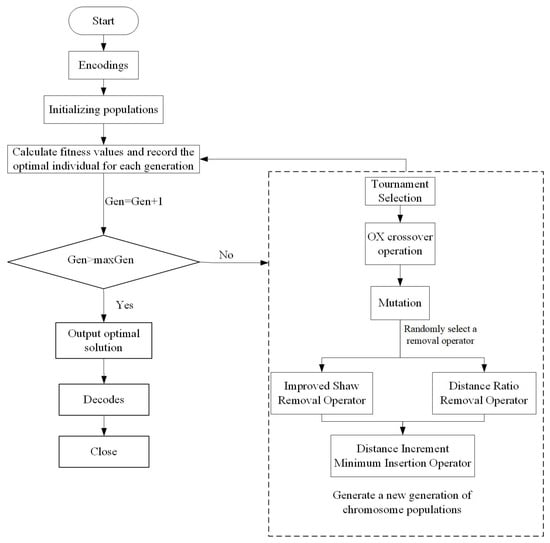
Figure 1.
Flowchart of the hybrid genetic algorithm.
4.1. Chromosomal Coding
In genetic algorithms, a chromosome is used to represent a solution in the solution space. Using integer coding, the length of the chromosome can be determined based on the number of customers () and the number of vehicles (), and the length of the chromosome G is defined as . Assuming we have 10 customers and 5 vehicles, the length of the chromosome is . An example of a chromosome might be Example 1 in Figure 2, 1–10 denotes the customer sequence, numbers greater than the number of customers are markers used to divide the distribution route, which is divided into 5 segments, indicating that all 5 vehicles are used for the distribution task. An example of a chromosome might be Example 2 in Figure 2, where 1–10 denotes the customer sequence, which is divided into 3 segments that make up the 3 distribution routes, where numbers greater than that are not used to divide the routes are placed at the end of the chromosome to indicate that there are still 2 vehicles that are not being used.

Figure 2.
Chromosome Coding Example Chart.
4.2. Population Initialization and Fitness Function
4.2.1. Population Initialization
In order to try to satisfy the customer’s time window requirements, a greedy idea is incorporated in the initialization of the population. The paths are initialized by the following steps:
Step 1: Set the initial path to empty and the current load of the vehicle to 0.
Step 2: From the warehouse, randomly select a customer i, and add new customers sequentially according to the size of the left time window.
Step 3: Calculate the current load of the vehicle and update the remaining capacity of the vehicle. If the load exceeds the maximum capacity, enable a new vehicle, reset the path and load of the new vehicle, and execute Step 2.
Step 4: If all customer nodes have been served and the vehicle satisfies the capacity constraint, the algorithm terminates. If there are still unserved customers, perform Step 2.
4.2.2. Fitness Function
Fitness is an important concept in genetic algorithms, which measures the strength and disadvantage of an individual, and the larger the fitness value, the better the quality of the individual. Combining the two goals of minimizing total cost and maximizing customer satisfaction, the fitness function is designed as follows:
In the formula, indicates the fitness value of the chromosome, indicates the objective function computed for chromosome i, and indicates the population size.
4.3. Selection Operator
The use of tournament selection [36] for subsequent crossover and mutation of individuals, combined with the standard deviation of fitness values to dynamically adjust the tournament size during the selection process increases the randomness and diversity of the selection process. The specific steps are as follows:
Step 1: Determine the number of individuals to be selected and initialize the selection result.
Step 2: Start the loop and dynamically adjust , is the standard deviation of the fitness value, , , implying that if the population has a large difference in fitness (large standard deviation), the size of the tournament will increase accordingly, thus making the selection process more randomized and increasing the diversity of selection.
Step 3: For each round of selection, randomly select a set of individuals (number ) from the population. Then, select the one with the best fitness among these individuals and record the index of this individual with the highest fitness.
Step 4: Repeat the above process times until a sufficient number of individuals are selected.
4.4. Crossover Operator
We select a classical crossover operator in the genetic algorithm. The OX crossover operation can effectively preserve the sequence information of the parent gene and avoid the problem of gene loss or duplication that may occur in the traditional crossover operation. First, two genes in parent 1 were randomly selected, then the selected gene positions and intermediate gene fragments were copied to the generated offspring, and then the position of the selected gene fragments in the previous step was found in parent 2, and finally the remaining genes in parent 2 were filled into the generated offspring in order. Figure 3 shows the specific steps.
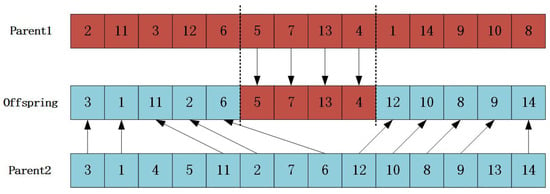
Figure 3.
OX crossover chart.
4.5. Mutation Operator
4.5.1. Cumulative Probability
An M-matrix is generated based on the distance of each customer from the warehouse, the size of the time window, and the amount of demand:
The formula for calculating the cumulative probability is as follows:
In the formula: indicates the maximum value of the distance between all customers and the warehouse; indicates the maximum value of the time window among all customers; indicates the maximum value of the demand among all customers.
4.5.2. Random Probability Generation
We generate a random probability that ranges between the maximum and minimum values of the cumulative probability. If the probability of randomness is outside this range, it is regenerated to ensure randomness.
4.5.3. Customer Selection and Variation Strategies
Let the mutant individual be . Randomly determine a mutation gene point and select the first gene point that satisfies the cumulative probability greater than the random probability as the second mutation point. After that, one of the following three strategies is randomly selected for the mutation operation:
Mutation strategy 1: Swap mutation. Swapping the gene point and the gene point , with the other positions remaining the same, the mutation is coded .
Mutation strategy 2: Reverse mutation. Reverse all the sequences between the gene point and the gene point , leaving all other positions unchanged; the mutation is coded as .
Mutation strategy 3: Deletion–insertion mutation. Deleting a gene point from the original path and inserting it into a position before the gene point , leaving the other positions unchanged; the mutation is coded as .
In genetic algorithms, the mutation operation is a key link for escaping local optima and maintaining population diversity. The M-matrix and its cumulative probability model designed by the algorithm in this paper achieve guided intelligent mutation by integrating multi-dimensional customer characteristics (distance, time window, and demand), effectively balancing the algorithm’s exploratory and exploitative capabilities. The synergy of the three factors makes it possible to balance global exploration and local exploitation. High cumulative probability nodes (e.g., proximity, high demand, tight time window): they have significant impact on path structure and constraint satisfaction, and prioritizing the adjustment of these nodes can quickly optimize the quality of the solution (development capability). Low cumulative probability nodes (e.g., long distance, small demand, wide time window): Provide more exploration space, tuning these nodes may discover new feasible solutions (exploration capability). The mutation operation assists the algorithm to exit locally optimal solution by introducing randomness, and the three mutation strategies adopted can effectively balance the exploration and exploitation ability of the algorithm and ensure that the population maintains its diversity during the evolutionary process.
4.6. Local Search
Genetic algorithms perform global search through selection, crossover, mutation and other operations, but when dealing with large-scale VRPs, it is prone to fall into premature convergence (premature convergence to locally optimal solutions) or inefficient search due to insufficient population diversity. Local search can quickly optimize the local structure (e.g., path order, node assignment) and improve the quality of the solution by performing a deep search in the neighborhood of the current solution, which is especially suitable for constraints that need fine-tuning in VRP (e.g., time window, load balance). According to the goal of minimizing the total costs and maximizing the satisfaction of the model distribution, two removal operators and one insertion operator were designed for local search from several aspects, such as distance, demand, and time window.
4.6.1. Improved Shaw Removal Operator
The classic Shaw removal operator considers customer relevance from two main aspects. The correlation is calculated as , where is the distance traveled from i to j. If i and j are served by different vehicles, the value of is 1; otherwise, it is 0 [37].
At present, for the processing of customer nodes, we calculate the correlation between customers i and customers from four dimensions to optimize the correlation evaluation more comprehensively.
- (1)
- Distance correlation (): indicates the maximum value of the distance between the customer and other customer nodes, . The smaller is, the more relevant the customer i is to the customer j.
- (2)
- Demand correlation (): indicates the maximum value of the difference between the customer i demand and that of other customers, . The smaller is, the more similar the customer i demand is to that of customer j and the stronger the correlation is.
- (3)
- Path correlation (): by checking whether the customer i and the customer j are on the same delivery path. If i and j are on the same path, then ; otherwise, .
- (4)
- Time correlation (): indicates the maximum value of the difference between the left time window of the customer i and other customers, . The smaller is, the closer the service time, and the stronger the correlation between customer i and customer j.
The correlation between customer i and customer j is obtained by combining the four factors mentioned above (distance, demand difference, path overlap, and service time difference):
The larger is, the stronger the correlation between the customer i and the customer j, and the more likely the customer j will be selected for removal.
The following is a simplified example (a warehouse and 5 clients) to illustrate the exact flow of operation of the improved Shaw removal operator, with diagrams to aid understanding. Take customer 1 (i = 1) as an example, calculate its correlation with other customers (j = 2, 3, 4, 5), and select the two customers with the strongest correlation for the removal operation.After calculating the customer information in Figure 4, we can get , , , . Similarly, we can thus calculate the correlation between customer 1 and the other customers. After calculations, we selected customer 2 and customer 5 for removal.
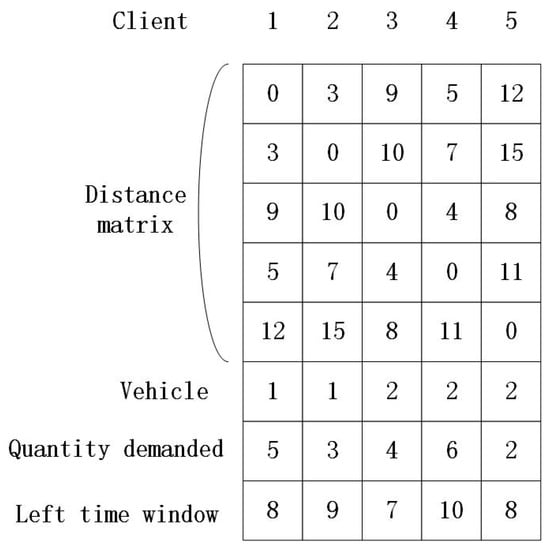
Figure 4.
Customer delivery information chart.
4.6.2. Distance Ratio Removal Operator
For the customer node m, the delivery precursor node is i, and the successor node is j. The distance ratio removal operator is defined as follows:
In the formula, indicates the direct distance between the customer i and the customer j after removing the node m, indicates the distance between the customer i and the customer m, indicates the distance between the customer m and the customer j, and indicates a weighting factor designed according to the customer m demand. If the value is larger, it means that the node m is less important in the path so as to avoid removing the critical node by mistake. The larger is, the easier it is to remove customer m.
In the following, we analyze the working principle of the distance ratio removal operator (DR) in detail through a specific logistics and distribution path example, combining node coordinates, demand and graphical illustration. Evaluate whether to remove node m and calculate its DR value. Calculated from the information in the Figure 5. Calculate , , , , substituting into Equation (30) results in . The before and after distribution comparison after removing customer m is shown in Figure 6. Following the above example, calculate the DR values of all customer points and select customers with large DR values for removal until the number of customers to be removed is satisfied.
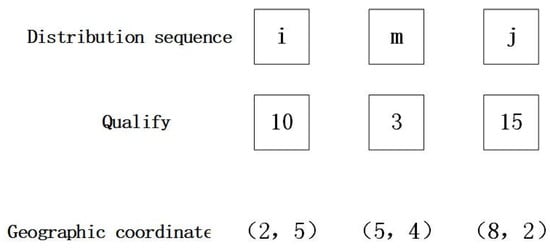
Figure 5.
Delivery routes and customer information.
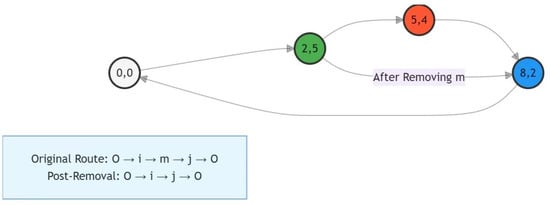
Figure 6.
Before and after customer removal.
4.6.3. Distance Increment Minimum Insertion Operator
For the customer node m, the vehicle serves the customer i and the customer j in turn, and the path increment is calculated:
is the path length of the inserted customer m and is the path length before insertion. Then, we determine whether the time window of each customer and the load constraint of the vehicle are satisfied; if they are satisfied, then insert, if not, select the second-best result for insertion. We proceed sequentially until all the points are all inserted into the path.
The distance incremental minimum insertion operator is illustrated below by a simple example. The distance matrix of four points—warehouse, customer A, customer B, and customer C—is the H matrix. The original distribution route is shown in Figure 7. Customer B is a customer point that needs to be inserted, now he has three locations in this distribution route that can be inserted (subject to other constraints), between the warehouse and customer A (case 1), between customer A and customer C (case 2), and between customer C and the warehouse (case 3). After calculation, we find that (case 1), (case 2), (case 3). The most suitable insertion is shown in Figure 8.
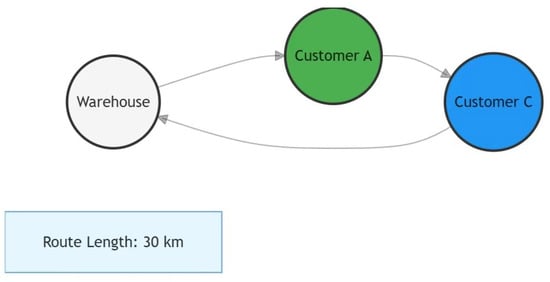
Figure 7.
Original road map.
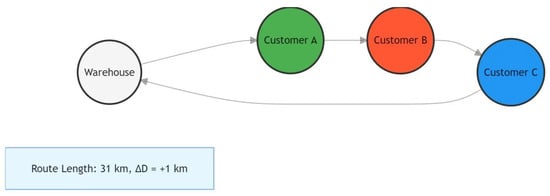
Figure 8.
Insert distribution roadmap after customer B.
5. Test Illustration
5.1. Experimental Examples
The Solomon dataset [38] is a well-known benchmark set for addressing VRP and variants. According to the characteristics of the dataset, different scale cases are selected to evaluate and compare the performance of HGA.
5.2. Model Parameter Values
All physical and cost parameters are taken from the literature [39]. The fixed parameter values of the model are shown in Table 2.

Table 2.
Model Parameter Values.
5.3. Algorithm Parameters and Model Parameter
In order to determine the optimal algorithm parameters, the C101 example in Solomon is used for test comparison. In the experiment, the relevant parameters were set as follows: the numbers of iterations were 100, 200, 300, 400, and 500; the population sizes were 50, 100, 150, and 200; the selection probabilities were 0.5, 0.6, 0.7, 0.8, and 0.9; and the cross probabilities were 0.5, 0.6, 0.7, 0.8, and 0.9. The control variable method was used to compare and analyze the objective function value and test time under different parameter settings, and the optimal algorithm parameters were finally determined as follows: the number of iterations was 300, the population size was 100, the selection probability was 0.7, and the crossover probability was 0.5.
In order to determine the optimal model parameter, the same Solomon dataset of C101 was used for testing and comparison. The weight w in the objective function (corresponding to Equation (18)) took the values of 1, 10, 100, 1000, 10,000, and 100,000. After several tests to compare and analyze the total cost and customer satisfaction, it was finally determined that was more reasonable.
5.4. Sparse Radius Sensitivity Analysis
In order to test the influence of different sparse radius on the model, C101 in Solomon was used for experimental comparison, and the results are shown in Table 3.

Table 3.
Table of changes in number of vehicles and costs with sparse radius.
It is observed that when , the number of vehicles decreases, but the cargo loss costs, penalty costs, and total costs are higher, and customer satisfaction is lower. When , the number of vehicles is increased, but the cargo loss costs, penalty costs, and total costs are greatly reduced, and customer satisfaction is increased. From the data, the 3 km spacing radius is more balanced in terms of customer satisfaction and cost control, which can ensure the distribution efficiency and reduce the cost.
5.5. Algorithm Performance Comparison
In order to further verify the effectiveness of HGA, the traditional genetic algorithm (GA), an algorithm from study [13] (IGA-1), and an algorithm from study [15] (IGA-2) were used to compare the different scales of the Solomon examples. The algorithm in study [13] uses a roulette wheel to perform the selection operation with a selection probability of 0.9; the OX crossover operator is used with a crossover probability of 0.9; two-point variation is used with a variational probability of 0.05; and for the local search, the client points are removed randomly, and the clients are inserted back to the position with the smallest possible increment of the objective function. The algorithm in study [15] uses the optimal individual retention strategy and roulette wheel selection strategy with a selection probability of 0.9; a two-point crossover operator with a crossover probability of 0.9; swap mutation with a mutation probability of 0.2; and a traditional Shaw removal operator and a cost incremental minimum insertion operator for local search. Each algorithm was run ten times. The best values, averages, and standard deviations were taken for comparison; the results are shown in Table 4, and the iterative curves of the four algorithms for the RC207 case is given, as shown in Figure 9. The optimal distribution scheme routes for all the above tested arithmetic cases are shown in Table 5 and the roadmap is shown in Figure 10.

Table 4.
Algorithm comparison.
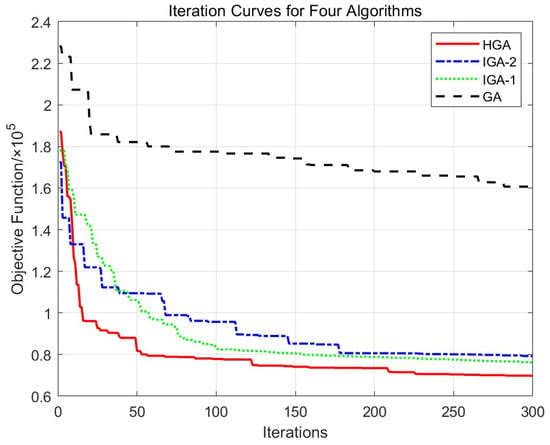
Figure 9.
Algorithm iteration diagram.

Table 5.
Distribution Routes for Each Example.
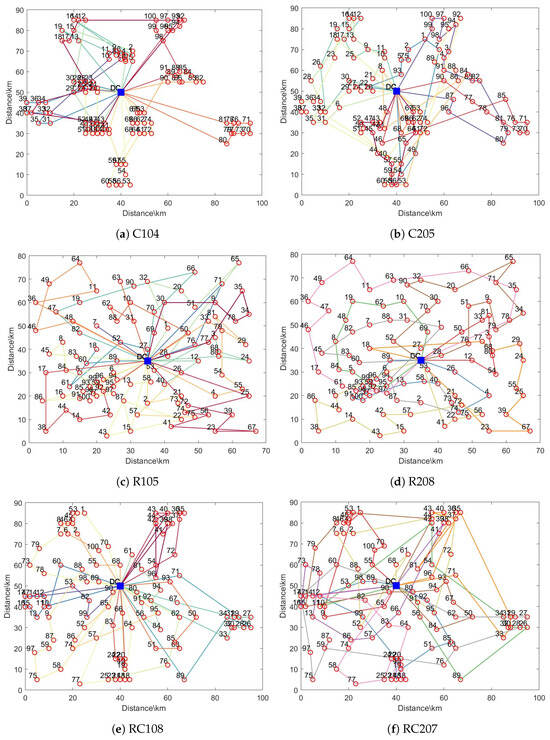
Figure 10.
HGA Solves Some of Solomon’s Examples.
As can be seen from Table 4, HGA outperforms the other three algorithms in terms of overall performance, and it is able to improve customer satisfaction while keeping the total cost low, giving it a greater advantage in practical applications. As seen in Figure 8, HGA outperforms the other three algorithms in terms of convergence speed, global search capability, stability, and final result. HGA can find the better solution quickly and shows better stability during iteration and finally converges to a lower value, which indicates its obvious superiority in solving complex optimization problems.
5.6. Comparative Analysis of Models
In order to verify the effectiveness of the model, the cost under three different thresholds of 0.80, 0.85, and 0.90 was analyzed, and the model (M1) in this paper was compared to model (M2) that only considered timeliness satisfaction (M2) and quality satisfaction (M3). These were tested on the R102 example, and the results are shown in Table 6.

Table 6.
Comparison of models at different satisfaction thresholds.
Analyzing the data, it can be seen that under the same satisfaction threshold, the model in this paper reduces the total cost for each of the three thresholds by , , and compared to the model that only considers time satisfaction and , , and compared to the model that only considers quality satisfaction. So, it can be seen that the model has a significant effect on reducing costs.
5.7. Comparison with Path Planning of Static Road Networks
In order to test the path planning of the static road network and random disturbance, six cases of different scales were selected from the Solomon test set for experimental comparison, and the speed of constant speed was set . The test results are shown in Table 7.

Table 7.
Comparative results of uniform and variable speed tests.
From the above data, it is found that variable speed driving is more advantageous in general. Variable speed driving generally consumes less fuel than uniform speed driving, which can reduce fuel costs; customer satisfaction with variable speed driving is usually slightly higher than that of uniform speed driving, especially in and other examples, where the gap is obvious; the total cost of variable speed driving is usually lower than that of uniform speed driving, which can achieve certain cost savings; variable speed driving has little to no penalty cost, while driving at a uniform speed sometimes incurs additional penalty costs, further increasing the overall cost. Comparatively speaking, the variable speed mode can be more energy-efficient than driving at a uniform speed in some cases, especially when considering the changes in traffic density in different regions, it can balance the service time and traffic impact in route planning, reduce the unreasonable delay caused by the vehicle speed is too fast or too slow, and thus improve the overall distribution efficiency.
6. Conclusions
Cold chain logistics, as an important part of modern supply chains, has attracted wide attention for its high energy consumption, carbon emissions, and real-time problems. In this paper, we comprehensively consider the multiple cost factors in cold chain logistics and distribution. At the same time, we integrate time satisfaction and quality satisfaction to evaluate customer satisfaction and also introduce the adaptive speed model in combination with the sparseness of customer points so that the model is more in line with the complex reality of cold chain logistics and can more accurately reflect the real situation of cold chain logistics operation.
Aiming to mitigate the shortcoming of traditional genetic algorithms in that they easily fall into locally optimal solutions when dealing with large-scale complex problems, this paper significantly improves the performance of the algorithm through a variety of improvement strategies that can more effectively cope with the complexity of the cold chain logistics path planning. Using integer coding, the chromosome length is flexibly determined according to the number of customers and the number of vehicles, which intuitively represents the solution. We combine this with a greedy idea to initialize the population and prioritize to meet the customer time window requirements. We dynamically adjust the tournament selection scale based on the standard deviation of the fitness value, increase the selection randomness in the pre-search period, and reduce the scale in the later period according to the convergence of the population, to accelerate the speed of convergence. OX crossing arithmetic efficiently retains the gene order of the parent generation, avoiding the loss of genes or duplications. We generate an M-matrix based on customer point information, cumulative probability driven selection of variant positions, and help the algorithm exit locally optimal solutions by introducing randomness. We design an improved Shaw removal operator, distance ratio removal operator, and distance incremental minimum insertion operator to optimize the quality of the solution by performing local search from multi-dimensions such as distance, demand, and time window.
Although this study has made some positive achievements in the cold chain logistics path optimization problem, there are still limitations: although a variety of costs are taken into account, some of the cost models may be simplified for the actual situation (e.g., the vibration of the vehicle during the transportation process leading to the breakage of the package which in turn causes damage to the goods). In reality, customers may have a certain tolerance elasticity for the time window (e.g., a few minutes earlier/later is acceptable), but the model treats the time window as a rigid boundary, resulting in a possible deviation between the penalty cost calculation and the actual customer feedback. The mechanical power calculation takes into account air resistance and rolling friction, but does not address road conditions (e.g., gradient, road roughness). In actual transportation, climbing or bumpy roads increase mechanical power demand, but the model is based only on the assumption of planar, uniform-speed motion, which may underestimate the cost of fuel in complex terrain. Adjusting speed based on the sparseness of customers’ neighboring points is difficult to fully reflect the complex and changing transportation environment in reality. In reality, traffic congestion is affected by dynamic factors such as time of day (e.g., morning and evening peaks), weather, and emergencies (e.g., accidents), but the model relies only on static geographic densities (customer coordinates), which do not capture changes in real-time road conditions. We evaluated the performance of the algorithm in some of the examples, but the test set used was limited and could not cover all types of cold chain logistics.
Our future research will focus on the following topics:
- (1)
- We will further study how to quantify the cost factors and customer satisfaction factors more accurately, optimization of the cost function and satisfaction function, and improvements to the accuracy and reliability of the model.
- (2)
- We plan to conduct more actual case studies, apply the model to different sizes and types of cold chain logistics enterprises, test the effectiveness and practicality of the model in actual operation, and further optimize the model according to the actual feedback so as to promote the wide application of the model in the industry.
- (3)
- We will explore the in-depth integration of the hybrid genetic algorithm with other intelligent algorithms (e.g., simulated annealing algorithm, particle swarm algorithm) or optimization techniques (e.g., heuristic algorithms), and give full play to the advantages of each so as to form a more powerful solution.
- (4)
- We will also study the decision-making process and behavioral logic of hybrid genetic algorithm in cold chain logistics path planning in depth to improve the interpretability of the algorithm, facilitate logistics enterprises in understanding and trusting the algorithm output results, and better apply it to practical decision-making.
Author Contributions
Conceptualization, D.P. and Y.S.; methodology, D.P.; software, Y.S.; validation, D.P.; formal analysis, D.P.; data curation, Y.S.; writing—original, draft preparation, Y.S.; writing—review and editing, D.P.; visualization, Y.S.; supervision, D.P.; project administration, D.P.; funding acquisition, D.P. All authors have read and agreed to the published version of the manuscript.
Funding
This research was funded by the National Natural Science Foundation of China, grant number 11871059; the Natural Science Foundation of Sichuan Education Department, grant number 18ZA0469; the Sichuan Science and Technology Program, grant number 2022NSFSC0558; and the Research Project on Graduate Education Reform of China West Normal University, grant numbers 2022XM24 and 2024XM05.
Data Availability Statement
All data used in this study can be provided upon request from the corresponding author.
Conflicts of Interest
The authors declare no conflicts of interest.
References
- Zhang, H.; Qiu, B.; Zhang, K. A new risk assessment model for agricultural products cold chain logistics. Manag. Data Syst. 2017, 117, 1800–1816. [Google Scholar] [CrossRef]
- Zhou, L.; Li, Q.; Li, F.; Jin, C. Research on Green Technology Path of Cold-Chain Distribution of Fresh Products Based on Sustainable Development Goals. Sustainability 2022, 14, 16659. [Google Scholar] [CrossRef]
- Quintero, R.A.D.; Silva, L.F.; Miranda, H.M.; Silva, L.C.A.; Eckert, J.J. Influence of different types of insulating materials, compressors, and refrigerants on the cost and energy performance of refrigerated transport systems. Appl. Therm. Eng. 2025, 269, 125994. [Google Scholar] [CrossRef]
- He, M.; Yang, M.; Wu, X.; Pu, J.; Izui, K. Evaluating and Analyzing the Efficiency and Influencing Factors of Cold Chain Logistics in China’s Major Urban Agglomerations under Carbon Constraints. Sustainability 2024, 16, 1997. [Google Scholar] [CrossRef]
- Zhang, Y.; Hua, G.; Cheng, E.C.T.; Zhang, J. Cold chain distribution: How to deal with node and arc time windows.Annals of Operations Research? Ann. Oper. Res. 2018, 291, 1–25. [Google Scholar]
- Wu, D.; Li, J.; Cui, J.; Hu, D. Research on the Time-Dependent Vehicle Routing Problem for Fresh Agricultural Products Based on Customer Value. Agriculture 2023, 13, 681. [Google Scholar] [CrossRef]
- Wang, Y.; Yang, C.; Hou, H. Risk management in perishable food distribution operations: A distribution route selection model and whale optimization algorithm. Ind. Manage. Data Syst. 2019, 120, 291–311. [Google Scholar] [CrossRef]
- Huang, W.; Zou, J.; Yin, M.; Liu, F.; Wang, X.; Zhang, X. Multi-scale energy-carbon assessment for oyster cold chain: An empirical study. J. Clean Prod. 2025, 486, 144538. [Google Scholar] [CrossRef]
- Xiang, Y.; Guo, J.; Mao, Z.; Jiang, C.; Liu, M. Stage-Specific Multi-Objective Five-Element Cycle Optimization Algorithm in Green Vehicle-Routing Problem with Symmetric Distance Matrix: Balancing Carbon Emissions and Customer Satisfaction. Symmetry 2024, 16, 1305. [Google Scholar] [CrossRef]
- Chen, Y.; Zhang, X.; Ji, J.; Zhang, C. Cold chain transportation energy conservation and emission reduction based on phase change materials under dual carbon background: A review. J. Energy Storage 2024, 86, 111258. [Google Scholar] [CrossRef]
- Zhang, H.; Yan, J.; Wang, L. Hybrid Tabu-Grey wolf optimizer algorithm for enhancing fresh cold-chain logistics distribution. PLoS ONE 2024, 19, e0306166. [Google Scholar] [CrossRef] [PubMed]
- Zhang, X.; Chen, H.; Hao, Y.; Yuan, X. A low-carbon route optimization method for cold chain logistics considering traffic status in China. Comput. Ind. Eng. 2024, 193, 110304. [Google Scholar] [CrossRef]
- Gao, H.; Zhang, Y.; Zhang, S. Cold chain logistics distribution of perishable products considering timeliness and quality customer satisfaction. J. Control Decis. 2024, 39, 1342–1350. [Google Scholar]
- Guo, L.; Liu, M. Optimization of low-carbon cold chain logistics distribution path for agricultural products based on two-stage algorithm. Adv. Control. Appl. Eng. Ind. Syst. 2023, 6, e176. [Google Scholar] [CrossRef]
- Jiang, X.; Liu, X.; Pan, F.; Han, Z. Optimizing Cold Chain Distribution Routes Considering Dynamic Demand: A Low-Emission Perspective. Sustainability 2024, 16, 2013. [Google Scholar] [CrossRef]
- Zhang, J.; Li, Y. Vehicle routing problem for cold-chain drug distribution with epidemic spread situation. Expert Syst. Appl. 2025, 262, 125186. [Google Scholar] [CrossRef]
- Chen, L.; Liu, Y.; Langevin, A. A multi-compartment vehicle routing problem in cold-chain distribution. Comput. Oper. Res. 2019, 111, 58–66. [Google Scholar] [CrossRef]
- Dantzig, G.B.; Ramser, J.H. The truck dispatching problem. Manage. Sci. 1959, 6, 80–91. [Google Scholar] [CrossRef]
- Hellmuth, M.; Scholz, E.G. Solving NP-hard problems on GaTEx graphs: Linear-time algorithms for perfect orderings, cliques, colorings, and independent sets. Theor. Comput. Sci. 2025, 1037, 115157. [Google Scholar] [CrossRef]
- Tsai, C.; Lu, S. A Novel Mechanism for Efficient the Search Optimization of Genetic Algorithm. Int. J. Comput. Intell. Syst. 2016, 9, 57–64. [Google Scholar] [CrossRef]
- Parker, R.G.; Rardin, R.L. The traveling salesman problem: An update of research. Naval Res. Logist. Quart. 1983, 30, 69–96. [Google Scholar] [CrossRef]
- Liu, J.; Tong, L.; Xia, X. A genetic algorithm for vehicle routing problems with time windows based on cluster of geographic positions and time windows. Appl. Soft. Comput. 2025, 169, 112593. [Google Scholar] [CrossRef]
- Mu, S.; Liu, B.; Jijian, G.; Lien, C.; Xiaojie, C. Analyzing vehicle path optimization using an improved genetic algorithm in the presence of stochastic perturbation matter. Sci. Rep. 2024, 14, 26105. [Google Scholar] [CrossRef]
- Dubey, N.; Tanksale, A. A multi-depot vehicle routing problem with time windows, split pickup and split delivery for surplus food recovery and redistribution. Expert Syst. Appl. 2023, 232, 120807. [Google Scholar] [CrossRef]
- Teng, G. An improved genetic algorithm for dual-resource constrained flexible job shop scheduling problem with tool-switching dependent setup time. Expert Syst. Appl. 2025, 281, 127496. [Google Scholar] [CrossRef]
- Leng, L.; Wang, Z.; Zhao, Y.; Zuo, Q. Formulation and heuristic method for urban cold-chain logistics systems with path flexibility–The case of China. Expert Syst. Appl. 2024, 244, 122926. [Google Scholar] [CrossRef]
- Shi, Z.; Fu, Z. Distribution location routing optimization problem of food cold chain with time window in time-varying network. Appl. Res. Comput. 2013, 30, 183–188. [Google Scholar]
- Li, K.; Li, D.; Wu, D. Carbon transaction-based location-routing-inventory optimization for cold chain logistics. Alex. Eng. J. 2022, 61, 7979–7986. [Google Scholar] [CrossRef]
- Zheng, J.; Li, K.; Wu, D. Models for location inventory routing problem of cold chain logistics with NSGA-II algorithm. Alex. Eng. J. 2017, 34, 533–539. [Google Scholar]
- Wang, Z.; Wen, P. Optimization of a low-carbon two-echelon heterogeneous-fleet vehicle routing for cold chain logistics under mixed time window. Sustainability 2020, 12, 1967. [Google Scholar] [CrossRef]
- Wang, S.; Tao, F.; Shi, Y.; Wen, H. Optimization of Vehicle Routing Problem with Time Windows for Cold Chain Logistics Based on Carbon Tax. Sustainability 2017, 9, 694. [Google Scholar] [CrossRef]
- Goeke, D.; Schneider, M. Routing a mixed fleet of electric and conventional vehicles. Eur. J. Oper. Res. 2015, 245, 81–99. [Google Scholar] [CrossRef]
- Giebelhausen, M.D.; Robinson, S.G.; Cronin, J.J. Worth waiting for: Increasing satisfaction by making consumers wait. J. Acad. Mark. Sci. 2011, 39, 889–905. [Google Scholar] [CrossRef]
- Chai, H.; He, R.; Ma, C.; Dai, C. Multi-objective optimization of hazardous materials transportation vehicle route problem. China Saf. Sci. J. 2015, 25, 84–90. [Google Scholar]
- Arram, A.; Ayob, M. A novel multi-parent order crossover in genetic algorithm for combinatorial optimization problems. Comput. Ind. Eng. 2019, 133, 267–274. [Google Scholar] [CrossRef]
- Igelbrink, L.J.; Casanova, G.A.; Smadi, C.; Wakolbinger, A. Muller’s ratchet in a near-critical regime: Tournament versus fitness proportional selection. Theor. Popul. Biol. 2024, 158, 121–138. [Google Scholar] [CrossRef]
- Shaw, P. Using constraint programming and local search methods to solve vehicle routing problems. In Proceedings of the International Conference on Principles and Practice of Constraint Programming, Pisa, Italy, 26–30 October 1998; Lecture Notes in Computer Science. Springer: Berlin, Germany, 1998; Volume 1520, pp. 417–431. [Google Scholar]
- Solomon, M.M. Algorithms for the Vehicle Routing and Scheduling Problems with Time Window Constraints. Oper. Res. 1987, 35, 254–265. [Google Scholar] [CrossRef]
- Chen, W.; Zhang, D.; Van Woensel, T.; Xu, G.; Guo, J. Green vehicle routing using mixed fleets for cold chain distribution. Expert Syst. Appl. 2023, 233, 120979. [Google Scholar] [CrossRef]
Disclaimer/Publisher’s Note: The statements, opinions and data contained in all publications are solely those of the individual author(s) and contributor(s) and not of MDPI and/or the editor(s). MDPI and/or the editor(s) disclaim responsibility for any injury to people or property resulting from any ideas, methods, instructions or products referred to in the content. |
© 2025 by the authors. Licensee MDPI, Basel, Switzerland. This article is an open access article distributed under the terms and conditions of the Creative Commons Attribution (CC BY) license (https://creativecommons.org/licenses/by/4.0/).