Abstract
The existing financial payment system has inherent credit card fraud problems that must be solved with strong and effective solutions. In this research, a combined deep learning model that incorporates a convolutional neural network (CNN), long-short-term memory (LSTM), and fully connected output layer is proposed to enhance the accuracy of fraud detection, particularly in addressing the class imbalance problem. A CNN is used for spatial features, LSTM for sequential information, and a fully connected output layer for final decision-making. Furthermore, SMOTE is used to balance the data and hyperparameter tuning is utilized to achieve the best model performance. In the case of hyperparameter tuning, the detection rate is greatly enhanced. High accuracy metrics are obtained by the proposed CNN-LSTM (CLST) model, with a recall of 83%, precision of 70%, F1-score of 76% for fraudulent transactions, and ROC-AUC of 0.9733. The proposed model’s performance is enhanced by hyperparameter optimization to a recall of 99%, precision of 83%, F1-score of 91% for fraudulent cases, and ROC-AUC of 0.9995, representing almost perfect fraud detection along with a low false negative rate. These results demonstrate that optimization of hyperparameters and layers is an effective way to enhance the performance of hybrid deep learning models for financial fraud detection. While prior studies have investigated hybrid structures, this study is distinguished by its introduction of an optimized of CNN and LSTM integration within a unified layer architecture.
MSC:
62H30; 68T01; 68T07
1. Introduction
Based on United States law, credit card fraud (CCF) detection represents the illegal duplication and unauthorized use of another person’s financial account details. Unlawful transactions using credit cards or account details are formed when users who are not cardholders make payments [1]. The growing use of online banking and large digital payment platforms has led to increased levels of fake activity, particularly CCF. Criminals cause annual financial losses that exceed billions of dollars. In the current era of financial systems, digital payments require CCF detection in order to safeguard data. All business owners agree that society is already showing signs of moving towards eliminating the use of physical cash. A standard form of payment will disappear from future transaction methods. Thus, the payment methods of today cannot help businesses grow in the future. Business operations will experience regular interruptions in cash flow. Customers show a greater preference for payments using credit and debit cards. Therefore, companies will have to upgrade their settings to accept new payment methods. In the next few years, the situation is expected to worsen significantly based on current predictions.
A widely recognized credit card fraud detection dataset serves as the basis for this research, comprising highly imbalanced transaction records [2]. The limited number of fraudulent transactions in the data presents significant difficulties in creating accurate classification models. By creating synthetic minority instances, SMOTE (Synthetic Minority Over-Sampling Technique) addresses class imbalance and enables the model to operate with datasets that have equal distribution. Researchers have estimated that credit card theft generated USD 32.2 billion in damages during 2021.
Machine learning (ML) approaches have been widely applied for detection of CCF [3,4,5]. Research using ML models addresses diverse problems across multiple studies. Deep learning (DL) algorithms have practical applications across various sectors, including banking, insurance companies, and computer networks, while also providing intrusion detection capabilities for mobile cellular networks and monitoring services for medical fraud in healthcare institutions. They are used for detection, home automation, Android malware detection, video surveillance, location tracking, medical diagnosis, and predicting heart disease, among other applications. This investigation examines the practical application of ML, including deep learning techniques, in detecting credit card theft incidents within the banking industry [6]. A support vector machine (SVM) functions as a supervised machine learning model intended for data sorting applications during the classification process. This method serves applications across multiple sectors, including defense operations, credit rating systems, and image recognition applications [7]. The classification performance of SVM outshines alternative methods, as it works equally well with both linear and nonlinear binary data and determines the optimal hyperplane positions across the support vectors. Previous methods for detecting credit card theft at Platooned have utilized neural networks. The primary research direction in DL concentrates on techniques belonging to DL branches of ML.
As a result, the performance of DL algorithms is found to be very high when applied to solve problems with the aid of big data, making these algorithms able to tackle a wide range projects. CNNs and LSTMs are two examples of these methods that could completely revolutionize the way in which fraud is detected. Models utilize deep learning techniques to detect authenticator fraud, thereby enhancing precision, usability, and robustness [8]. In cases of extraction where spatial features are involved, CNNs are ideal because they can learn the same features from image arrays using their convolutional layers [9]. It has been found that CNNs are promising in frameworks of fraud detection of transactions and analyzing the spatial relationships of the data. These methods can be applied by analysts. Contextual patterns of transactional data, including spending behaviors and geographical locations, have revealed applications in fraud detection. On the other hand, LSTM is a type of recurrent neural network (RNN) that has shown good performance in identifying the temporal relations between data. As explicated by their design principle, these networks were first proposed to enable the maintenance of state information across long sequences of recursive connections. They are efficient in modeling sequential data [10]. When examining sequences of transactions over time, LSTM models are effective in analyzing these sequences. Thus, such systems can identify anomalies as well as rather infrequent patterns that may indicate fraud, thereby signaling fraudulent behavior [11].
Each of these deep learning model architecture offers distinct advantages that can support fraud detection efforts. The selected architectures offer detection capabilities that complement and enhance each other’s performance in fraud prevention. These networks possess outstanding abilities to detect spatial patterns and perform analysis to identify distinctive patterns within individual transactions that may indicate fraudulent schemes. This method detects deceptive conduct from transaction activities or geographical data patterns. Sequential patterns emerge naturally from LSTM’s effectiveness at modeling sequential data. The system employs temporal analysis to identify fraudulent activity patterns across multiple time points by examining transaction sequences. The model detects both structural and fluctuating patterns across connected transaction streams. Complex long-range dependency processing remains one of the core strengths of such systems. The technology effectively assesses prolonged transaction histories. The system analyzes records together with complex fraud signatures. Combining multiple sequential models such as CNNs, LSTMs, and transformers can enable the fruitful utilization of combined hardware abilities by leveraging their strengths in spatial, temporal, and complex domains. The combination of attention-based sequential analysis with transformer audits enables extensive and multifaceted evaluation.
1.1. Research Gap
- Existing fraud detection systems continue struggling to find an equilibrium between detection accuracy rate and computational resource consumption.
- The proposed hybrid CLST model successfully integrates a fully connected output layer with LSTM and CNN networks, but requires additional refinement through advanced preprocessing approaches and hyperparameter tuning.
- This research fills existing knowledge gaps [12] by creating an optimized CLST hybrid framework that merges SMOTE class imbalance correction methods with optimized performance enhancements through hyperparameter selection.
- The proposed approach utilizes these individual architectures to develop a combination that promises both real-time scalability and robust detection of credit card fraud.
1.2. Study Contributions
The main contributions of this study are as follows:
- For effective fraud detection, we propose a hybrid optimized CLST architecture that handles spatial, sequential, and high-level information.
- CNN and LSTM outputs are merged with a fused layer to improve their feature learning ability and overall accuracy.
- For a fair comparisons, we build two advanced machine learning models, namely, a logistic regression model and a support vector machine model.
- The issue of class imbalance is handled by using SMOTE to boost the minority class (fraudulent cases) while maintaining the majority class.
- Keras Tuner is used for hyperparameter optimization, achieving considerable improvements in various performance metrics.
2. Literature Review
The growing prevalence of digital transactions makes credit card fraud detection an essential research field in both the financial security and machine learning domains. Research investigators have explored multiple solutions to detect fraud, including rules-based systems, current deep learning methods, and conventional machine learning methods. Robust and scalable solutions are becoming essential as fraud tactics evolve rapidly and transaction data become increasingly complex.
In earlier eras, the primary framework for fraud detection techniques consisted of rules-based mechanisms. To detect suspicious transaction activity, these systems use predefined rules to identify items sourced from unpredictable locations and transactions exceeding predefined thresholds. Regulations for detecting fraud are effective when operations are stable, but are ineffective in combating emerging types of financial crime. Studies utilizing logistic regression and SVM models to learn patterns in transaction data have found decision trees to perform more effectively than earlier systems [13,14]. However, the ability of these analytical techniques to recognize complex fraud patterns remains limited, as they are still unable to identify the essential sequential relationships present in transaction data.
Methods for detecting fraud have undergone a significant evolution due to advancements in deep learning technology. CNN algorithms can recognize complex spatial patterns in high-dimensional data, and are frequently used for feature extraction. CNN models match transaction metadata features such as time and location data in order to identify fraud transaction patterns with high identification success rates. Sequence patterns in transaction records can be seen with revision models, including RNN and LSTM networks. The ability of LSTM networks to process transaction sequences by creating temporal relationships that facilitate the discovery of anomalous patterns over time is one of their primary advantages [15]. Through LSTM implementations, scientists have demonstrated the ability to identify abnormal sequences of transactions as well as to detect rapid multiple transactions and deviant payment patterns. Fully connected output layer networks are easier to use than CNNs and LSTMs and are particularly well-suited for classification tasks. Research teams have enhanced the accuracy of fraud detection systems by integrating a fully connected output layer with multiple models [16]. Even the most sophisticated deep learning algorithms struggle with real-world unbalanced data formats when fraud instances lack valid financial transactions for comparison.
Hybrid model applications have gained popularity because they enable various architectural capabilities to work together. Using CNN integrated with LSTM enables professionals to simultaneously extract spatial and temporal characteristics from transaction databases. Such models demonstrate improved capability to detect the complex relationships that exist between various transaction characteristics [17,18]. The use of MLPs during classification enables the optimal exploitation of spatial-temporal features initially learned by fraud detection mechanisms. The majority of hybrid models operate using default hyperparameters. However, these preset values may not work effectively for different database needs. Performance declines if the model is not adjusted precisely for the learning rate and dropout rate, along with the appropriate selection of batch size. The current research focuses on hyperparameter optimization but lacks a thorough analysis of applying optimization techniques to hybrid models. An urgent solution must be implemented to resolve the class imbalance problem in fraud detection datasets, as fraudulent transactions appear only in less than 1% of the total data. The problem of class imbalance in fraud detection datasets can be addressed by employing three widely used techniques: oversampling, undersampling, and SMOTE [19]. The GUIDE correlation software framework enhances model training by utilizing SMOTE to generate artificial examples of the minority class, thereby facilitating improved learning.
Multiple studies have tracked assessment results between standard approaches and deep learning methods for detecting fraudulent activities. The research by Seera et al. (2024) [20] introduced hybrid architectural solutions after they determined that traditional models were ineffective for working with high-dimensional data sets. According to Salam et al. (2024) [21], deep learning models excel in both accuracy and scalability; however, they also raise concerns due to their expensive processing requirements and need for expert modeling. Hybrid analytical approaches deliver promising results, but provide insufficient advantages for global implementation in terms of speed of processing and ease of data adaptation. The current systems are based on tests using static data, which cannot handle dynamic real-world fraud situations. Research has failed to analyze how combining deep learning systems with advanced preprocessing techniques such as SMOTE can improve model effectiveness when handling problems with imbalanced classes. The research domain dedicated to detecting fraud relies on a basic development strategy that unites ensemble approaches with federated learning techniques. Distributed ensemble detection systems perform more effectively when the data remain spread across separate stations to protect operational privacy [19]. Detection processes require substantial computing resources, limiting their practical implementation during real-time events, as illustrated in Table 1.

Table 1.
Summary of credit card fraud detection-related literature and comparative analysis.
Recent studies have introduced advanced architectures such as xLSTM, transformers, and Mamba for financial fraud detection. Yu et al. [22] proposed a transformer-based model leveraging self-attention mechanisms to capture contextual transaction behavior. Deng et al. [23] designed a real-time cloud-optimized transformer model for streaming fraud analysis. These approaches have demonstrated impressive results, especially in modeling complex temporal sequences. However, their computational demands and deployment complexity can be limiting. Last year, Benghazi et al. [14] introduced an improved version of LSTM that reached 98.7% recall. However, the model did not have a final dense layer that would divide the classes more clearly. In contrast, our CLST hybrid model aims to provide competitive performance with lower resource consumption and more straightforward interpretability.
3. Proposed Methodology
This study’s technique is developed to apply a hybrid deep learning model that combines CNN, LSTM, and fully connected output layer networks to address the challenges associated with credit card fraud detection. Each of the several fundamental stages that make up the method is crucial to the model’s success. We outline each step in detail below, following the proposed methodology architecture shown in Figure 1.
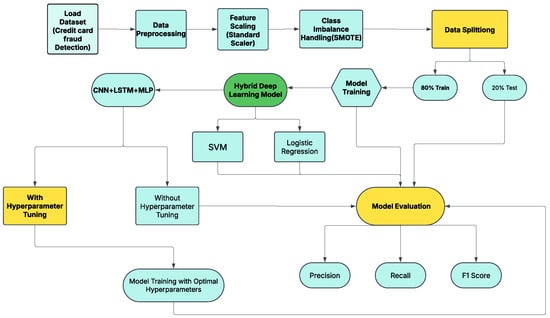
Figure 1.
Methodology of our proposed research study for CCF.
3.1. Dataset Collection
The Credit Card Fraud Detection dataset obtained from Kaggle in September 2024 [24] contains European cardholders’ transaction data, and functioned as the primary source for this study. Researchers frequently utilize this European credit card dataset to create effective CCFD models. With 492 fraud transactions (0.172%) out of 2,84,807 transactions, the number of transactions is highly imbalanced. Each transaction contains 31 features, and ‘Class’, ‘Time’, and ‘Amount’ were added to the 28 anonymized principal components extracted using principal component analysis (PCA). The dataset’s features include several elements, as listed in Table 2.
Table 2.
Description of dataset features.
3.2. Data Preprocessing
Our analysis begins with data preprocessing in which we prepare the unprocessed transaction data for analytical purposes. Compared to the total volume of data, the overall distribution of credit card payment data indicates an extremely small percentage of fraudulent transactions. This means that the resulting models will become unreliable when confronted with biased detection of fraud. The SMOTE technique generates artificial samples from the minority class (fraudulent transactions), thereby balancing the data distribution within the dataset. We normalize our features while managing class imbalance, as we want all numerical values to use a common measurement scale. The deep learning models demonstrate particular sensitivity to various input features, making this characteristic particularly beneficial. Feature values requiring label encoding are transformed into numerical representations by converting their categorical values into numerical representations. Notification methods for missing data can be either full absence or meaningful replacement with mean or median statistics.
The visualization map in Figure 2 illustrates the significant connections between all the features in the dataset. Because weak factorial correlations only exist on the main diagonal of the matrix, complex models are required to detect fraud.
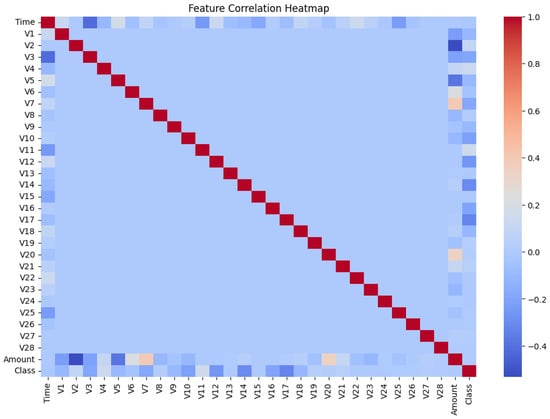
Figure 2.
Feature correlation heatmap showing the relationships between dataset features and highlighting weak correlations.
3.3. Synthetic Minority Oversampling Technique (SMOTE)
There is significant imbalance in this dataset; thus, in this study we evaluated the implementation of SMOTE to deal with the problem of class imbalance in the dataset [25]. SMOTE generates synthetic samples for the minority class in order to address class imbalance, as illustrated in Figure 3. For a given minority class sample , a synthetic sample is created as follows:
where:
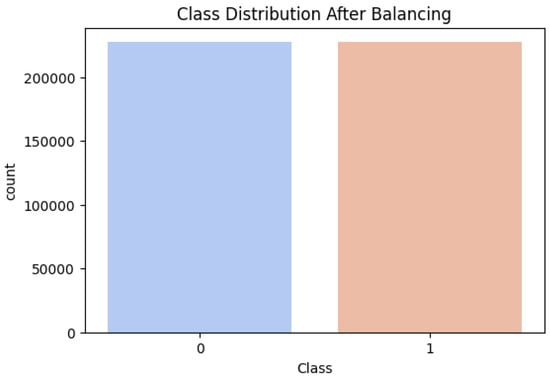
Figure 3.
Class distribution after applying SMOTE to achieve a balanced dataset.
- is a randomly selected nearest neighbor of
- is a random number between 0 and 1.
We selected SMOTE for its proven performance, simplicity, and compatibility with tabular data. Advanced alternatives such as GANs and feature weighting require complex tuning and longer training times, which challenges real-time deployment. SMOTE offers a balanced compromise, improving recall and F1-score with minimal computational cost.
3.4. Data Splitting
Training and validation datasets are created by using preprocessed data. A typical distribution ratio used in data splitting is for 80 percent of the data to feed model training operations while testing utilizes the remaining 20 percent. Testing the model with unidentified data results in assessment of its actual performance. Additional datasets derived from the training set enable both training and validation processes, which aid in tuning hyperparameters and preventing overfitting.
3.5. Applied Models
3.5.1. Support Vector Machine (SVM)
SVM is a supervised learning algorithm [26] that detects credit card fraud by categorizing transactions as either fraudulent or legitimate. SVM algorithms create an optimal boundary between classes through which they determine the maximum separation distance. Multidimensional data processing for SVM results in successful performance, while kernel functions such as RBF or polynomial can extend its capacity to detect advanced relationships. This algorithm demonstrates resistance to outliers and maintains its effectiveness when dealing with imbalanced datasets through the implementation of SMOTE or cost-sensitive learning methods. SVM becomes computationally costly when dealing with extensive datasets. The combination of feature selection and normalization techniques with SVM leads to better performance results.
3.5.2. Logistic Regression (LR)
LR functions as a supervised learning algorithm [27] for identifying two possible classes in data. A prediction model using the logistic function applies the sigmoid curve to determine the probabilities for input classification. The output range is between 0 and 1. The boundary that determines classification decisions is defined by a specified threshold value of 0.5. It distinguishes transactions into fraudulent and legitimate groups. The combination of straightforward design and interpretability makes LR an efficient model that works well with large data collections. The linear relationship between variables and log-odds serves as a key assumption of this approach; however, it may fail when attempting to identify complex data patterns. Lasso and Ridge regularization serve to minimize overfitting during the learning process.
3.5.3. Optimized Proposed Hybrid Model Design
Our model differs from previous hybrid structures because we use a parallel design and fuse the information from both the spatial and temporal models using MLP. Such a design makes it easier to discover and stop fraud for minority groups than with other methods. The design of the hybrid optimized CLST model with SMOTE is the core of the credit card fraud detection methodology. This model achieves enhanced fraud detection performance by combining features from three distinct deep learning architectures.
The goal of pattern identification in transaction patterns requires the use of CNN analysis to extract spatial features. Through LSTM analysis of financial transaction dependencies in sequences, the method becomes capable of detecting temporal patterns in transaction histories. The MLP classification layer plays a minimal role by combining sequential and spatial features to enhance prediction accuracy. The integration of SMOTE with hyperparameter modification helps the model to address class imbalance while achieving improved performance results.
CNN for Extracting Spatial Features: Among te essential elements found in CNN networks are convolution, pooling, and fully connected layers, which learn spatial hierarchies through automatic adaptation using backpropagation [11]. The structure comprises neurons along with weights and learnable biases. The building blocks of a CNN include both the CNN layers and the fully connected layers, which together form the internal levels of the CNN [28]. A CNN’s convolutional layers extract spatial characteristics from the input data. Equation (2) describes a convolution operation with the following structure:
In discrete form, the convolution operation for 2D input data (e.g., images or transaction features) is expressed as follows:
where:
- I is the input feature map
- K is the kernel or filter
- is the index of the output feature map.
LSTM for Temporal Pattern Learning: LSTM models have shown excellent performance in time series prediction applications, particularly in CCF detection. The gates come in various forms, including input, output, and forget gates [10].
The objective of LSTM-type RNNs is to determine temporal dependencies in sequential input. The following is an overview of the equations for an LSTM cell:
where:
- is the input at time t
- is the hidden state at time
- is the cell state at time t
- W and b are weights and biases, respectively
- is the sigmoid activation function.
We developed a layer that joins both features to better manage spatial and sequential data. CNN and LSTM results are gathered in a feature vector and fed into the dense layers, making the last prediction in the MLP. This means that the model can better identify connections that help in any work against fraud.
Fully Connected Output Layer: The dense (output) layer component performs transaction classification between valid and fraudulent types. It processes the joint output from the CNN and LSTM using several fully connected layers. This network includes input and output layers for prediction and hidden layers for computation [29].
The output of a single neuron in a dense layer can be computed as follows:
where:
- is the input feature
- are the weights
- b is the bias term
- is the activation function (e.g., ReLU, sigmoid).
The final output layer uses a sigmoid activation function for binary classification, provided by:
where:
- h is the output from the previous hidden layer
- is the predicted probability of the positive class.
The optimized CLST architecture is selected to exploit the complementary strengths of each component. The CNN layers extract spatial features and local patterns from transaction vectors, effectively capturing important inter-feature relationships. Subsequently, the LSTM layers model sequential dependencies across transactions, which is crucial for identifying the temporal behavioural patterns typically associated with fraudulent activities. Finally, a dense layer comprising multiple fully connected layers is used for classification, enabling high-level feature integration and robust decision-making. The dense layer serves as the final module in this study, transforming the learned feature representations into accurate fraud predictions. The optimized CLST architecture is illustrated in Figure 4.
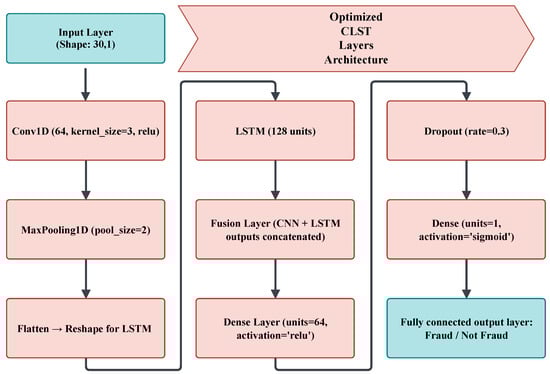
Figure 4.
Optimized CLST layer architecture.
3.6. Hyperparameter Tuning
Hyperparameter modification is a crucial step in enhancing model performance. Model hyperparameters such as learning rates need careful adjustment in order to achieve peak performance. A thorough exploration of hyperparameter values was conducted through grid search and random search approaches to identify the optimal hyperparameter combinations. The dropout and L2 regularization methods helped to prevent overfitting by maintaining good performance on new data using the parameters listed in Table 3.
Table 3.
Optimal hyperparameter values selected for the CLST hybrid model after tuning to ensure improved performance in credit card fraud detection.
3.7. Performance Evaluation
Several evaluation metrics were used to determine the hybrid model’s performance, including accuracy, precision, recall, F1-score, and ROC-AUC. The comparison metrics offer a complete view of how well the model finds fraudulent activities together with its ability to control incorrect alert generation. Cross-validation methods verify the model’s performance across various subsets of the data. ROC-AUC curves offer insights into the model’s performance in distinguishing between fraudulent and legitimate transactions, illustrating the relationship between the true positive rate and the false positive rate.
3.8. Accuracy
Accuracy measures the overall correctness of the model by calculating the proportion of correctly classified transactions (both fraudulent and legitimate) to the total number of transactions, as expressed in Equation (12):
where:
- TP (True Positive): Fraudulent transactions correctly identified as fraud
- FP (False Positive): Legitimate transactions incorrectly classified as fraud
- FN (False Negative): Fraudulent transactions incorrectly classified as legitimate
- TN (True Negative): Legitimate transactions correctly identified as non-fraudulent.
3.9. Precision
Precision is the ratio of accurately detected fraudulent cases (true positives) compared to all identified fraudulent predictions (true positives and false positives), as defined in Equation (13):
3.10. Recall (Sensitivity)
Recall is the ratio of correctly identified fraudulent transactions to the total actual fraudulent transactions (true positives and false negatives), as shown in Equation (14):
3.11. F1-Score
When class distributions are uneven, the F1-score (Equation (15)), sometimes referred to as the harmonic mean of precision and recall, maintains a balance between the two factors:
3.12. ROC-AUC Curve and Model Reliability
The receiver operating characteristic (ROC) curve indicates the model’s ability to identify between legitimate and fraudulent transactions. The ROC curve can be defined by a single score termed the area under the curve (AUC). Perfect sorting is represented as an AUC of 1.0. We employ the ROC-AUC curve to illustrate whether the model can distinguish between transactions that are fraudulent and those that are not.
4. Results and Discussions
We conducted a comprehensive examination of the CLST hybrid model using an extensive credit card fraud dataset. The model proved effective for practical use, detecting fraudulent transactions effectively without producing substantial false alert rates. The following model performance review presents an extensive evaluation across six measures: accuracy, precision, recall, F1-score, ROC-AUC, and scalability.
4.1. Results with Logistic Regression Model
As presented in Table 4, the LR model’s performance reveals a significant imbalance in predictive capability between the two classes. The model shows excellent results for the non-fraudulent class (Class 0), with an F1-score of 0.99, recall of 0.97, and a perfect precision score of 1.00. This shows just a few false positives, meaning that the model is good at correctly identifying real transactions. However, this performance drops drastically when detecting fraudulent cases (Class 1). Although the recall for fraud detection is relatively high at 0.92, indicating that the model can identify most fraudulent instances, it suffers from a very low precision of 0.06. This suggests that most of the transactions flagged as fraud are actually legitimate, resulting in an F1-score of just 0.11. The macro average metrics reflect this disparity, with an overall accuracy of 0.97 but significantly lower scores for precision (0.53) and F1-score (0.55).
Table 4.
LR model results.
The LR confusion matrix shown in Figure 5 demonstrates high fraud detection accuracy while also including instances that reduce reliability, such as false positives and false negatives.
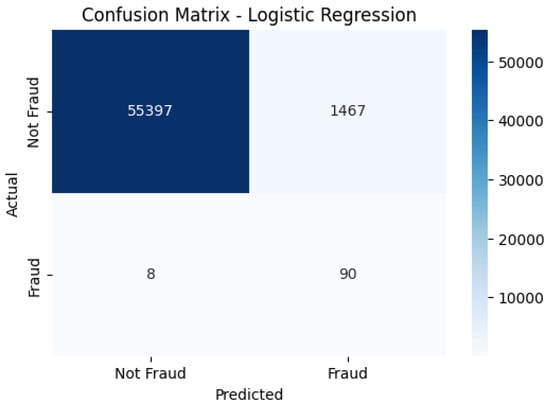
Figure 5.
LR confusion matrix, highlighting fraud detection accuracy with some misclassifications.
4.2. Results with Support Vector Machine Model
The performance evaluation of the SVM model presented in Table 5 reveals a notable imbalance in its ability to handle the two classes in the fraud detection task. The model performs exceptionally well for non-fraudulent transactions (Class 0), achieving near-perfect metrics with a precision of 1.00, recall of 0.98, and F1-score of 0.99. This suggests that the model is highly confident and consistent when identifying legitimate transactions. However, the results for fraudulent transactions (Class 1) present a concerning contrast. Although the model captures a high recall of 0.87, indicating its ability to detect most fraudulent cases, it struggles significantly with precision, which drops to just 0.09. This means that many transactions flagged as fraudulent by the model are actually non-fraudulent, resulting in a high false positive rate. The F1-score for Class 1 is low at 0.16, indicating poor overall effectiveness in handling fraud cases. The macro average across all classes provides a broader view, with an overall accuracy of 0.98; however, the precision (0.54) and F1-score (0.57) reveal the imbalance in class performance.
Table 5.
SVM model results.
Figure 6 shows the SVM model’s performance in making correct and incorrect predictions between fraudulent and standard transactions. Most non-fraudulent transactions are accurately detected by the model, yet it demonstrates limited capability in detecting fraudulent cases.
Figure 6.
SVM confusion matrix, displaying model performance in classifying fraud and non-fraud transactions.
The results of the applied machine learning models demonstrate how well the system recognizes fraud by showing the relationship between precision and recall in the detection process. The shape of the decrease in performance suggests that the models encounter obstacles while maintaining a high level of precision during the growth phase of recall.
4.3. Results with Proposed Deep Model
Detecting credit card fraud more accurately is the primary objective behind model development. The foundation models of LR and RF reached baseline accuracy levels at 95.12% and 96.78%, respectively. The reported accuracy levels are good, but further progress is needed to reduce both incorrect positive predictions and negative predictions. The hybrid CLST model together with SMOTE preprocessing and model parameter optimization achieved 99.98% accuracy. Additionally, the accuracy rate for SVM reached 98% and LR achieved 97% accuracy, reinforcing the model comparison. The hybrid detection method proved more effective than baseline methods, achieving detection rates of 99.98%. This model achieves high accuracy by detecting spatiotemporal patterns while managing class imbalance through SMOTE.
The model performance evaluation shown in Table 6 demonstrates how hyperparameter tuning influenced the pre-tuning and post-tuning metrics. The four key fraud detection metrics of precision, recall, F1-score, and AUC-ROC are used to evaluate the model.
Table 6.
Results of the CLST model.
4.3.1. Performance Comparison with and Without Hyperparameter Tuning
The ROC-AUC score of the model improved significantly after implementing hyperparameter optimization, as shown in the performance comparison. The model achieved an ROC-AUC of 0.9733 along with a precision of 0.70, recall of 0.83, and F1-score of 0.76 prior to tuning execution for fraud detection, as shown in Table 7.
Table 7.
Performance metrics without hyperparameter tuning.
The metrics demonstrate a slight compromise in false positive and false negative identifications. The ROC-AUC score reached 0.9995 after hyperparameter optimization, demonstrating virtually faultless classification ability. Model precision increased to 0.83 due to fine-tuning, which reduced unnecessary false alarm alerts while reaching 99% recall, preventing the mistake of overlooking fraud transactions. The F1-score reached 0.91 after optimization due to the enhanced precision–recall balance in Table 8. The model achieved superior performance results during hyperparameter tuning, especially when detecting fraudulent activities.
Table 8.
Performance metrics with hyperparameter tuning.
Table 9 compares the model scores before and after application of hyperparameter tuning. Using the improved algorithm allowed for improved results in terms of precision, recall, and F1-score in all classes, but especially for the minority fraud class. The results show that it is beneficial to examine the percentage increases through hyperparameter optimization.
Table 9.
The relative percentage improvements in performance before and after applying hyperparameter tuning.
4.3.2. Optimizing Model Performance: A Comparative Analysis
The bar chart compares key performance metrics before and after hyperparameter tuning. The tuned model (orange bars) demonstrates considerable improvements, particularly in the fraud detection metrics of precision, recall, and F1-score, as illustrated in Figure 7.
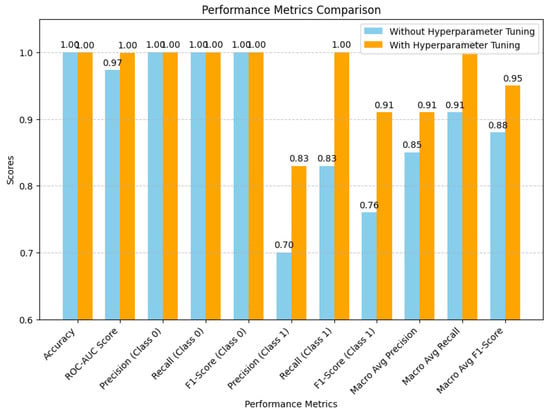
Figure 7.
Elevated model performance with hyperparameter tuning.
Figure 8 shows the ROC-AUC curve and explains its significance. The ROC curve plots the tradeoff between true positive rate (TPR) and false positive rate (FPR). An AUC close to 1.0 means that the model performs exceptionally well.
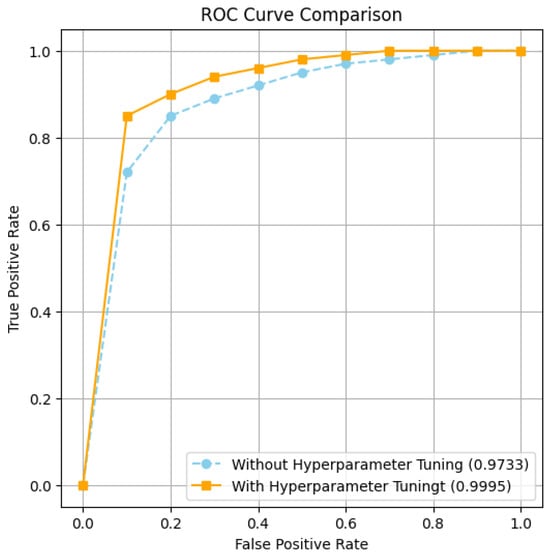
Figure 8.
ROC-AUC curve for the CLST model.
4.3.3. Model Convergence Analysis: Accuracy and Loss Insights
Figure 9 and Figure 10 depict the trends in training and validation accuracy and loss over multiple epochs for the CLST hybrid fusion model. The accuracy curve shows a steady increase in both training and validation accuracy, indicating effective learning and model convergence. The loss curve shows a significant decline in both training and validation loss, indicating that the model effectively minimizes errors during training. Occasional fluctuations in validation loss suggest minor overfitting which has been mitigated through hyperparameter tuning. These results highlight the model’s robustness and enhanced generalization capabilities in credit card fraud detection.
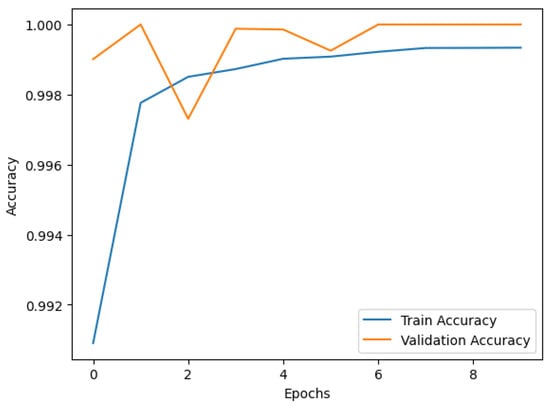
Figure 9.
Training and validation accuracy over epochs.
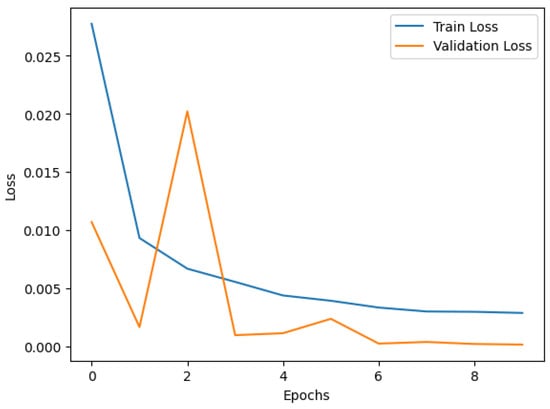
Figure 10.
Training and validation loss over epochs.
4.4. Deep Learning vs. Traditional Models: A Comparative Analysis for Fraud Detection
The bar chart in Figure 11 compares the accuracy of the SVM, LR, and CLST models. The CLST model outperforms conventional machine learning models in achieving maximum accuracy, while LR and SVM rank second and third in terms of accuracy, respectively.
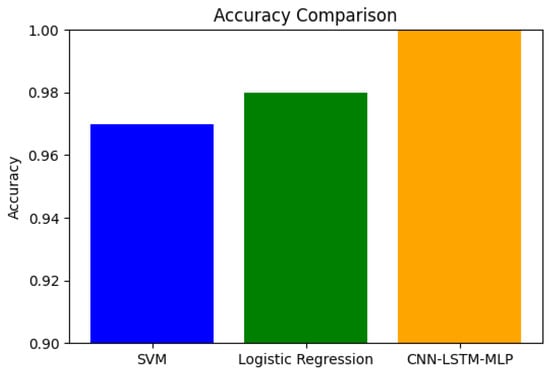
Figure 11.
Accuracy comparison of SVM, LR, and CLST.
4.5. Ten-Fold Cross Validation
To thoroughly validate the effectiveness of the proposed model, a ten-fold cross-validation strategy was employed. The results summarized in Table 10 reveal consistently outstanding performance across all folds. The model achieves an impressive average accuracy of 99.89%, with individual fold scores ranging from 99.83% to 99.99%. Alongside high accuracy, the loss values remain remarkably low, averaging just 0.0101. Notably, the model exhibits excellent stability with a standard deviation of only ±0.03, indicating minimal variation between folds. These results collectively demonstrate that the proposed model not only delivers high predictive accuracy but also maintains robust performance across different data partitions, highlighting its generalization capability for credit card fraud detection.
Table 10.
Proposed model performance validation results.
The box plot in Figure 12 shows how the accuracy scores changed during all ten folds used in cross-validation. This figure proves that the model performs reliably and consistently for every data split.
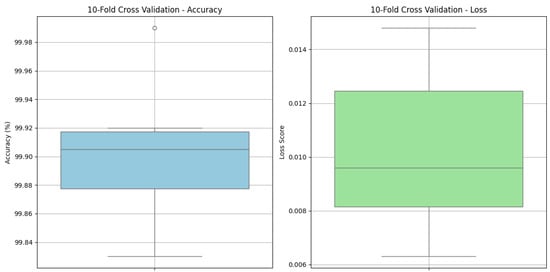
Figure 12.
Box plot analysis for all ten folds.
4.6. Computational Efficiency Analysis
Table 11 shows the runtime performance of our proposed CLST model during the training and inference phases. All experiments were conducted using an NVIDIA RTX 3080 GPU (8 GB VRAM), Intel Core i7 processor, and 16 GB of RAM. This process yielded the best configuration, achieving a validation accuracy of 0.99. Model training spanned 20 epochs, each taking an average of 18 s for a total of roughly 6 min. The model demonstrated exceptional throughput during inference, processing over 1 million transactions per second. This performance makes it highly suitable for deployment in real-time financial systems.
Table 11.
Runtime performance of the proposed CLST model.
4.7. Ablation Experiments
An ablation study was conducted to evaluate the contribution of each component in the proposed architecture. We tested six configurations: MLP-only, CNN-only, LSTM-only, CLST (without the dense layer), CLST (without feature fusion), and the final proposed model with complete feature fusion. As shown in Table 12, the results improve progressively as more components are integrated. The final model combining spatial, temporal, and dense feature learning performs the best (precision = 0.83, recall = 1.00, F1-score = 0.91, ROC-AUC = 0.9995).
Table 12.
Ablation study comparing model variants.
4.8. State-of-the-Art Comparison
Detection of credit card fraud represents a complex challenge that companies are currently seeking to resolve through different deep learning and machine learning methods. Table 13 presents an evaluation of new fraud detection approaches and compares their features to those of our proposed CLST hybrid fusion model. These studies all used the same Kaggle credit card fraud dataset as we used this research.
Table 13.
Comparisonwith state-of-the-art models.
4.9. Discussions
In this study, we have developed an effective credit card fraud detection system that fits modern fraudulent schemes and maintains high performance without scalability issues. The proposed model offers improved detection performance while reducing operational expenses by minimizing false alarm instances for financial organizations. Future work should extend this model to more varied types of financial fraud, including insurance fraud and identity theft, while developing federated learning methods to enhance security in decentralized systems. The proposed CLST combination establishes a significant evolution in credit card fraud prevention, equipping financial institutions globally with a dependable solution.
The proposed CLST model for credit card fraud detection offers several advantages by leveraging the strengths of both CNNs and LSTMs. The CNN component excels at automatically extracting intricate hierarchical features from the transactional data, thereby identifying subtle patterns that might be missed by traditional feature engineering. Subsequently, the LSTM network effectively captures the temporal dependencies and sequential patterns within these features, which is crucial for understanding the sequence of transactions leading up to a fraudulent activity. This hybrid approach allows the model to learn both the spatial characteristics of individual transactions and the temporal evolution of user behavior, leading to a more robust and accurate detection of fraudulent activities compared to models relying on either CNNs or LSTMs alone.
Future investigations will explore various approaches for credit card fraud detection using the CLST hybrid fusion model, as it has been shown to deliver superior detection accuracy. Future implementations will integrate leading-edge feature selection approaches to enhance the interpretation and performance of the forecasting model. The real-time deployment of the model for streaming data analysis would generate crucial insights about its practical use in operational settings. Additional studies should focus on developing methods to explain artificial intelligence approaches in order to build transparency and trust in future fraud detection systems. In addition, future researchers must conduct testing of various crossover configurations between transformer-based models and graph neural networks (GNNs) in order to enhance detection model outcomes. Improving fraud patterns across multiple domains in the dataset would also enhance the model’s ability to work with standard bank institutions.
5. Conclusions
A highly effective hybrid model comprising CLST is presented in this research to detect credit card fraud, overcoming the challenges of both traditional methods and individual deep learning models. The proposed model achieves outstanding results in fraudulent transaction detection by combining a CNN for spatial feature extraction with an LSTM for temporal pattern learning and a fully connected output layer for classification. Advanced preprocessing techniques such as SMOTE combined with thorough hyperparameter optimization are used to resolve class imbalance problems. The proposed hybrid approach delivers enhanced model accuracy and operational strength. The hybrid system achieves 99.98% accuracy, surpassing standard models and individual deep learning solutions. The model achieves superior fraud detection results based on the following metrics: precision = 91%; recall = 99%; F1-score = 95%., showing a decrease in all types of detection errors. An ROC-AUC of 0.9995 provides evidence of the model’s strong ability to properly identify both fraudulent and authentic transaction types. The model demonstrated suitable scalability during our tests, successfully managing 1 million transactions per second in a simulated real-world environment, making deployment in large-scale financial systems possible.
Author Contributions
Conceptualization, M.J., S.R., A.R., N.L.F., M.S. and S.W.L.; Methodology, M.J., S.R., N.L.F., M.S. and S.W.L.; Software, M.J., A.R. and N.L.F.; Validation, S.R., A.R. and M.S.; Formal analysis, M.J., A.R. and N.L.F.; Investigation, S.R.; Data curation, A.R.; Writing—original draft, M.J., S.R., A.R. and N.L.F.; Writing—review & editing, M.S. and S.W.L.; Visualization, M.J. and N.L.F.; Supervision, S.R., M.S. and S.W.L.; Funding acquisition, M.S. and S.W.L. All authors have read and agreed to the published version of the manuscript.
Funding
This research was supported by the SungKyunKwan University and the BK21 FOUR (Graduate School Innovation) funded by the Ministry of Education (MOE, Korea) and National Research Foundation of Korea (NRF). This work was also supported by National Research Foundation (NRF) grants funded by the Ministry of Science and ICT (MSIT) and Ministry of Education (MOE), Republic of Korea (NRF[2021-R1-I1A2(059735)]; RS[2024-0040(5650)]; RS[2024-0044(0881)]; RS[2019-II19(0421)]).
Data Availability Statement
The Credit Card Fraud Detection dataset is available from the Kaggle repository [24]. Further information can be requested directly from the first/corresponding authors.
Conflicts of Interest
The authors declare no conflicts of interest.
References
- Abakarim, Y.; Lahby, M.; Attioui, A. An efficient real-time model for credit card fraud detection based on deep learning. In Proceedings of the 12th International Conference on Intelligent Systems: Theories and Applications, Rabat, Morocco, 24–25 October 2018; pp. 1–7. [Google Scholar] [CrossRef]
- Hlouli, F.Z.E.; Riffi, J.; Mahraz, M.A.; Yahyaouy, A.; Fazazy, K.E.; Tairi, H. Credit card fraud detection: Addressing imbalanced datasets with a multi-phase approach. Soc. Netw. Comput. Sci. 2024, 5, 173. [Google Scholar] [CrossRef]
- Ileberi, E.; Sun, Y.; Wang, Z. A machine learning based credit card fraud detection using the GA algorithm for feature selection. J. Big Data 2022, 9, 24. [Google Scholar] [CrossRef]
- Ileberi, E.; Sun, Y.; Wang, Z. Performance evaluation of machine learning methods for credit card fraud detection using SMOTE and AdaBoost. IEEE Access 2021, 9, 165286–165294. [Google Scholar] [CrossRef]
- Ileberi, E.; Sun, Y. A Hybrid Deep Learning Ensemble Model for Credit Card Fraud Detection. IEEE Access 2024, 12, 175829–175838. [Google Scholar] [CrossRef]
- Mienye, I.D.; Sun, Y. A machine learning method with hybrid feature selection for improved credit card fraud detection. Appl. Sci. 2023, 13, 7254. [Google Scholar] [CrossRef]
- Kim, J.; Kim, H.J.; Kim, H. Fraud detection for job placement using hierarchical clusters-based deep neural networks. Int. J. Speech Technol. 2019, 49, 2842–2861. [Google Scholar] [CrossRef]
- Bandaranayake, B. Fraud and corruption control at the education system level: A case study of the Victorian Department of Education and early childhood development in Australia. J. Cases Educ. Leadersh. 2014, 17, 34–53. [Google Scholar] [CrossRef]
- Molina, D.; LaTorre, A.; Herrera, F. SHADE with iterative local search for large-scale global optimization. In Proceedings of the IEEE Congress on Evolutionary Computation (CEC), Rio de Janeiro, Brazil, 8–13 July 2018; pp. 1–8. [Google Scholar] [CrossRef]
- Esenogho, E.; Mienye, I.D.; Swart, T.G.; Aruleba, K.; Obaido, G. A neural network ensemble with feature engineering for improved credit card fraud detection. IEEE Access 2022, 10, 16400–16407. [Google Scholar] [CrossRef]
- Mienye, I.D.; Ainah, P.K.; Emmanuel, I.D.; Esenogho, E. Sparse noise minimization in image classification using genetic algorithm and DenseNet. In Proceedings of the Conference on Information Communication Technology and Society (ICTAS), Durban, South Africa, 10–11 March 2021; pp. 103–108. [Google Scholar]
- Ghimire, S.; Deo, R.C.; Casillas-Pérez, D.; Salcedo-Sanz, S.; Sharma, E.; Ali, M. Deep learning CNN-LSTM-MLP hybrid fusion model for feature optimizations and daily solar radiation prediction. Measurement 2022, 202, 111759. [Google Scholar] [CrossRef]
- Alghofaili, Y.; Albattah, A.; Rassam, M.A. A financial fraud detection model based on LSTM deep learning technique. J. Appl. Secur. Res. 2020, 15, 498–516. [Google Scholar] [CrossRef]
- Benghazi, I.; Douzi, S.; El Ouahidi, B.; Jaafari, J. Enhanced credit card fraud detection based on attention mechanism and LSTM deep model. J. Big Data 2021, 8, 151. [Google Scholar]
- Btoush, E.A.L.M.; Zhou, X.; Gururajan, R.; Chan, K.C.; Genrich, R.; Sankaran, P. A systematic review of literature on credit card cyber fraud detection using machine and deep learning. PeerJ Comput. Sci. 2023, 9, e1278. [Google Scholar] [CrossRef] [PubMed]
- Khan, S.; Naseer, M.; Hayat, M.; Zamir, S.W.; Khan, F.S.; Shah, M. Transformers in vision: A survey. ACM Comput. Surv. 2022, 54, 1–41. [Google Scholar] [CrossRef]
- Mienye, I.D.; Jere, N. A survey of decision trees: Concepts, algorithms, and applications. IEEE Access 2024, 12, 86716–86727. [Google Scholar] [CrossRef]
- Hu, S.; Zhang, Z.; Luo, B.; Lu, S.; He, B.; Liu, L. BERT4ETH: A pretrained transformer for Ethereum’s fraud detection. In Proceedings of the ACM Web Conference, Austin, TX, USA, 30 April 2023– 4 May 2023; pp. 2189–2197. [Google Scholar]
- Mishra, K.N.; Pandey, S.C. Fraud prediction in smart societies using logistic regression and k-fold machine learning techniques. Wirel. Pers. Commun. 2021, 119, 1341–1367. [Google Scholar] [CrossRef]
- Seera, M.; Lim, C.P.; Kumar, A.; Dhamotharan, L.; Tan, K.H. An intelligent payment card fraud detection system. Ann. Oper. Res. 2024, 334, 445–467. [Google Scholar] [CrossRef]
- Abdul Salam, M.; Fouad, K.M.; Elbably, D.L.; Elsayed, S.M. Federated learning model for credit card fraud detection with data balancing techniques. Neural Comput. Appl. 2024, 36, 6231–6256. [Google Scholar] [CrossRef]
- Yu, C.; Xu, Y.; Cao, J.; Zhang, Y.; Jin, Y.; Zhu, M. Credit card fraud detection using advanced transformer model. In Proceedings of the 2024 IEEE International Conference on Metaverse Computing, Networking, and Applications (MetaCom), Hong Kong, China, 12–14 August 2024; pp. 343–350. [Google Scholar]
- Deng, T.; Bi, S.; Xiao, J. Transformer-Based Financial Fraud Detection with Cloud-Optimized Real-Time Streaming. In Proceedings of the 2024 5th International Conference on Big Data Economy and Information Management, Zhengzhou, China, 13–15 December 2024; pp. 702–707. [Google Scholar]
- Group, M.L. Credit Card Fraud Detection. 2018. Available online: https://www.kaggle.com/datasets/mlg-ulb/creditcardfraud (accessed on 17 October 2023).
- Elreedy, D.; Atiya, A.F. A comprehensive analysis of synthetic minority oversampling technique (SMOTE) for handling class imbalance. Inf. Sci. 2019, 505, 32–64. [Google Scholar] [CrossRef]
- Raza, A.; Younas, F.; Siddiqui, H.U.R.; Rustam, F.; Villar, M.G.; Alvarado, E.S.; Ashraf, I. An improved deep convolutional neural network-based YouTube video classification using textual features. Heliyon 2024, 10, e35812. [Google Scholar] [CrossRef]
- Thalji, N.; Raza, A.; Islam, M.S.; Samee, N.A.; Jamjoom, M.M. Ae-net: Novel autoencoder-based deep features for sql injection attack detection. IEEE Access 2023, 11, 135507–135516. [Google Scholar] [CrossRef]
- Dhillon, A.; Verma, G.K. Convolutional neural network: A review of models, methodologies, and applications to object detection. Prog. Artif. Intell. 2020, 9, 85–112. [Google Scholar] [CrossRef]
- Moodi, Y.; Ghasemi, M.; Mousavi, S.R. Estimating the compressive strength of rectangular fiber reinforced polymer–confined columns using multilayer perceptron, radial basis function, and support vector regression methods. J. Reinf. Plast. Compos. 2020, 41, 130–146. [Google Scholar] [CrossRef]
Disclaimer/Publisher’s Note: The statements, opinions and data contained in all publications are solely those of the individual author(s) and contributor(s) and not of MDPI and/or the editor(s). MDPI and/or the editor(s) disclaim responsibility for any injury to people or property resulting from any ideas, methods, instructions or products referred to in the content. |
© 2025 by the authors. Licensee MDPI, Basel, Switzerland. This article is an open access article distributed under the terms and conditions of the Creative Commons Attribution (CC BY) license (https://creativecommons.org/licenses/by/4.0/).