Abstract
This paper presents MS-MTSA, a multi-scale multi-type self-attention network designed to enhance AV1-compressed video through targeted post-filtering. The objective is to address two persistent artifact issues observed in our previous MTSA model: visible seams at patch boundaries and grid-like distortions from upsampling. To this end, MS-MTSA introduces two key architectural enhancements. First, multi-scale block-wise self-attention applies sequential attention over 16 × 16 and 12 × 12 blocks to better capture local context and improve spatial continuity. Second, refined patch-wise self-attention includes a lightweight convolutional refinement layer after upsampling to suppress structured artifacts in flat regions. These targeted modifications significantly improve both perceptual and quantitative quality. The proposed network achieves BD-rate reductions of 12.44% for Y, 21.70% for Cb, and 19.90% for Cr compared to the AV1 anchor. Visual evaluations confirm improved texture fidelity and reduced seam artifacts, demonstrating the effectiveness of combining multi-scale attention and structural refinement for artifact suppression in compressed video.
MSC:
94A08
1. Introduction
The rapid adoption of ultra-high-definition (UHD) video formats such as 4K, 8K, and HDR has significantly increased the demand for more efficient video compression standards. The Alliance for Open Media (AOM), comprising major technology companies including Google, Netflix, Amazon, and Microsoft, developed the AOMedia Video 1 (AV1) codec to address these needs. AV1 achieves substantial compression efficiency gains—exceeding 30%, compared to its predecessor VP9 and the widely used HEVC codec [1,2,3]. Despite these advances, AV1 compression still introduces noticeable visual artifacts such as blocking, ringing, and loss of fine detail, motivating further research into post-filtering techniques to enhance visual quality.
In our previous work, we introduced the multi-type self-attention (MTSA) network, designed specifically to suppress compression artifacts in AV1-coded video [4]. MTSA integrates three complementary forms of self-attention—channel-wise, block-wise, and patch-wise—into a residual convolutional neural network framework. Each attention mechanism targets distinct feature relationships: channel-wise self-attention (CWSA) recalibrates inter-channel dependencies, block-wise spatial self-attention (BWSSA) captures local spatial context within non-overlapping regions, and patch-wise self-attention (PWSA) models broader spatial relationships across entire patches. Applied to AV1-compressed sequences, MTSA significantly improved both objective and subjective video quality, achieving BD-rate reductions of 10.40% for the Luma component, and 19.22% and 16.52% for the Chroma components. The overall network structure is shown in Figure 1.
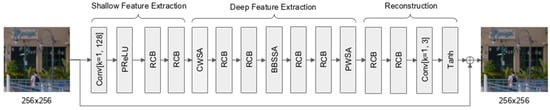
Figure 1.
Original MTSA-based CNN.
Despite these gains, qualitative analysis of MTSA’s outputs highlighted two key architectural challenges that limited its ultimate visual quality, specifically when processing video compressed at high QP values (e.g., QPs of 55 and 63, corresponding to lower quality and higher compression). These issues were not readily apparent at lower QPs. The first novel challenge was achieving seamless inter-patch continuity. While MTSA effectively reduced AV1 blocking artifacts within its 256 × 256 processing patches, its non-overlapping patch strategy struggled to perfectly harmonize transitions at patch edges under these high QP conditions, frequently resulting in visible seam artifacts as shown in Figure 2a. This also impacted the uniform reduction in blockiness across the entire frame in such scenarios. The second distinct challenge was associated with MTSA’s PWSA module. When processing high QP inputs, MTSA’s outputs occasionally exhibited subtle upsampling-induced pixelation artifacts, appearing as small, block-aligned regions of erroneous pixel values, as shown in Figure 2b. These artifacts, observed in conjunction with the PWSA module’s upsampling stage, proved particularly difficult to resolve with superficial modifications, indicating that more integrated architectural solutions capable of fostering different learning dynamics were required, especially for heavily compressed content. The video frames shown in Figure 2 are taken from the AVM-CTC sequences [5].

Figure 2.
Visual examples of remaining artifacts in the original MTSA output. (a) Example frame from the Class A2 sequence PedestrianArea, with a zoomed-in view of the boundary region, indicated by yellow box, showing visible seams due to patch-level discontinuity. (b) Example frame from the Class A1 sequence NocturneDance, with a zoomed-in view of the boxed region revealing 16 × 16 grid-aligned artifacts introduced by the transposed convolution in the patch-wise self-attention module.
MS-MTSA incorporates targeted advancements. Firstly, to enhance spatial continuity and the uniformity of artifact reduction, particularly for heavily compressed video, the BWSSA module is extended into a sequential multi-scale configuration. This involves applying an additional attention stage with a 12 × 12 block size after the original 16 × 16 stage. Because these grids are not spatially aligned, their differing pixel groupings allow the network to capture inconsistencies overlooked by a single-scale layout, improving sensitivity to texture variations and structural continuity at boundaries, thereby directly addressing the seam artifacts prevalent at high QPs. Secondly, the patch-wise self-attention module is architecturally enhanced to a refined PWSA by integrating a lightweight convolutional refinement block after its upsampling stage. The thoughtful integration of this refined PWSA module into the MS-MTSA architecture, when trained end-to-end, is key to effectively mitigating the previously observed pixelation artifacts, as it appears to enable the network to learn more robust internal representations from the beginning, especially when dealing with high QP inputs. To further support these enhancements and promote inter-patch coherence, particularly under challenging high QP conditions, the input patch size is increased from 256 × 256 to 264 × 264, and a slight overlap between adjacent patches is introduced by maintaining a 256-pixel extraction stride.
These architectural advancements, collectively termed multi-scale MTSA (MS-MTSA), consistently outperform the original MTSA in both objective and subjective evaluations. Beyond numerical improvements, MS-MTSA leads to visibly reduced seam artifacts and enhanced texture continuity, effectively addressing the residual artifacts of the previous model. These results demonstrate that thoughtful, targeted adjustments in an attention-based framework can significantly enhance post-filtering performance.
The remainder of this paper is organized as follows: Section 2 reviews related work; Section 3 describes the proposed architectural enhancements in detail; Section 4 presents comprehensive experimental results, including visual and quantitative comparisons; Section 5 discusses insights from ablation studies and architectural decisions; and Section 6 concludes the paper by summarizing key findings and highlighting directions for future research.
2. Related Work
Neural networks have become increasingly prominent in enhancing video compression quality, primarily through two distinct paradigms: in-loop filtering and post-filtering. In-loop filtering integrates enhancement directly within the video codec loop, allowing real-time improvements and potentially higher coding efficiency by influencing encoding decisions [6,7,8,9]. This integration enables effective artifact reduction but requires modification to the codec itself, reducing flexibility, particularly for established standards, including AV1 [2,3]. Post-filtering, conversely, operates as a separate module after decoding is complete [10,11,12,13,14]. This approach offers high adaptability, preserving bitstream compatibility and avoiding alterations to standardized codecs, including AV1. While potentially not achieving the theoretical peak efficiency of tightly integrated in-loop methods, its flexibility makes post-filtering highly suitable for improving the quality of widely adopted, finalized codecs. Considering these factors, the post-filtering paradigm was selected for this research, focusing on decoder-side quality enhancement for the standardized AV1 codec without requiring modifications to the encoding pipeline.
Post-filtering techniques have been extensively developed, particularly for the High Efficiency Video Coding (HEVC) [15] and Versatile Video Coding (VVC) [16] standards. Early efforts for HEVC included multi-frame methods, such as MFQE 2.0, which leverage temporal information from adjacent high-quality frames to improve consistency [10], and partition-aware adaptive networks that tailor processing based on coding structures [11]. With VVC, research shifted towards deeper architectures, such as CNN-based approaches tailored for random access configurations [12], MFRNet utilizing multi-level residual dense blocks [13], and hybrid approaches such as DFNN fusing CNNs and transformers to capture both local and global dependencies [14]. The exploration of transformer-based architectures for video restoration has since expanded. Methods such as TVQE by Yu et al. [17] and CTVE by Li et al. [18] apply pure or hybrid transformer designs to enhance HEVC quality. Other systems have leveraged transformers for broader restoration tasks, including NTIRE competition entries like PTTSR by Zheng et al. [19], as well as specialized models like FTVSR by Qiu et al. [20] for frequency-domain super-resolution and STRS-VVC by Ma et al. [21] for intra-frame enhancement of VVC-compressed content. Other strategies have focused on adapting the filtering process based on video content [22] or quantization parameters (QP) [23] to optimize enhancement locally. While demonstrating significant gains on those codecs, many such methods, including these advanced transformer-based approaches, focus on general quality uplift or coding efficiency metrics established for HEVC and VVC.
While post-filtering for HEVC and VVC is well-established, the unique architecture of AV1 [2,3], despite its advanced compression efficiency, can also lead to characteristic visual artifacts that motivate specialized post-filtering. Common among these are grid-induced distortions, often appearing as blocking artifacts. These primarily stem from the quantization applied to coefficient data within AV1’s complex hierarchy of variably sized and shaped transform blocks. Coarse quantization, especially at lower bitrates, results in a loss of high-frequency information, making the underlying block structure perceptible. Another prevalent issue is visible seams or discontinuities. In AV1, these can arise from boundaries between its adaptively partitioned coding structures, such as large coding units (CUs) or superblocks, particularly if adjacent regions are encoded with widely different parameters, including aspects like prediction modes and quantization levels. In such cases, the standard in-loop filters—for instance, the constrained directional enhancement filter (CDEF) and the loop restoration filter (LRF)—may not fully ameliorate these transitions. Furthermore, AV1’s tiling feature, while designed to facilitate parallel processing, can generally introduce subtle discontinuities at tile boundaries if inter-tile filtering and dependencies are not perfectly managed.
Corresponding techniques specifically tailored for the AV1 codec remain comparatively less explored. Some initial efforts demonstrated feasibility, such as the CNN-based approach by Zhang et al. applicable to both VVC and AV1 [24]. Building directly on AV1 post-filtering, our previous work introduced the multi-type self-attention (MTSA) network [4]. MTSA employed multi-type self-attention and achieved significant BD-rate reductions. However, qualitative analysis revealed that MTSA still suffered from residual artifacts. It is important to note that the “seam discontinuities” primarily addressed by our current work (MS-MTSA) are a consequence of limitations in MTSA’s original patch-based processing methodology, specifically in ensuring seamless transitions between independently processed patches. MTSA also exhibited upsampling-induced pixelation artifacts appearing as small, block-aligned regions of erroneous pixel values, potentially linked to its PWSA upsampling stage. Recent interest in advancing AV1 post-decoding quality is evident in works such as Ramsook and Kokaram’s adversarially trained enhancer, which operates within an end-to-end system often involving pre-downsampling and super-resolution [25]; Jiang et al.’s real-time super-resolution model (RTSR) specifically designed for upscaling AV1 compressed content [26]; and the transformer-diffusion based model by Dehaghi et al. (DiQP) [27], which targets high-resolution 8K AV1 and HEVC video restoration. While these methods showcase significant progress in AV1 video enhancement, they often focus on distinct paradigms such as end-to-end optimization, super-resolution from pre-downscaled inputs, or restoration of ultra-high-resolution content using highly complex architectures. Nonetheless, effectively mitigating the specific boundary artifacts from patch-based processing and the upsampling-induced pixelation observed in advanced attention-based models such as MTSA remains an open challenge, representing the key research gap addressed in this paper.
To further contextualize the landscape of existing solutions and the specific contributions of this work, a comparative summary of the aforementioned related methods is provided in Table 1 at the end of this section. When reviewing this table, particularly the “Reported Gains” are cited directly from the respective publications and are typically measured against varying codec baselines (such as HM, VTM, VTM-NNVC, or specialized AV1 anchors) and under unique experimental conditions, including different datasets and QP ranges. Consequently, a direct numerical comparison of these performance figures across studies is generally not meaningful due to these inherent variations. The primary purpose of this table is therefore to offer a contextual overview of the types of improvements and methodologies prevalent in the field, rather than to serve as a direct quantitative benchmark between all listed methods.

Table 1.
Summary of deep learning-based enhancement methods for compressed video.
Drawing from the preceding literature review and the comparative details in Table 1, several persistent challenges and open research avenues in AV1 post-filtering can be identified. Firstly, while many advanced techniques target HEVC/VVC (e.g., [10,11,12,13,14,17,18,19,21,22,23]), a comparative scarcity of methods specifically architected as standalone, decoder-side post-filters for AV1’s unique characteristics persists. Secondly, some recent AV1 enhancers, like those described in [25,26,27], address different paradigms, such as end-to-end systems, super-resolution, or ultra-high-resolution restoration, rather than focusing on dedicated same-resolution artifact reduction for conventionally encoded AV1 streams. Thirdly, the previously described limitations of MTSA [4]—namely, seam artifacts and upsampling-induced pixelation—highlight the difficulty of designing AV1-specific attention models that maintain consistency across patch boundaries while preserving fine detail. Consequently, effectively mitigating these varied artifacts simultaneously to improve both objective metrics and subjective visual quality remains a key research gap.
To address the specific gaps identified above and the limitations of existing approaches, this work introduces MS-MTSA—an advanced, purpose-built post-filtering architecture optimized for decoder-side enhancement of AV1-compressed video. The primary objectives of this study are to develop and evaluate targeted architectural enhancements that improve local structural coherence by reducing patch-based processing artifacts, and to mitigate upsampling-induced pixelation. These refinements aim to deliver significant improvements in both objective coding performance and subjective visual quality compared to the original MTSA and the standard AV1 baseline, while maintaining full compatibility with the decoder pipeline.
3. Proposed Method
This work presents an advanced architecture, MS-MTSA, which builds upon the MTSA network originally developed to suppress compression artifacts and enhance the visual quality of AV1-decoded video. The network retains its original three-stage structure: shallow feature extraction, deep feature extraction, and image reconstruction. Architectural modifications were introduced primarily in the deep and reconstruction stages to improve feature representation and output stability. The full architecture is illustrated in Figure 3, with modified layers highlighted.

Figure 3.
Modified MTSA-based CNN architecture.
The shallow feature extractor consists of three components: a point-wise convolutional layer transforming the input from 3 to 128 channels, a parametric rectified linear unit (PReLU) activation function, and two residual convolution blocks (RCBs). The PReLU activation [29] is an extension of the ReLU function that introduces a learnable slope for the negative input region, thereby allowing the network to adaptively control the flow of negative information. This flexibility reduces the likelihood of inactive neurons and supports smoother gradient propagation during the early stages of training. The shallow feature extraction module is responsible for capturing low-level spatial features such as edges and textures, which are essential for accurate reconstruction in later stages. Combined with residual learning, this structure helps stabilize early optimization and improves downstream feature learning by preserving fine-grained low-level information essential for artifact removal.
The deep feature extraction module forms the core of the network and is the primary focus of architectural enhancement in this work. The original MTSA architecture employed three complementary self-attention mechanisms—CWSA, BWSSA, and PWSA—interleaved with RCBs to enhance intermediate representations. In the enhanced version, BWSSA is extended to a multi-scale configuration by introducing an additional attention layer operating on 12 × 12 blocks, applied sequentially after the original 16 × 16 BWSSA. This enables the network to better capture both coarse and fine-grained spatial context in a progressive manner. In addition, the PWSA module is modified to include a lightweight convolutional refinement block after the transposed convolution, which helps reduce grid-aligned artifacts and improves continuity across patch boundaries. To support the 12 × 12 block structure while maintaining alignment, the input patch size is increased from 256 × 256 to 264 × 264, providing sufficient coverage for both attention scales.
The image reconstruction module is responsible for generating the final residual correction map from the refined deep features. While the original version consisted of two RCBs with padding followed by a point-wise convolution and a Tanh activation, the updated reconstruction design introduces an additional RCB at the beginning to improve representational capacity and stabilize training. The final two RCBs are replaced with no-padding variants, which are marked as RCB-NP in Figure 3, which effectively reduce the spatial dimensions from 264 × 264 to 256 × 256, eliminating the need for explicit cropping. This integrated downscaling ensures that the output patch size remains consistent with the original design and aligns with the AV1 superblock structure. The point-wise convolution and Tanh activation from the original architecture are retained to ensure bounded residual outputs.
To support both 16 × 16 and 12 × 12 BWSSA with proper alignment, 4-pixel replicate padding is applied on all sides of each decoded frame. From the padded frame, 264 × 264 patches are extracted using a stride of 256, ensuring full coverage and slight overlap between adjacent patches. The network processes each patch independently and produces a 256 × 256 output, which aligns seamlessly with neighboring patches when reassembled. This strategy preserves spatial continuity across patch boundaries while enabling efficient block-level attention computation.
3.1. Shallow Feature Extraction
The shallow feature extraction part, shown in Figure 3, constitutes the initial stage of the proposed network. This module is responsible for capturing low-level visual features from the input frame, which are critical for preserving textures, edges, and fine structural details throughout the enhancement process. In image restoration tasks such as denoising and super-resolution, shallow convolution layers have been widely adopted due to their ability to stabilize early optimization and enhance downstream learning performance [30].
The shallow feature extractor consists of three components: a point-wise convolutional layer transforming the input from 3 to 128 channels, a PReLU activation function, and two RCBs. Each RCB, as illustrated in Figure 4a, follows the residual learning paradigm introduced in ResNet [31], and includes two 3 × 3 convolutional layers, each followed by batch normalization layers and a PReLU activation, with a residual connection bridging the input and output. This structure allows the network to effectively extract and refine local features while maintaining stable gradient flow during training. These low-level features provide the foundation for mitigating artifacts introduced by AV1 compression in the subsequent stages of the network.
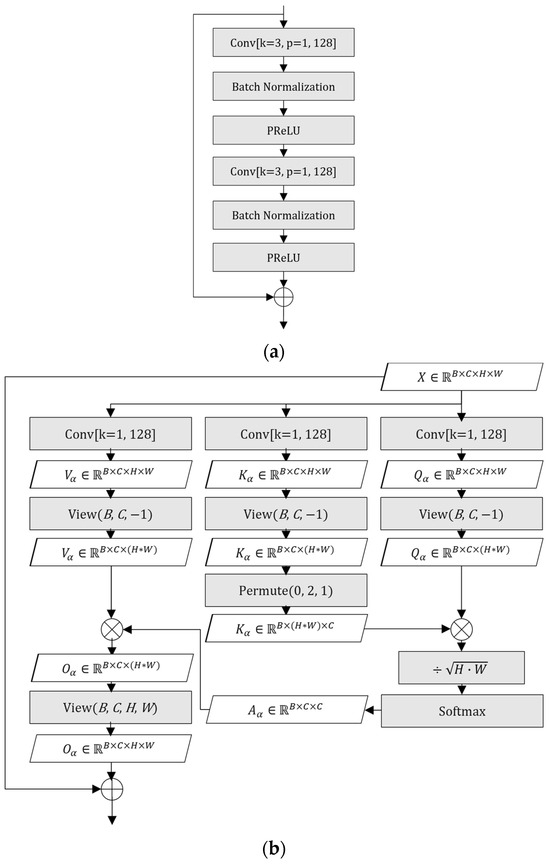
Figure 4.
(a) Block diagram of RCB; (b) block diagram of CWSA.
3.2. Deep Feature Extraction
3.2.1. Channel-Wise Self-Attention
The first self-attention module in the deep feature extraction stage is CWSA, which models global interdependencies across feature channels. Although the raw luminance (Y), blue-difference chrominance (Cb), and red-difference chrominance (Cr) components are fused into a shared feature space during shallow feature extraction, the resulting intermediate channels still encode distinct luminance and chrominance cues. CWSA enhances the network’s ability to exploit these cues by learning how different feature channels relate to one another. Notably, the authors of [32] applied a similar channel-wise attention strategy in the HOP in-loop filtering framework developed for NNVC, where it led to improved chroma reconstruction. Although designed for a different codec, this result underscores the general effectiveness of channel-wise attention in suppressing chroma-related artifacts, which are also present in AV1-coded video.
The input tensor is projected into query, key, and value matrices using point-wise convolutions. Specifically, three separate point-wise convolutions are used to generate the query , key , and value matrices from the input tensor. These matrices are then used to compute self-attention across the channel dimension using scaled dot-product attention, and the result is added back to the input tensor through a residual connection. For a detailed mathematical formulation, we refer the reader to our earlier work [4].
Intuitively, the query matrix learns what each feature channel needs from the others in order to refine its own representation, while the key matrix defines the contextual basis for assessing inter-channel similarity. The resulting attention scores quantify the influence of each channel on the others. After Softmax normalization, these scores form a probability distribution that weights the value matrix , allowing each channel to selectively aggregate relevant features from the rest. This attention-guided redistribution of contextual importance improves color consistency and helps reduce Cb and Cr distortion. The residual connection ensures that the original representation is preserved while benefiting from this adaptive refinement. A detailed illustration of the CWSA structure, including the intermediate output shapes at each step, is shown in Figure 4b.
3.2.2. Multi-Scale Block-Wise Spatial Self-Attention
BWSSA, first introduced in our previous work [4], performs self-attention within non-overlapping spatial blocks, enabling each pixel to interact with others within its local spatial block. By limiting the receptive field to localized regions, BWSSA significantly reduces computational cost compared to full-patch attention while still capturing rich spatial dependencies within each block. This makes it particularly well-suited for enhancing AV1-coded video, where many artifacts are localized due to block-based compression.
To enhance multi-scale spatial modeling and improve structural continuity, we extend the original BWSSA design into a sequential two-stage configuration, termed multi-scale block-wise spatial self-attention (MS-BWSSA). In the first stage, self-attention is applied to 16 × 16 non-overlapping blocks (BWSSA16) to capture broad contextual structure. This is followed by a second stage using 12 × 12 blocks (BWSSA12), which enables more fine-grained refinement. Because the block grids used in the two stages are not spatially aligned, the attention regions in BWSSA12 are offset from those in BWSSA16. As a result, pixels near the boundaries of one block in the first stage may appear closer to the center in the next, allowing the network to aggregate complementary spatial information across misaligned groupings. The spatial arrangement of the two attention stages is illustrated in Figure 5. The red grid represents the padded input region of 272 × 272 used for BWSSA16, while the green grid shows the 12 × 12 block layout for BWSSA12 applied directly to the unpadded input. This overlapping configuration improves edge coverage, enhances continuity across structure transitions. Crucially, MS-BWSSA is designed to address two interrelated boundary issues: firstly, it mitigates the seam artifacts that arose from the original MTSA’s non-overlapping patch processing when applied to AV1 video. Secondly, by operating at multiple misaligned scales (16 × 16 and 12 × 12), it more effectively models and smooths discontinuities along AV1’s own inherent block boundaries, including those between major coding structures like coding units (CUs) or superblocks, which can be the underlying source of visual inconsistencies that patch-based processing might otherwise struggle to reconcile uniformly across the entire frame. This leads to a more holistic reduction in both processing-induced seams and AV1’s native block-boundary artifacts.
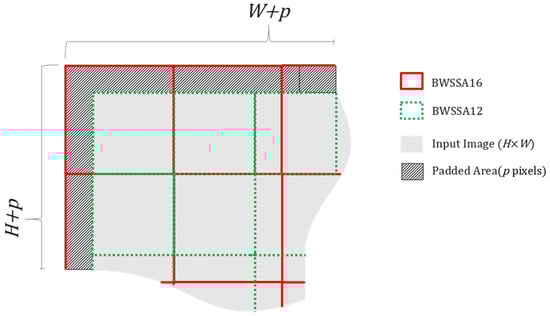
Figure 5.
Spatial arrangement of 16 × 16 blocks for BWSSA16 and 12 × 12 blocks for BWSSA12 within a 264 × 264 input patch.
To ensure full 16 × 16 block coverage during the first attention stage, BWSSA16 internally applies 4-pixel replication padding to all sides of the 264 × 264 input feature map, temporarily expanding it to 272 × 272. This guarantees that the spatial boundaries are fully enclosed within complete attention blocks, avoiding partial or incomplete regions. After the attention computation, the padded margins are cropped to restore the original spatial resolution before the residual connection is applied. In contrast, BWSSA12 operates directly on the original 264 × 264 input without additional padding, resulting in a staggered block layout relative to BWSSA16. The padding and cropping operations applied during BWSSA16 are illustrated in Figure 6a.
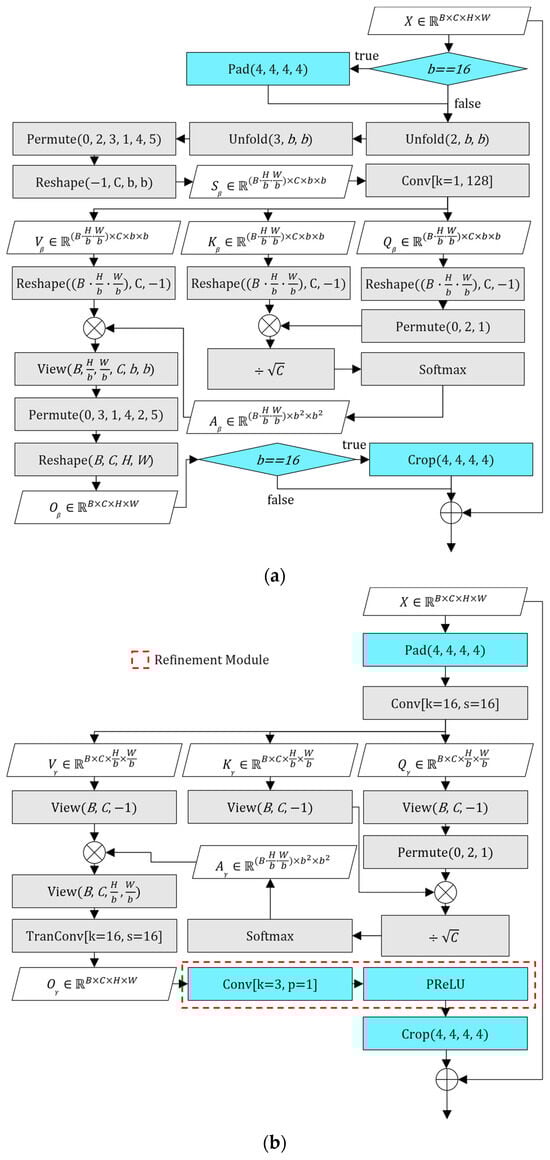
Figure 6.
(a) Block diagram of modified BWSSA; (b) block diagram of refined PWSA.
Let denote the input feature map to this module, where H, W, and C are the height, width, and number of channels, respectively, with C set to 128 and both H and W set to 264 in our network. The sequential attention process begins with BWSSA16, which applies attention over a padded version of the input and then crops the result to restore the original spatial size as follows:
Here, denotes 4-pixel replication padding applied to all spatial borders of the input feature map , temporarily expanding its resolution from 264 × 264 to 272 × 272. (⋅) denotes the intra-block attention mechanism computed over 16 × 16 non-overlapping blocks, and removes the 4-pixel margins to restore the original dimensions. The residual connection adds the original input to the refined output. The output Z represents the feature map refined by the complete BWSSA16 stage. It is then processed by BWSSA12, which operates directly on the unpadded 264 × 264 feature map, as follows:
Unlike BWSSA16, BWSSA12 applies attention directly to the unpadded 264 × 264 feature map. It uses 12 × 12 block divisions with no cropping or padding, yielding a staggered block layout. The attention function (⋅) is reused without change, and the residual path again preserves the original features. The two stages differ only in block size and input preparation: BWSSA16 includes external padding and cropping, while BWSSA12 operates directly on the unpadded input. The core attention function (⋅) remains shared and structurally identical across both stages. Both stages include residual connections to preserve the original features while incorporating attention-based refinement. Equations (1) and (2) collectively describe a progressive refinement process, where BWSSA16 captures coarse structural context using aligned 16 × 16 blocks, while BWSSA12 complements this by capturing finer, offset details using 12 × 12 blocks without padding. This staggered configuration enables broader feature coverage and allows spatial information to propagate more effectively across local boundaries. The residual connections ensure stable learning and help the network converge toward the target variable, artifact-free reconstruction, by preserving original features while integrating attention-based enhancements. This sequential, misaligned structure allows spatial information to be propagated more flexibly, enhancing perceptual continuity and reducing artifacts along various structural boundaries, including those between processing patches and those inherent to AV1’s block-based coding.
Self-attention in both BWSSA16 and BWSSA12 is computed independently within each spatial block using the same formulation as in [4]. The feature map is divided into blocks, where attention is applied using query, key, and value projections with scaled dot-product and Softmax normalization. Since this mechanism is structurally identical to our earlier design, detailed equations are omitted for brevity.
Once both attention stages are complete, the refined feature map is passed through two RCBs to further consolidate spatial information and stabilize feature distributions. The output is then forwarded to the PWSA module, where global inter-patch relationships are modeled. This local-to-global progression enables the network to suppress AV1-coded artifacts across multiple spatial scales while preserving both fine details and broader structural coherence.
3.2.3. Refined Patch-Wise Self-Attention
The final self-attention module in the deep feature extraction stage is refined PWSA, which enables the network to capture long-range dependencies across the entire spatial extent of the input [33]. While the preceding BWSSA and RCB modules effectively suppress localized distortions and enhance spatial consistency within individual regions, they lack the capacity to model broader contextual relationships. This limitation becomes particularly problematic when dealing with low-frequency artifacts—such as gradual brightness shifts, banding, or structural drift—that span multiple blocks. PWSA addresses this challenge by allowing information exchange between spatially distant regions, helping to preserve global consistency and suppress residual distortions that cannot be resolved through local attention alone.
Refined PWSA operates by dividing the input feature map into non-overlapping 16 × 16 blocks using a convolutional layer with a kernel size and stride of 16. To ensure that the entire 264 × 264 input region is evenly divisible by the block size, 4-pixel replication padding is applied to all sides, temporarily expanding the spatial dimensions to 272 × 272. This padding step differs from the original MTSA implementation, where the 256 × 256 input size was already aligned with the 16 × 16 block grid and thus required no internal padding. However, the adjustment made here is not a structural modification but a technical necessity arising from the increased input size used throughout the enhanced network. After attention computation and subsequent processing, the padded margins are cropped to restore the original spatial resolution. The complete MS-BWSSA pipeline—including padding, attention, upsampling, refinement, and cropping—is illustrated in Figure 6b.
Although refined PWSA maintains the core attention structure from the original MTSA design, this work introduces a lightweight refinement module to address the subtle upsampling-induced pixelation artifacts that were observed in the output of the original MTSA, particularly when processing high QP AV1 content. These artifacts manifest as small, block-aligned regions of erroneous pixel values, and an example is illustrated in Figure 2b. While these artifacts were associated with the upsampling stage within the original PWSA, their precise mechanism was complex, and our investigations revealed they were not effectively mitigated by simply appending a refinement layer to a pre-trained MTSA model followed by continued training.
To address this robustly, a 3 × 3 convolution, followed by a PReLU activation, is integrated after the transposed convolution within the PWSA module. Crucially, it is the incorporation of this refined PWSA structure into the MS-MTSA architecture and the subsequent end-to-end training of the entire network from scratch that proved effective in suppressing these pixelation artifacts. This approach suggests that the architectural modification, when optimized globally during the full training process, enables the network to learn more robust internal feature representations that inherently prevent or minimize the formation of these specific distortions, particularly when dealing with high QP inputs. This refinement module, which is highlighted by the red dashed box in Figure 6b, therefore acts as a key enabler for cleaner feature reconstruction, smoothing residual inconsistencies, and enhancing local texture coherence without introducing significant computational overhead. This enhanced version of the PWSA, combining its original global attention capabilities with this targeted refinement, is referred to as refined PWSA throughout this work.
Let denote the input feature map received after the BWSSA and RCB modules Where C is 128 and H and W are both 264. The refined PWSA process begins by applying 4-pixel replication padding to all sides, temporarily expanding the spatial resolution to 272 × 272 to ensure full block coverage. The padded input is then processed by a convolutional layer with kernel size and stride of 16 to compute patch-wise self-attention, denoted as . The resulting attention-enhanced features are upsampled using a transposed convolution, restoring the full resolution of the padded input. To suppress artifacts introduced during this upsampling stage, a 3 × 3 convolution followed by a PReLU activation function, collectively referred to as , is applied immediately after the transposed convolution. The padded margins are then cropped, restoring the original spatial dimensions of 264 × 264. Finally, a residual connection is applied, adding the original input to the processed output. This complete process is summarized by the following expression:
In this equation, represents the patch-wise self-attention computed over 16 × 16 non-overlapping blocks after 4-pixel replicate padding. The ConvTranspose operation upsamples the feature map back to its padded spatial size. RefineConv includes a 3 × 3 convolution and a PReLU activation to suppress artifacts introduced during upsampling. Finally, the padded borders are cropped and the original input Y is added back via a residual connection. Each of these steps is visually illustrated in Figure 6b. The padding is shown at the input stage, followed by attention computation and transposed convolution. The refinement module, introduced in this work, is enclosed by the red dashed box and includes both the 3 × 3 convolution and PReLU activation. The final cropping and residual addition are represented at the output stage, completing the internal flow of the refined PWSA module.
3.3. Image Reconstruction
The image reconstruction module serves as the final stage of the proposed network, translating refined deep features into a residual correction map that is added to the center-cropped input patch. This step is essential for restoring localized detail and correcting compression artifacts in the output image. In the original MTSA architecture, the reconstruction module was designed to mirror the shallow feature extraction stage for architectural symmetry. It consisted of two padded RCBs followed by a point-wise convolution and a Tanh activation function, producing a 256 × 256 output aligned with AV1’s 128 × 128 superblock structure. This layout improved the network’s feature mappings without altering spatial resolution, ensuring that outputs remained consistent with patch-based training and evaluation.
As the architecture evolved, several upstream modifications increased the complexity of the feature space. The input patch size was extended from 256 × 256 to 264 × 264 to accommodate the misaligned 12 × 12 block grid used in the BWSSA12 module. Additionally, refinements to the PWSA module—including the addition of a convolutional block after transposed convolution—enhanced the richness of the extracted features. These changes introduced greater representational capacity but also imposed higher demands on the final reconstruction stage. During training, this imbalance manifested as unstable weight updates and erratic gradient behavior specifically within the two RCBs of the image reconstruction module, while earlier layers remained stable. This suggested that the reconstruction stage lacked sufficient capacity to handle the richer, more complex features introduced by BWSSA12 and the refined PWSA module. As a result, the original two-RCB design was unable to consistently transform these high-dimensional features into accurate residual outputs, limiting convergence and final reconstruction quality.
To address the lack of depth in the original two-RCB structure, the reconstruction module was redesigned to include three RCBs. The first RCB retains padding, preserving the 264 × 264 spatial dimensions and allowing initial processing without loss of spatial context. The subsequent two RCBs were modified to exclude padding, thereby reducing the spatial resolution from 264 × 264 to 256 × 256 directly within the residual path. This structural change removed the need for explicit cropping operations and integrated spatial downscaling as part of the feature transformation, making the reconstruction module more consistent with the overall pipeline flow.
The enhanced reconstruction module improves both numerical stability and spatial alignment. By increasing the reconstruction capacity and incorporating built-in spatial reduction, the module ensures that the final output conforms to the expected 256 × 256 resolution, maintaining compatibility with AV1’s superblock structure. More importantly, it provides a robust endpoint for translating multi-scale, self-attention-refined features into accurate residual predictions, contributing to both perceptual quality and training convergence across diverse sequences.
3.4. Training and Testing Configuration
3.4.1. Training Dataset
To construct the training dataset for our improved model, we again adopted the BVI-DVC dataset [34], a benchmark widely used in video compression research involving neural networks. The dataset contains 800 video sequences, each comprising 64 frames in 10-bit YCbCr 4:2:0 format, with resolutions ranging from 270p to 2160p, as shown in Table 2. Its diverse content—spanning natural and synthetic scenes with varying motion, texture, and lighting—provides a comprehensive foundation for training robust models. While the BVI-DVC dataset is a common benchmark for deep video compression research, and an updated version BVI-AOM [35] is now available, we employ BVI-DVC in this work. Using the same dataset as our prior study on MTSA allows for a direct and fair comparison, ensuring that observed performance improvements are attributable to the proposed network enhancements rather than dataset variations. To simulate realistic compression artifacts, the sequences were encoded using the SVT-AV1 encoder [36] following the AVM Common Test Conditions (CTC) for random access (RA) [5], as detailed in Table 3. This ensures that the training environment closely reflects practical AV1 codec scenarios, forming a reliable basis for post-filter learning. As the original BVI-DVC videos are provided in MP4 format, each sequence was first converted to 10-bit YCbCr with 4:2:0 format.
Table 2.
Overview of the BVI-DVC dataset, reused in this study to ensure consistency with previous work.
Table 3.
SVT-AV1 parameters used.
While preparing the training data, it was observed that all 800 sequences in the BVI-DVC dataset include dark padded rows at the bottom of each frame. These padded regions vary in size by class—16 pixels for Class A, 8 for Class B, 4 for Class C, and 2 for Class D—and appear visually distinct from the main content area. These rows appear to have been added during dataset generation to align frame heights to even multiples, but their intensity differs from the surrounding image area. Since self-attention layers are particularly sensitive to long-range spatial context, including such regions in training led to undesirable darkening artifacts in earlier studies. As illustrated in Figure 7 using representative frames from the BVI-DVC dataset [34], these non-content dark rows, which are inconsistent with the visible content region, were therefore excluded from the training dataset to prevent learning bias and preserve output fidelity.

Figure 7.
Examples of dark padded regions at the bottom of BVI-DVC sequences. (a) Full frame from a Class A sequence AdvertisingMassagesBangkokVidevo with a zoomed-in view of the bottom yellow-boxed region showing a visually dark 16-pixel row; (b) full frame from a Class B sequence BoatsChaoPhrayaRiverVidevo with a zoomed-in view of the bottom yellow-boxed region showing a visually dark 8-pixel row; (c) full frame from a Class C sequence BasketballGoalScoredS1Video with a zoomed-in view of the bottom yellow-boxed region showing a visually dark 4-pixel row; (d) full frame from a Class D sequence DollsScene1YonseiUniversity with a zoomed-in view of the bottom yellow-boxed region showing a visually dark 2-pixel row.
Patches located at the right and bottom boundaries of each frame were excluded from training. In order to extract patches at these positions, additional padding would be required to meet the 264 × 264 input size. However, doing so would result in incomplete or artificially extended content that does not accurately reflect the original compressed frame structure. To avoid introducing structurally inaccurate inputs—especially problematic for attention-based models—these edge patches were excluded from the training dataset.
Furthermore, no data augmentation techniques, such as random flips or rotations, were applied during training. This was an intentional choice to preserve the precise spatial structure, size, and location of compression artifacts present in the AV1-decoded frames, as this information is considered critical for the artifact reduction task.
Although the patch size was changed from 256 × 256 to 264 × 264, the total number of training patches remained unchanged from our previous study, totaling 1,984,000. This is because the stride was kept at 256, and since boundary patches were already excluded during the initial dataset preparation in our previous work.
To account for varying compression levels, five separate models were trained using different QP values: 20, 32, 43, 55, and 63. Each model was trained independently using the same network architecture and training configuration. The Adam optimizer was used with a learning rate of 10−4, along with β1 = 0.9 and β2 = 0.999. All models were trained for 200 epochs. Table 4 summarizes the mapping between QP values and the corresponding trained models used during evaluation. QPbase in Table 4 refers to the base QP value used during encoding for evaluation. The selected QP base ranges in Table 4 are designed to cover the entire AV1 QP spectrum from 0 to 63 while concentrating on values more commonly used in practical encoding scenarios. Very low QP values offer minimal compression benefit and result in large bitstreams, so model coverage begins at QP20 and proceeds upward, with each range empirically defined to balance specialization and generalization across typical usage conditions.
Table 4.
Network models for QP range.
3.4.2. Training Strategy
The channel is prioritized during training, as the human visual system is significantly more sensitive to brightness variations than to differences in color. To reflect this, we use a weighted PSNR metric [37] that assigns greater importance to over and . The combined PSNR is calculated using a 12:1:1 weighting ratio:
This formulation ensures that the evaluation metric aligns with perceptual quality priorities in video coding [38,39]. The weight of 12 for reflects the greater importance of luminance in human vision, while the weights of 1 for each chroma channel reflect their lower perceptual sensitivity. The values are averaged over 14 total units to normalize the scale, allowing direct comparison to standard BD-BR measurements.
Reflecting these perceptual priorities directly in the training objective, the loss function employed was a weighted mean squared error (W-MSE) based on the same 12:1:1 ratio for the , , and components. This weighted loss is calculated by combining the mean squared error (MSE) computed individually for each channel as follows:
Here, represents the standard MSE for a given channel , calculated as follows:
where and are the ground truth and predicted pixel values for channel at pixel location , respectively, is the total number of pixels considered for that channel, and the sum is over all relevant pixel . The use of this weighted formulation ensures that gradients are computed with a stronger emphasis on the channel during backpropagation, while the normalization by 14 keeps the overall loss magnitude consistent. This alignment between training and evaluation encourages the network to minimize perceptually significant errors more effectively.
3.4.3. Experimental Setup
The training and evaluation procedures were implemented using the PyTorch [40] (version 2.3.0, PyTorch Foundation, San Francisco, CA, USA) with CUDA (version 12.4.0, NVIDIA Corporation, Santa Clara, CA, USA), on an Arch Linux system. The hardware configuration used in this study remains consistent with our previous work [4]. The primary experiments were conducted on a workstation equipped with dual AMD EPYC 7513 32-core CPUs (Advanced Micro Devices, Santa Clara, CA, USA), 384 GB of RAM, and an NVIDIA A6000 GPU (NVIDIA Corporation, Santa Clara, CA, USA), using a batch size of 16. To verify reproducibility on lower-end systems, additional training was performed on a secondary machine featuring an AMD Ryzen Threadripper 1950X (Advanced Micro Devices, Santa Clara, CA, USA) 16-core CPU, 48 GB of RAM, and an NVIDIA GeForce RTX 2080 Ti (NVIDIA Corporation, Santa Clara, CA, USA), with a reduced batch size to accommodate GPU memory limitations.
4. Results
4.1. Evaluation Process
4.1.1. Testing Dataset
To evaluate the performance of the proposed network, we used sequences from Classes A1 to A5 of the AVM-CTC dataset [5]. Although the AVM-CTC was originally introduced for AV2 development, it consists of high-quality video sequences that are equally well-suited for evaluating AV1 performance. The 45 sequences used in this study cover a wide range of resolutions, from 270p to 4K, frame rates, and scene characteristics, including motion, texture, and lighting variations. Each sequence consists of 130 frames, ensuring a consistent and diverse evaluation.
The full list of test sequences used from each class is summarized in Table 5. To ensure compatibility with our training setup, all 8-bit sequences were converted to 10-bit YCbCr 4:2:0 format prior to testing to match the bit-depth used in the training data. The AVM-CTC defines test classes solely based on resolution, resulting in a mixture of 8-bit and 10-bit sequences within each class. Since our training dataset was constructed entirely from 10-bit source videos, we applied the same bit depth uniformly across all test sequences. This ensured consistency with the training conditions without requiring a separate model for 8-bit data.
Table 5.
Class A sequences from AVM-CTC.
Among these, five sequences were found to overlap with videos from the BVI-DVC training dataset. Although the frame counts differ, with 64 frames in BVI-DVC and 130 frames in AVM-CTC, many frames are shared between the training and test sets. These overlaps are summarized in Table 6.
Table 6.
Overlapping sequences in BVI-DVC and AVM-CTC datasets.
To maintain direct comparability with our previous model, we retained these overlapping sequences in the training dataset. This ensures that differences in performance between models reflect architectural changes rather than differences in data exposure. However, to prevent evaluation bias, these five sequences were excluded from the BD-BR results presented in this paper. This decision follows the findings of our earlier work [4], where the impact of such overlaps was analyzed and shown to have only a minor effect on overall BD-BR. As this issue has already been addressed, we do not repeat the ablation here. All BD-BR results reported in this study are based solely on the non-overlapping subset of AVM-CTC sequences.
4.1.2. Testing Strategy
To evaluate the effectiveness of the proposed method, all test sequences were compressed using the SVT-AV1 encoder with fixed parameters consistent with those listed in Table 3. The post-filter network was then applied to the reconstructed frames produced by the AV1 decoder.
Performance was evaluated using the Bjontegaard Delta Bit Rate (BD-BR) metric [41,42], a standard measure adopted by JVET for assessing coding efficiency improvements. BD-BR reflects the average bitrate savings achieved for the same level of quality, calculated based on PSNR scores for the Y, Cb, and Cr components. Lower BD-BR values indicate more efficient compression relative to the anchor.
All BD-BR results presented in this paper are calculated by comparing the post-filtered outputs against the original SVT-AV1 reconstructions (i.e., the anchor). As described in Section 4.1.1, five sequences that overlap with the BVI-DVC training set were excluded from the evaluation dataset to ensure a fair and unbiased comparison. The quantitative and qualitative results obtained using this strategy are presented in the following sections, focusing on rate-distortion performance and visual quality.
4.1.3. Objective Quality Evaluation: PSNR-Based Analysis
The BD-BR results presented in Table 7 quantitatively confirm the performance of the proposed MS-MTSA network compared to AV1 compression. Averaged across all test sequences, MS-MTSA achieves a Y-component BD-rate reduction of −12.44% relative to AV1. Improvements are consistent across different content types and resolutions. In particular, Class A1 (4K) sequences show an average reduction of −17.41%, and Class A2 (FHD) sequences achieve −14.23%. Mid-resolution classes also exhibit notable gains, with Class A3 and Class A5 achieving reductions of −14.21% and −7.37%, respectively. Even for the challenging Class A4, which includes sequences such as SnowMountain, MS-MTSA achieves a BD-rate reduction of −8.98%. These results demonstrate that the proposed network provides robust and generalized performance improvements over the baseline AV1 compression.
Table 7.
BD-BR(PSNR) for all AVM CTC sequences in random access configuration.
A detailed comparison between the original MTSA and the proposed MS-MTSA is presented in Table 8. For the Y-component, MS-MTSA improves the average BD-rate reduction by 2.27 percentage points, achieving −12.44% compared to −10.17% for MTSA. Class-specific comparisons show similar trends: Class A1 improved from −14.56% to −17.41%, Class A2 from −12.00% to −14.23%, Class A3 from −11.66% to −14.21%, Class A5 from −6.07% to −7.37%, and Class A4 from −6.55% to −8.98%.
Table 8.
BD-BR(PSNR) comparison between MTSA and MS-MTSA by content class.
Analysis of the Cb and Cr components reveals a more complex picture, particularly in the challenging Class A4 where specific sequences exhibit BD-rate regression (e.g., RedKayak Cr worsening from +14.80% to +16.02%). However, despite these sequence-level challenges and a slight worsening of the Class A4 Cr average, MS-MTSA still demonstrates overall improvements across the chroma channels when averaged over all test sequences. MS-MTSA achieves BD-rate reductions of −21.70% for Cb and −19.90% for Cr, compared to −18.88% and −16.34% for MTSA. These gains correspond to additional savings of 2.82 percentage points for Cb and 3.56 percentage points for Cr, further confirming that the architectural refinements yield meaningful performance enhancements across both luminance and chrominance channels.
Figure 8 presents the average rate-distortion curves for each video class, comparing the baseline SVT-AV1, the original MTSA, and the proposed MS-MTSA network. These curves, generated by averaging bitrate and Y-PSNR values across non-overlapping sequences in each class, provide a representative view of overall coding performance. As expected, both MTSA-based models consistently outperform the SVT-AV1 anchor across the full QP range.
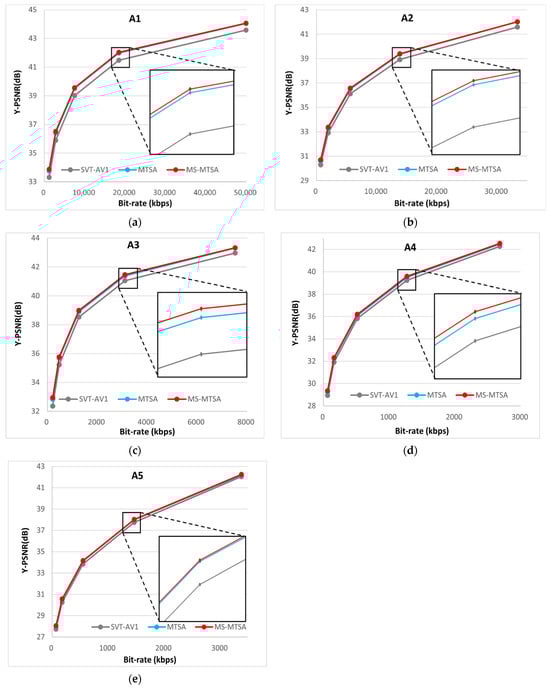
Figure 8.
RD curves by SVT-AV1, MTSA, and MS-MTSA. (a) Class A1; (b) class A2; (c) class A3; (d) class A4; (e) class A5.
The plots also show that MS-MTSA further improves upon the original MTSA across all classes. However, as the gains are modest compared to the larger performance gap between MTSA and SVT-AV1, the RD curves for MTSA and MS-MTSA often appear closely aligned. To better highlight these subtle yet meaningful improvements, zoomed-in inset boxes are included in the RD plots, making the performance difference easier to discern visually.
Taken together, the visual evidence from the quantitative BD-rate gains detailed in Table 7 and Table 8 and the RD plots shown in Figure 8 demonstrate that MS-MTSA achieves meaningful performance improvements over the original MTSA. The consistent Y-component gains across diverse content classes, alongside meaningful performance enhancements in the overall chroma channels, confirm the effectiveness of the proposed architectural refinements. Furthermore, these coding efficiency enhancements are achieved while preserving the essential decoder-side simplicity and compatibility inherent in the original MTSA framework, making MS-MTSA a practical advancement.
4.1.4. Objective Quality Evaluation: SSIM-Based Perceptual Analysis
To complement the PSNR-based BD-BR evaluation and better reflect perceptual improvements, such as seam reduction and suppression of upsampling-induced grid artifacts, we additionally evaluated the proposed method using the structural similarity index (SSIM) [43]. SSIM is a perceptual quality metric introduced by Wang et al. that compares luminance, contrast, and structural similarity between images. SSIM has been widely recognized for its stronger correlation with perceived visual quality compared to pixel-based metrics like PSNR.
Table 9 presents the SSIM-based BD-BR results of the proposed MS-MTSA network across the non-overlapping subset of AVM-CTC test sequences. Similar to the PSNR-based evaluation, MS-MTSA consistently achieves BD-rate reductions across all classes. The performance gains are especially notable for high-resolution sequences in Classes A1 and A2, where MS-MTSA achieves average SSIM-based BD-rate reductions of −24.3% and −18.7% for the Y channel, respectively. Mid- and lower-resolution sequences from Classes A3 to A5 also show stable perceptual quality improvements, with average Y-channel reductions ranging from −18.7% (A3) to −9.6% (A5). These results validate that the architectural refinements in MS-MTSA effectively enhance perceptual quality.
Table 9.
BD-BR(SSIM) for all AVM CTC sequences in random access configuration.
Table 10 compares SSIM-based BD-rate improvements between the original MTSA and the proposed MS-MTSA across different content classes. MS-MTSA consistently outperforms MTSA, enhancing the average Y-channel SSIM-based BD-rate reduction from −13.4% to −16.3%. Improvements in chroma components are similarly substantial, with average gains of approximately 4 percentage points each for the Cb and Cr channels. These perceptual metric-based improvements demonstrate that the refinements introduced in MS-MTSA, including MS-BWSSA and convolutional refinement within the upsampling module, provide clear perceptual benefits beyond traditional pixel-level metrics.
Table 10.
BD-BR(SSIM) comparison between MTSA and MS-MTSA by content class.
In specific sequences such as RedKayak and SnowMountain, SSIM-based evaluation reveals a nuanced picture of perceptual quality changes. For instance, although the Cr component in RedKayak exhibited an anomalous positive BD-rate, the corresponding Y-channel demonstrates improved perceptual quality according to SSIM. This highlights the importance of using perceptual metrics like SSIM to accurately quantify structural distortions and visual improvements that pixel-based metrics may fail to fully capture.
In summary, including SSIM-based BD-BR results provides a more comprehensive assessment of the visual quality enhancements achieved by MS-MTSA. These results quantitatively confirm reductions in seam artifacts and grid-induced distortions, addressing concerns regarding the adequacy of PSNR-based metrics alone for capturing perceptual visual quality.
4.1.5. Qualitative Visual Quality Evaluation
Figure 9, Figure 10, Figure 11 and Figure 12 show a qualitative comparison of selected regions from the AVM-CTC sequences [5] to highlight the improvements achieved by the proposed MS-MTSA network over both MTSA and the AV1-coded image. Each figure presents the original uncompressed frame, the AV1-coded image, the result of the MTSA-based post-filter, and the output from the MS-MTSA network. These examples are chosen to illustrate the two primary limitations addressed in this study: seam artifacts introduced at patch boundaries and structured distortions associated with the transposed convolution layer.
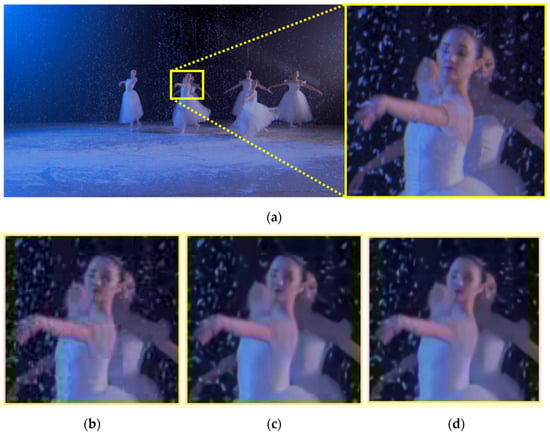
Figure 9.
Example sequence of Class A1 NocturneDance. (a) Original frame from the AVM-CTC sequence with a yellow box indicating the region of interest; (b) corresponding region in the compressed image using SVT-AV1 at QP55; (c) output from the original MTSA post-filter network; (d) output from the proposed network. Motion-induced blocking artifacts are prominent in (b), especially around the dancer’s face and arm. While the MTSA output (d) removes most blocking, a distinct vertical seam divides the dancer’s body and creates structural discontinuity. The proposed network (d) significantly improves coherence, reconnecting the face and arm regions and restoring a more natural appearance.
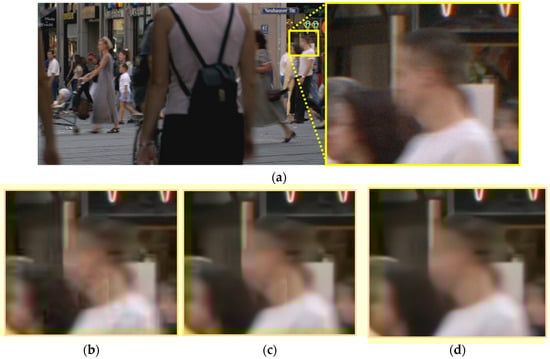
Figure 10.
Example sequence of Class A2 PedestrianArea. (a) Original frame from the AVM-CTC sequence with a yellow box indicating the region of interest; (b) corresponding region in the compressed image using SVT-AV1 at QP55; (c) output from the original MTSA post-filter network; (d) output from the proposed network. In (b,c), a vertical seam across the forehead and neck is clearly visible, and the pillar near the store entrance blends into the face, obscuring facial boundaries. The proposed method in (d) reduces this blending and improves structural consistency across patches.
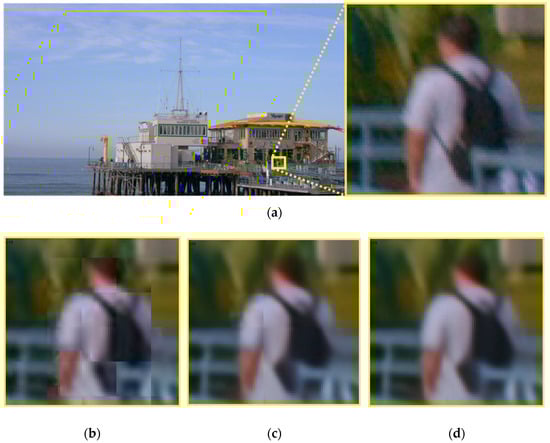
Figure 11.
Example sequence of Class A1 PierSeaSide. (a) Original frame from the AVM-CTC sequence with a yellow box indicating the region of interest; (b) corresponding region in the compressed image using SVT-AV1 at QP55; (c) output from the original MTSA post-filter network; (d) output from the proposed network. In (b), visible 16 × 16 block structured artifacts are present around the shoulder, and color bleeding from the neck into the background foliage introduces unnatural red tones. While MTSA (b) reduces blocking, these residual patterns persist. The proposed MS-MTSA network (d) effectively eliminates both the grid artifacts and background color distortion, producing a cleaner and more consistent output.
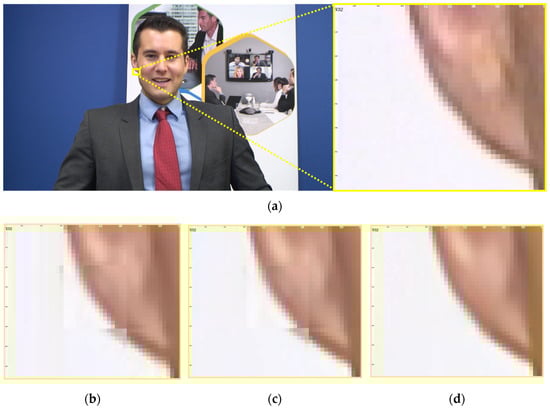
Figure 12.
Example frame from the Class A3 sequence Johnny. (a) Original frame from the AVM-CTC sequence with a yellow box highlighting the region near the earlobe; (b) corresponding region from the AV1-coded frame using QP55, showing prominent block artifacts along the edge near the earlobe. (c) Output from the original MTSA network, where blocking is reduced but a discontinuity remains due to residual 16 × 16 artifacts. (d) Output from the proposed MS-MTSA network, which successfully restores the smoothness and continuity of the edge, closely resembling the original. This example highlights the MS-MTSA network’s improved ability to eliminate both blocking and grid-aligned distortions.
Figure 9 shows a frame from the Class A1 NocturneDance sequence, where fast motion introduces severe blocking artifacts in the AV1-coded image. While MTSA reduces this blocking, it introduces a vertical seam that bisects the dancer’s body—most noticeably across her cheek and arm—leading to perceptual discontinuity. This seam is a consequence of MTSA’s non-overlapping patch-based processing when applied to the AV1 content. In contrast, the MS-MTSA output, primarily due to its MS-BWSSA and patch overlap strategy, smooths this division and restores the alignment of facial and body features, resulting in a more coherent and natural appearance. This case illustrates how multi-scale attention improves structural integrity when post-processing AV1 content, particularly by resolving artifacts stemming from prior patch-based approaches.
Figure 10 shows a region from the Class A2 PedestrianArea sequence, where a vertical seam is clearly visible in the AV1-coded image. This seam divides the man’s forehead and neck and causes the background pillar to blend unnaturally into his face. Although MTSA reduces some of the color bleeding and structural misalignment, the seam remains prominent, especially in the neck region where textural inconsistency persists. In comparison, MS-MTSA, leveraging its MS-BWSSA module and patch overlap, achieves smoother structural transitions, rendering clearer facial contours and more distinct separation between the foreground and background. This example demonstrates MS-MTSA’s effectiveness in resolving patch boundary artifacts, particularly in low-motion, high-contrast regions.
Figure 11 shows a magnified crop from the Class A1 PierSeaSide sequence, focusing on the upsampling-induced pixelation artifacts that originated from the original MTSA’s PWSA module when processing AV1 content. Although MTSA, in Figure 11c, eliminates most visible AV1 blocking artifacts, these pixelation artifacts persist around the shoulder in its output. These artifacts appear as small, block-aligned regions of erroneous pixel values and are linked to the upsampling stage in MTSA’s PWSA module. The MS-MTSA output in Figure 11d successfully suppresses these processing-induced pixelation artifacts. This improvement is primarily attributed to the refined PWSA, which includes an integrated convolutional refinement block and is trained as part of the end-to-end MS-MTSA architecture. This results in smoother color transitions and more coherent contours, particularly in areas with subtle detail variations, showcasing the effectiveness of this targeted refinement for improving the final AV1 output.
Figure 12 shows a region from the Class A3 Johnny sequence, focusing on a flat background area intersecting the middle of the ear. The AV1-coded image reveals block artifacts along the boundary between the ear and the background, disrupting the smooth transition of the vertical contour. While MTSA Figure 12c reduces some of this AV1 blocking distortion, it simultaneously introduces its own upsampling-induced pixelation artifacts. These pixelation artifacts, manifesting as small, block-aligned regions of erroneous pixel values, leave the edge disconnected and visually unstable. The MS-MTSA output in Figure 12d restores this contour with improved coherence and smoothness, closely matching the original uncompressed frame. This dual improvement is attributed to the combined action of its MS-BWSSA, for better handling of AV1 block boundaries and inter-patch continuity, and its refined PWSA, for mitigating upsampling pixelation. This example further demonstrates the ability of MS-MTSA to preserve fine structural details by addressing both AV1 codec-inherent blocking and MTSA-processing-induced pixelation artifacts in low-texture regions.
Together, these examples confirm that MS-MTSA enhances the visual quality of AV1-coded video. It achieves this by improving structural consistency by addressing MTSA-induced patch boundary seams and enhancing the handling of AV1’s inherent block boundaries. Furthermore, it suppresses upsampling-induced pixelation artifacts that originated from MTSA’s PWSA module. Even when overall numerical BD-rate gains for certain sequences or QP ranges are modest, these targeted architectural refinements produce clearly perceivable improvements that enhance the subjective quality of the final AV1 output.
4.2. Computational Complexity Analysis
To assess the computational overhead introduced by the proposed architectural enhancements, we analyzed both the number of trainable parameters and the theoretical operational load in terms of multiply–accumulate operations (MACs). The prior MTSA network operates on 256 × 256 input patches, whereas the proposed MS-MTSA is designed for 264 × 264 input patches to support multi-scale attention alignment. As a result, the MACs for MS-MTSA were calculated based on a 264 × 264 input, while MTSA’s MACs were computed for 256 × 256 inputs to reflect their respective operational contexts.
The total number of trainable parameters increased from 19.24 M in MTSA to 19.74 M in MS-MTSA, representing a modest 2.6% rise. In terms of theoretical computational load, the total MACs increased from 446.44 GMac for MTSA to 529.54 GMac for MS-MTSA, corresponding to an 18.6% increase. These values were estimated using standard multiply–accumulate operation counts for convolutional neural networks, following the methodology described in [44], and reflect the introduction of the second stage in the MS-BWSSA module as well as the lightweight refinement layer integrated within PWSA, labeled as “Refine” in Table 11.
Table 11.
MTSA vs. MS-MTSA—module-wise parameter and MAC comparison.
A detailed module-wise breakdown of parameter counts and MACs for both networks is presented in Table 11. While these figures indicate increased theoretical complexity, they are balanced against the substantial coding performance improvements detailed in Section 4.1, and the practical implications of these overheads, along with potential avenues for runtime optimization, which remain important considerations for future work.
5. Discussion
5.1. Ablation Studies
5.1.1. Reconsidering Patch-Wise Self-Attention
This ablation configuration was trained and tested using the same setup as the main network described in Section 3.4. Evaluation was conducted only at QP 20 to simplify quantitative comparison, but the results did not show sufficient improvement over the SVT-AV1 anchor, prompting further analysis to identify potential causes. This led to the discovery of visual artifacts introduced by the architectural change.
In the early stages of refining the network architecture, PWSA was removed due to two main concerns: its relatively large parameter count and its tendency to introduce structured visual artifacts. While its runtime complexity remains moderate—since attention is computed on reduced-resolution tokens—the use of three convolution layers followed by a transposed convolution across all channels results in a significantly higher number of parameters compared to other components. The more pressing issue was its tendency to leave behind subtle 16 × 16 block structured artifacts, particularly in flat or low-texture regions, due to the fixed alignment between the transposed convolution and patch layout.
Concurrently, MS-BWSSA with two sequential block sizes (i.e., 16 × 16 and 12 × 12) was introduced. Since these grids are spatially misaligned, their combination was expected to encourage inter-block feature interaction and reduce the reliance on PWSA. Based on this assumption, PWSA was excluded in the initial version of the proposed network.
However, this design choice revealed unexpected failure cases when PWSA was absent. Two distinct types of degradation became apparent, illustrated using amplified difference images in Figure 13 and Figure 14. Figure 13b shows an example from the Class A3 KristenAndSara sequence exhibiting fine circular artifacts in smooth gradient regions. Figure 14b, using the Class A3 ControlledBurn sequence, illustrates broad value shifts in textureless regions, notably smoke. These issues, detailed further in Section 4.1.2, highlighted problems with instability and inadequate global context modeling when relying solely on MS-BWSSA, ultimately motivating the reintroduction of PWSA in a refined form.
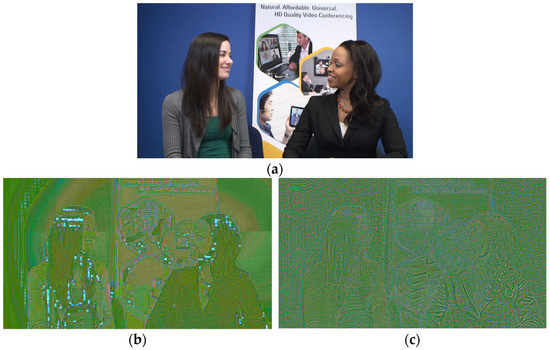
Figure 13.
Example sequence from the Class A3 KristenAndSara. (a) Original frame featuring two women in conversation with a poster in the background. (b) Amplified difference image between the AV1-coded frame and the network without PWSA, where dotted blue artifacts appear around gradual intensity transitions such as the background and hair. (c) Amplified difference image from the network with PWSA, where such dotted artifacts are no longer observed.
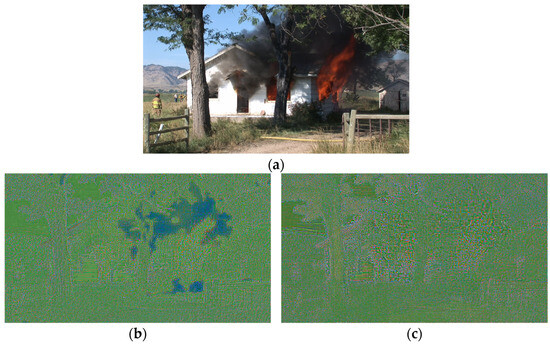
Figure 14.
Example frame from the Class A3 ControlledBurn. (a) Original uncompressed image showing smoke emerging from a burning structure. (b) Amplified difference between the AV1-coded frame and the output of the network without PWSA. Difference value shifts are visible in the smoke region, indicating instability in smooth, low-texture gradients. (c) Amplified difference between the AV1-coded frame and the output of the network with PWSA. These structured value shifts are no longer present, demonstrating PWSA’s role in restoring consistency across gradient-heavy, low-contrast areas such as smoke. The difference images in (b) and (c) are shown in amplified YUV color; while green represents general offsets, bluish areas highlight more significant deviations in smooth regions.
5.1.2. Effect of Patch-Wise Self-Attention on Structural Consistency
The removal of PWSA initially aimed to reduce model size and eliminate grid-aligned artifacts, potentially introduced by transposed convolution. However, its absence resulted in two distinct types of degradation already introduced in Section 5.1.1: fine circular artifacts in gradient-rich regions and broad value shifts in low-texture areas. These artifacts are illustrated in Figure 13 and Figure 14, which show example frames from the AVM-CTC sequences [5], and are directly linked to the lack of global context modeling.
These failure modes exposed the limitations of MS-BWSSA when used alone. While MS-BWSSA improved local structural representation and patch boundary integration, it lacked the global receptive field required to maintain consistency over large areas, which is critical for addressing broad value shifts, and to resolve ambiguities in regions with weak local features, which often lead to fine circular artifacts. To address these issues, we reintroduced PWSA with architectural enhancements, resulting in the refined PWSA module, which incorporates a lightweight convolutional refinement block. This enhanced PWSA was directly adopted in the final MS-MTSA network, and the results discussed here serve to justify its inclusion rather than present a separate ablation. This enhanced design restored consistency across broad areas, eliminating broad value shifts and resolving fine circular artifacts in gradients. The combination of MS-BWSSA and refined PWSA proved critical in achieving structural coherence, underscoring the necessity of both local and global attention mechanisms for robust AV1 artifact suppression.
5.1.3. Attempting to Replace Patch-Wise Attention with Inter-Block Self-Attention
This ablation configuration was trained and tested under the same conditions as the main network described in Section 3.4. Evaluation was limited to QP 20 and focused solely on quantitative comparison, as no specific visual irregularities were observed.
During the refinement process, inter-block self-attention (IBSA) was introduced as a potential alternative to PWSA, motivated by the goal of achieving patch-level contextual integration without the use of transposed convolution. Unlike PWSA, which first downsamples the input into patch-level tokens and then upsamples the output, IBSA unfolds the input into non-overlapping blocks and directly computes attention across them. Each block is treated as a token, and attention is applied over all blocks in the spatial domain to capture long-range dependencies. This design avoids upsampling entirely and maintains spatial alignment, making it structurally cleaner and less prone to introducing artifacts. Conceptually, it was expected to perform well in post-filtering, as it enables inter-block communication and global spatial awareness within a patch-sized region, potentially replacing the role of PWSA without its drawbacks. The IBSA mechanism is illustrated conceptually in Figure 15.
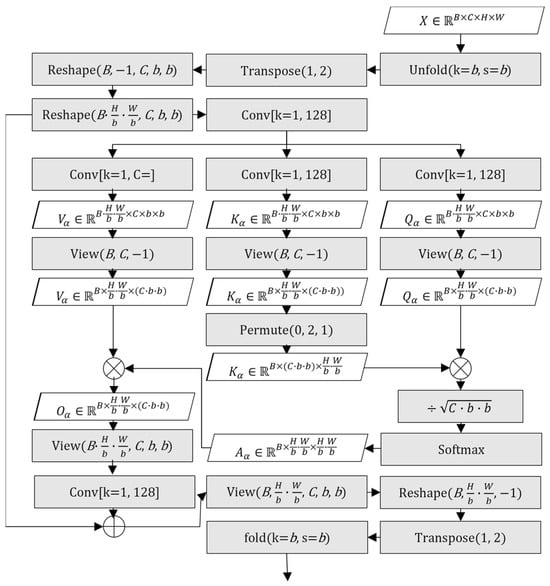
Figure 15.
Block diagram of IBSA.
To manage the computational overhead of performing attention across all blocks, the internal channel dimensions in IBSA were reduced, and features were subsequently projected back to the original dimension before the residual connection. Despite this trade-off, early experiments showed promising results: IBSA, similar to PWSA, was able to suppress broad value shifts in low-texture areas and improve overall consistency across block boundaries, suggesting it could fulfill the contextual modeling role while avoiding potential upsampling artifacts. However, when fully integrated and evaluated quantitatively, the IBSA-based configuration did not achieve better BD-rate or PSNR results compared to the refined PWSA counterpart shown in Table 12. While visually producing reasonable results and effectively addressing the major broad value shifts, its overall measured performance did not justify replacing the refined PWSA approach in the final model.
Table 12.
PSNR comparison between PWSA and IBSA at QP = 20.
In the final configuration of the proposed model, IBSA was removed in favor of PWSA with a post-upsampling refinement block. While IBSA remains a theoretically sound and structurally elegant mechanism—especially for tasks where upsampling is undesirable—its performance in this context did not justify replacing PWSA. The combination of MS-BWSSA and PWSA offered more consistent improvements across both visual and quantitative measures, underscoring the value of diverse attention scales and the practical effectiveness of patch-wise modeling for AV1 post-filtering.
5.1.4. Visual Artifact Removal via Refined PWSA Retraining
To further confirm the effectiveness of the refined PWSA module, we conducted a qualitative test by integrating it into the original MTSA network. This configuration was trained and tested using the same dataset, loss function, and reconstruction setup as described in Section 3.4, with evaluation conducted at QP 55 to examine artifact suppression under high-compression conditions. The training was limited to a few tens of epochs, as the goal was to verify visual artifact removal rather than measure final BD-rate performance.
Initially, we attempted to fine-tune the MTSA model after inserting the refined PWSA, but the small artifact present in the original MTSA output, Figure 16b, persisted. We then trained the modified network from scratch, resulting in the successful removal of the artifact, as shown in Figure 16c. Compared to the reconstruction frame without post-filtering, Figure 16a, the retrained output exhibits clear improvement and no artifact remains. Figure 16 shows a zoomed-in region from the Class A1 sequence NocturneDance in the AVM-CTC [5].
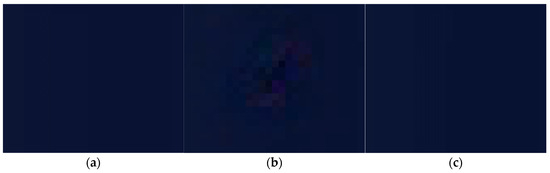
Figure 16.
Visual comparison illustrating the effect of refined PWSA retraining. (a) Reconstruction frame without post-filtering, showing no visible artifact. (b) Output from the original MTSA network, where a small artifact appears in the highlighted region. (c) Output from the MTSA network with refined PWSA retrained from scratch, where the artifact is successfully removed.
These results demonstrate that the refined PWSA module plays a crucial role in suppressing residual distortions that were not addressed by the original design. The success of retraining highlights that this refinement layer is most effective when fully integrated from the beginning of training, reinforcing its inclusion as a permanent architectural component in the MS-MTSA framework.
6. Conclusions
This study proposes a novel post-filtering architecture to enhance AV1 artifact suppression and improve video quality. Two major architectural upgrades were introduced: the first being the MS-BWSSA module, which sequentially operates on 16 × 16 and 12 × 12 blocks, allowing the network to better capture spatial dependencies across multiple scales and improve block boundary integration; and the second, a refined PWSA module, which includes a lightweight convolutional post-processing block to address the block-structured artifacts introduced by previous upsampling methods. These refinements resulted in consistent BD-rate reductions across all test classes, with the Y component improving from −10.17% to −12.44%, and the SSIM-based BD-rate improving from −13.4% to −16.3%, demonstrating the effectiveness of the proposed improvements in enhancing both perceptual and quantitative video quality.
The proposed method introduced in this study led to noticeable perceptual improvements in visual quality. The primary visual gains included a reduction in patch seams at boundaries, which were previously visible in the reconstructed frames, as well as the elimination of the block-structured artifacts that often appeared in flat regions due to structural limitations in the previous PWSA module. Visual quality evaluations, supported by both PSNR-based and SSIM-based BD-rate analysis, confirmed that the enhanced design successfully restored smoother transitions across patch boundaries and minimized structural distortions in both texture-rich and low-texture areas. These visual results align with the quantitative BD-rate reductions, further supporting the effectiveness of the architectural upgrades in enhancing the overall video quality.
The decision to initially remove PWSA was driven by concerns over its high parameter count and the block-structured artifacts introduced by its upsampling operation. However, this led to two distinct visual issues: the appearance of circular gradient artifacts in smooth transition areas and low-frequency tonal shifts in large, textureless regions. MS-BWSSA addressed some of these problems, improving block boundary integration and local structure, but still lacked the broader contextual modeling necessary to eliminate all artifacts. While IBSA was explored as an alternative to PWSA and produced visually stable results, it did not achieve better PSNR scores and was ultimately excluded from the final architecture. These findings highlight a key limitation: multi-scale local attention alone is insufficient to fully resolve long-range artifacts, reinforcing the importance of combining both local and global attention mechanisms for robust AV1 artifact suppression.
While MS-MTSA demonstrates improved BD-rate and perceptual quality, it introduces a modest increase in computational complexity—specifically, a 2.6% rise in parameter count and an 18.6% increase in MACs compared to the original MTSA, as detailed in Section 4.2. Additionally, this study does not include a real-time inference analysis on practical hardware setups. These limitations suggest that further work is needed to optimize runtime performance and evaluate deployment feasibility.
Future research will focus on investigating the role of the PWSA module itself, which remains the most complex component of the network in terms of both parameter count and spatial operations. While the refined version introduced in this study successfully addresses prior visual artifacts, its reliance on transposed convolution and post-processing still imposes non-trivial overhead. Developing a more efficient alternative that retains PWSA’s global context modeling while reducing complexity represents a promising direction for improving both inference speed and scalability across hardware platforms.
Author Contributions
Conceptualization, W.G.; methodology, W.G. and K.C.; software, W.G.; validation, W.G. and K.C.; formal analysis, K.C. and G.H.P.; investigation, W.G. and G.H.P.; resources, W.G.; data curation, W.G. and K.C.; writing—original draft preparation, W.G.; writing—review and editing, K.C. and G.H.P.; visualization, W.G.; supervision, K.C. and G.H.P.; project administration, K.C. and G.H.P.; funding acquisition, K.C. All authors have read and agreed to the published version of the manuscript.
Funding
This work was supported by the National Supercomputing Center with supercomputing resources including technical support (KSC-2024-CRE-0393).
Data Availability Statement
The original contributions presented in the study are included in the article; further inquiries can be directed to the corresponding author.
Conflicts of Interest
The authors declare no conflicts of interest.
References
- Uhrina, M.; Sevcik, L.; Bienik, J.; Smatanova, L. Performance Comparison of VVC, AV1, HEVC, and AVC for High Resolutions. Electronics 2024, 13, 953. [Google Scholar] [CrossRef]
- Chen, Y.; Murherjee, D.; Han, J.; Grange, A.; Xu, Y.; Liu, Z.; Parker, S.; Chen, C.; Su, H.; Joshi, U.; et al. An overview of core coding tools in the AV1 video code. In Proceedings of the 2018 Picture Coding Symposium (PCS), San Francisco, CA, USA, 24–27 June 2018; pp. 41–45. [Google Scholar]
- Han, J.; Li, B.; Mukherjee, D.; Chiang, C.; Grange, A.; Chen, C.; Su, H.; Parker, S.; Deng, S.; Joshi, U.; et al. A Technical Overview of AV1. arXiv 2020, arXiv:2008.06091. [Google Scholar] [CrossRef]
- Gwun, W.; Choi, K.; Park, G.H. Multi-Type Self-Attention-Based Convolutional-Neural-Network Post-Filtering for AV1 Codec. Mathematics 2024, 12, 2874. [Google Scholar] [CrossRef]
- Zhao, X.; Lei, Z.; Norkin, A.; Daede, T.; Tourapis, A. AOM Common Test Conditions v2.0. Alliance for Open Media, Codec Working Group. 2021. Available online: https://aomedia.org/docs/CWG-B075o_AV2_CTC_v2.pdf (accessed on 29 April 2025).
- Wang, Y.; Zhu, H.; Li, Y.; Chen, Z.; Liu, S. Dense Residual Convolutional Neural Network based In-Loop Filter for HEVC. In Proceedings of the 2018 IEEE Visual Communications and Image Processing (VCIP), Taichung, Taiwan, 9–12 December 2018; pp. 1–4. [Google Scholar]
- Chen, S.; Chen, Z.; Wang, Y.; Liu, S. In-Loop Filter with Dense Residual Convolutional Neural Network for VVC. In Proceedings of the 2020 IEEE Conference on Multimedia Information Processing and Retrieval (MIPR), Shenzhen, China, 6–8 August 2020; pp. 149–152. [Google Scholar]
- Zhao, Y.; Lin, K.; Wang, S.; Ma, S. Joint Luma and Chroma Multi-Scale CNN In-loop Filter for Versatile Video Coding. In Proceedings of the 2022 IEEE International Symposium on Circuits and Systems (ISCAS), Austin, TX, USA, 27 May–1 June 2022; pp. 3205–3208. [Google Scholar]
- Kathariya, B.; Li, Z.; Van der Auwera, G. Joint Pixel and Frequency Feature Learning and Fusion via Channel-Wise Transformer for High-Efficiency Learned In-Loop Filter in VVC. IEEE Trans. Circuits Syst. Video Technol. 2024, 34, 4070–4082. [Google Scholar] [CrossRef]
- Guan, Z.; Xing, Q.; Xu, M.; Yang, R.; Liu, T.; Wang, Z. MFQE 2.0: A New Approach for Multi-Frame Quality Enhancement on Compressed Video. IEEE Trans. Pattern Anal. Mach. Intell. 2021, 43, 949–962. [Google Scholar] [CrossRef]
- Lin, W.; He, X.; Han, X.; Liu, D.; See, J.; Zou, J.; Xiong, H.; Wu, F. Partition-Aware Adaptive Switching Neural Networks for Post-Processing in HEVC. IEEE Trans. Multimed. 2020, 22, 2749–2763. [Google Scholar] [CrossRef]
- Zhang, F.; Feng, C.; Bull, D.R. Enhancing VVC through CNN-Based Post-Processing. In Proceedings of the 2020 IEEE International Conference on Multimedia and Expo (ICME), London, UK, 6–10 July 2020; pp. 1–6. [Google Scholar]
- Ma, D.; Zhang, F.; Bull, D.R. MFRNet: A New CNN Architecture for Post-Processing and In-Loop Filtering. IEEE J. Sel. Top. Signal Process. 2021, 15, 956–969. [Google Scholar] [CrossRef]
- Liu, T.; Cui, W.; Hui, C.; Jiang, F.; Gao, Y.; Xie, S.; Wu, P. AHG11: Post-Process Filter Based on Fusion of CNN and Transformer. In Proceedings of the Joint Video Experts Team (JVET) of ITU-T SG 16 WP 3 and ISO/IEC JTC 1/SC 29, 26th Meeting, Teleconference, 20–29 April 2022. JVET-Z0101-v2. [Google Scholar]
- Sullivan, G.J.; Ohm, J.-R.; Han, W.-J.; Wiegand, T. Overview of the High Efficiency Video Coding (HEVC) Standard. IEEE Trans. Circuits Syst. Video Technol. 2012, 22, 1649–1668. [Google Scholar] [CrossRef]
- Bross, B.; Wang, Y.-K.; Ye, Y.; Liu, S.; Chen, J.; Sullivan, G.J.; Ohm, J.-R. Overview of the Versatile Video Coding (VVC) Standard and Its Applications. IEEE Trans. Circuits Syst. Video Technol. 2021, 31, 3736–3764. [Google Scholar] [CrossRef]
- Yu, L.; Chang, W.; Wu, S.; Gabbouj, M. End-to-End Transformer for Compressed Video Quality Enhancement. arXiv 2022, arXiv:2210.13827. [Google Scholar] [CrossRef]
- Li, H.; He, X.; Xiong, S.; Zhang, Y.; Chen, B. A Compressed Video Quality Enhancement Algorithm Based on CNN and Transformer Hybrid Network. J. Supercomput. 2025, 81, 144. [Google Scholar] [CrossRef]
- Zheng, M.; Xing, Q.; Qiao, M.; Xu, M.; Jiang, L.; Liu, H.; Chen, Y. Progressive Training of a Two-Stage Framework for Video Restoration. arXiv 2022, arXiv:2204.09924. [Google Scholar] [CrossRef]
- Qiu, Z.; Yang, H.; Fu, J.; Fu, D. Learning Spatiotemporal Frequency-Transformer for Compressed Video Super-Resolution. arXiv 2022, arXiv:2208.03012. [Google Scholar] [CrossRef]
- Ma, Z.; Wang, Y.; Tohidypour, H.R.; Nasiopoulos, P.; Leung, V.C.M. A Swin Transformer Based Restoration Scheme for VVC Compressed Images. In Proceedings of the International Conference on Advances in Multimedia (MMEDIA), Nice, France, 26–30 June 2023; IARIA: Nice, France, 2023; pp. 1–5, ISBN 978-1-68558-072-8. [Google Scholar]
- Santamaria, M.; Yang, R.; Cricri, F.; Zhang, H.; Lainema, J.; Youvalari, R.G.; Tavakoli, H.R.; Hannuksela, M.M. Overfitting Multiplier Parameters for Content-Adaptive Post-Filtering in Video Coding. In Proceedings of the 10th European Workshop on Visual Information Processing (EUVIP), Lisbon, Portugal, 11–14 September 2022; pp. 1–6. [Google Scholar]
- Das, T.; Choi, K.; Choi, J. High Quality Video Frames From VVC: A Deep Neural Network Approach. IEEE Access 2023, 11, 54254–54264. [Google Scholar] [CrossRef]
- Zhang, F.; Ma, D.; Feng, C.; Bull, D.R. Video Compression with CNN-Based Postprocessing. IEEE Multimed. 2021, 28, 74–83. [Google Scholar] [CrossRef]
- Ramsook, D.; Kokaram, A. A Neural Enhancement Post-Processor with a Dynamic AV1 Encoder Configuration Strategy for CLIC 2024. arXiv 2024, arXiv:2401.18021. [Google Scholar] [CrossRef]
- Jiang, Y.; Nawała, J.; Feng, C.; Zhang, F.; Zhu, X.; Sole, J.; Bull, D. RTSR: A Real-Time Super-Resolution Model for AV1 Compressed Content. arXiv 2024, arXiv:2411.13362. [Google Scholar] [CrossRef]
- Dehaghi, A.M.; Razavi, R.; Moshirpour, M. Reversing the Damage: A QP-Aware Transformer-Diffusion Approach for 8K Video Restoration under Codec Compression. arXiv 2024, arXiv:2412.08912. [Google Scholar] [CrossRef]
- Wang, L.; Zhang, R.; Zhang, Y.; Dong, C.; Loy, C.C. NTIRE 2022 Challenge on Quality Enhancement of Compressed Video: Methods and Results. In Proceedings of the IEEE/CVF Conference on Computer Vision and Pattern Recognition (CVPR) Workshops, New Orleans, LA, USA, 19–20 June 2022; pp. 2531–2543. [Google Scholar]
- He, K.; Zhang, X.; Ren, S.; Sun, J. Delving Deep into Rectifiers: Surpassing Human-Level Performance on ImageNet Classification. In Proceedings of the 2015 IEEE International Conference on Computer Vision (ICCV), Santiago, Chile, 7–13 December 2015; pp. 1026–1034. [Google Scholar] [CrossRef]
- Xiao, T.; Singh, M.; Mintun, E.; Darrell, T.; Dollár, P.; Girshick, R. Early Convolutions Help Transformers See Better. arXiv 2021, arXiv:2106.14881. [Google Scholar]
- He, K.; Zhang, X.; Ren, S.; Sun, J. Deep Residual Learning for Image Recognition. In Proceedings of the 2016 IEEE Conference on Computer Vision and Pattern Recognition (CVPR), Las Vegas, NV, USA, 27–30 June 2016; pp. 770–778. [Google Scholar]
- Li, Y.; Rusanovskyy, D.; Karczewicz, M. EE1-1.5: Report on implementation of HOP In-loop filter with Transformer blocks. In Proceedings of the Joint Video Experts Team (JVET) of ITU-T SG 16 WP 3 and ISO/IEC JTC 1/SC 29, 33rd Meeting, Online, 17–26 January 2024. Document JVET-AG0162_v1. [Google Scholar]
- Dosovitskiy, A.; Beyer, L.; Kolesnikov, A.; Weissenborn, D.; Zhai, X.; Unterthiner, T.; Dehghani, M.; Minderer, M.; Heigold, G.; Gelly, S.; et al. An Image is Worth 16x16 Words: Transformers for Image Recognition at Scale. In Proceedings of the International Conference on Learning Representations (ICLR), Virtual Event, 3–7 May 2021. [Google Scholar]
- Ma, D.; Zhang, F.; Bull, D.R. BVI-DVC: A Training Database for Deep Video Compression. arXiv 2020, arXiv:2003.13552. [Google Scholar] [CrossRef]
- Nawała, J.; Jiang, Y.; Zhang, F.; Zhu, X.; Sole, J.; Bull, D. BVI-AOM: A New Training Dataset for Deep Video Compression Optimization. arXiv 2024, arXiv:2408.03265. [Google Scholar] [CrossRef]
- AOMediaCodec. SVT-AV1: Scalable Video Technology for AV1 Encoder. Available online: https://gitlab.com/AOMediaCodec/SVT-AV1 (accessed on 29 April 2025).
- Horé, A.; Ziou, D. Image Quality Metrics: PSNR vs. SSIM. In Proceedings of the 20th International Conference on Pattern Recognition (ICPR), Istanbul, Turkey, 23–26 August 2010; IEEE: Piscataway, NJ, USA, 2010; pp. 2366–2369. [Google Scholar]
- Prangnell, L. Visible Light-Based Human Visual System Conceptual Model. Computer Vision and Pattern Recognition. arXiv 2016, arXiv:1609.04830. [Google Scholar]
- Alshina, E.; Galpin, F.; Rusanovskyy, D. AhG11/AhG14 teleconference. In Proceedings of the Joint Video Experts Team (JVET) Meeting, Online, 17–26 January 2024. Document JVET-AG0041-v1. [Google Scholar]
- Paszke, A.; Gross, S.; Massa, F.; Lerer, A.; Bradbury, J.; Chanan, G.; Killeen, T.; Lin, Z.; Gimelshein, N.; Antiga, L.; et al. PyTorch: An imperative style, high-performance deep learning library. In Proceedings of the 33rd International Conference on Neural Information Processing Systems (NeurIPS), Vancouver, BC, Canada, 8–14 December 2019; Curran Associates Inc.: Red Hook, NY, USA, 2019. Article 721. pp. 8026–8037. [Google Scholar]
- Bjontegaard, G. Response to Call for Proposals for H.26L. ITU-T SG16 Doc. Q15-F-11. In Proceedings of the International Telecommunication Union, Sixth Meeting, Seoul, Republic of Korea, 3–6 November 1998. [Google Scholar]
- Barman, N.; Martini, M.G.; Reznik, Y. Revisiting Bjontegaard Delta Bitrate (BD-BR) Computation for Codec Compression Efficiency Comparison. In Proceedings of the 1st Mile-High Video Conference, MHV ’22, New York, NY, USA, 1–3 March 2022; pp. 113–114. [Google Scholar]
- Wang, Z.; Bovik, A.C.; Sheikh, H.R.; Simoncelli, E.P. Image Quality Assessment: From Error Visibility to Structural Similarity. IEEE Trans. Image Process. 2004, 13, 600–612. [Google Scholar] [CrossRef]
- Howard, A.G.; Zhu, M.; Chen, B.; Kalenichenko, D.; Wang, W.; Weyand, T.; Andreetto, M.; Adam, H. MobileNets: Efficient Convolutional Neural Networks for Mobile Vision Applications. arXiv 2017, arXiv:1704.04861. [Google Scholar]
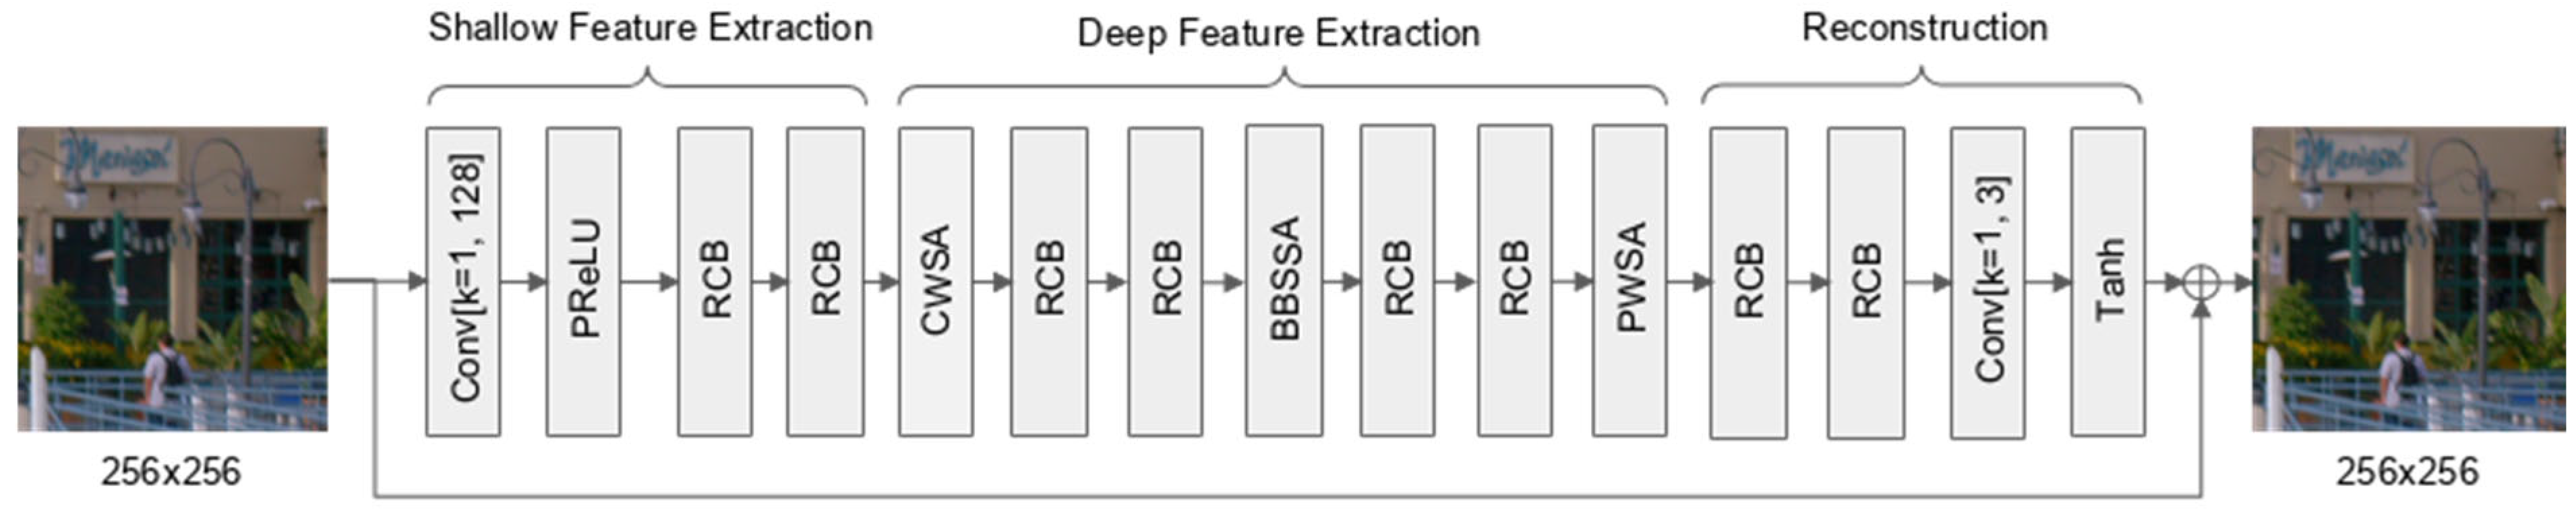
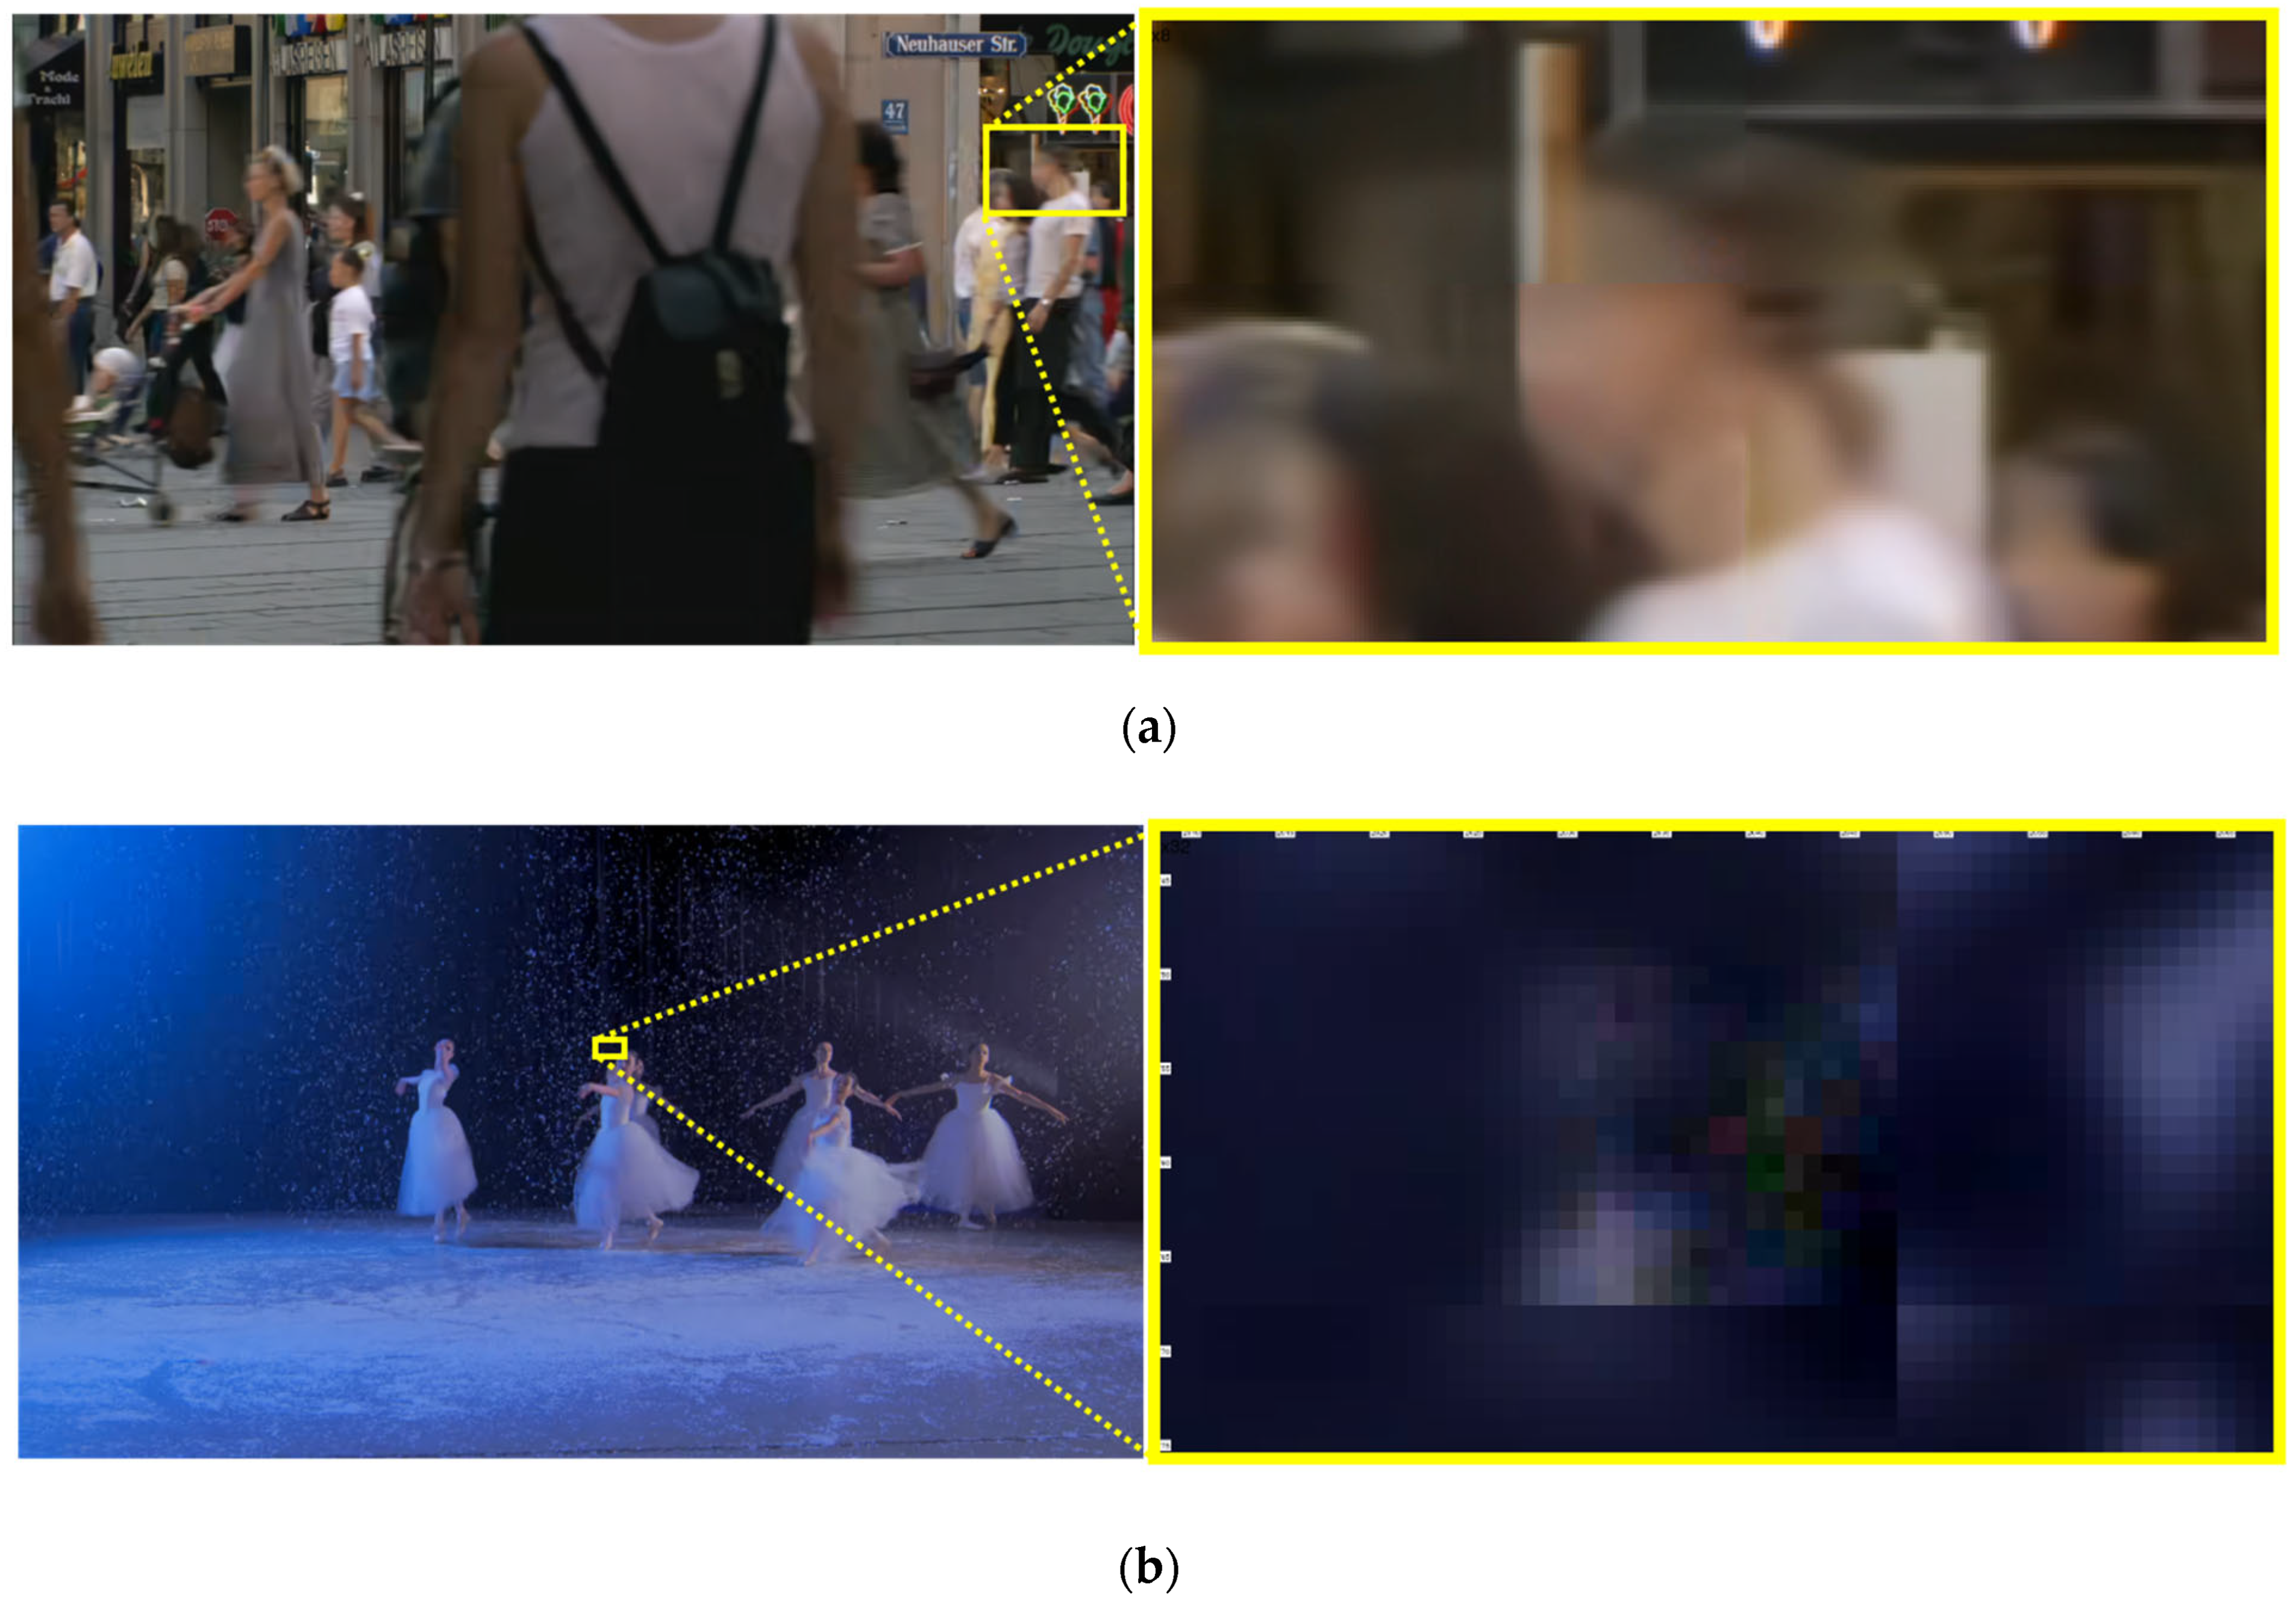
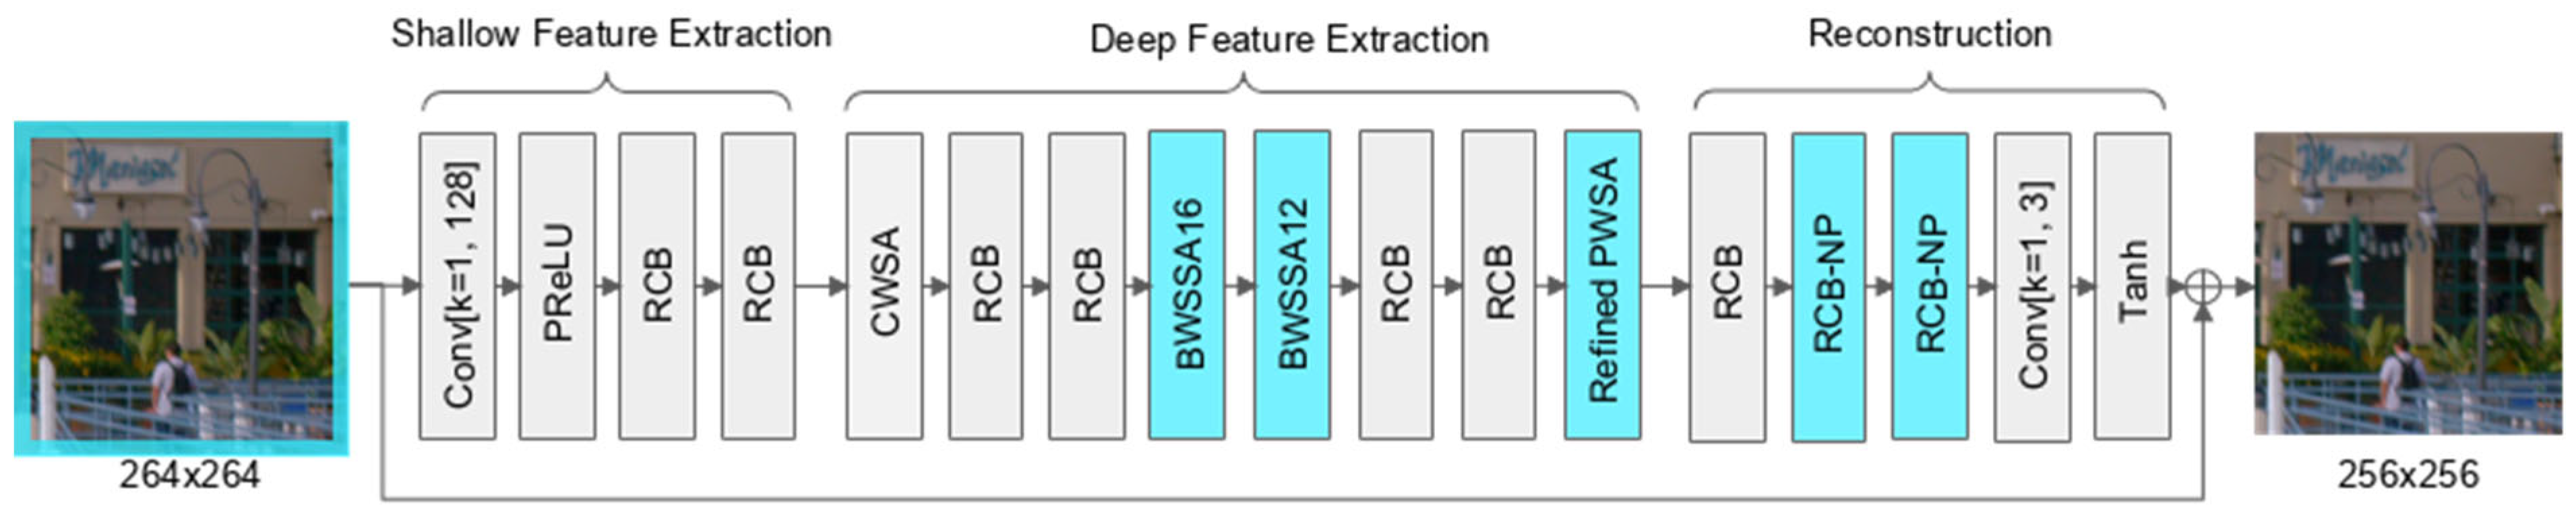
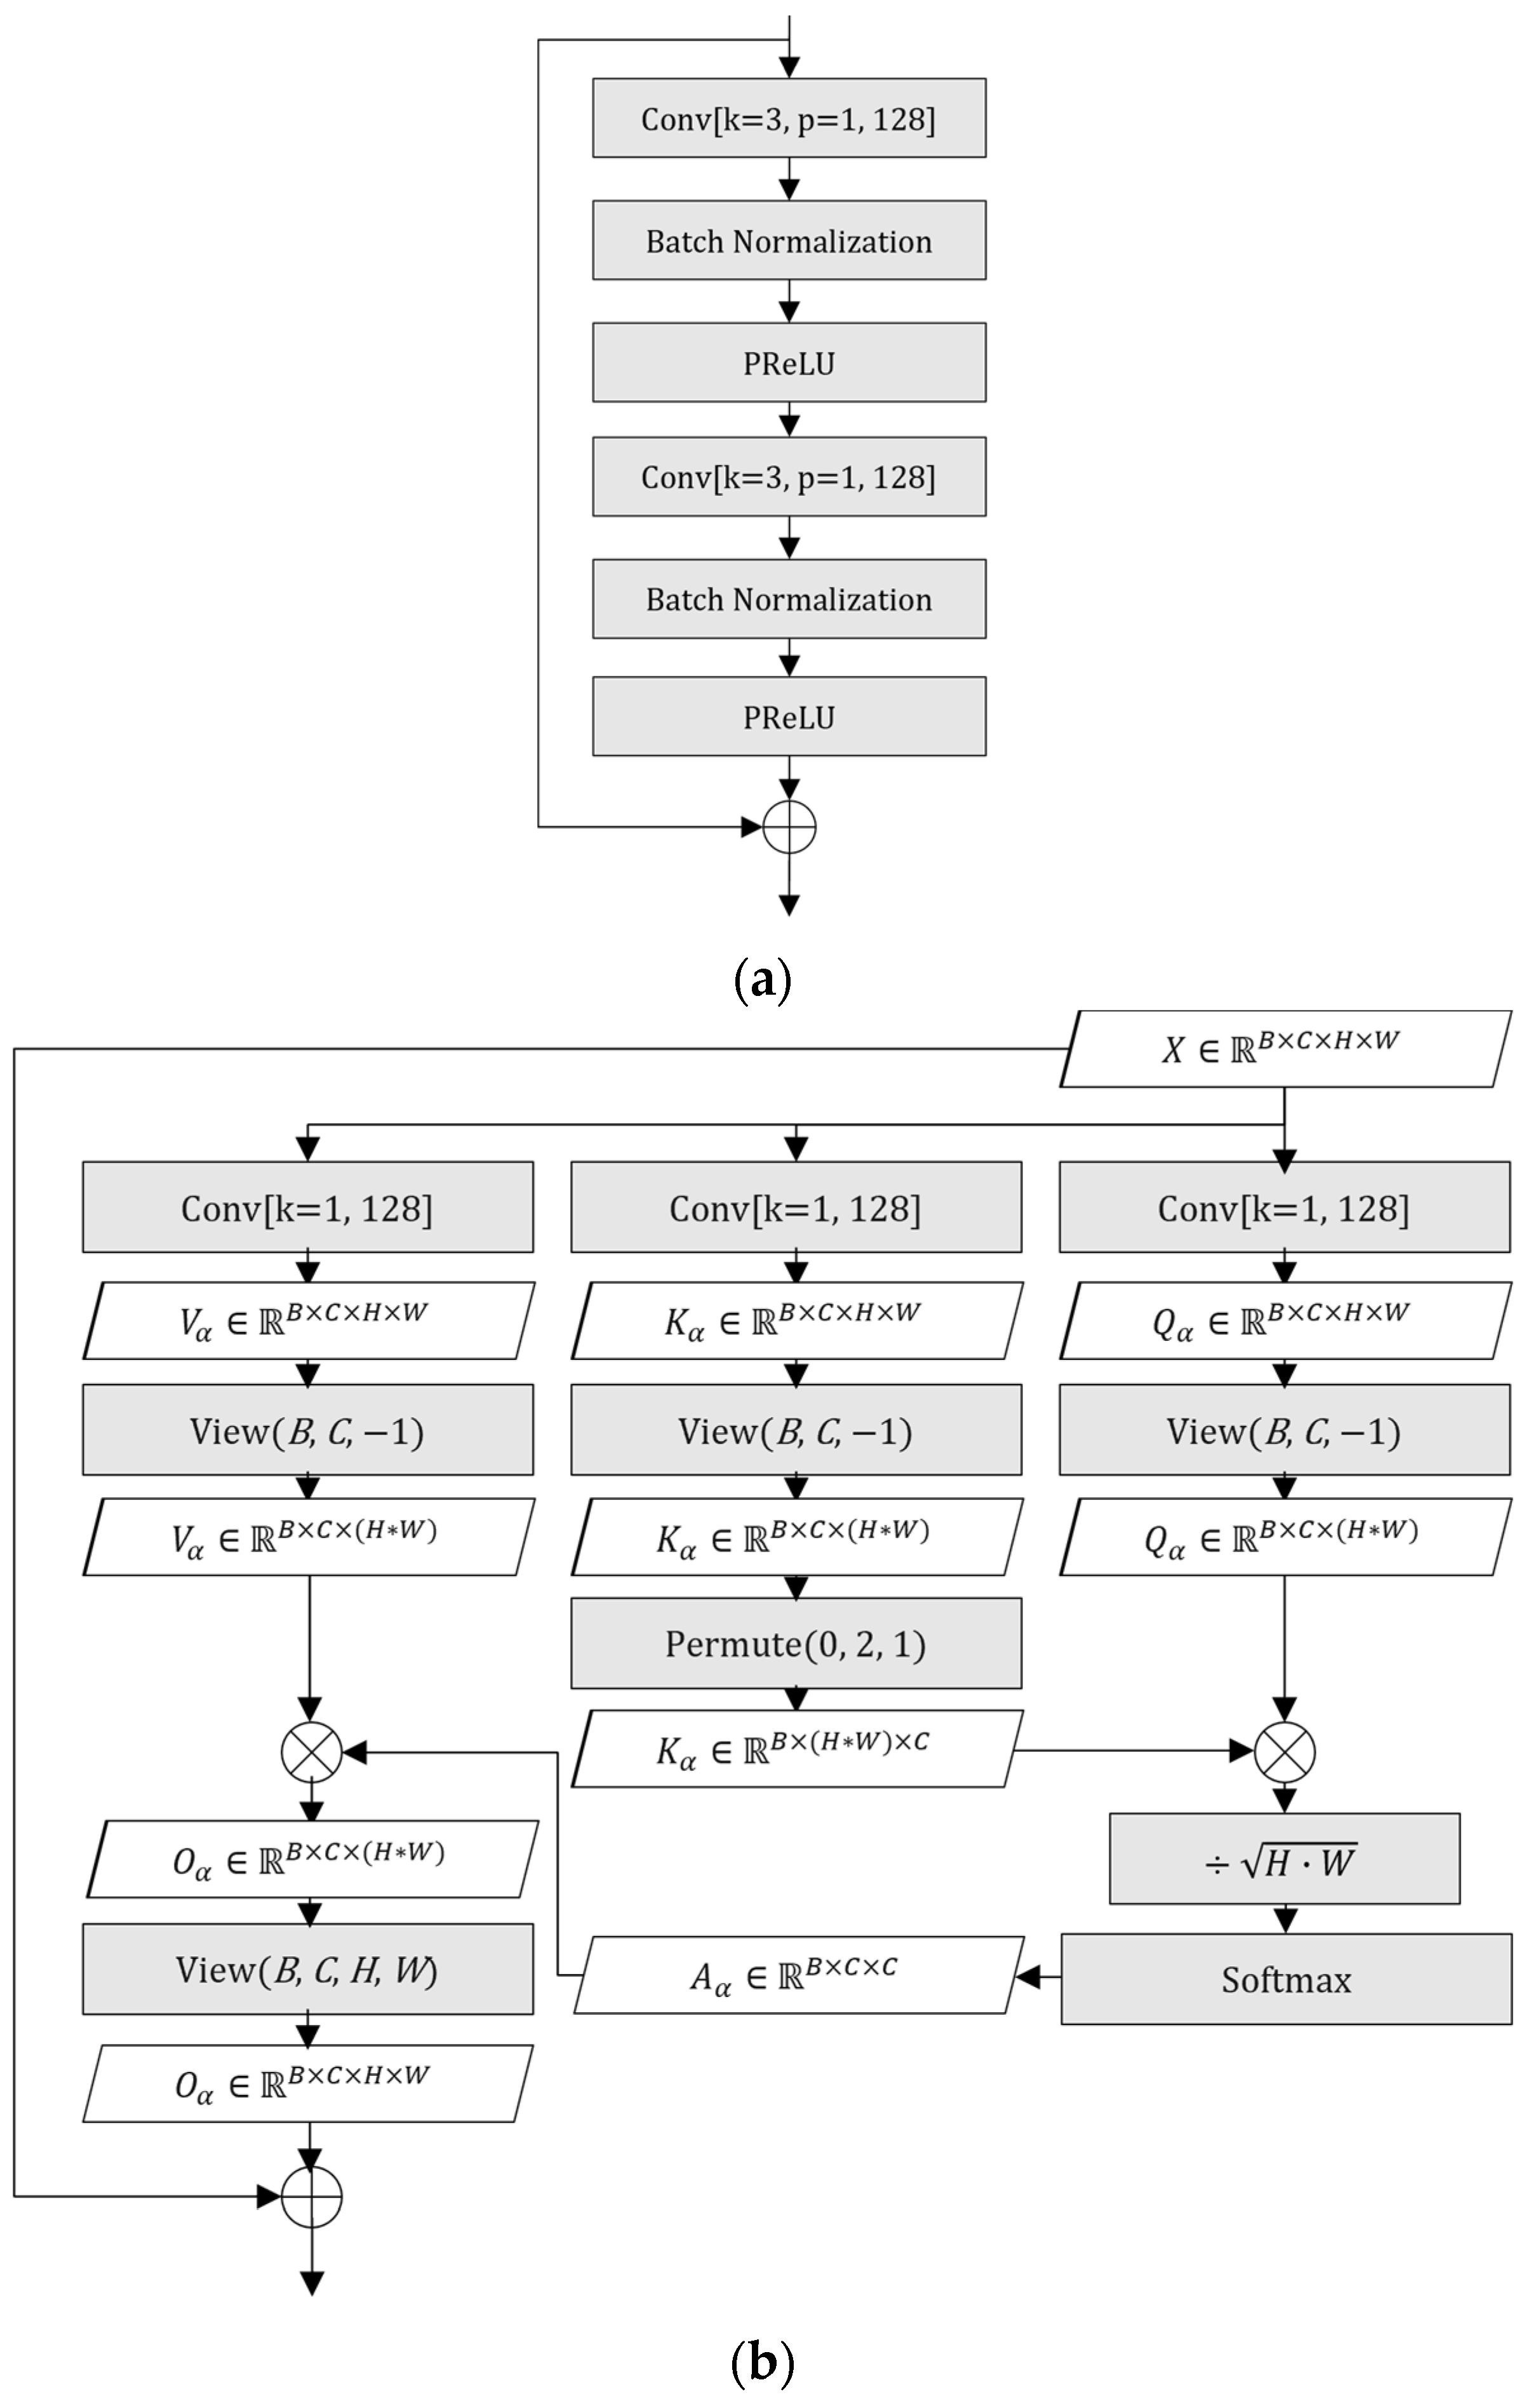
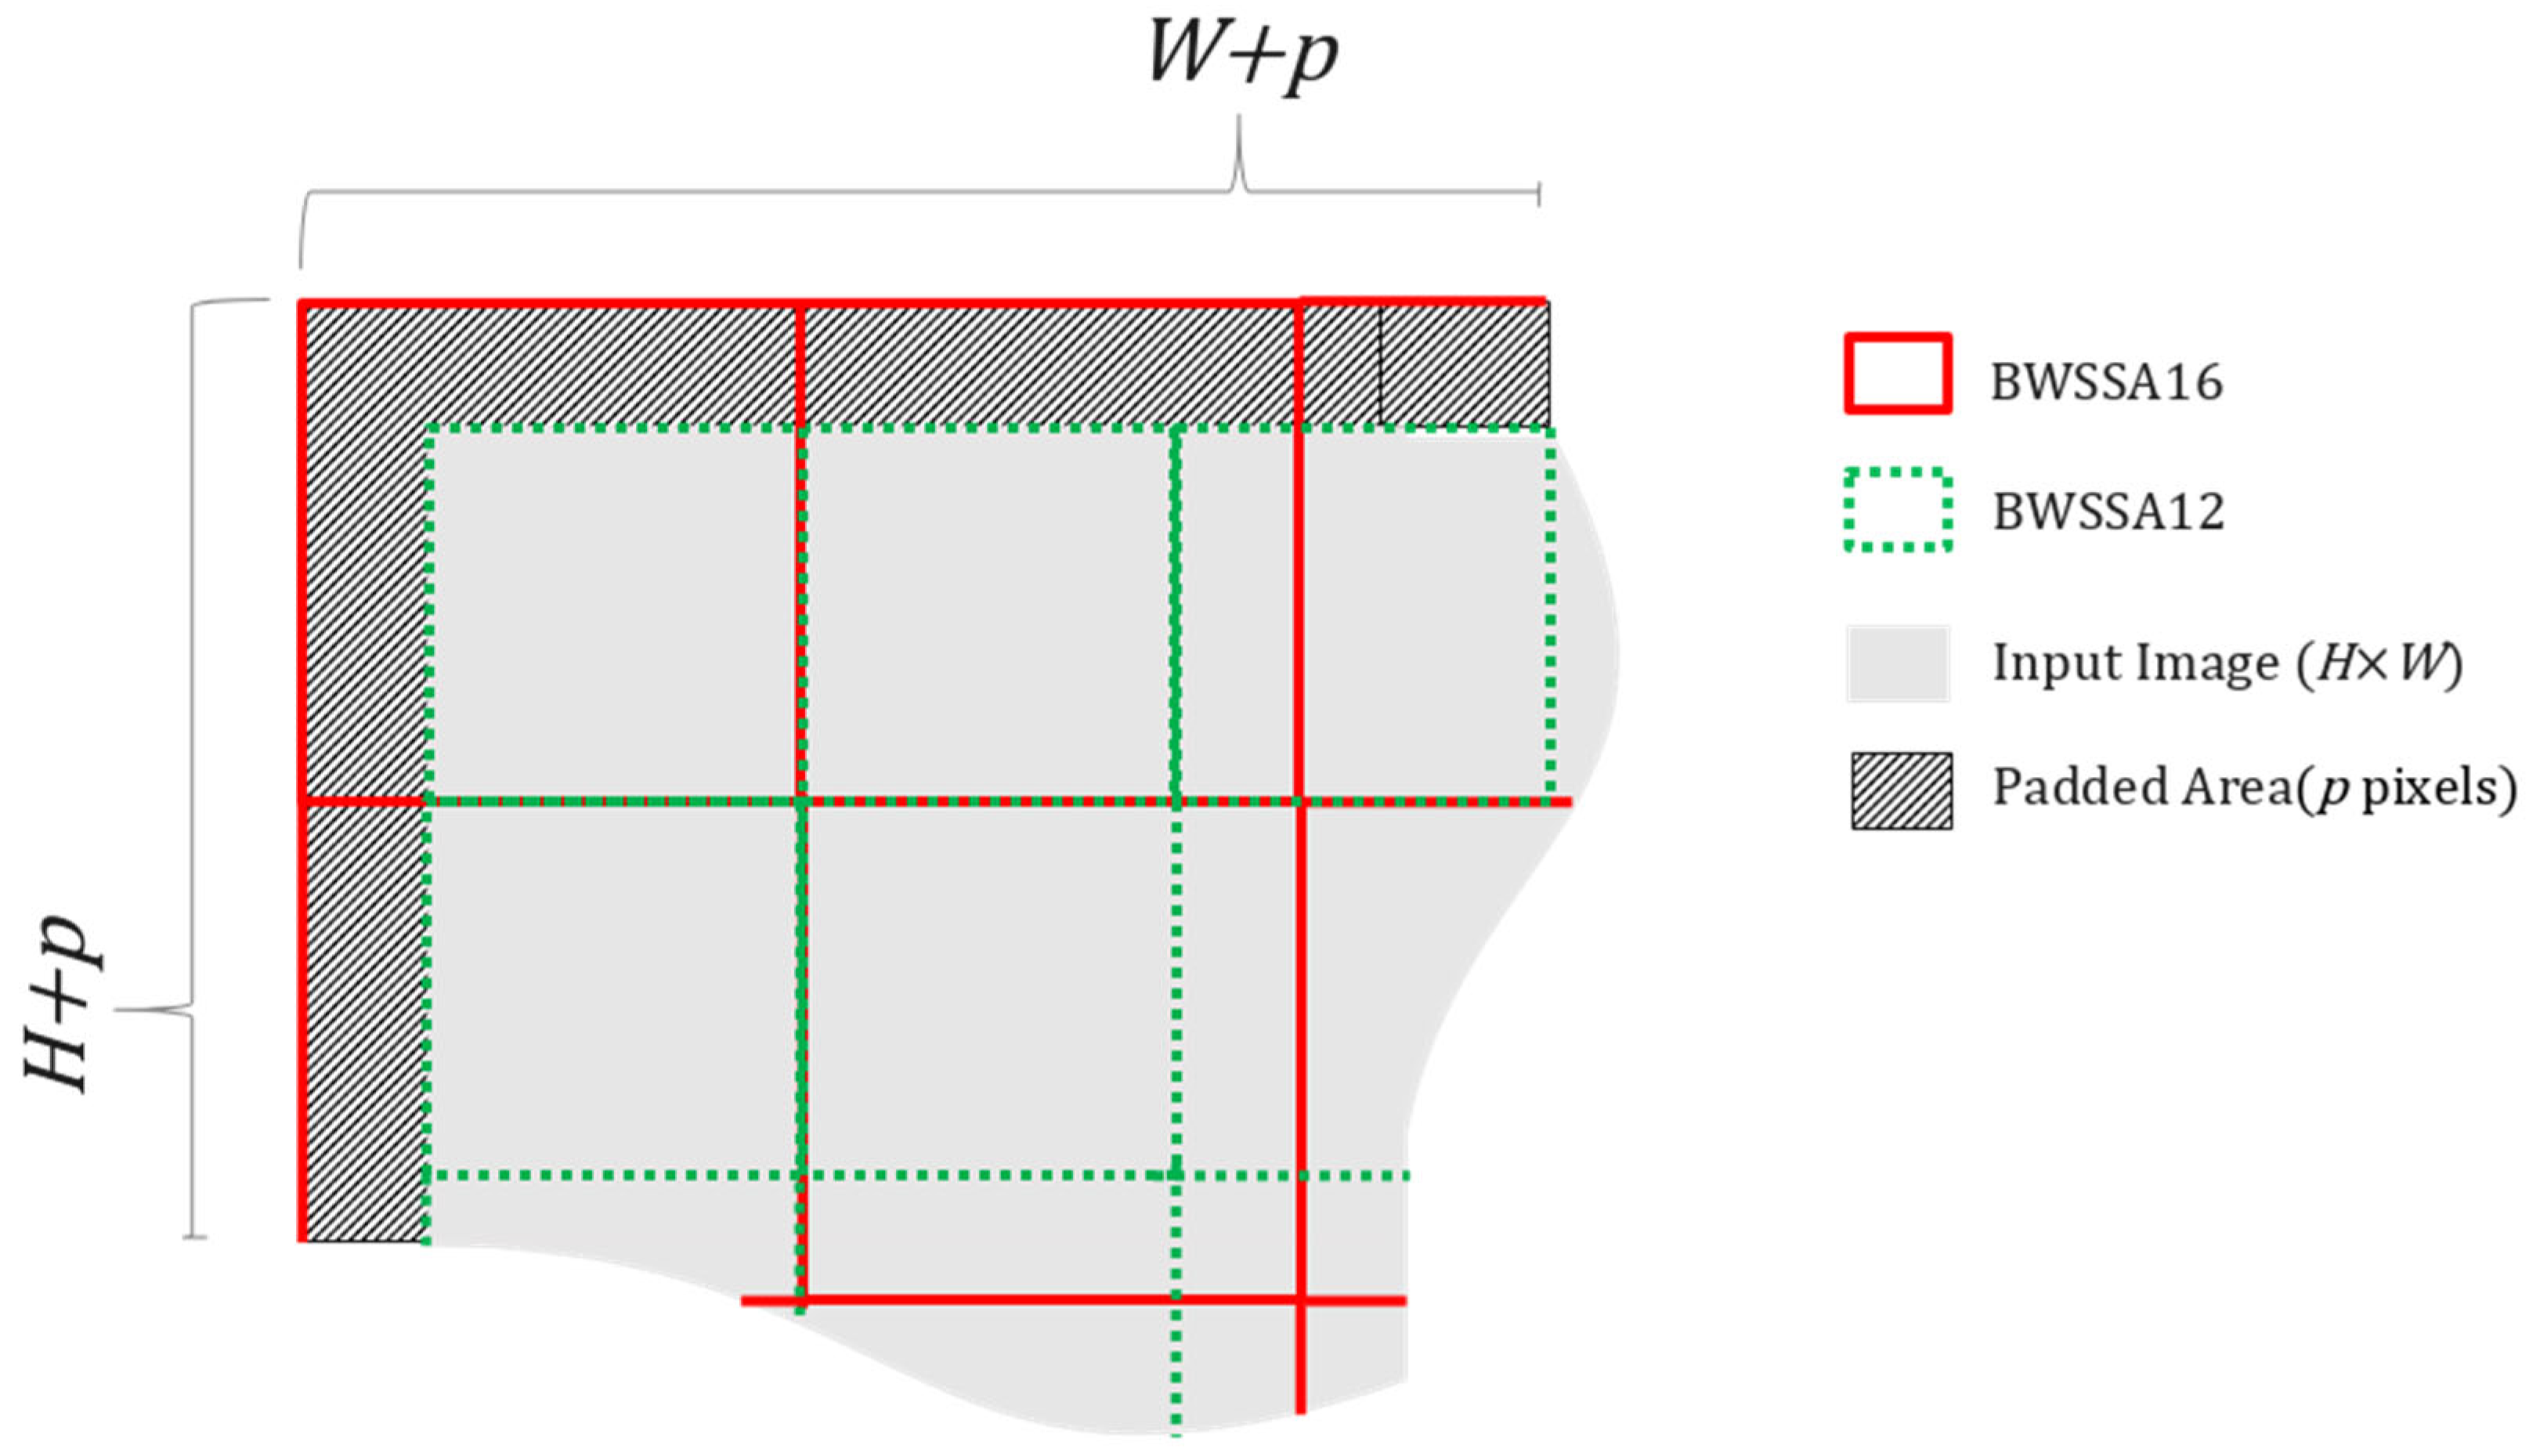
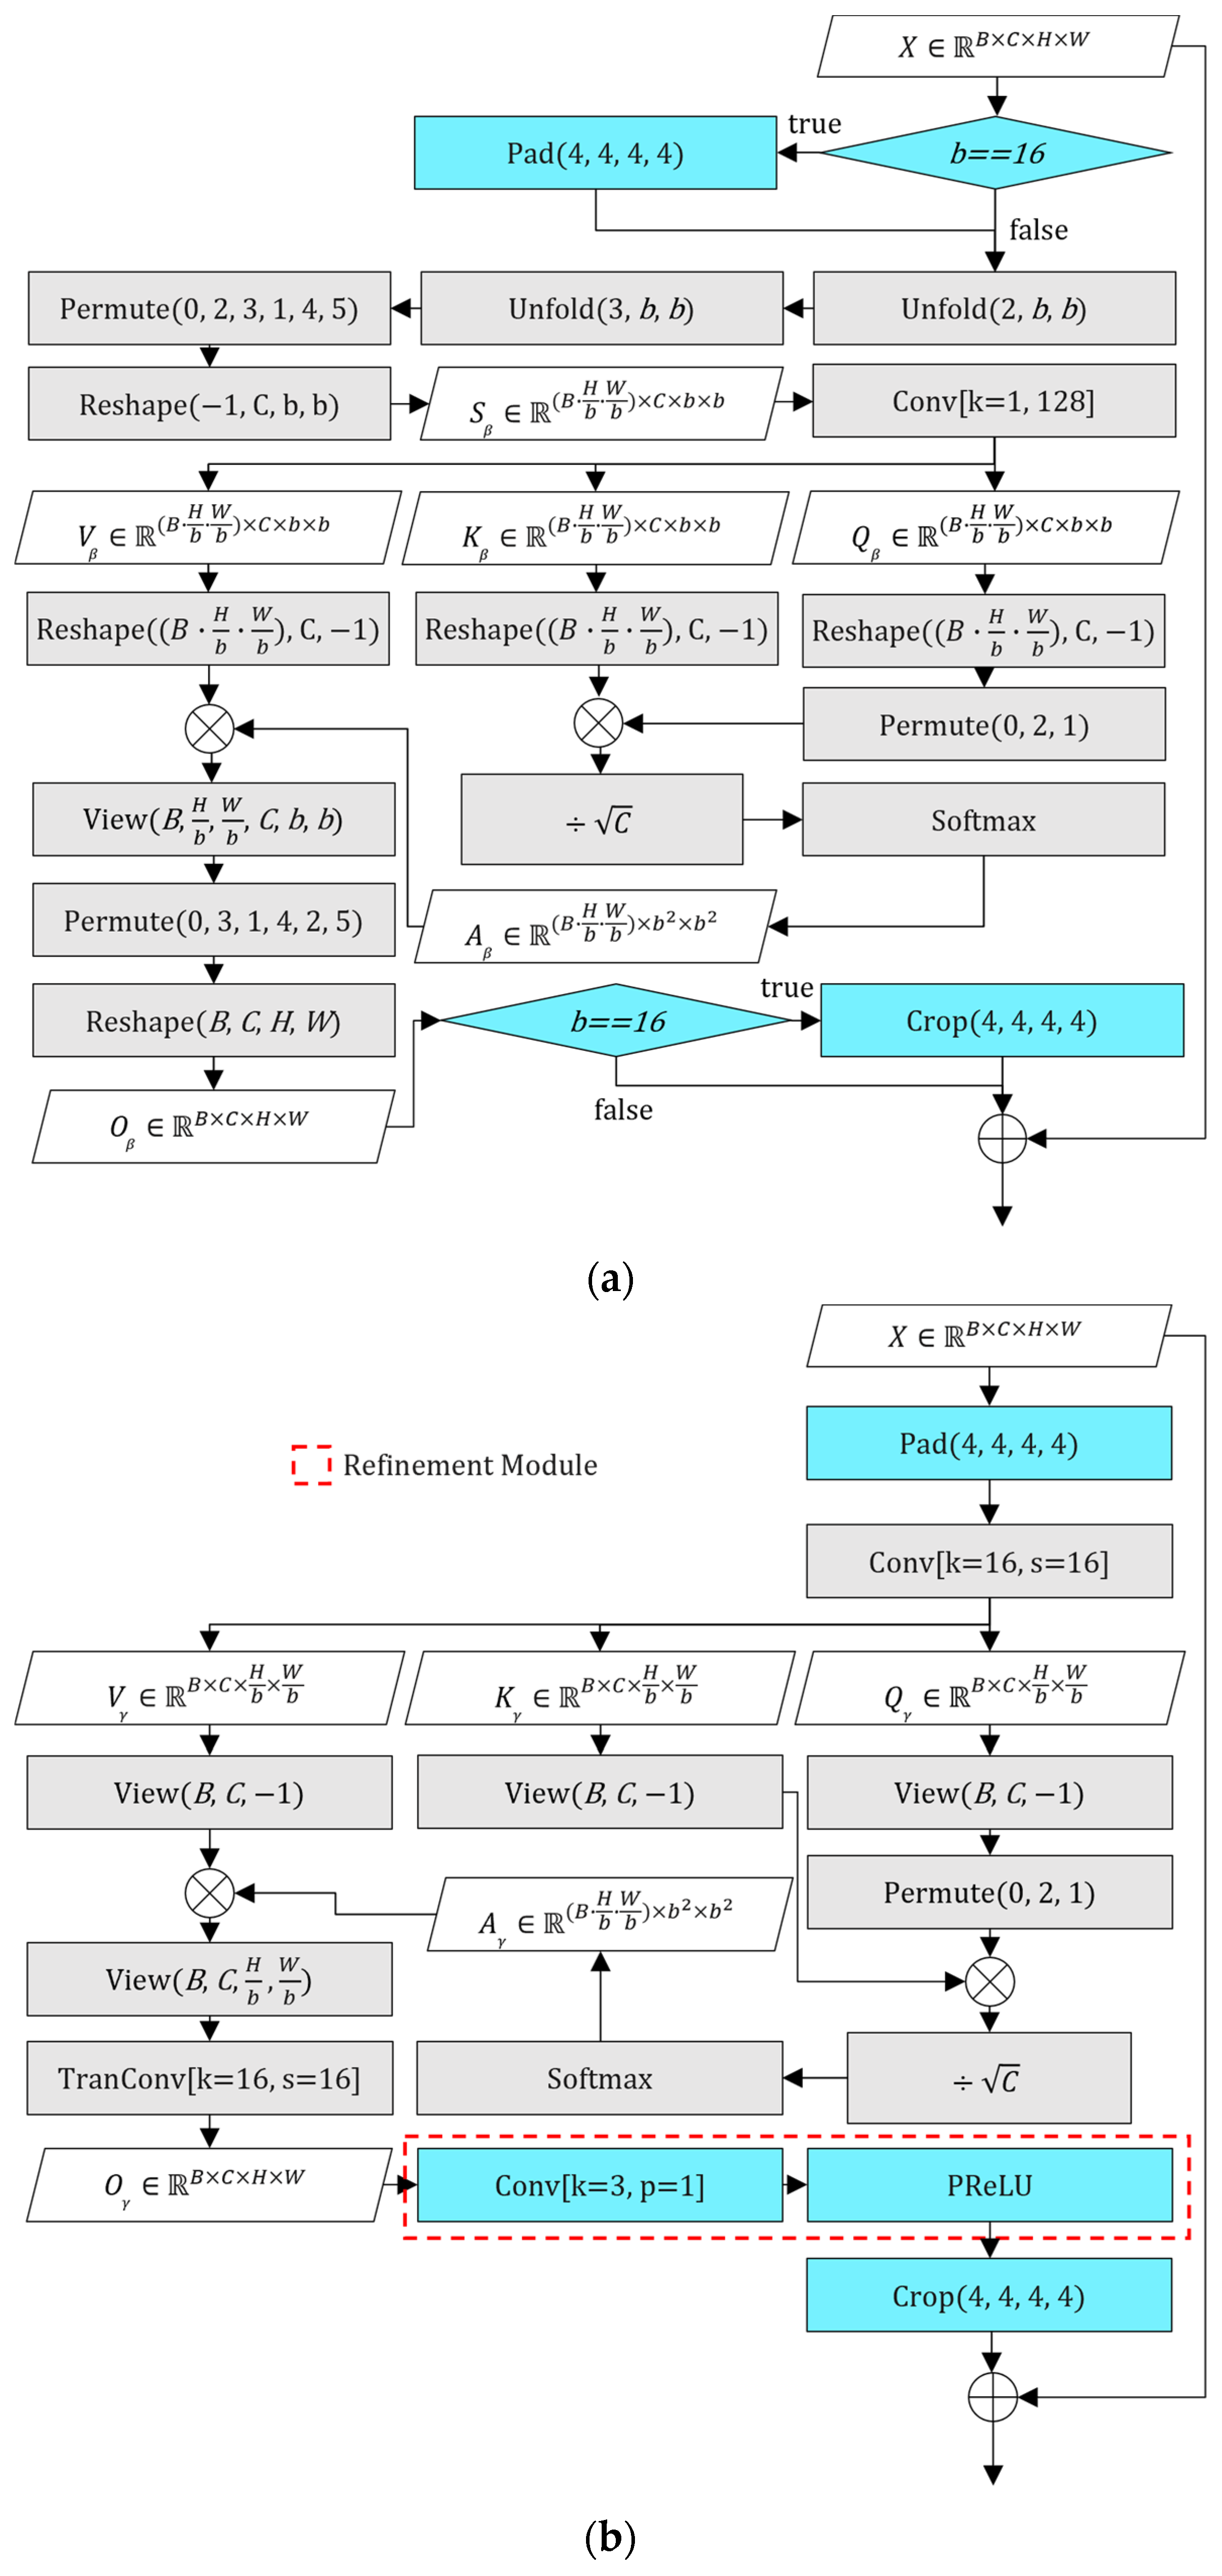
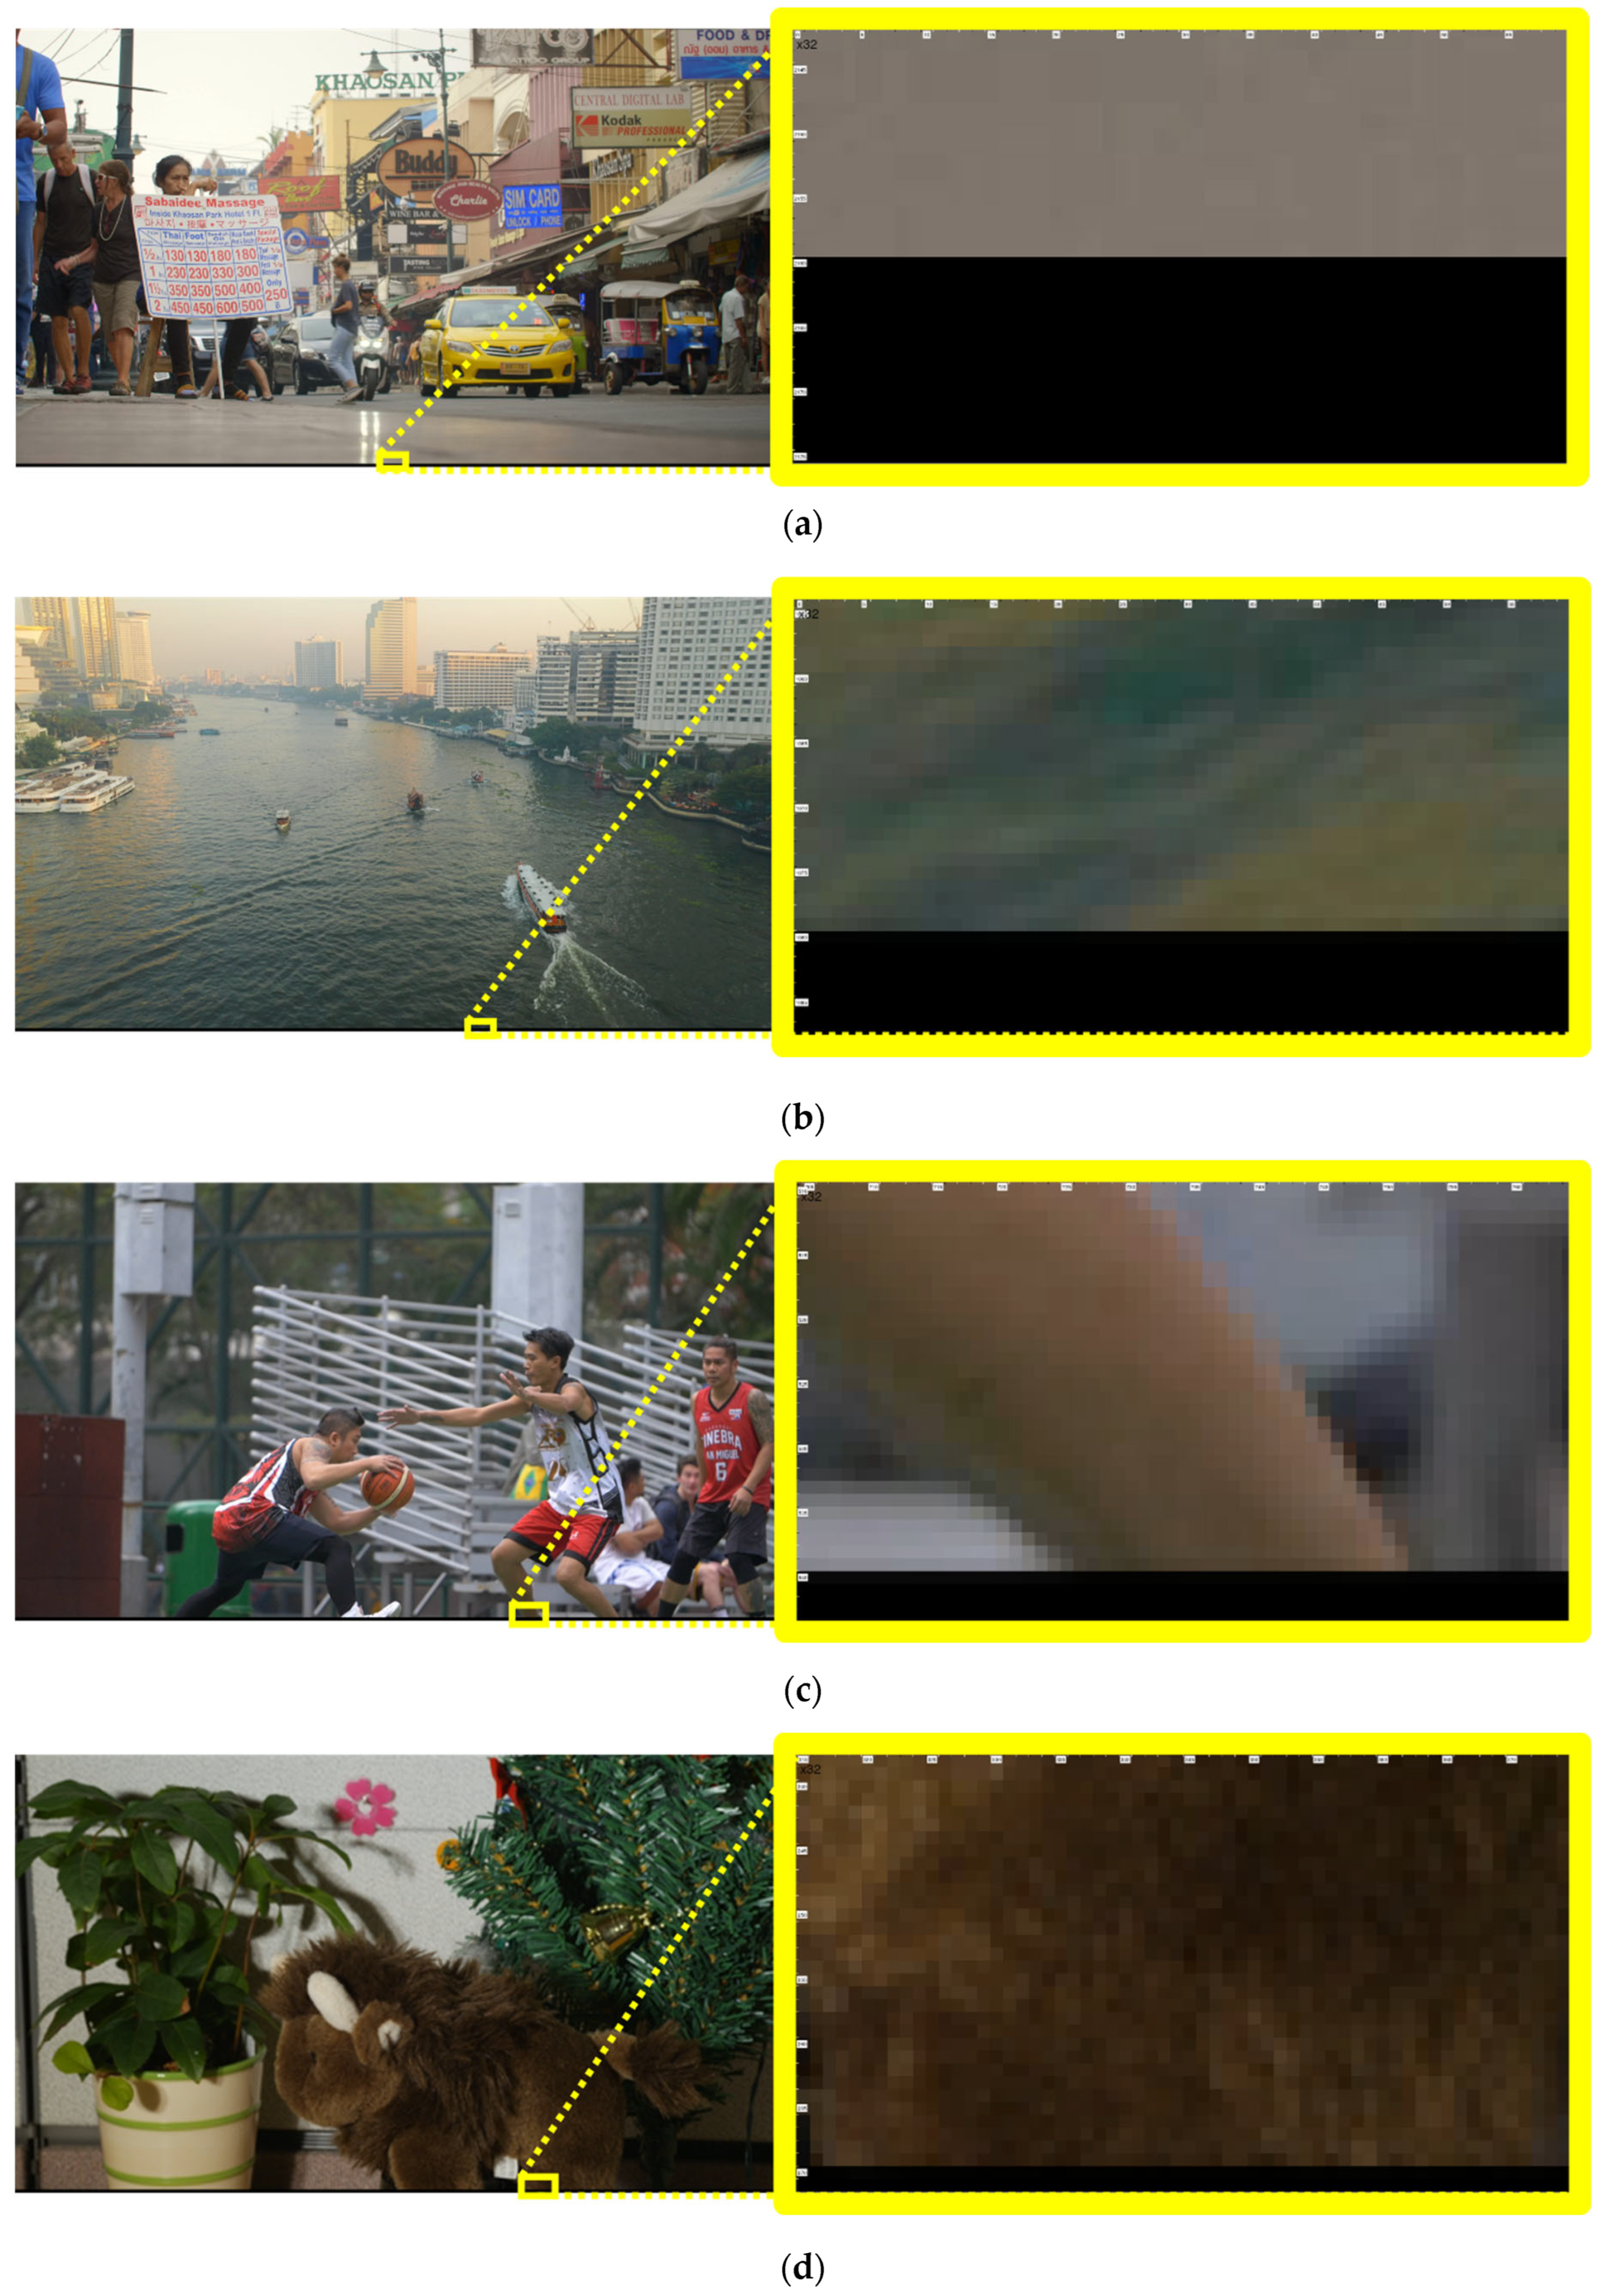
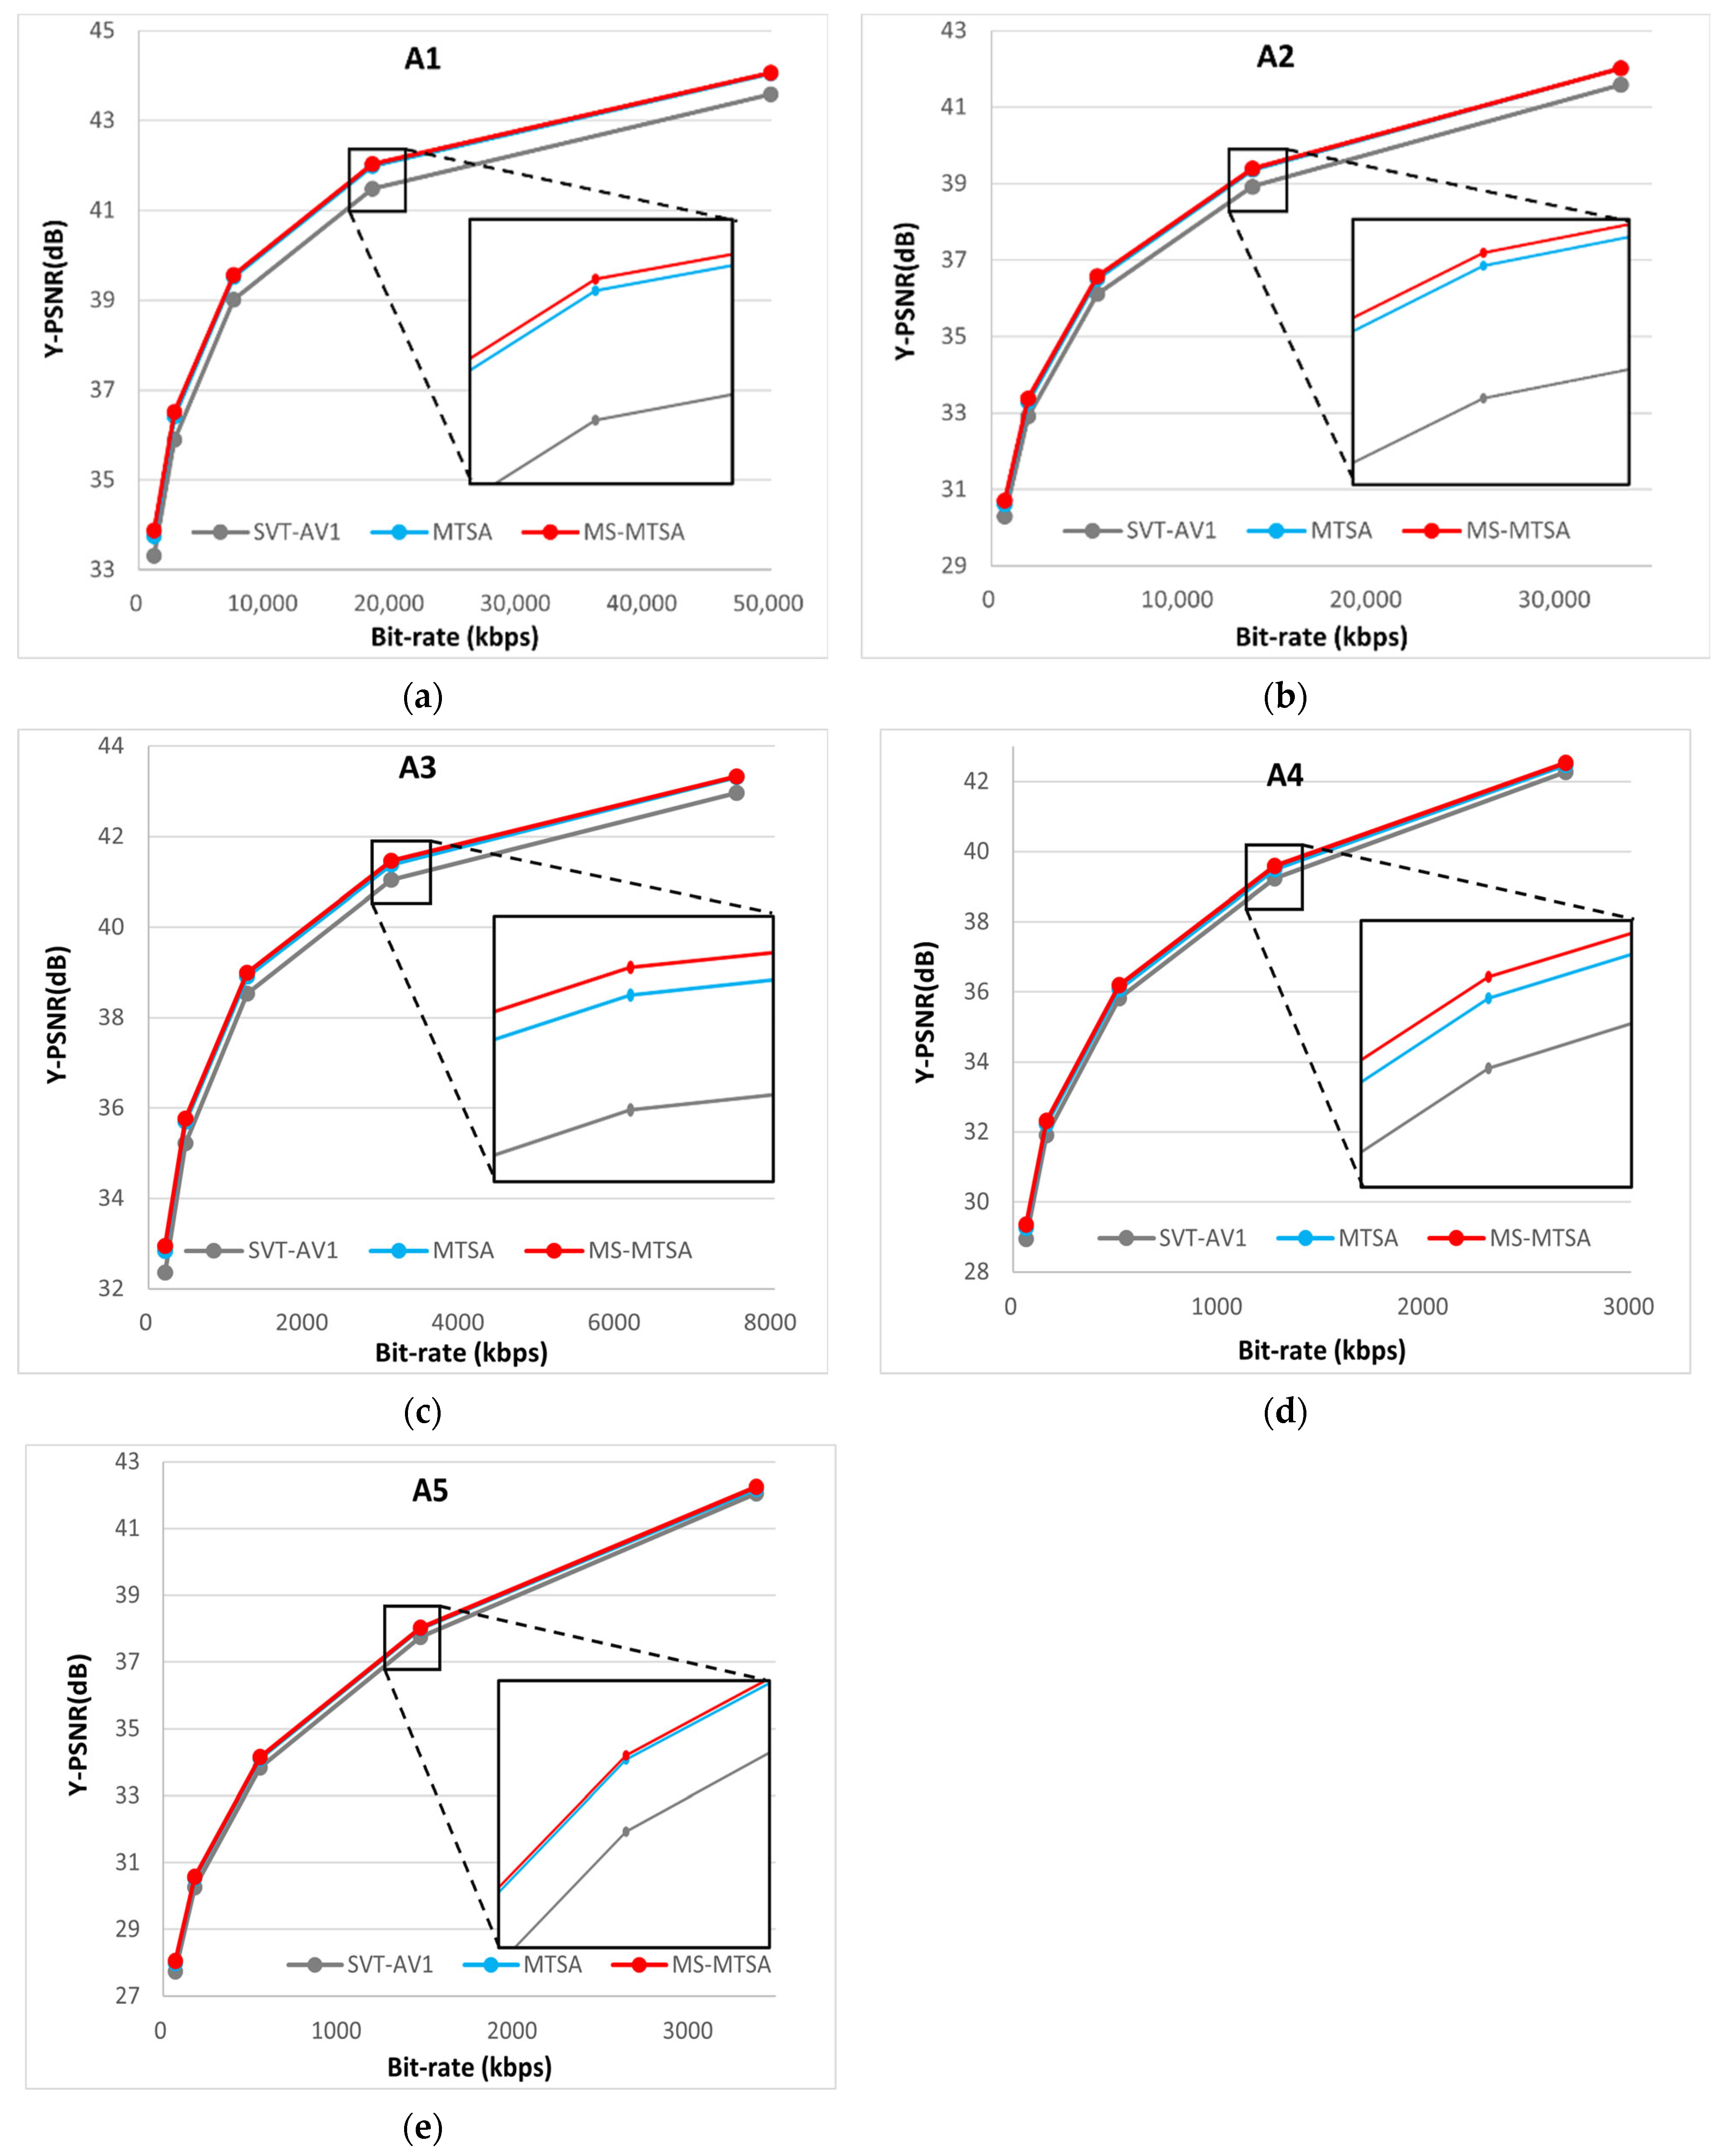


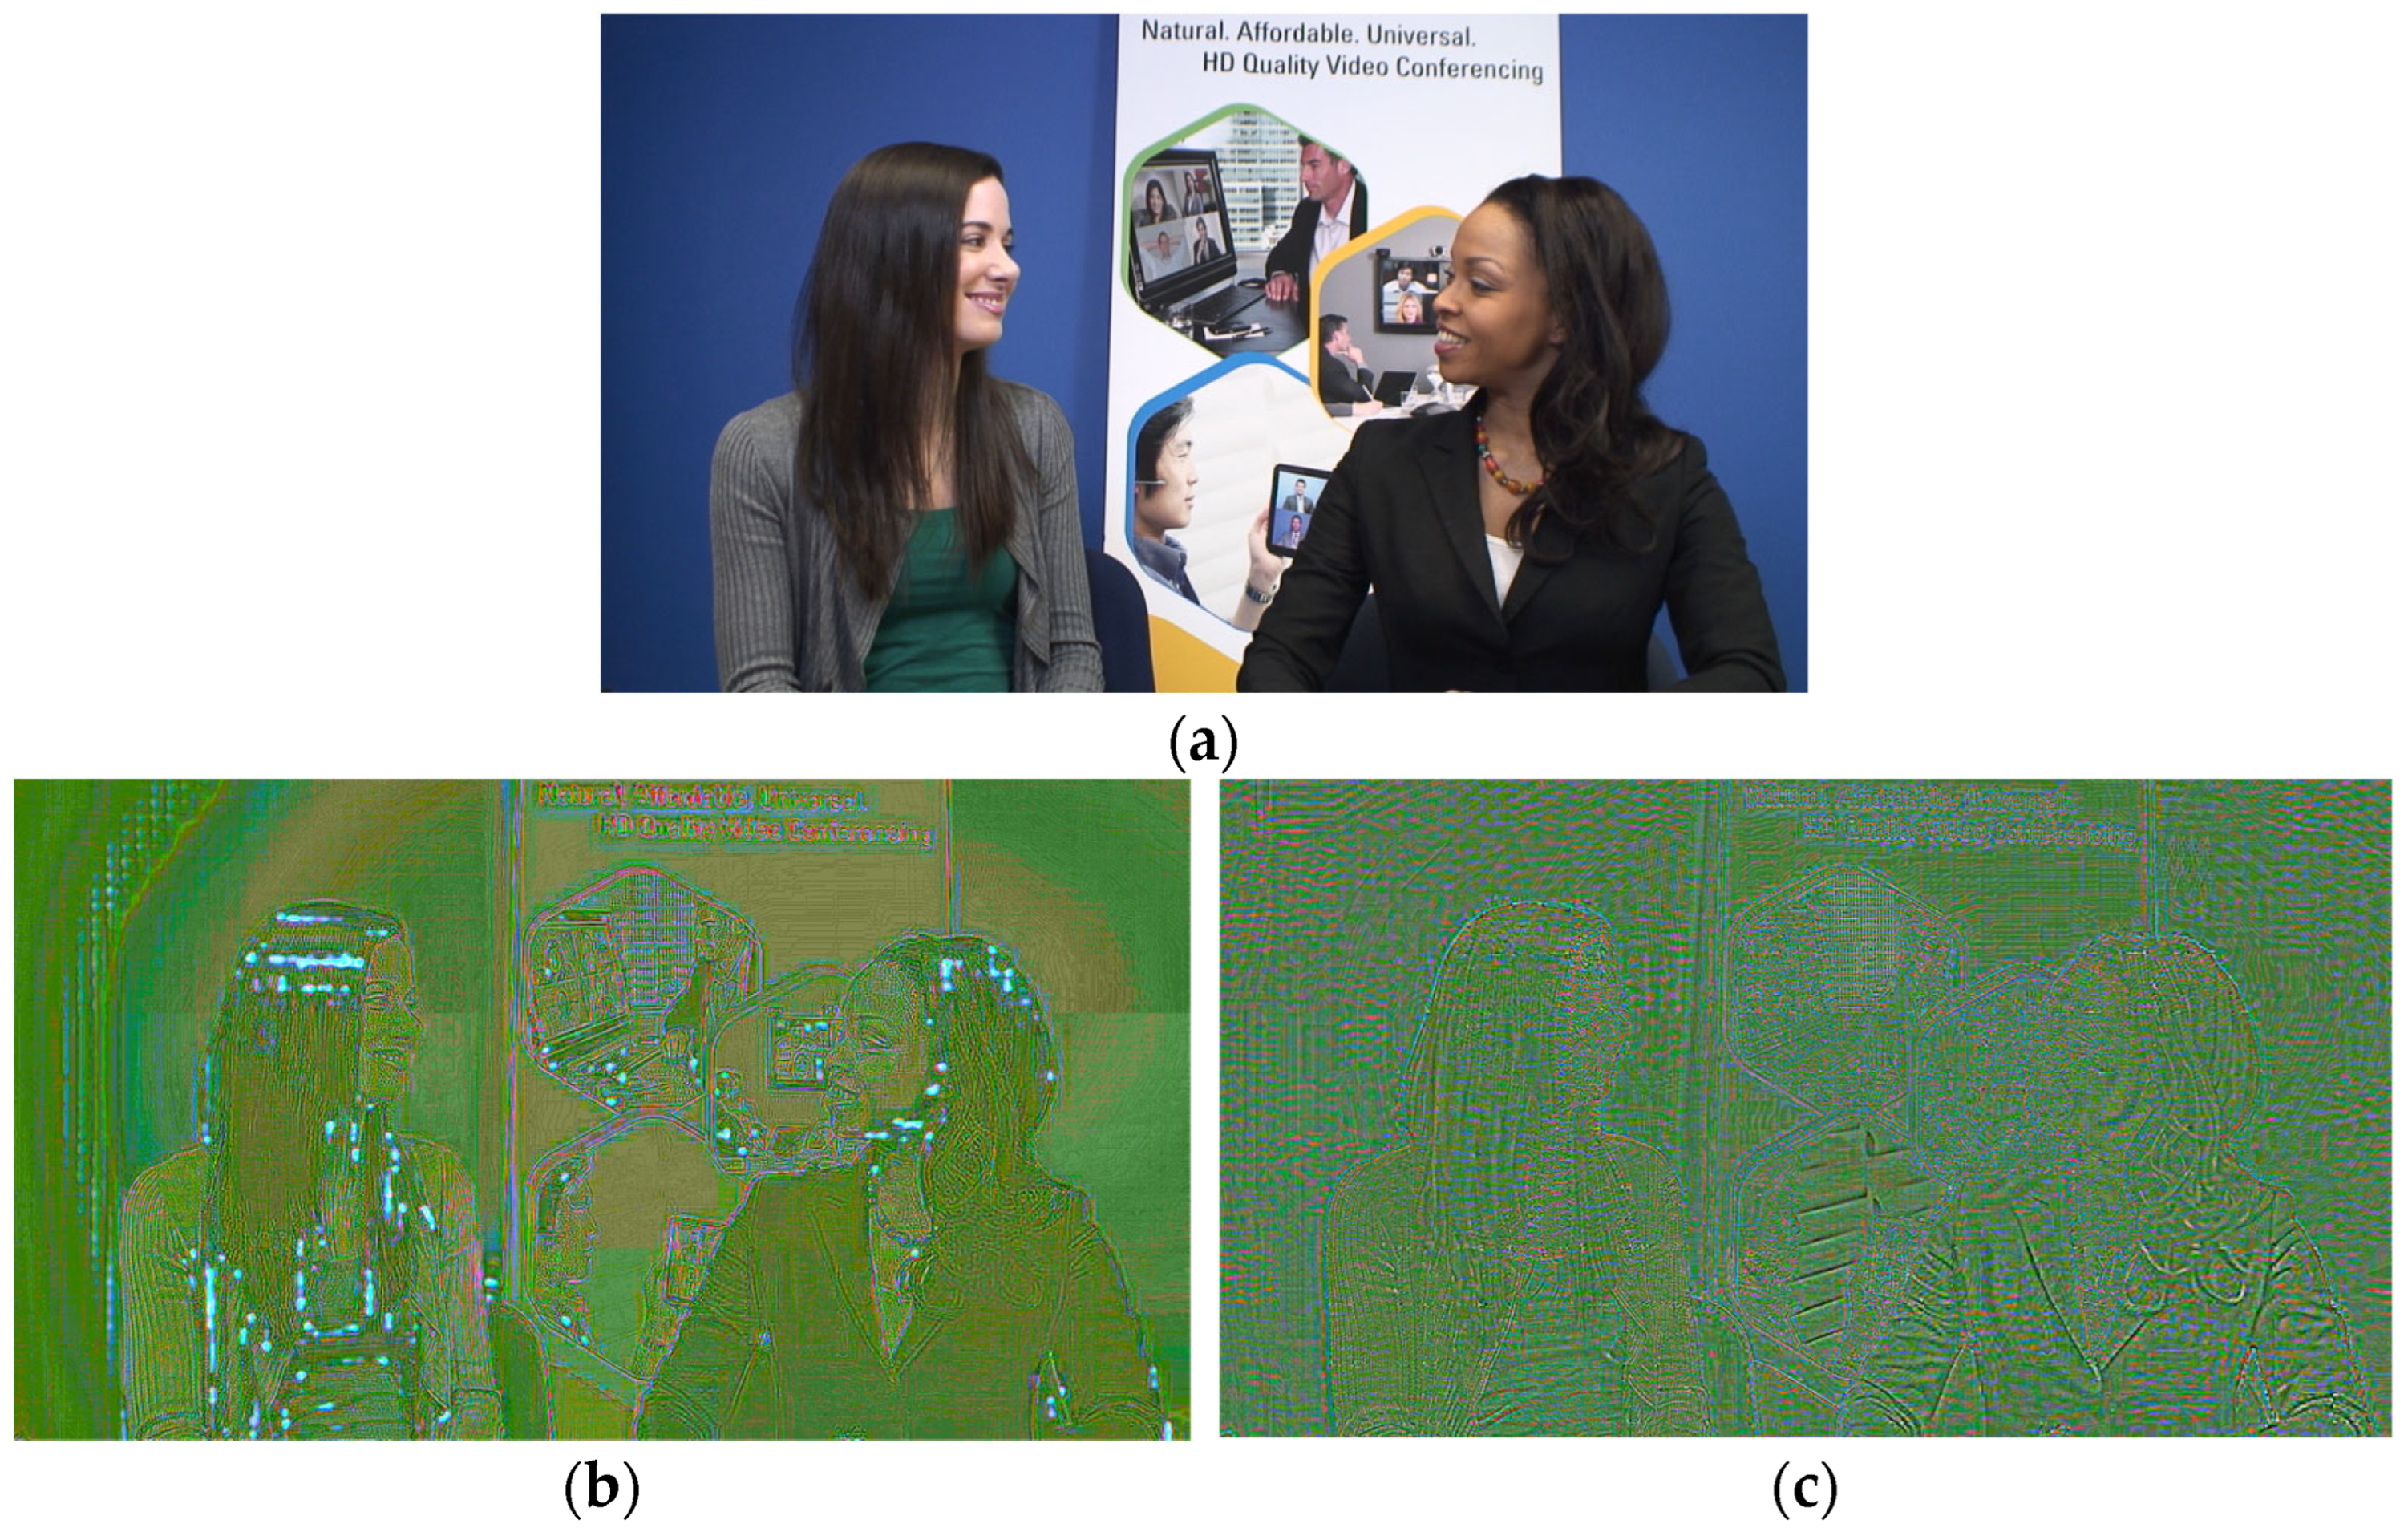
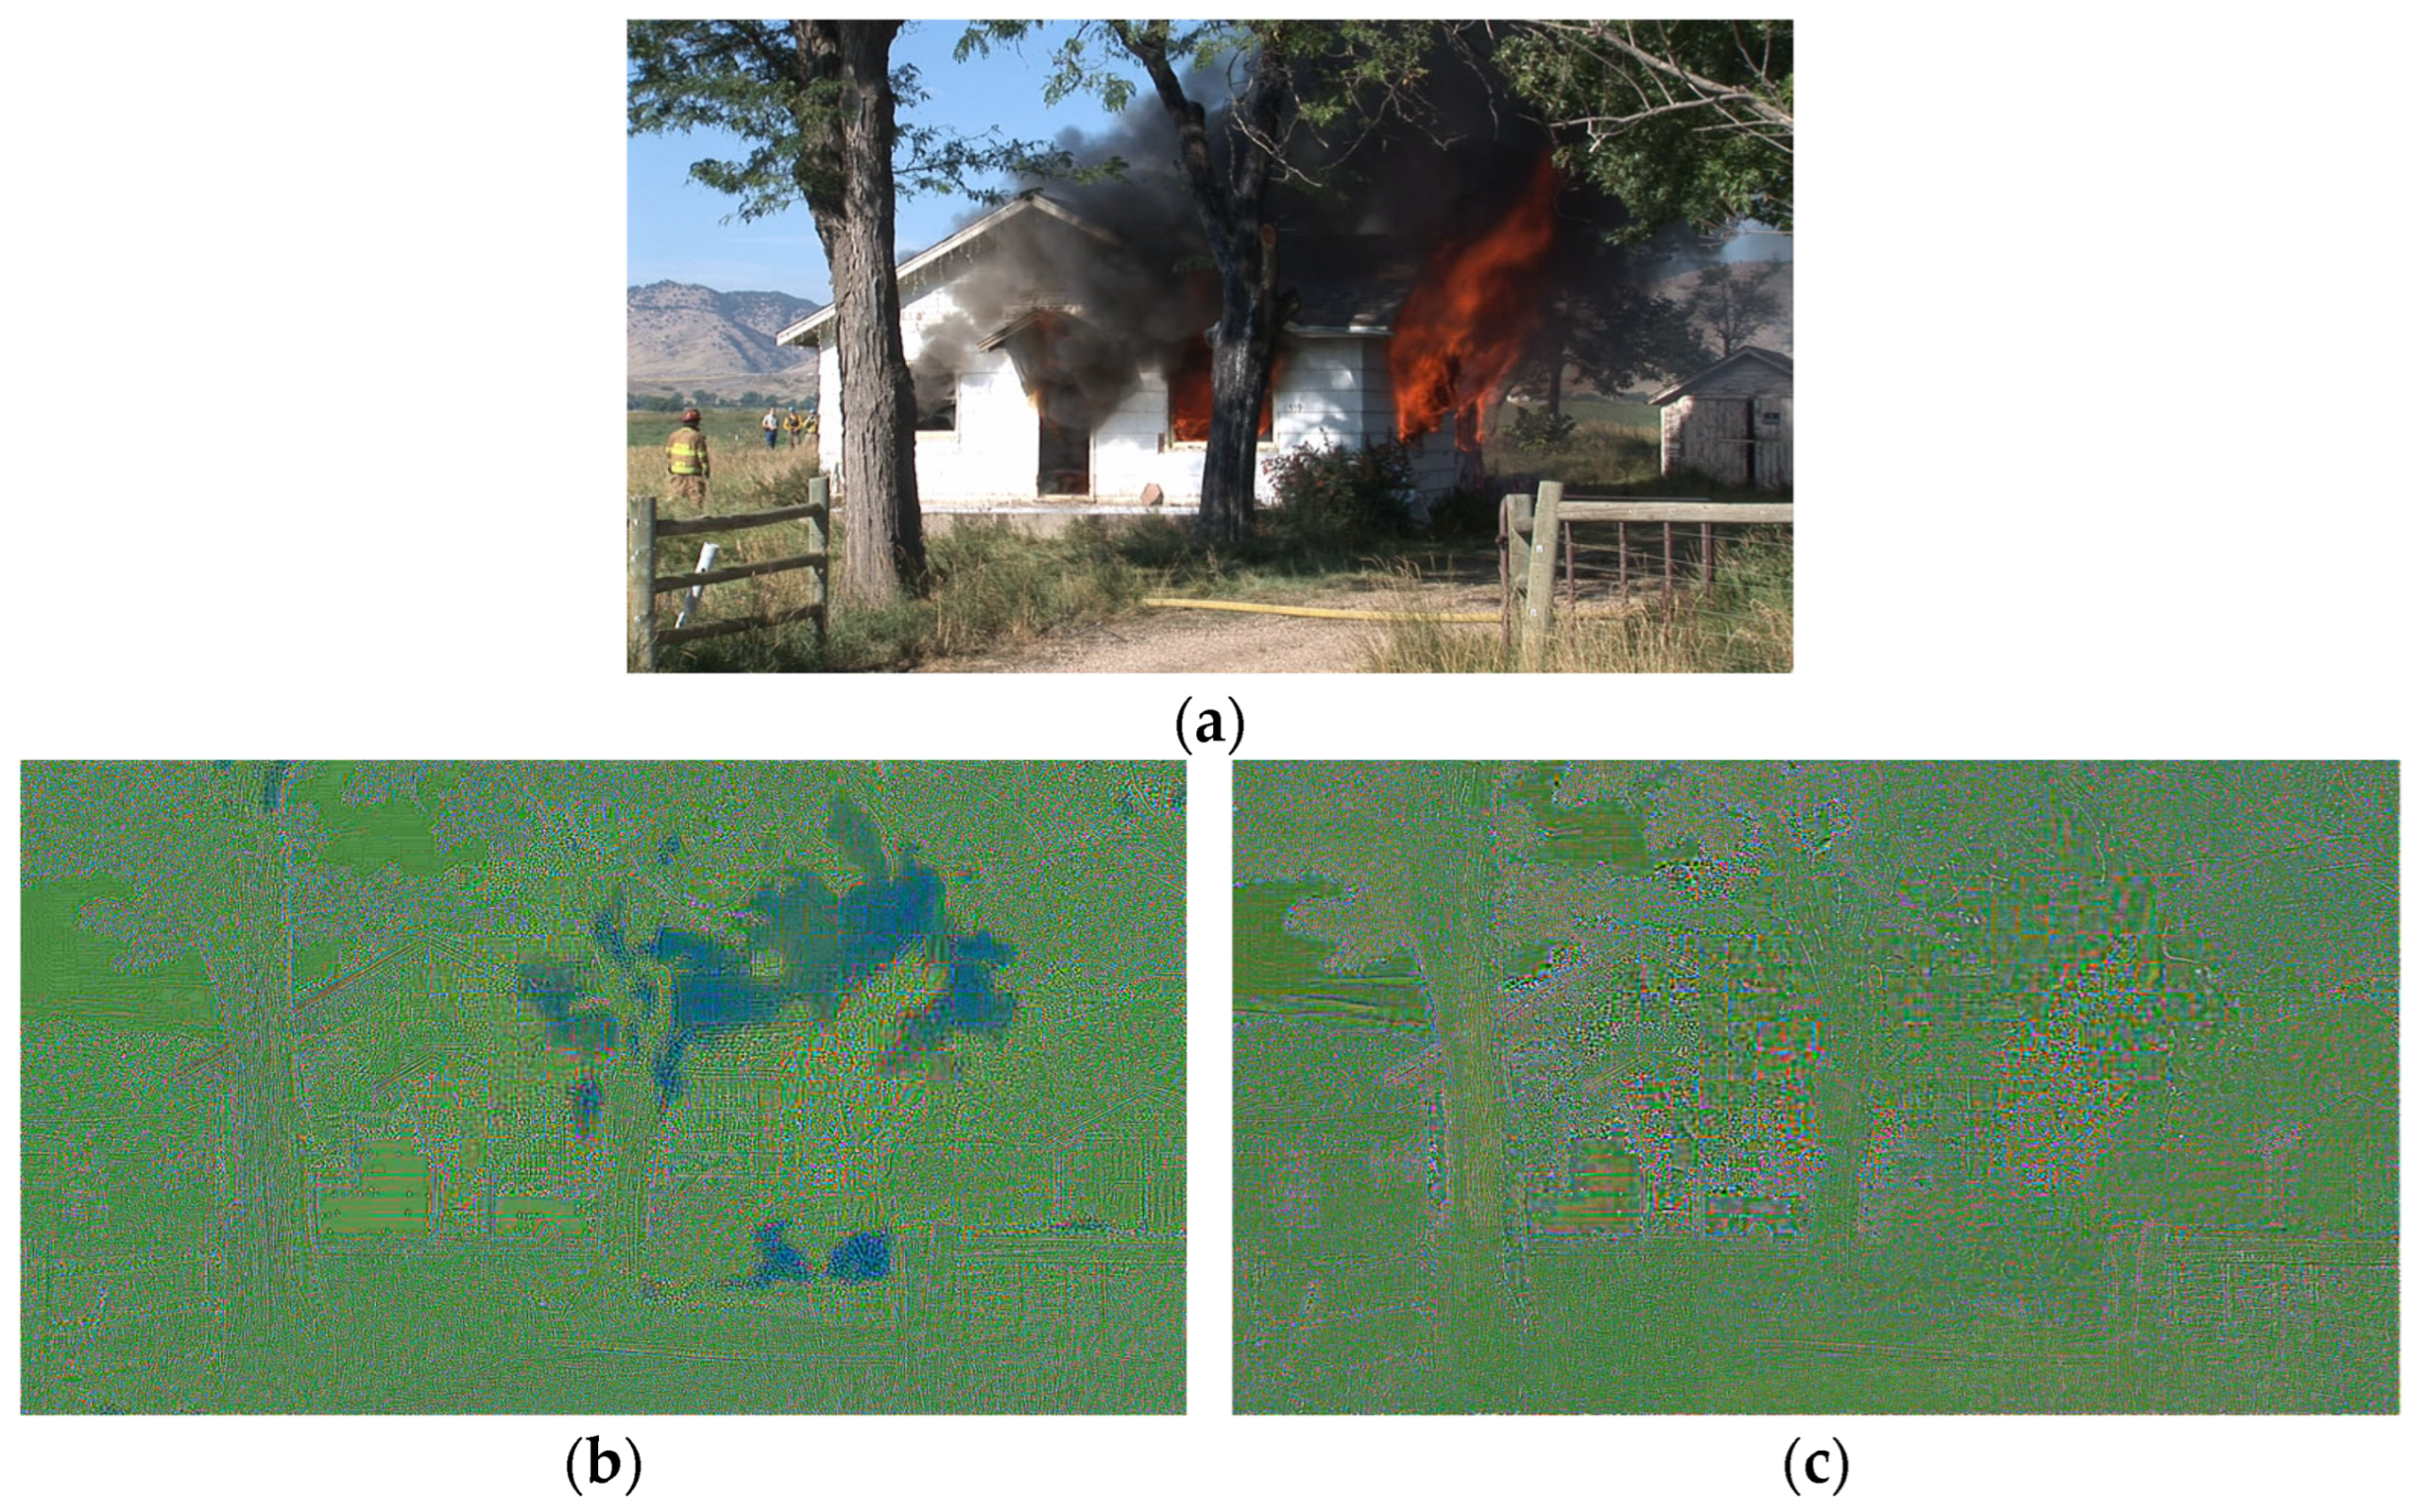
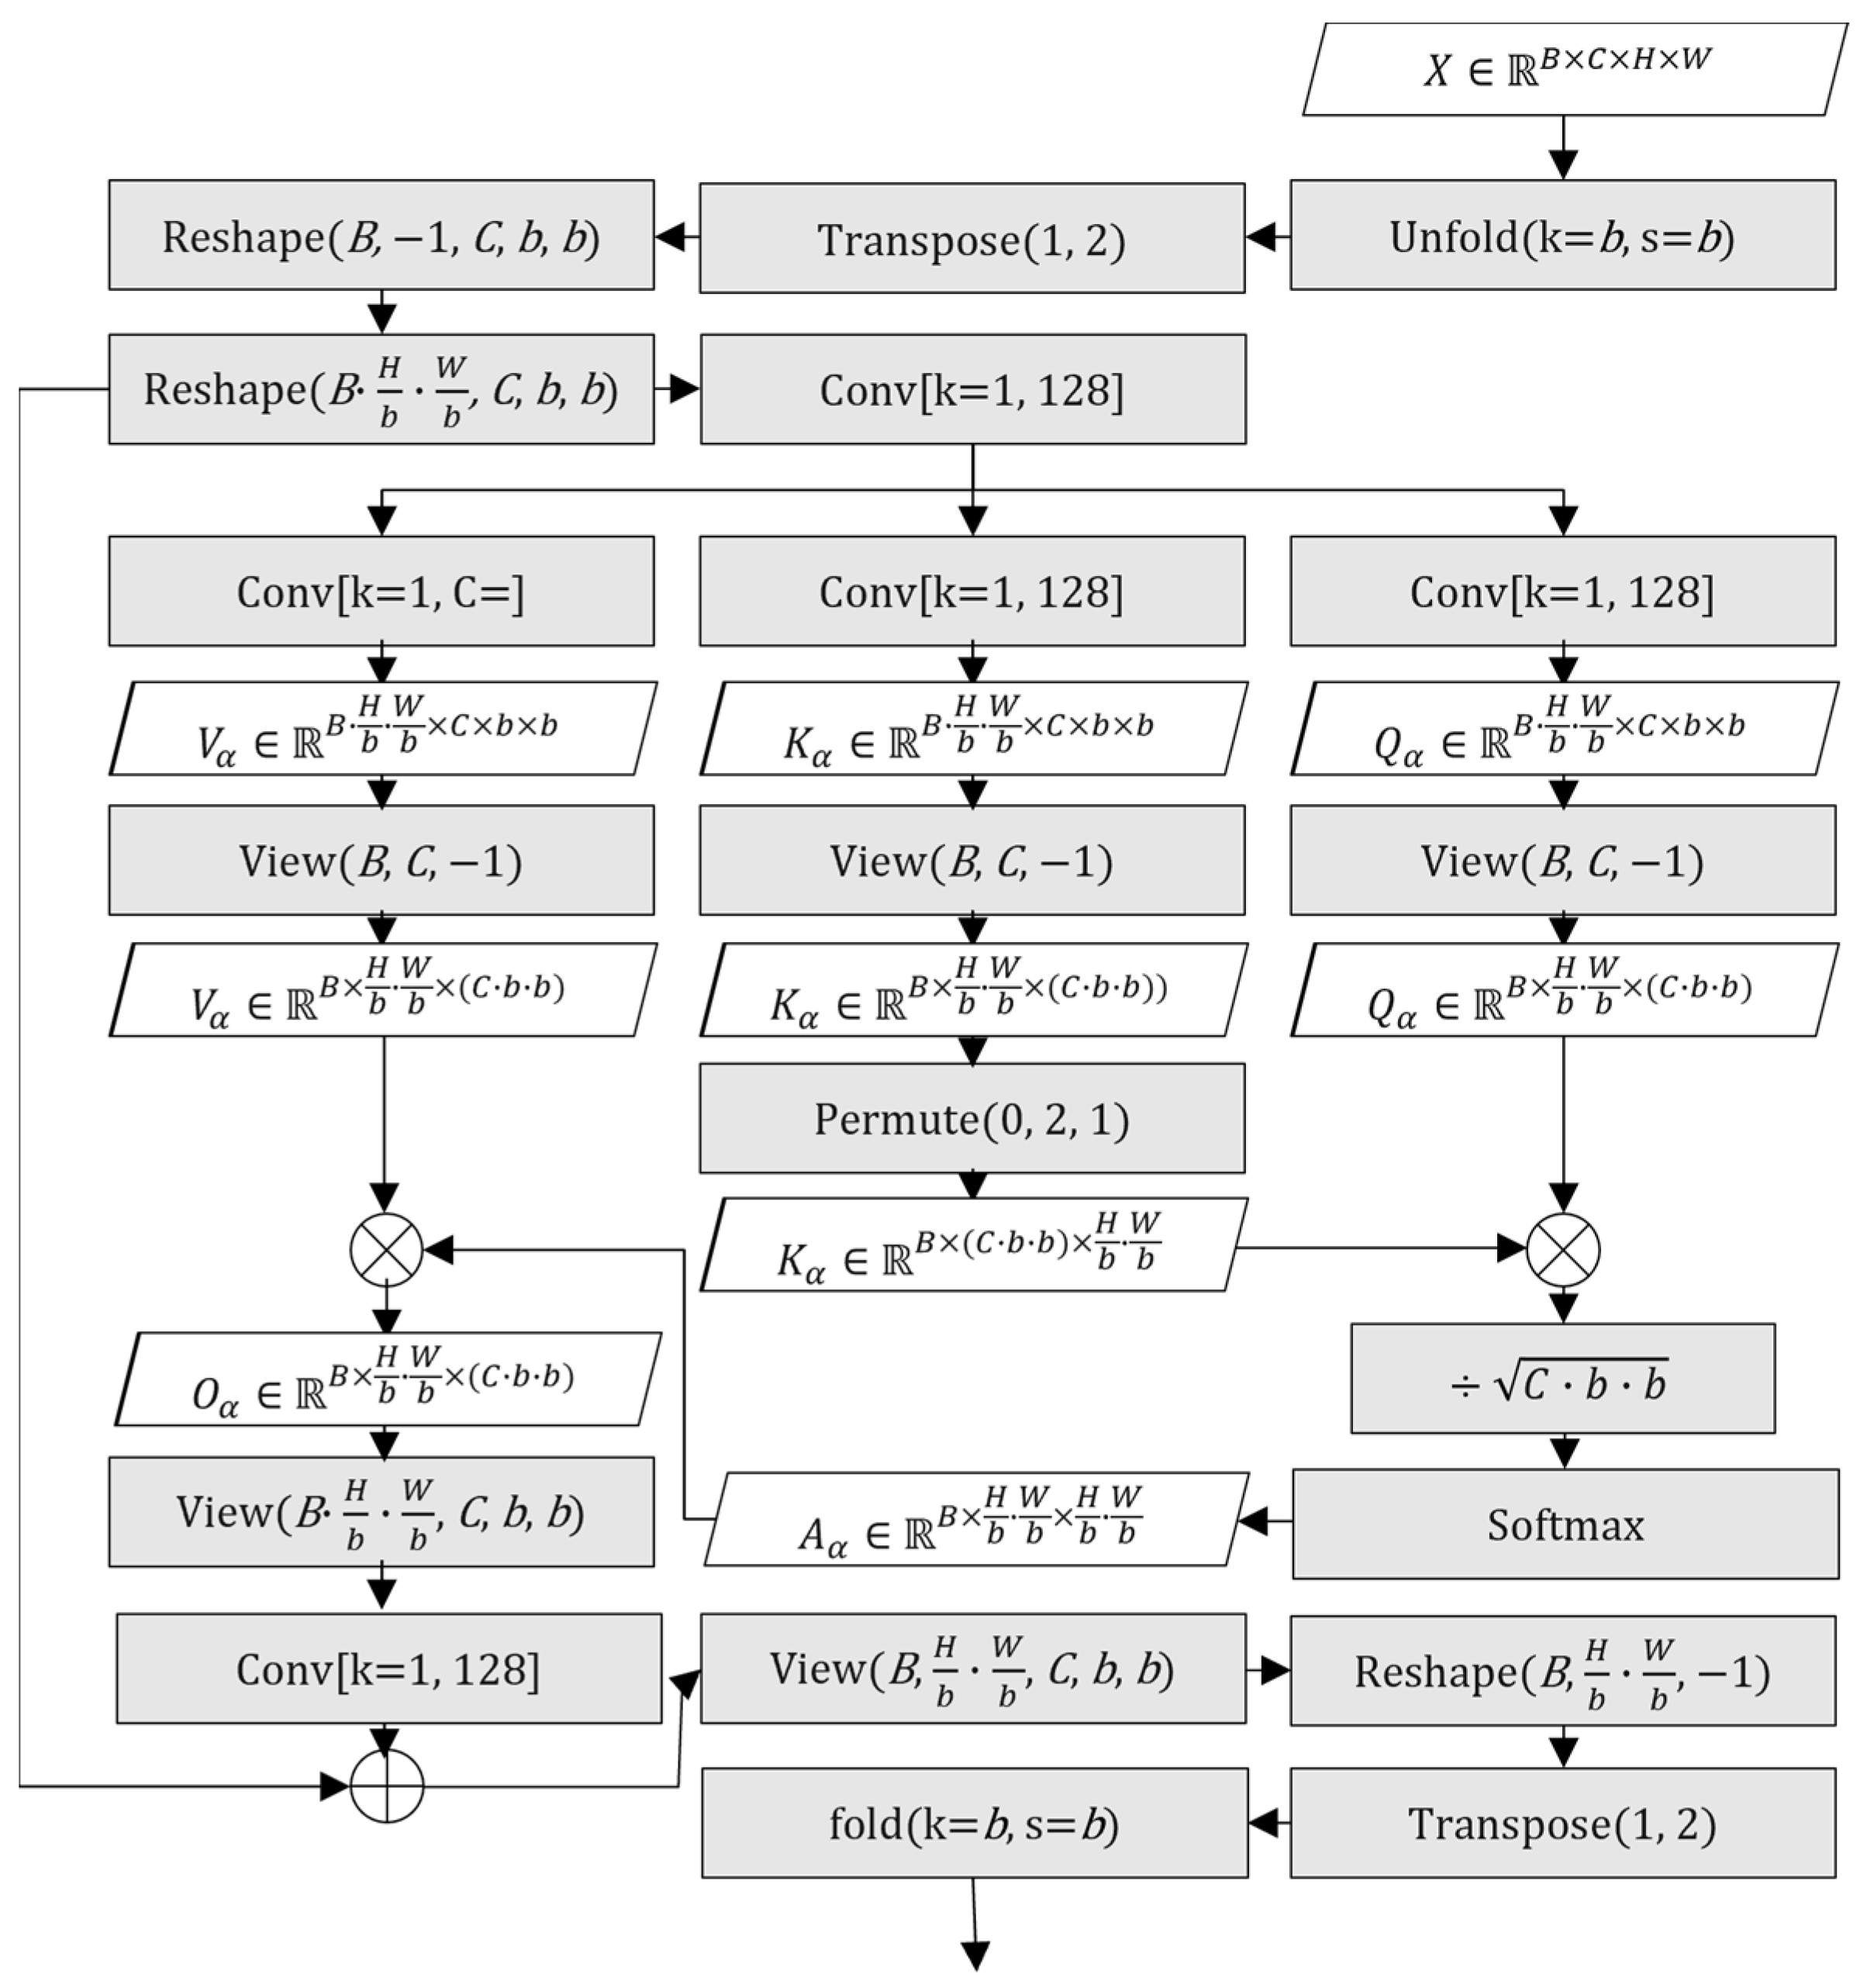
Disclaimer/Publisher’s Note: The statements, opinions and data contained in all publications are solely those of the individual author(s) and contributor(s) and not of MDPI and/or the editor(s). MDPI and/or the editor(s) disclaim responsibility for any injury to people or property resulting from any ideas, methods, instructions or products referred to in the content. |
© 2025 by the authors. Licensee MDPI, Basel, Switzerland. This article is an open access article distributed under the terms and conditions of the Creative Commons Attribution (CC BY) license (https://creativecommons.org/licenses/by/4.0/).