Article

A Flexible Truncated (u,v)-Half-Normal Distribution: Properties, Estimation and Applications

1
Department of Mathematics and Natural Sciences, Gulf University for Science and Technology, P.O. Box 7207, Hawally 32093, Kuwait
2
Department of Mathematics, College of Science, Qassim University, Buraydah 52571, Saudi Arabia
3
Department of Mathematics, Guangdong University of Petrochemical Technology, Maoming 525000, China
4
School of Mathematics and Statistics, Central South University, Changsha 410083, China
5
Department of Mathematics, College of Sciences and Arts, Najran University, Najran 11001, Saudi Arabia
6
Mathematics Department, Al-Lith University College, Umm Al-Qura University, Al-Lith 21961, Saudi Arabia
*
Authors to whom correspondence should be addressed.
Mathematics 2025, 13(11), 1740; https://doi.org/10.3390/math13111740
Submission received: 29 April 2025 / Revised: 21 May 2025 / Accepted: 22 May 2025 / Published: 24 May 2025

Abstract

This study introduces the truncated ( u , v ) -half-normal distribution, a novel probability model defined on the bounded interval ( u , v ) , with parameters σ and b. This distribution is designed to model processes with restricted domains, ensuring realistic and analytically tractable outcomes. Some key properties of the proposed model, including its cumulative distribution function, probability density function, survival function, hazard rate, and moments, are derived and analyzed. Parameter estimation of σ and b is achieved through a hybrid approach, combining maximum likelihood estimation (MLE) for σ and a likelihood-free-inspired technique for b. A sensitivity analysis highlighting the dependence of σ on b, and an optimal estimation algorithm is proposed. The proposed model is applied to two real-world data sets, where it demonstrates superior performance over some existing models based on goodness-of-fit criteria, such as the known AIC, BIC, CAIC, KS, AD, and CvM statistics. The results emphasize the model’s flexibility and robustness for practical applications in modeling data with bounded support.

1. Introduction

Truncated probability distributions (TPD) arise when the domain of a probability distribution is restricted to a specific range, effectively excluding certain values or intervals from the distribution. The motivation of TPD is to enhance sampling, parameter inference, fast convergence in the related region, which will lead to a robust estimation. These modifications alter the fundamental properties of the original distribution, such as its mean, variance, and moments, to reflect the effects of truncation. Existing models for bounded data, that include unit-domain or truncated distributions, suffer from restricted intervals, inflexible parameterization, or normalization complexities. Truncated distributions are ubiquitous in real-world applications where the data naturally adhere to specific bounds, such as in censored data sets, physical measurements constrained by limitations of instruments, or predefined policy thresholds. For example, in medical statistics, ref. [1] used truncated distributions to model survival times when data collection is limited to a specific observation window. Similarly, environmental science leverages truncated models to study phenomena like precipitation levels, which naturally fall within bounded ranges [2]. In many other real-world scenarios, proportions, probabilities, financial decisions, or measurements within a specific range naturally occur within bounded domains [3].
The concept of truncation extends to a wide variety of probability distributions, including the normal, exponential, and Poisson distributions (see, [4]). Among these, the truncated normal distribution holds particular importance due to the centrality of the normal distribution in the statistical theory and applications. Early work by [5] laid the foundation for understanding the properties of truncated distributions, including their moments and implications. This was followed by [6], who provided comprehensive derivations for the mean and variance of the truncated normal distribution and explored their dependency on truncation limits. For a review regarding the properties of the truncated normal distribution, we refer to [7]. The truncated normal distribution has been applied in fields ranging from genetics to finance. In reliability engineering, it is used to model lifetimes of components when failures outside a specific range are unobservable [2].
Truncated or unit domain models effectively capture processes or behaviors constrained by known limits, ensuring realistic outcomes and avoiding impossible values. Models defined on bounded intervals provide meaningful parameter estimates that align with the domain’s restrictions. Using truncated domains prevents predictions from falling outside feasible or observable ranges, enhancing model reliability, and decision-making in practical applications. There are fewer distributions on truncated domain than on ( 0 , ) , for example, uniform on [ a , b ] , U-quadratic on [ a , b ] , truncated normal on [ a , b ] (see, [7]), arc-sine on [ a , b ] (see, [8]), and Pareto distribution on ( c , ) (see, [9]). Recently, new generalized uniform proposed by [10] and Mustapha type III by [11], are additional instances, among others.
This work is inspired by the significant impact of the half-normal distribution across various fields of study. For instance, [12] recently proposed a modified half-normal distribution, while [13] introduced an extension of the generalized half-normal distribution. The unit-half-normal distribution was explored by [14], and [15] developed a model based on the half-normal distribution to adapt financial risk measures, such as value-at-risk (VaR) and conditional value-at-risk (CVaR), for scenarios with solely negative impacts. Additionally,  ref. [16] proposed an estimation procedure for stress–strength reliability involving two independent unit-half-normal distributions, and [17] discussed objective Bayesian estimation for differential entropy under the generalized half-normal framework. Furthermore, ref. [18] examined inference for a constant-stress model using progressive type-I interval-censored data from the generalized half-normal distribution, among other contributions.
In this paper, we introduce the truncated ( u , v ) -half-normal distribution, a novel probability model defined on the bounded interval ( u , v ) . The proposed distribution characteristics are analytically tractable statistical properties, making it versatile for modeling various density shapes within truncated domains. Parameter estimation was performed using a hybrid approach: maximum likelihood estimation (MLE) and a likelihood-free-like technique. We supported the estimation method by sensitivity analysis using simulated data, and an optimal estimation algorithm, to determine the best estimates. The exceptional performance of the proposed model is demonstrated through applications to real-world data.
The truncated ( u , v )-half-normal distribution addresses these gaps by transforming the half-normal distribution via a new ratio mapping, eliminating normalization constants and enabling flexible modeling on any interval ( u , v ). Its parameters directly control bounds ( u ) , interval length ( b ) , and dispersion ( σ ) , offering interpretability and analytical tractability. Unlike Beta, Kumaraswamy and Topp–Leone models, it inherits the asymmetry and tail behavior of half normal, proving superior in real-world data applications providing lower value of goodness-of-fit statistics. Finally, although the support of the proposed distribution is defined over a general bounded interval ( u , v ) with u < v , in most empirical applications u 0 may be appropriate. However, allowing u < 0 increases the generality of the model, facilitates applications that involve transformed or standardized data, and aligns with the theoretical origins of the model as a transformation of a symmetric normal variable.
The structure of the paper is as follows: Section 2 introduces the formulation of the proposed model and its statistical properties. Section 3 discusses maximum likelihood estimation method and provides sensitivity analysis on the parameters. Section 4 presents two illustrative real-world data applications. Finally, Section 5 concludes the paper with a summary of findings and implications.

2. Definition and Properties

Assume that the random variable X is normally distributed, with mean E X = 0 and variance σ = V X as parameters. Note that, the random variable defined as the absolute value of X, i.e., | X | , follows the half-normal distribution (HN), originally suggested by [19] for creating centile charts. Now, let F X denotes the cumulative distribution function (CDF) associated with X. The aim is to introduce a new random variable, denoted by Y, defined on u , v , where v = u + b , with  u R and b > 0 .
Thus, from the distribution of X, one can define the CDF of a “new” variable Y as follows
F Y ( a ) = P Y a = 0 , if a u , F X b ( a u ) b ( a u ) , if u < a < u + b , 1 , if a u + b .
Remark 1.
Using the symmetric properties of the normal distribution of X, for all u < a < u + b , one can see that
F Y ( a ) = F X b ( a u ) b ( a u ) = P b ( a u ) b ( a u ) X b ( a u ) b ( a u ) = 2 F X b ( a u ) b ( a u ) 1 .
Furthermore, one can deduce that
lim b + F Y a = 2 F X a u 1 = 2 F Z a 1 ,
where Z = X + u (which follows a normal distribution with u as mean and σ as standard deviation).
Proposition 1.
Based on the above results, one can see that
Y = b Z b + u , w i t h Z b = X b 1 + X b
Proof. 
Let y be a real value, such that u < y < u + b . Thus, we have
P b Z b + u y = P b | X | b + | X | y u = P b | X | ( y u ) b + ( y u ) | X | = P | X | b ( y u ) b ( y u ) = F X b ( y u ) b ( y u ) = F Y y .
   □
Remark 2.
Z b defined in (1) is a novel transformation analogous to the odd ratio concept, but constructed using absolute value. Thus, one can easily see that Z b has 0 , 1 as support, that is, the choice Z b maps | X | to ( 0 , 1 ) , ensuring bounded support. Furthermore, for all 0 < z < 1 , the CDF associated with Z b is defined as follows
F Z b z = P Z b z = P X b z 1 z = 2 F X b z 1 z 1 ,
where F X ( · ) denotes the CDF associated with X.
The classic procedure for producing a truncated distribution, is a conditional distribution that results from restricting the domain of some other probability distribution. Explicitly, suppose that X is a random variable with I R as support (in general, I is an open interval). Thus, in order to define a new random variable, denoted Y, with bounded support u , v , from X, we define Y as follows
Y = X u X v .
Therefore, the PDF and CDF associated with Y are, respectively, given by
f Y x = f X x F X v F X u 1 x u , v
and
F Y x = F X x F X u F X v F X u , x u , v ,
where f X (resp. F X ) denotes the PDF (resp. CDF) associated with X and 1 ( · ) is an indicator function. One of the weak points of this classic procedure is that the normalization constant, given by 1 F X v F X u , of the new distribution depends on F X (which may not have an explicit form in some cases, in particular when X is a normal random variable). This can have a negative impact, for example, for managing the maximum likelihood function and consequently the expansions of the likelihood ratio tests. To overcome these difficulties we mixed two approaches. First, we used the composed CDF, originally proposed by [20] to created a distribution with support on 0 , b from a positive random variable, and the linear transformation of unit transform random variable, usually used to change support of a random variable. Indeed, based on Proposition 1, one can see that Y is an affine function of a unit transform random variable
Z b = | X ˜ | 1 + | X ˜ | , where X ˜ N 0 , σ ˜ = σ b .
Note that, even if the support of Z b (i.e., 0 , 1 ) is independent of b, this parameter play an important role in the construction of Z b , which makes a noticeable difference from the basic rescaling technique. Furthermore, one can say that | X ˜ | follows the HN distribution. Thus, Z b can be seen as a “modified version” of the unit-HN distribution, originally introduced by [14] (indeed, for  b = 1 , Z b is exactly the unit-HN distribution).
Remark 3.
Indeed, when b = 1 , the distribution of the introduced variable Y can be seen as a simple linear transformation of the Unit-HN distribution. This transformation allows that Y has u , u + 1 as support.
While the support of the proposed distribution on ( u , v ) may resemble that of a truncated normal, the two models differ substantially. The truncated normal relies on a renormalization of the classical normal distribution over a bounded interval, requiring computation of cumulative distribution values. In contrast, the proposed model is based on a nonlinear transformation of an HN variable, yielding a closed-form density that avoids normalization constants. Moreover, the shape of the distribution can be flexibly controlled via the ratio σ b , enabling a useful class of behaviors than the truncated normal.
Finally, from Remark 1, one can see that
lim b + F Y a = 2 F Z a 1 = F | Z | a ,
where X + u = Z N u , σ (In other words, | Z | has a folded normal distribution (if u = 0 , then | Z | has a half-normal distribution)).
Based on Remark 1, one can write the PDF that associated with Y as follows
f Y y = 2 b b y u 2 f X b ( y u ) b ( y u ) 1 y u , u + b ,
where f X denotes the PDF associated with X. The transformation of the support of X using the nonlinear mapping ( b ( a u ) ) / ( b ( a u ) ) transform the density shape and stretches the half-normal density dynamically based on a, allowing the PDF of Y to adapt its shape within ( u , v ) , additionally, it may exhibit heavier tails or sharper peaks near b which can provide more flexibly to the proposed model. The parameter b scales the proposed transformation, affecting the rate at which probability accumulates near v, unlike other truncated models such as truncated normal on ( 0 , b ) in which the upper bound b is like a hard cut-off. Now, using (3) and results of Remark 1, the survival function (S.F.) and hazard rate function (H.R.F.) associated with Y, are given, for all y u , u + b , respectively, by
F ˜ Y y = P Y y = 2 1 F X b ( y u ) b ( y u ) = 2 F ˜ X b ( y u ) b ( y u ) ,
and
h Y y = b b y u 2 h X b ( y u ) b ( y u ) ,
where F ˜ X and h X denote, respectively, the S.F. and the H.R.F. associated with X.
Proposition 2.
The PDF of the proposed distribution in (3) is unimodal with mode at either y 0 = 4 σ 2 b + b 3 + b 3 ( 8 σ 2 b + b 3 ) 4 σ 2 + u , for all b , σ > 0 or y 0 = 4 σ 2 b + b 3 b 3 ( 8 σ 2 b + b 3 ) 4 σ 2 + u , for some, b , σ > 0
Proof. 
We show that f Y y = 0 has a real root. Recall that the function f X is defined by
f X b ( y u ) b ( y u ) = ϕ b ( y u ) b ( y u ) = 1 2 π σ exp 1 2 σ 2 b ( y u ) b ( y u ) 2 .
Thus, one can find that
f Y ( y ) = 4 b 2 b ( y u ) 3 ϕ b ( y u ) b ( y u ) 2 b 5 ( y u ) σ 2 b ( y u ) 5 ϕ b ( y u ) b ( y u ) = 2 b 2 ϕ b ( y u ) b ( y u ) σ 2 b ( y u ) 5 2 σ 2 b ( y u ) 2 b 3 ( y u ) .
We can solve 2 σ 2 b ( y u ) 2 b 3 ( y u ) = 0 directly from (4) to determine the possible root of f Y ( y ) = 0 as follows. Let z = y u , then
2 σ 2 b z 2 b 3 z = 2 σ 2 b 2 2 b z + z 2 b 3 z = 2 σ 2 b 2 4 σ 2 b z + σ 2 z 2 b 3 z = 2 σ 2 z 2 4 σ 2 b + b 3 z + 2 σ 2 b 2 = 0 .
By applying quadratic equations formula in (5), we get
z = 4 σ 2 b + b 3 ± 4 σ 2 b + b 3 2 16 σ 4 b 2 4 σ 2 = 4 σ 2 b + b 3 ± 4 σ 2 b + b 3 2 ( 4 σ 2 b ) 2 4 σ 2 = b 4 σ 2 + b 2 ± b ( 8 σ 2 + b 2 ) 4 σ 2 .
Hence,
z = b 4 σ 2 + b 2 + b ( 8 σ 2 + b 2 ) 4 σ 2 , for all b > 0 , σ > 0 ,
or
z = b 4 σ 2 + b 2 b ( 8 σ 2 + b 2 ) 4 σ 2 , for some b > 0 , σ > 0 .
Finally, we can claim that there exist a root among y 0 = z + u , which implies that f Y ( y ) has unimodal density.    □
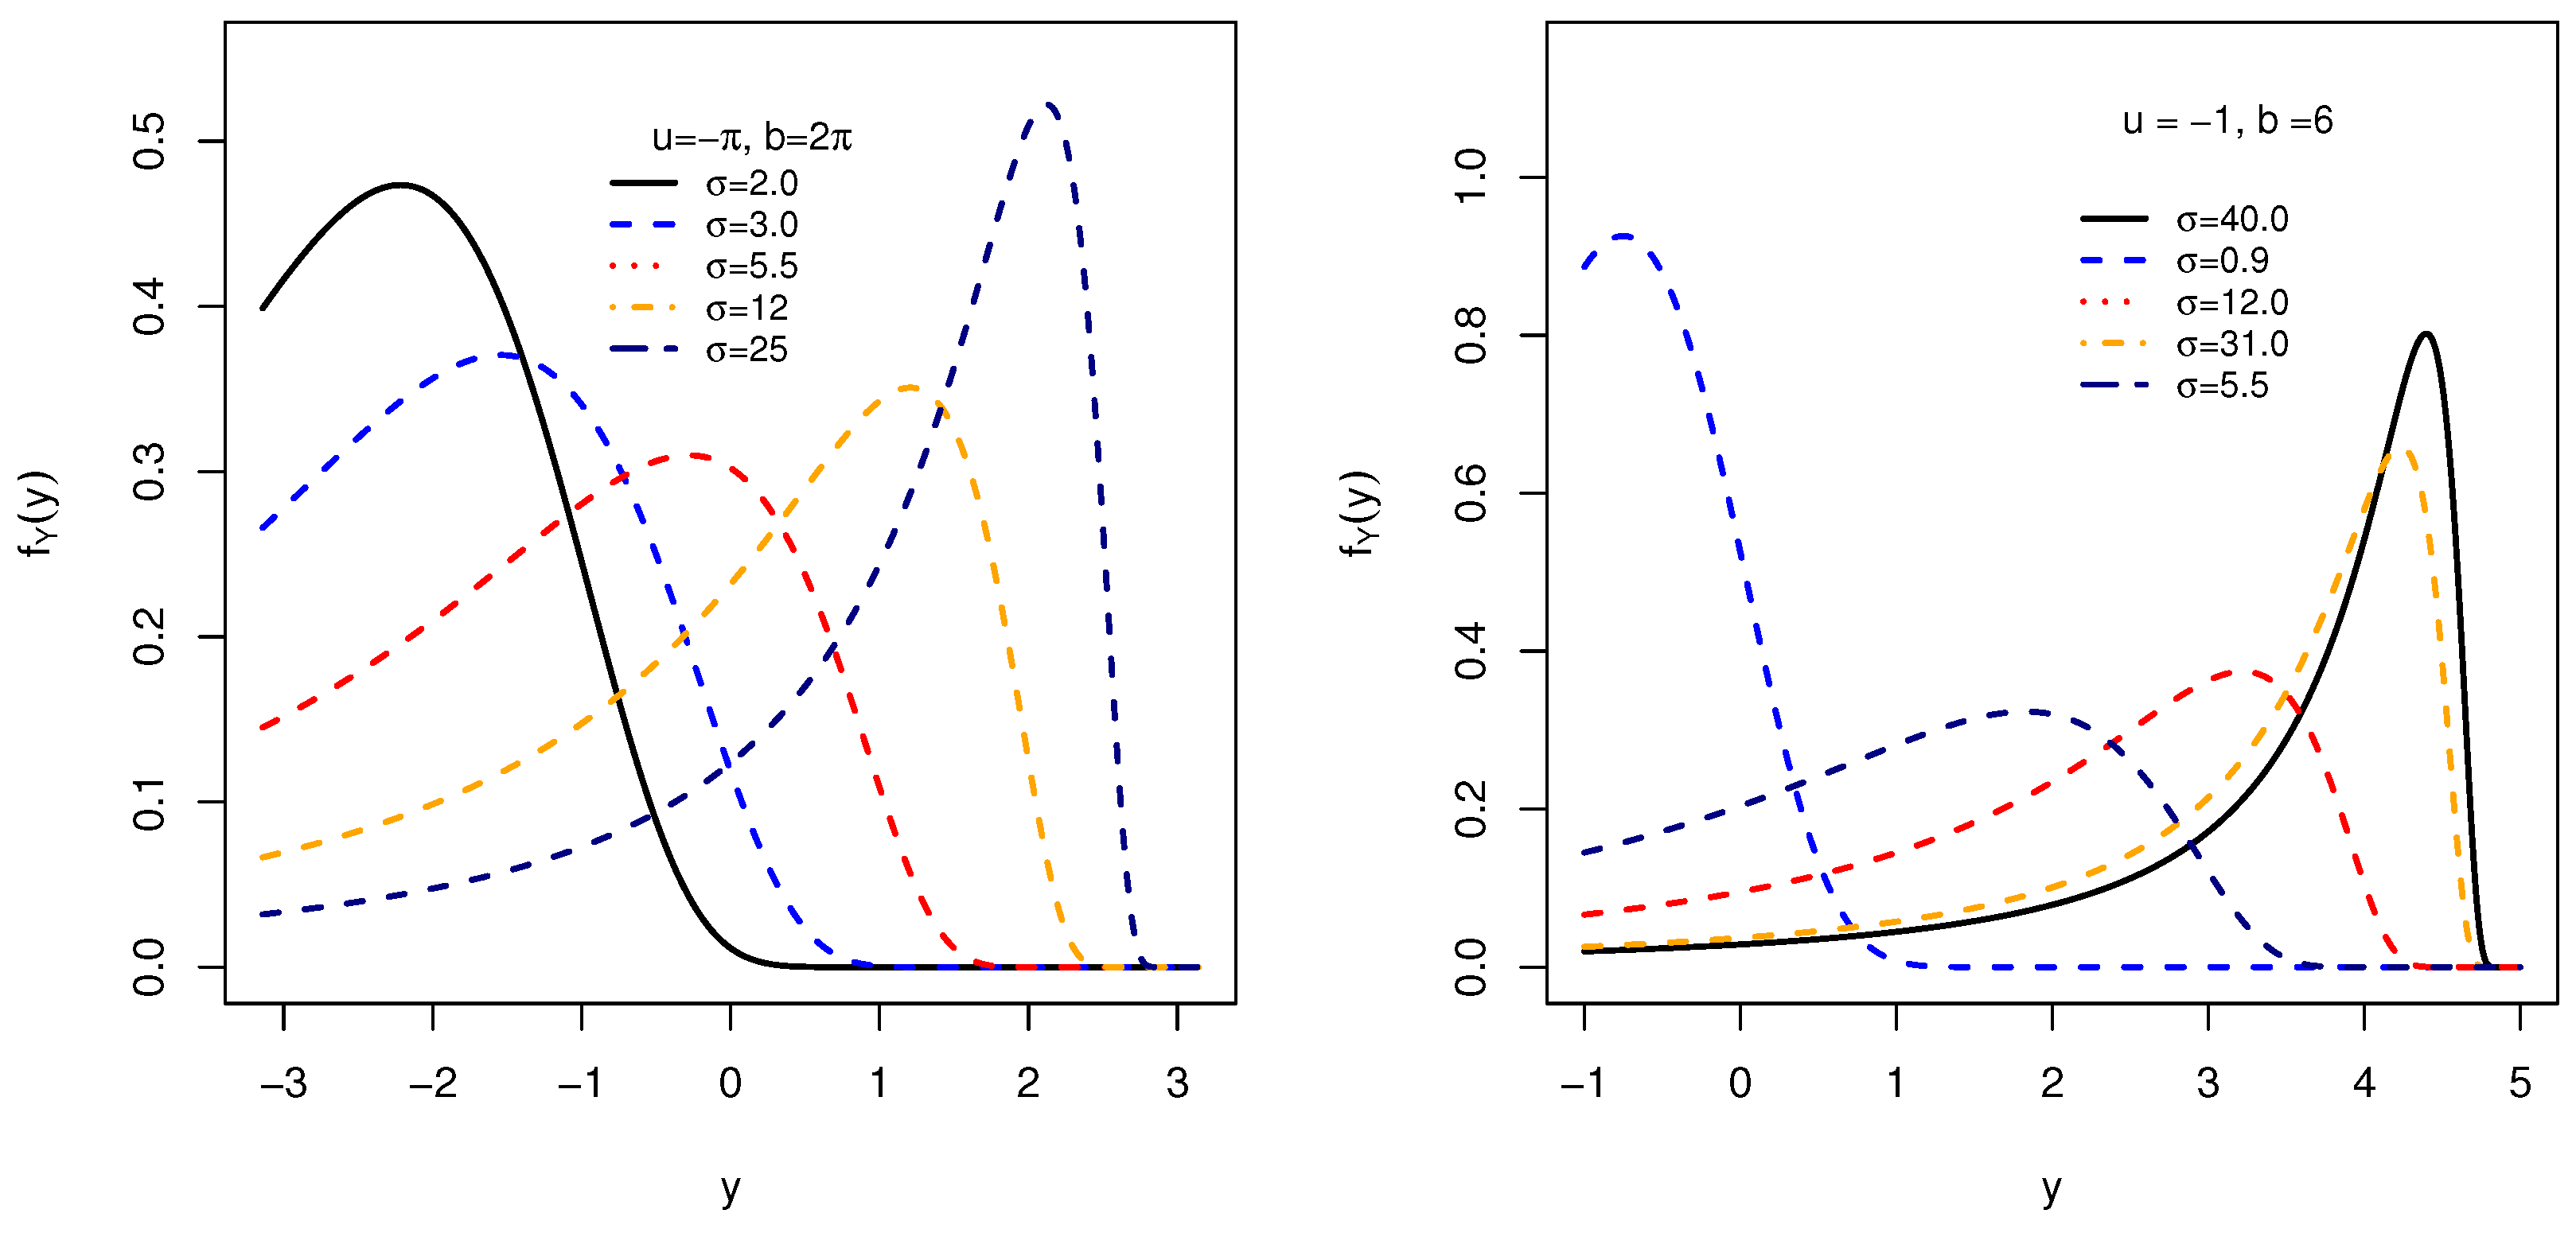
Figure 1 illustrates some possible shapes of the PDF in (3) associated with the variable Y, when u = π , b = 2 π (i.e., Y has π , π as support), and for some selected values of the parameter σ (indeed, due to (2), on the right part of Figure 1 we choose σ values such that σ b is rather weak (≤1), and  σ values such that σ b is large (>1)). Figure 1 confirms the results mentioned in the previous section. In particular, these graphical results show the usefulness of the distribution of Y in terms of dispersion, asymmetry (left and right skewed) and flattening, which adopt various phenomena across the applications.

2.1. The r t h Moment of Y

The r th moment of Y is defined to be E Y r . In this section, we present the calculation of this measure. Specially, we focus on the first four moments, which usually used to study the dispersion and the form (asymmetry and kurtosis) of the distribution.
Remark 4.
Using Newton’s Binomial formula and based on (1), one can write the r t h moment of Y as follows
E Y r = E b Z b + u r = k = 0 r C r k u r k b k E Z b k .
Furthermore, based on the Proposition 2.1 of [14], one can write the expression of the r th moment of Z b as follows
E Z b r = σ b r m r , where m r = E Z 1 + σ b Z r , with Z H N 1 .
Remark 5.
Based on the properties of HN distribution (for details, see, e.g., [5,21]), for all r = 1 , 2 , , we have
m r = E Z 1 + σ b Z r = 2 2 π 0 + z 1 + σ b z r e 1 2 z 2 d z .
A closed-form expression of the r t h raw moment of the proposed distribution in terms of elementary functions is not tractable due to the bounded transformation involved, it is nonetheless possible to express it symbolically using the Meijer G function a highly general class of special functions encompassing many classical functions (e.g., exponential, logarithmic, Bessel, hypergeometric). Indeed, Meijer G function is defined through a complex contour integral representation (see [22]). This expression allows general and symbolic computation of moments for a wide range of parameter values (for more details, see [23,24,25]). Explicitly, by introducing the substitution x = z 1 z , the moment integral
E [ Y r ] = 0 1 u + ( v u ) z r f Z b ( z ) d z ,
transforms into an expression involving the integrand x 1 + x r exp b 2 x 2 2 σ 2 , for which Meijer G representations are available:
x 1 + x r = G 1 , 1 1 , 1 x | 1 r 0 , exp ( a x 2 ) = G 0 , 1 1 , 0 a x 2 | 0 .
Thus, the moment E [ Y r ] can be formally written as a weighted integral involving Meijer G functions. Thus, the value of m r , for all r = 1 , 2 , , can be solved numerically by using, for example, the integrate()  function of the  stats  package of  R (see [26]). This representation provides a useful foundation for further analytical generalizations and asymptotic studies.
Thus, based on Remark 4 and Equation (6), one can deduce that
E Y r = E b Z b + u r = k = 0 r C r k u r k b k σ b k m k = k = 0 r C r k u r k σ k m k .
We can deduce that, the moments depend on σ b , enabling flexible tail control. Consequently, the mean, variance, coefficient of variation (CV), skewness (CS), and kurtosis (CK) coefficients are, respectively,
E Y = u + σ m 1 ,
V Y = E Y 2 E Y 2 = σ 2 m 2 m 1 2 ,
CV Y = σ Y E Y = m 2 m 1 2 m 1 + u σ ,
CS Y = E Y E Y 3 σ Y 3 = E Y 3 3 E Y E Y 2 + 2 E Y 3 σ 3 m 2 m 1 2 3 2 = m 3 + 2 m 1 3 3 m 1 m 2 m 2 m 1 2 3 2 ,
and
CK Y = E Y E Y 4 σ Y 4 = E Y 4 4 E Y E Y 3 + 6 E Y 2 E Y 2 3 E Y 4 σ 4 m 2 m 1 2 2 = m 4 4 m 1 m 3 + 6 m 1 2 m 2 3 m 1 4 m 2 m 1 2 2 .
Based on Remark 5, Table 1 presents the numerical calculation for coefficient of variation (CV), skewness (CS), and kurtosis (CK) coefficients of the variable Y with different set of values associated with the parameters σ and b, with  u = 0 . Note that CS and CK coefficients are independent of u. However, u could play an important role for the CV measures (indeed, obviously when u sufficiently large, we have that the CV is close to zero, which implies that the distribution of Y is concentrated around its mean (which will also be very large).
Thus, for  u = 0 , one can observe that when σ b increases, then the CV decreases (therefore, we have a weak dispersion around the mean). Moreover, independently of the value of u, one can see also that when σ b increases, then we obtain a negative CS, which indicates a longer tail to the left of the distribution of Y. Finally, one can deduce that there exists an interval of positive value (denoted by k 1 , k 2 ) such that if σ b belongs to it, then the CK value is less than 3, otherwise the CK value is greater than 3. Then, the value of σ b plays an important role in identifying the level of flattening of the distribution of Y (compared to the normal distribution).
Proposition 3.
The moment generating function of the variable Y is given by
M Y t = e t u k = 0 + t k σ k k ! m r , w h e r e m r = 0 + z 1 + σ b z r 2 ϕ z d z .
Proof. 
First, recall that
M Y t = E e t Y = E e t b Z b + u = e t u E e t b Z b .
Based on the results of this section and the Proposition 2.2. of [14], we have
E e t b Z b = k = 0 + t b k σ b k k ! E Z 1 + σ b Z k , with Z H N 1 .
   □

2.2. Random Data Sampling

This section outlines the quantile function associated with the proposed model, which is essential for generating random samples. The quantile function is crucial for determining different percentiles of a distribution, such as the median, and is a key component in creating random variables that conform to a given distribution. Additionally, in non-parametric testing, the quantile function helps in identifying critical values for test statistics, thereby enhancing the robustness of statistical analysis.
Proposition 4.
The quartile function (QF) associated with Y is defined as follows
F Y 1 p = b F X 1 1 + p 2 F X 1 1 + p 2 + b + u , w i t h p 0 , 1 ,
where F X 1 denotes the QF related to X.
Proof. 
Let p 0 , 1 and u < y < u + b . Thus, we have
p = F Y ( y ) = 2 F X b ( y u ) b ( y u ) 1 F X b ( y u ) b ( y u ) = 1 + p 2 b ( y u ) b ( y u ) = F X 1 1 + p 2 y u F X 1 1 + p 2 + b = b F X 1 1 + p 2 y = b F X 1 1 + p 2 F X 1 1 + p 2 + b + u .
   □
An alternative way that involves root finding is developed and very effective, the step by step algorithm is provided below in the description of Algorithm 1, and the R codes can be found in the Appendix A.
Algorithm 1 Step-by-Step Algorithm for the random data sampling.
1.Define the parameters for the quantile function: u , b , σ .
2.Define the PDF as the f Y ( y , u , b , σ ) in (3).
3.Define the CDF as the numerical integral of the PDF from u to y:
F Y ( y , u , b , σ ) = u y f Y ( t , u , b , σ ) d t .
4.The quantile function is to find the value of y such that:
F Y ( y , u , b , σ ) p = 0 , 0 p 1 .
5.Solving the equation in step 4 by using the root-finding algorithm (e.g., uniroot in R).

3. Parameter Estimation

Here, we provide an estimation process of the parameters of the proposed model say, Θ = ( σ , b ) T . The parameter σ can be estimated by maximum likelihood estimation (MLE) method, while the optimal estimate of parameter b by a newly propose technique which is a likelihood-free-like approach. A demonstration using simulated data is provided.

3.1. MLE Technique

Let Y 1 Y 2 , Y n be an order statistics from the proposed model. Therefore, u = Y 1 is the minimum order statistics, and let d = Y n Y 1 be the range. Then, the estimate of b will be b ^ = d + ϵ , for some ϵ > 0 .
Next, we compute the MLE of σ . Let the log-likelihood function of the proposed model based on σ be L ( σ | b ) for the observed data y 1 , y 2 , , y n , be
L ( σ | b ) = i = 1 n log ( 2 ) + 2 log b b ( y i u ) + log ϕ b ( y i u ) b ( y i u ) ; 0 , σ ,
where ϕ b ( y i u ) b ( y i u ) = 1 2 π σ 2 exp b ( y i u ) b ( y i u ) 2 / ( 2 σ 2 ) .
To maximize L ( σ | b ) to obtain σ ^ , we differentiate L ( σ | b ) with respect to σ and solve
L ( σ | b ) σ = i = 1 n 1 σ + 1 σ 3 b ( y i u ) b ( y i u ) 2 = 0 .
Thus,
σ ^ = 1 n i = 1 n b ^ ( y i u ) b ^ ( y i u ) 2 .
The estimate of σ can be obtain analytically but depend on b ^ . The MLE of σ ^ is asymptotically normal, that is for very large sample size σ ^ N ( 0 , 1 I ( σ ) ) , where I ( σ ) is the expected Fisher information matrix, which is the negative expected value of the second derivative of the L ( σ | b ) with respect to σ as
2 L ( σ | b ) σ 2 = n σ 2 3 σ 4 i = 1 n b ( y i u ) b ( y i u ) 2 .
The Fisher information matrix I ( σ ) is
I ( σ ) = E n σ 2 3 σ 4 i = 1 n b ( y i u ) b ( y i u ) 2 .
When n is sufficiently large, the first term dominates the expectation, therefore, I ( σ ) n σ 2 . Hence, the variance of σ ^ say V a r ( σ ) σ 2 n . To construct a ( 1 α ) 100 % confidence interval for σ ^ .
σ ^ 2 Z α 2 σ ^ 2 n , σ ^ 2 + Z α 2 σ ^ 2 n ,
where Z α 2 is the critical value from the standard normal distribution.

3.2. Sensitivity Analysis and Algorithm for Optimal Estimates

This subsection explores sensitivity analysis of the MLE of σ ^ , emphasizing its strong dependency on b ^ . A simulation-based likelihood-free-like approach is presented to determine the optimal value of b ^ , and  σ ^ , providing robust parameter estimates for practical applications.

3.2.1. Sensitivity Analysis

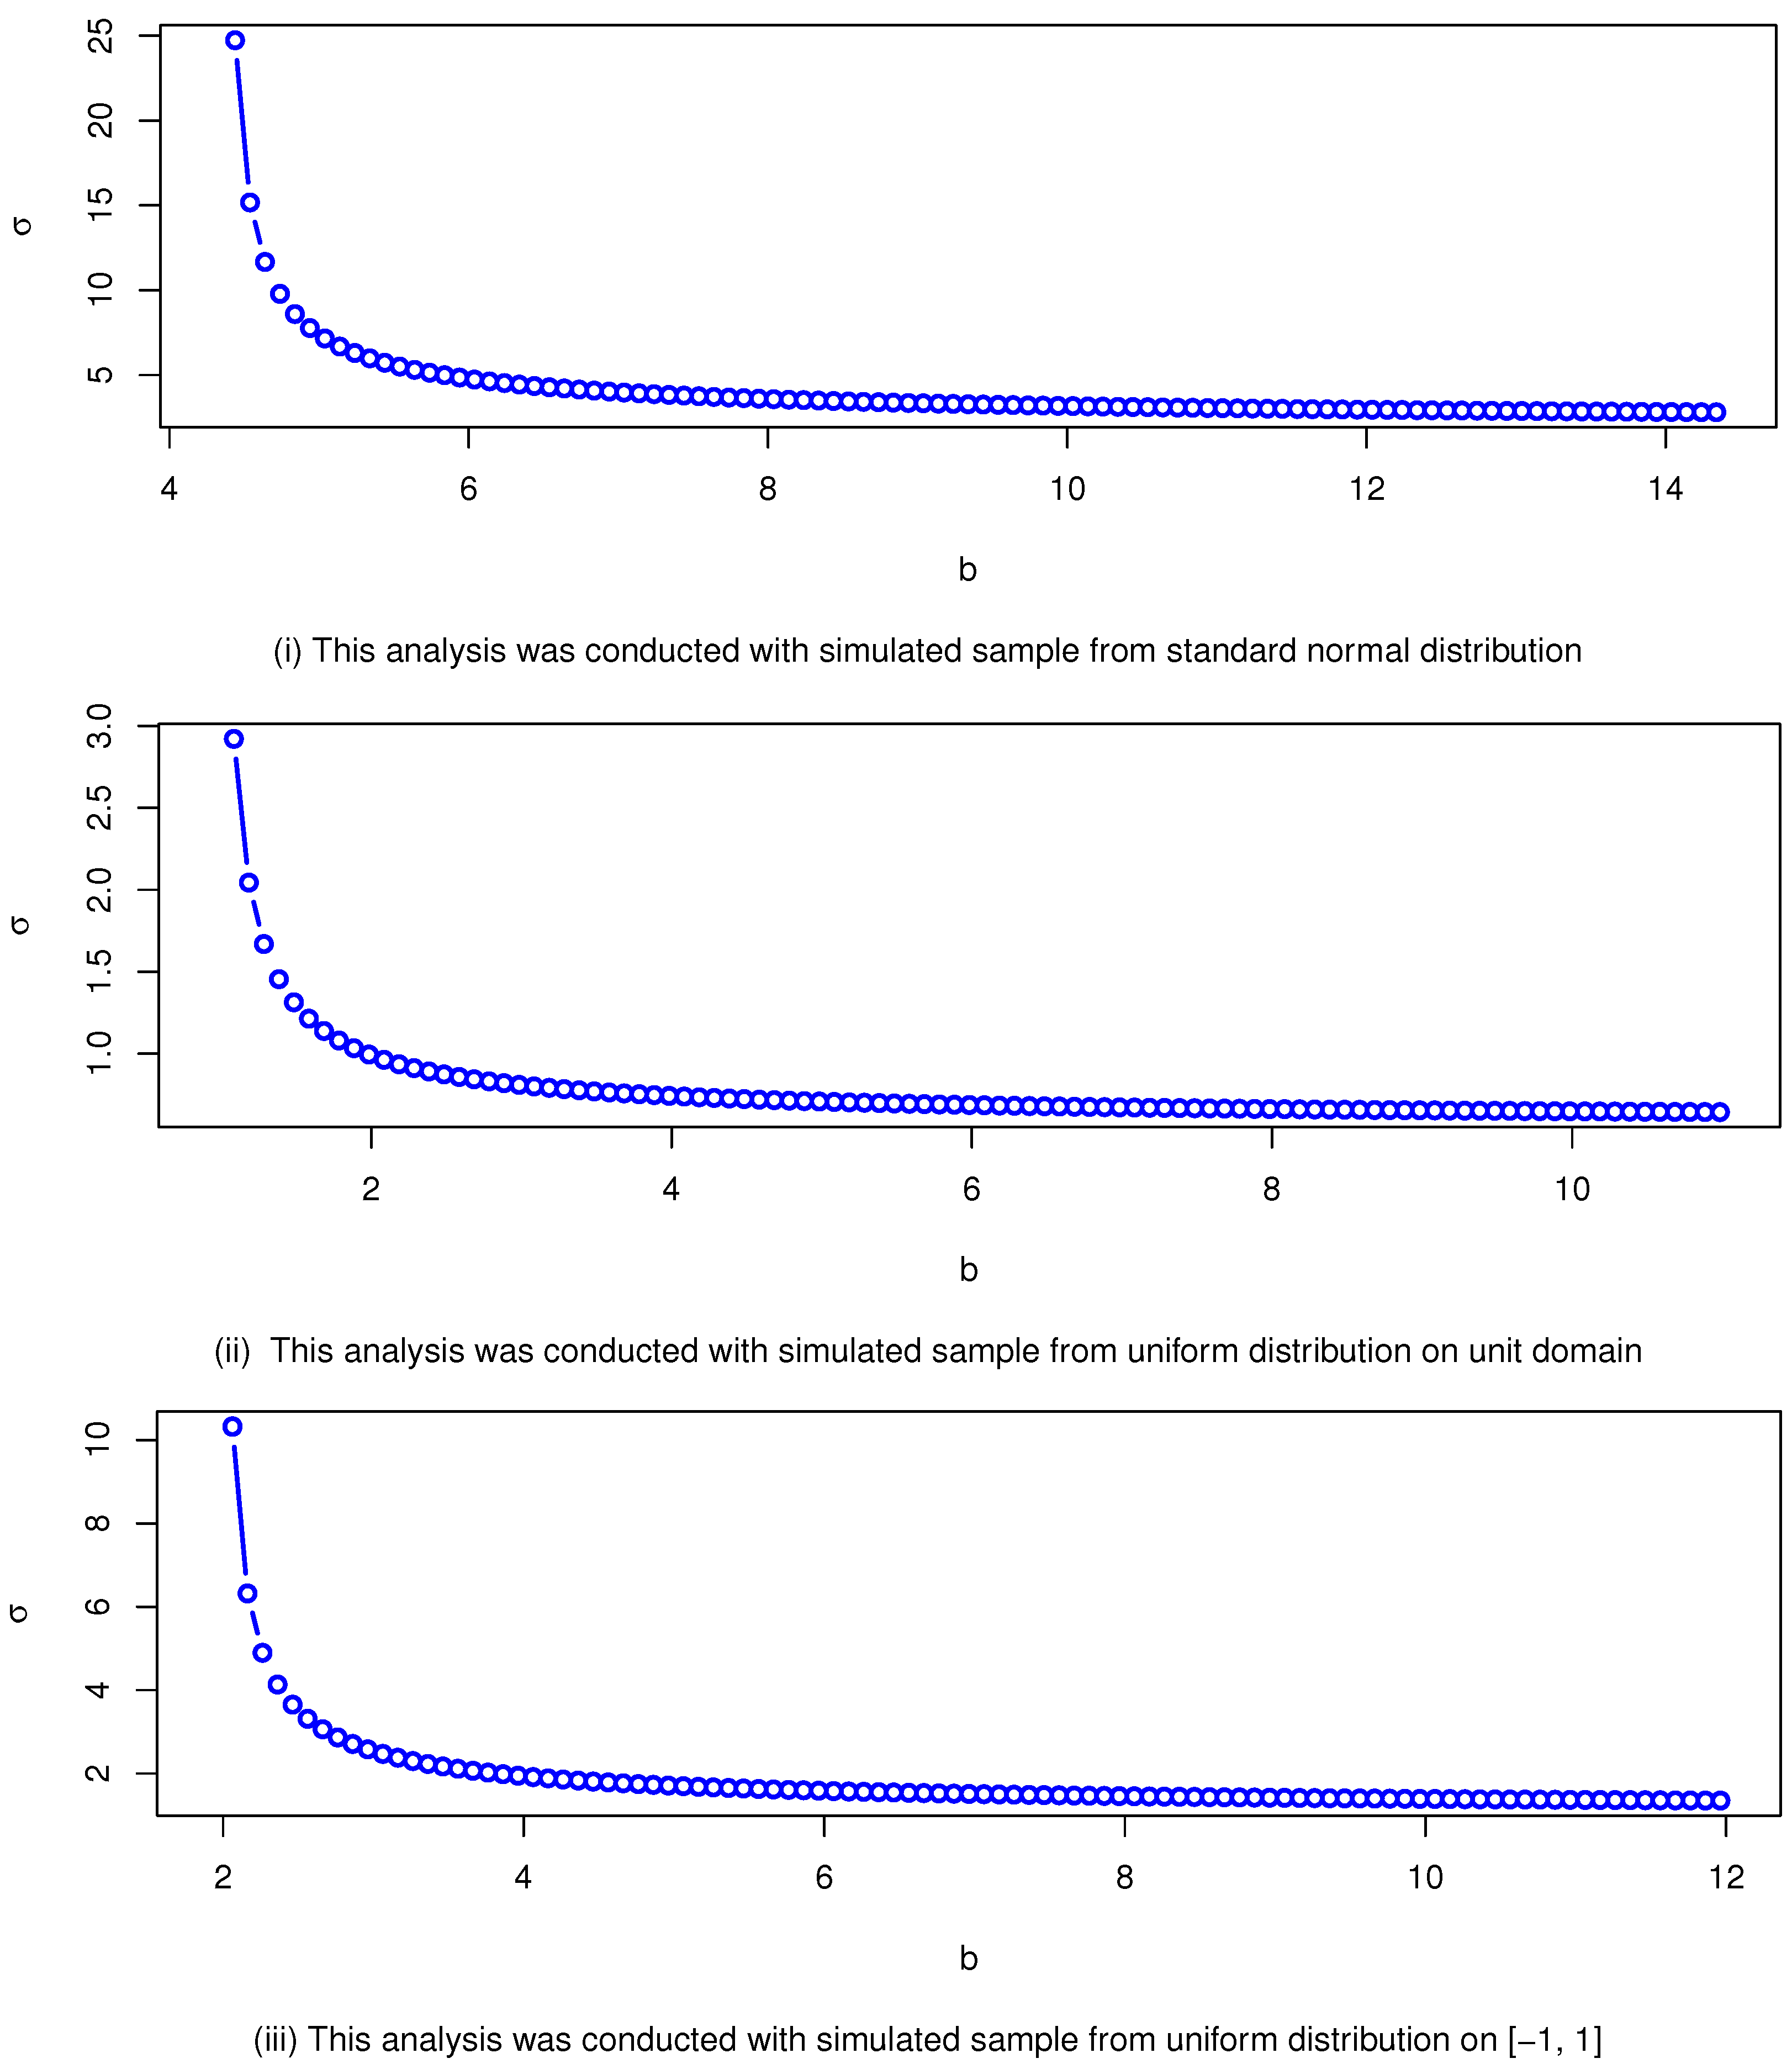
The MLE of σ ^ is obtained analytically but it strongly depend on b ^ . We conducted some sensitivity analysis to study the influence of b ^ in σ ^ . We consider several samples from standard normal and uniform distributions with various values of b, and study the effect of increase in b on σ .  Figure 2 illustrated that in several scenarios, as b increases (i.e., increase by ϵ ), σ starts with a high value and then decreases rapidly. This suggests that σ is highly sensitive to values of b near d (i.e, choosing very small ϵ ), resulting in large variations. This indicates that, beyond a certain threshold, changes in b have a diminishing impact on σ . At values of b close to d, σ is highly sensitive to small changes in b, likely due to the dependency on ( b ( y i u ) ) in the denominator, which can become very small. As b increases, σ converges towards a stable value, suggesting that for large values of b, the effect of changes in b on σ becomes negligible.

3.2.2. Algorithm for Optimal Estimates

The sensitivity analysis leads us to propose the use of a simulation based approach to obtain the optimal value of b ^ . A likelihood-free-like approach using full data set without considering a summary statistics is proposed. This method provides a mean of finding best estimates for any parameter on a boundary that depend on either minimum or maximum order statistics or range, especially when the other dependent parameters sensitivity becomes negligible to a certain threshold. The algorithm is simulation based but provides a single estimate. To see more about the likelihood-free method and its applications (see, [27,28]).
Let us assume b U ( 0 , c ) as an informative prior, then, we can apply likelihood-free-like to estimate b to get optimal estimate. A Cramér–von Mises test is suggested as a distance function, defined by:
C v M = 1 12 n + i = 1 n 2 i 1 2 n F ( y i ) 2 ,
where F ( y i ) is the CDF of the proposed model. Let δ > 0 be a tolerance threshold, and  D * be a simulated data. The algorithm for determination of optimal b and σ is given below in Algorithm 2. In addition, the flowchart in Figure 3 describes the steps given in Algorithm 2.
Algorithm 2 Likelihood-free-like algorithm for optimal b ^ .
1.Let Y 1 Y 2 , Y n be an order statistics from the observed data;
let u = Y 1 , and d = Y n Y 1 be their range. Choose a threshold δ > 0 .
2.Compute the initial estimate b ^ 0 = d + ϵ ,   ϵ > 0 to obtain MLE of σ :
σ ^ 0 = 1 n i = 1 n b 0 ( y i u ) b 0 ( y i u ) 2 .
3.Based on b ^ 0 , generate b ^ * = d + U ( 0 , c ) , where U ( 0 , c ) , c > 0 , is a uniform distribution.
4.Compute σ ^ * using b ^ * from (7).
5.Simulate data D * = { x 1 , x 2 , , x n } , of size n from F ( x ; b ^ * , σ ^ * ) using Algorithm 1.
6.Evaluate the acceptance measure ρ ( D * ) from (8) as:
ρ ( D * ) = 1 12 n + i = 1 n 2 i 1 2 n F ( x i ; σ ^ * , b ^ * ) 2 .
7.Accept b ^ * and σ ^ * if ρ < δ .
8.Return to step 3 and repeat N times, to get ( b ^ * ( 1 ) , σ ^ * ( 1 ) ) , , ( b ^ * ( m ) , σ ^ * ( m ) ) ; m N .
9.The optimal b ^ and σ ^ is the pair of estimates with the minimum value of ρ in step 8.
For a very large N, we can obtain b ^ in the accepted b * s with the minimum ρ , and  σ ^ as the corresponding σ ^ * .

3.2.3. Testing Algorithm with a Simulated Data

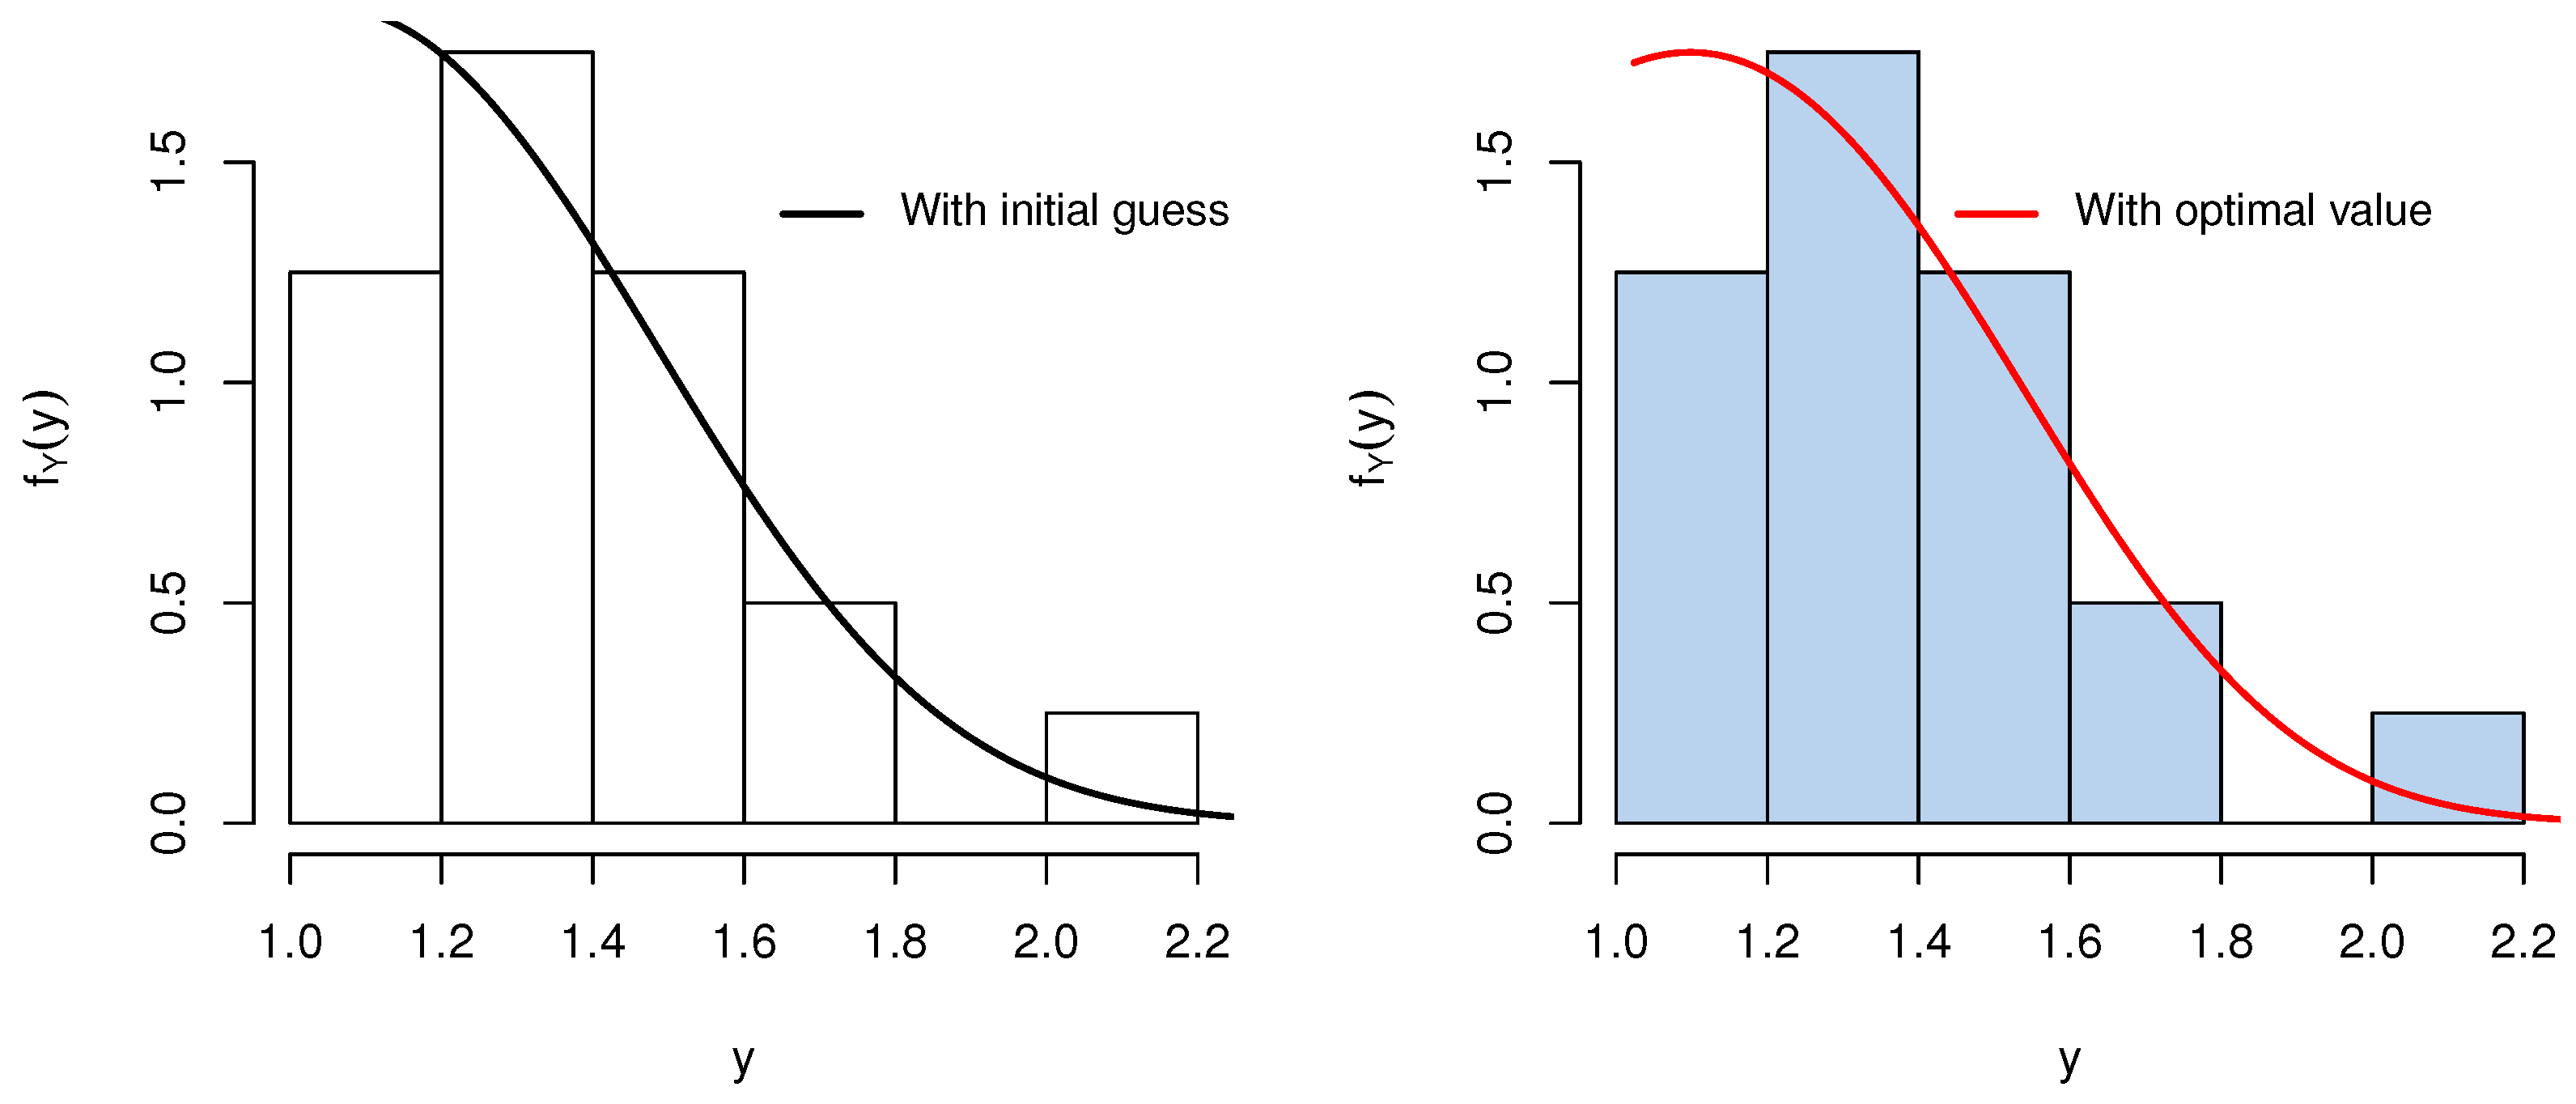
We sampled data of size n = 50 from the proposed model with parameters σ = 0.5 and b = 5 . The algorithm in the Algorithm 2 is applied to obtain the optimal values of b ^ , then to get the optimal MLE of the σ ^ , by using 10,000 iterations and δ = 0.05 . A simple way to identify the initial value of b is using a visual means, to guess the increment ϵ > 0 , and plotting the density to see how good is the fit to the histogram; then, use the values to set the range of the uniform distribution to apply the algorithm. The results are given in Table 2, and demonstrated in Figure 4.

4. Real-World Data Illustration

In this section, we evaluate the performance of the proposed model and compare it with several widely used models using real-world data. Parameters of the models were estimated using the maximum likelihood method, and their fit was assessed based on the Akaike information criterion (AIC), Bayesian information criterion (BIC), consistent Akaike information criterion (CAIC); in addition, the Kolmogorov–Smirnov (KS), Anderson–Darling (AD), and the Cramér–von Mises (CvM) statistics. The model with the smallest values for these criteria was deemed to provide the best fit. The benchmark models used for comparison are outlined as follows.
  • HN, F ( x ) = e r f x σ 2 .
  • Weibull Pareto (WP) [29], F ( x ) = 1 e ( v log ( x / θ ) ) w , x > θ , v , w , θ > 0 .
  • Power distribution (Pw), F ( x ) = ( x / λ ) θ , λ , θ > 0 , 0 x λ .
  • Transmuted exponentiated U-quadratic (TEUq) [30], F ( x ) = G ( x ) ( 1 + λ ( λ G ( x ) ) ) ; where G ( x ) = ( ( α / 3 ) ( ( x β ) 3 + ( β a ) 3 ) ) γ and α < 12 ( b a ) 3 , β < ( a + b ) / 2 , a , b , γ > 0 , λ | 1 | .
  • Mustapha type III (MuIII) [11], F ( x ) = 1 β log x θ α , α , β , θ > 0 , x θ .

4.1. First Data Set

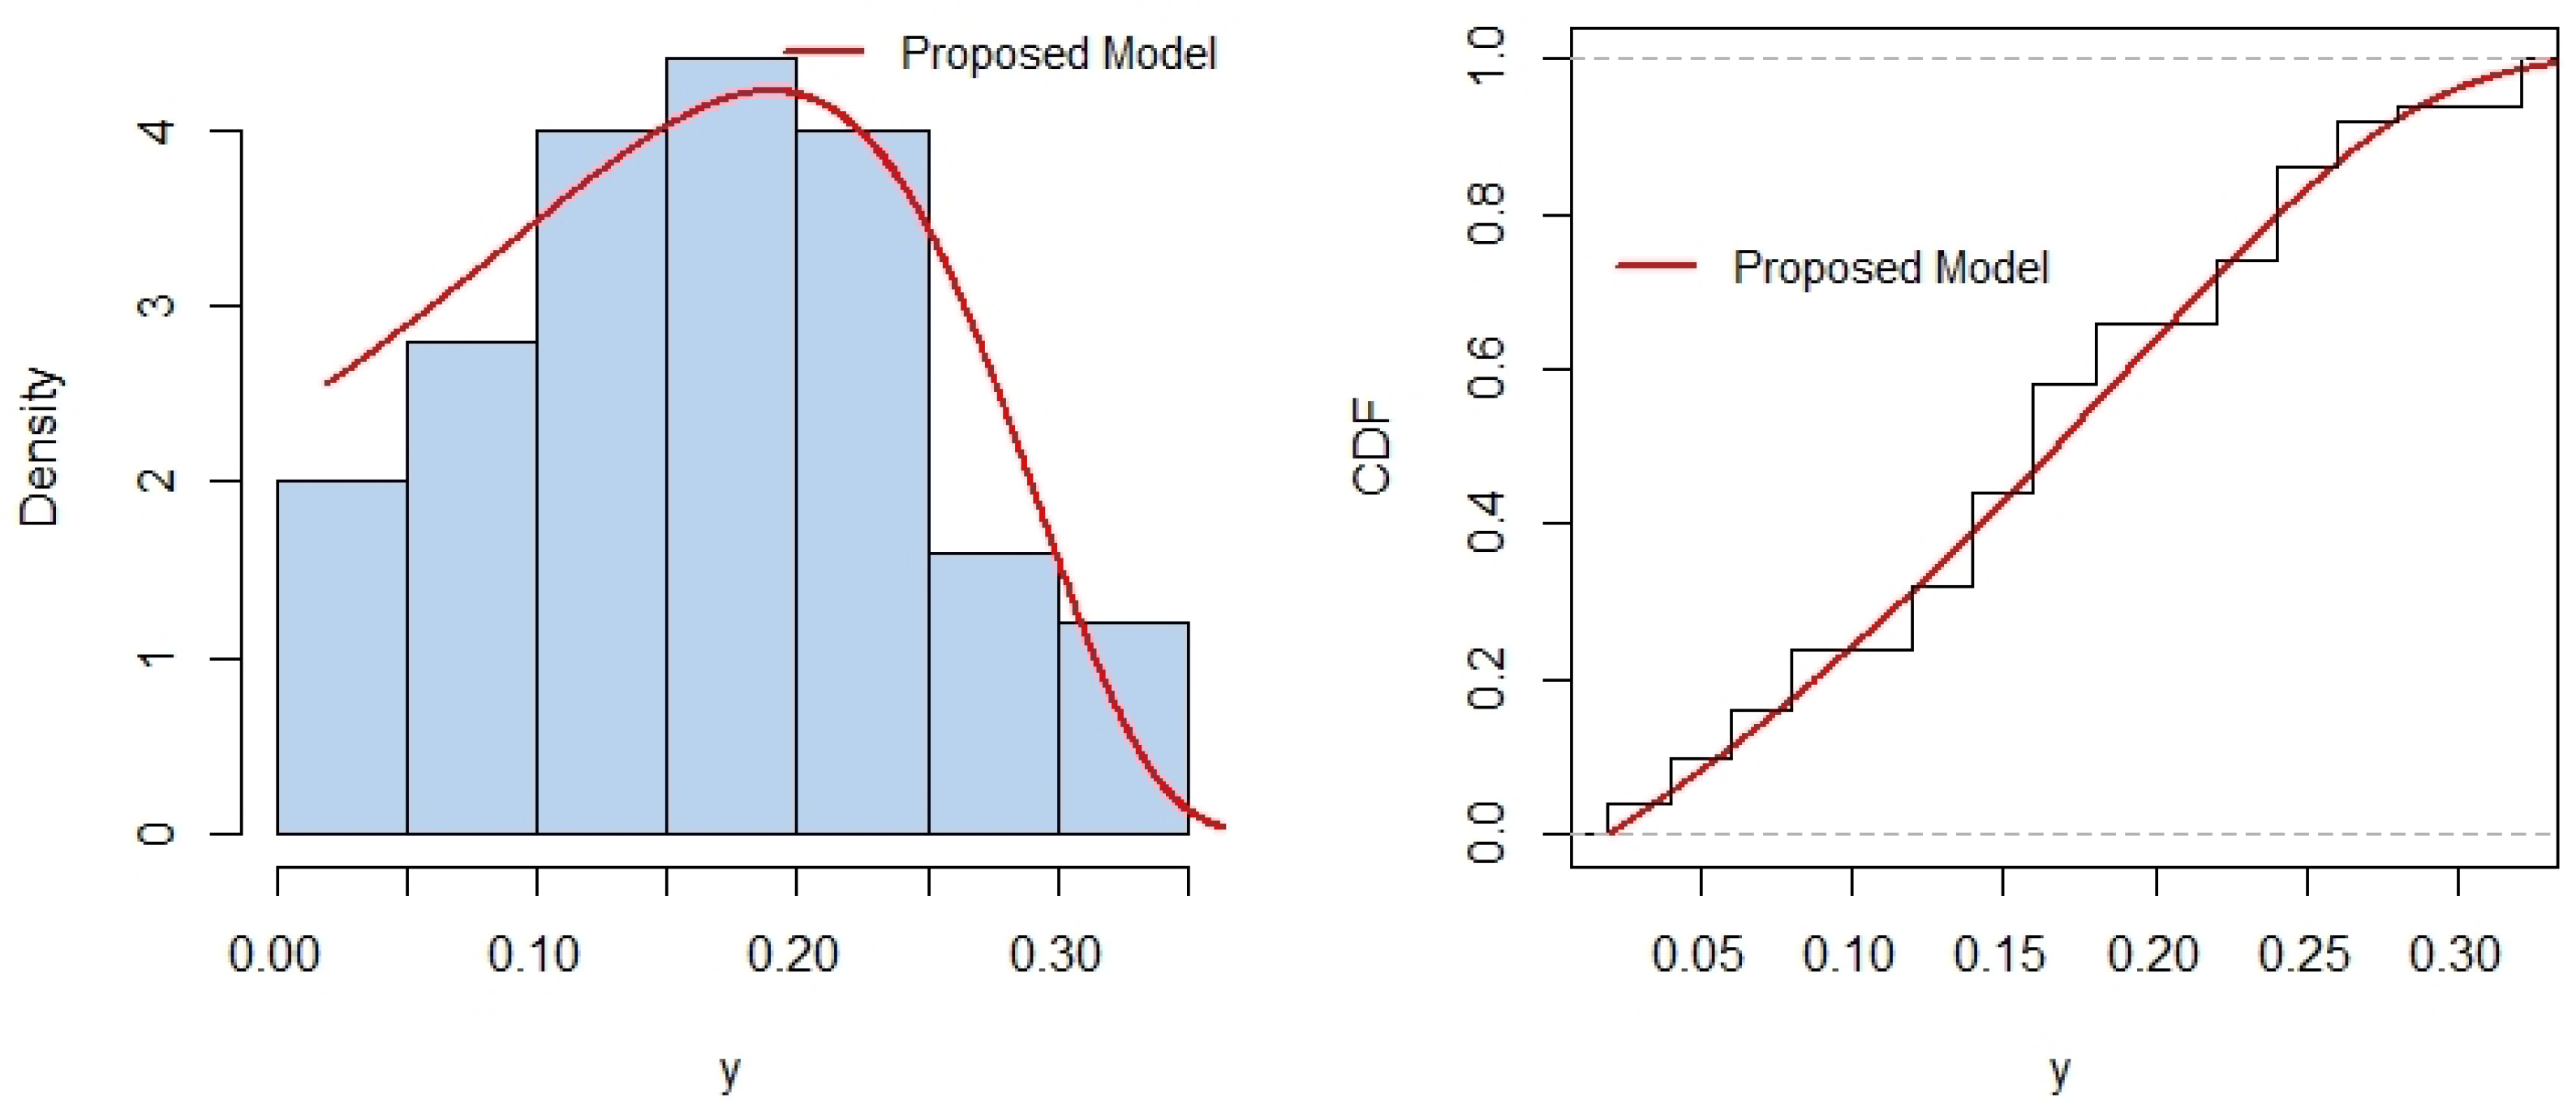
The first data set, provided by [31], examines the influence of soil fertility and the characterization of biological N 2 fixation on the growth of Dimorphandra wilsonii Rizz. For 128 plants, measurements were taken of the phosphorus concentration in their leaves, encompassing 15 distinct observations. The numerical results of the estimates and model performance measures are given in Table 3. Evidently, from the Table 3, the proposed model has the smallest AIC (−398.04), BIC (−392.34), and CAIC (−397.95), indicating the best trade-off between model fit and complexity. In addition, proposed model has the KS (0.0833), AD (0.1209), and CvM (0.0156), in this metrics it has the smallest AD and CvM, making it with the best performance, and ranked the first with six smallest values out of seven of those metrics in Table 3. Furthermore, the WP aligns slightly better KS statistic (0.0742), followed by the second rank. Other models, such as TEU, MuIII, HN perform poorly in this respect.
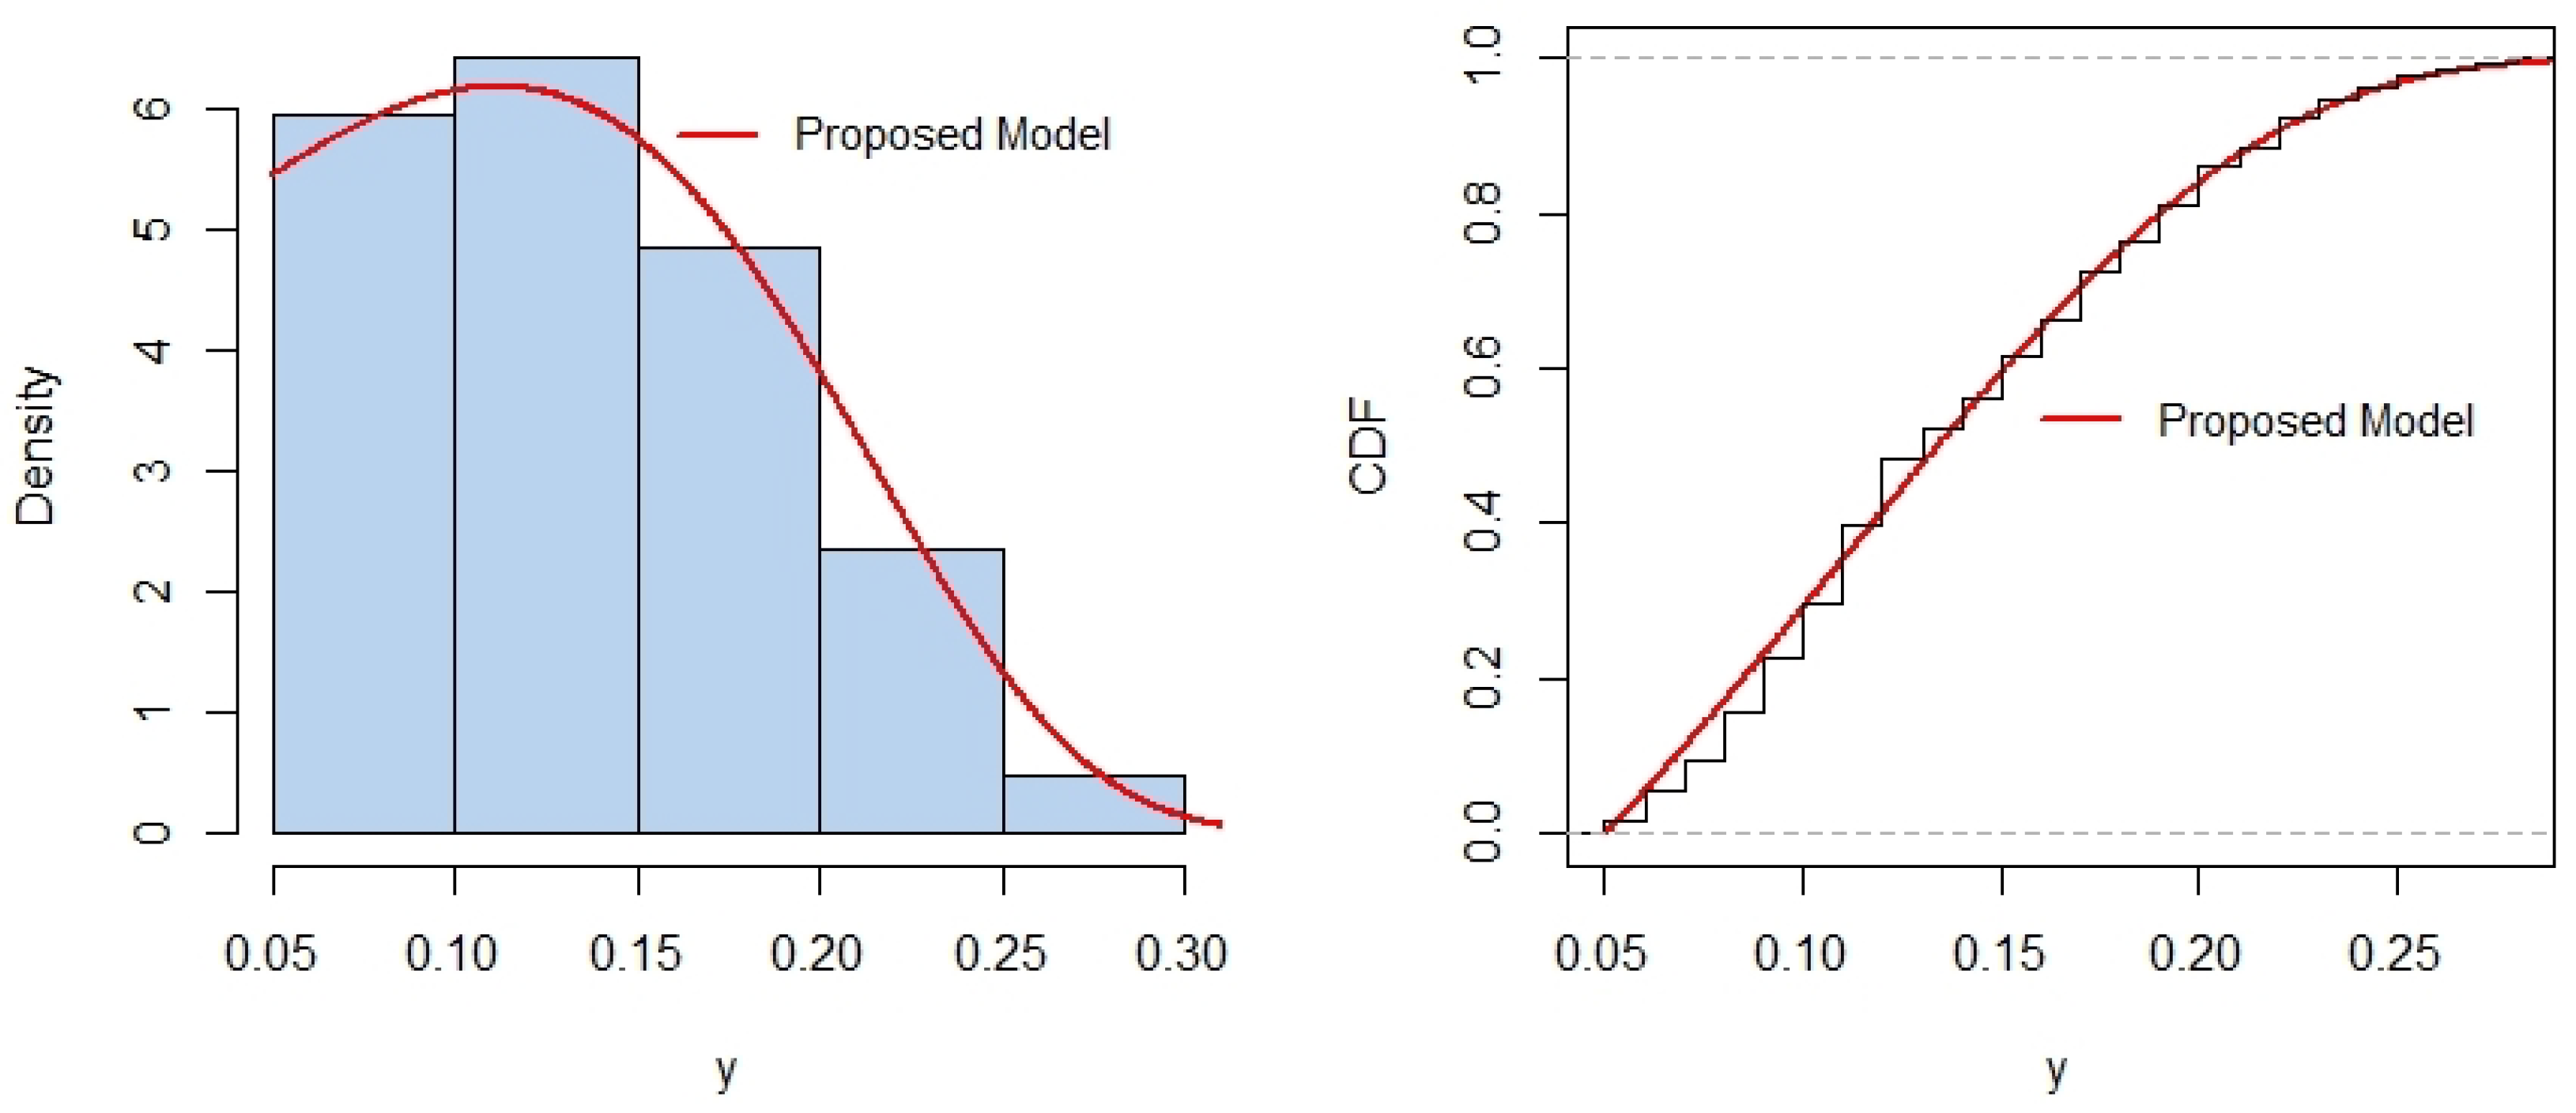
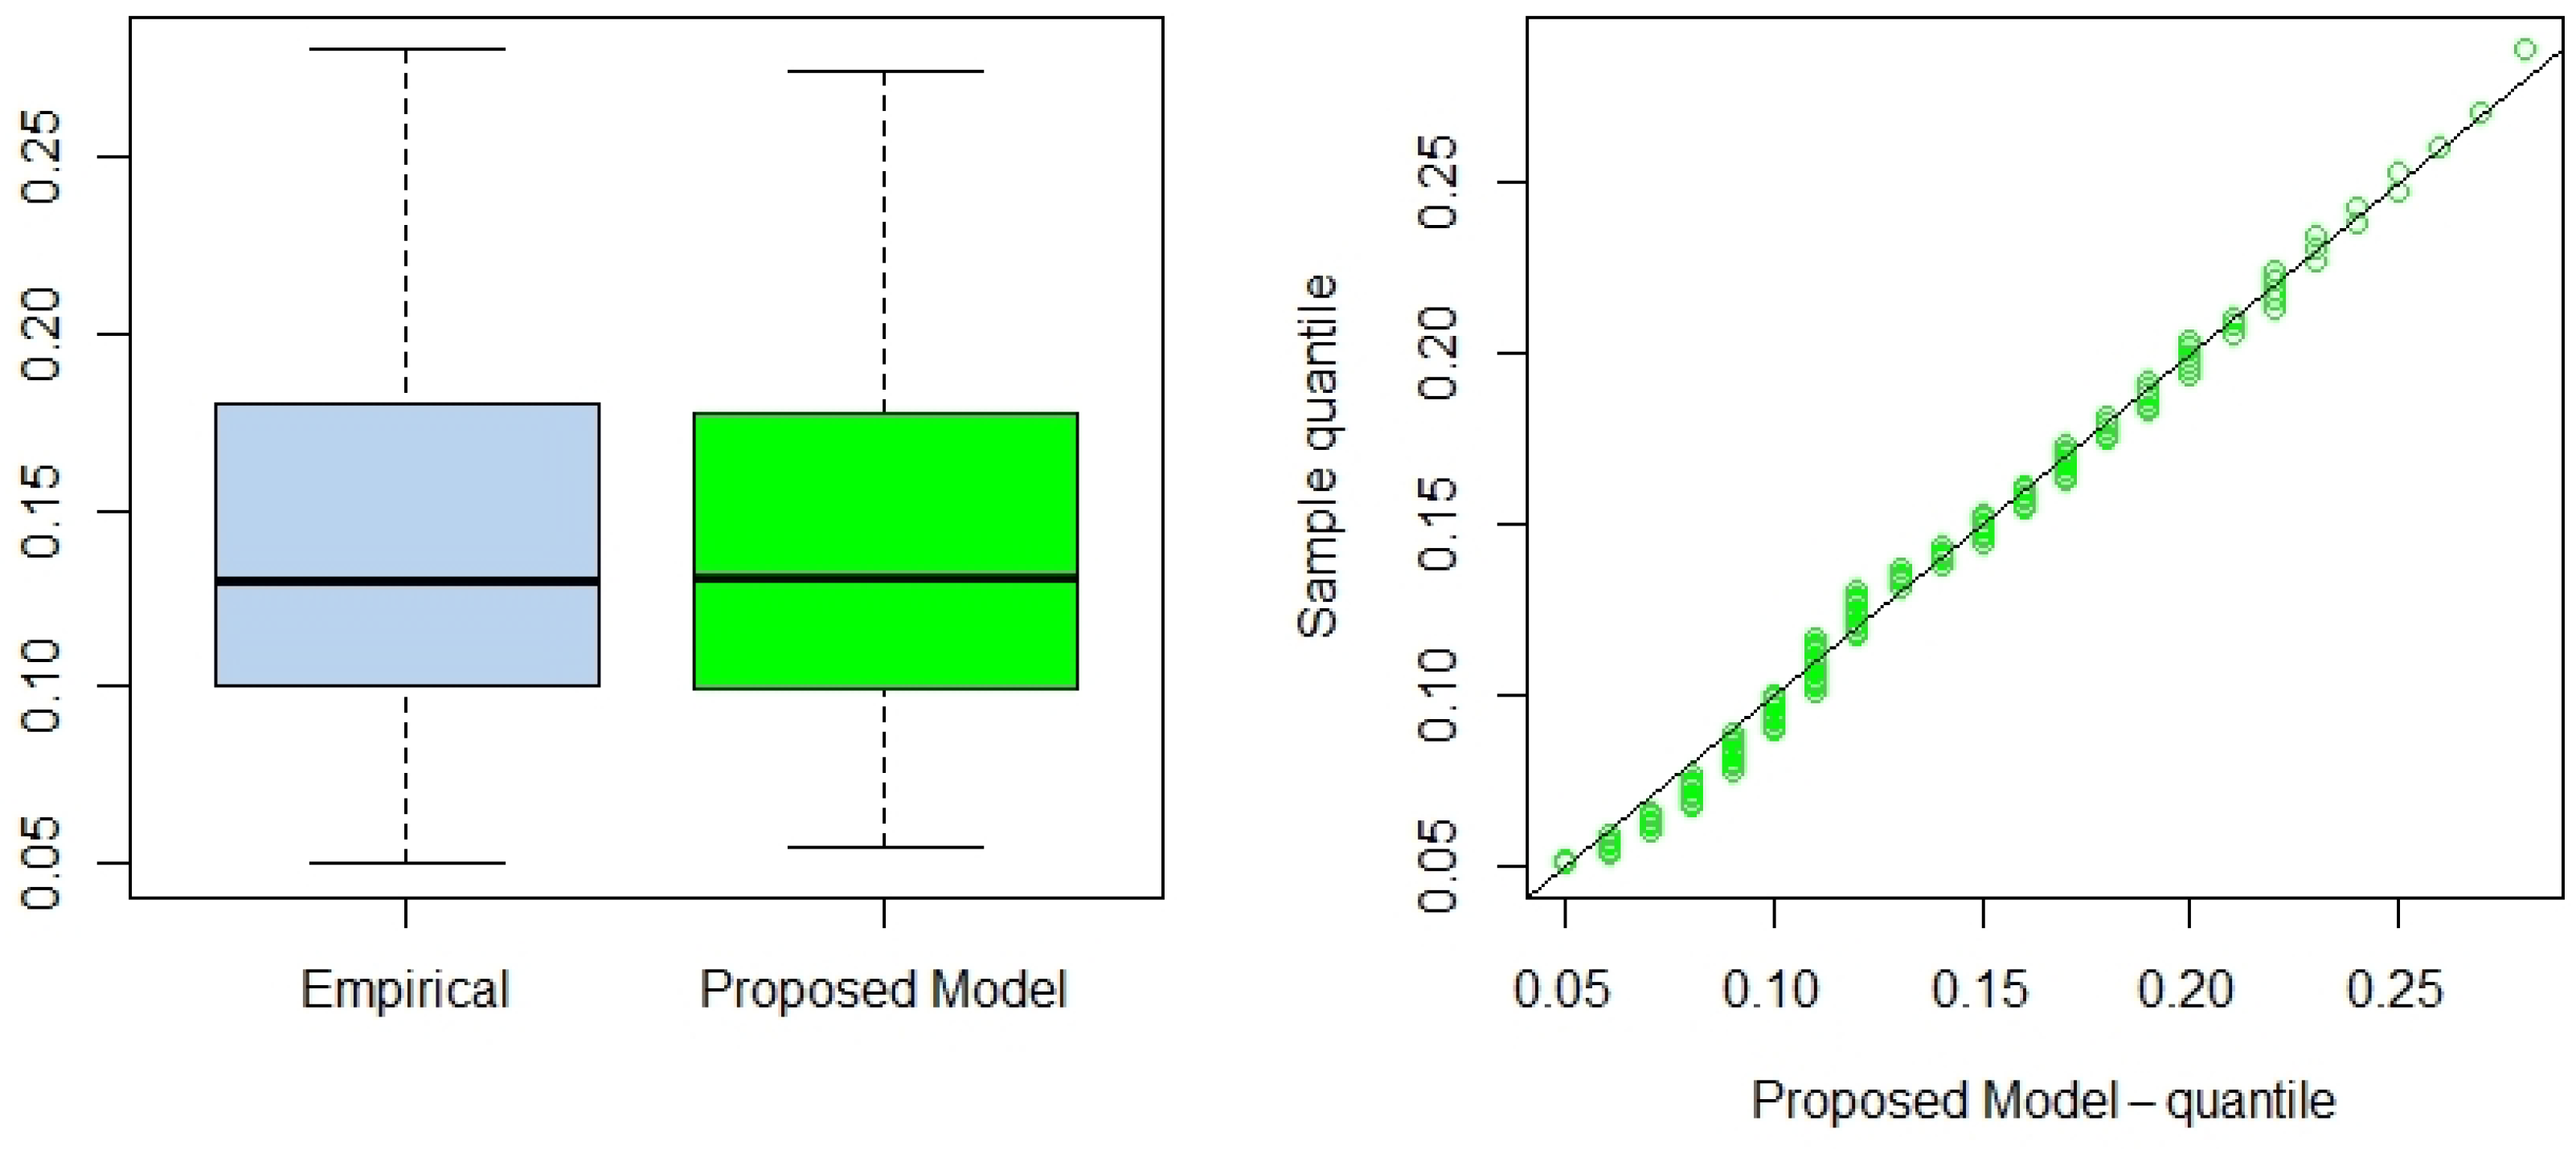
In support of these results, Figure 5 shows the plots of the fitted density (left) and fitted CDF (right) of the proposed model. Figure 6 represents the plots of the empirical and proposed model box plots (left); and the quantile-quantile plot (right) for the first data set. The plots provided visual support of the results describing how the proposed model can represent the observed data with negligible deviations.

4.2. Second Data Set

The second data set consists of 50 observations of burr height (measured in millimeters) for holes with a diameter of 12 mm and a sheet thickness of 3.15 mm, as reported by [32]. The numerical results for parameter estimates and model performance metrics are presented in Table 4. Evidently, from Table 4, the proposed model achieves the smallest values for AIC (−114.36), BIC (−110.54), and CAIC (−114.10), indicating the best balance between model fit and complexity. Moreover, the proposed model exhibits the smallest values for the AD (0.1122) and CvM (0.0161) statistics, while also performing competitively in the KS statistic (0.1538). Overall, it ranks first in six out of the seven evaluated metrics, highlighting its superior performance. The Pw model, with a slightly better KS statistic (0.1463), ranks second. In contrast, models like TEU and WP exhibit relatively poor performance on this data set.
Supporting these findings, Figure 7 illustrates the fitted density (left) and CDF (right) for the proposed model. Additionally, Figure 8 shows the empirical and proposed model box plots (left) and the quantile–quantile plot (right) for this data set. These plots are proving the numerical outcomes visually, by showing how the proposed model can characterize the observed data very well.

5. Conclusions

In this paper, we introduced the truncated ( u , v ) -half-normal distribution, a novel probability model for bounded domains, addressing the need for realistic and analytically tractable models in constrained scenarios. Several properties of the model, including its cumulative distribution function, probability density function and its possible shapes, survival function, hazard rate, and moments, were rigorously derived and analyzed. Parameter estimation was performed using a hybrid approach: MLE for σ and a likelihood-free-like technique for b. We supported the results using sensitivity analysis, and an optimal estimation algorithm, to determine best estimates. The MLE of σ ^ depends strongly on b ^ , as sensitivity analysis reveals that σ initially starts high and decreases rapidly with increasing b, particularly near some threshold value, leading to large variations. Beyond the threshold, changes in b have a diminishing impact, and  σ converges to a stable value, indicating reduced sensitivity for large b. Hence, the utilization of the proposed algorithm helps to determine the optimal estimates. In addition, simulated data is used to demonstrate the accuracy and importance of the proposed hybrid algorithm. Applications to two real-world data sets demonstrated the superior performance of the proposed model compared to widely used alternatives, with better fit across metrics like AIC, BIC, CAIC, KS, AD, and CvM statistics. These results highlight the versatility and robustness of the ( u , v ) -half-normal distribution for modeling data with bounded support. We note that while the formulation permits negative lower bounds ( u < 0 ), its empirical relevance depends on the nature of the data. In contexts involving standardized or signed measurements, this generalization may prove useful. In strictly positive domains, u 0 should naturally be enforced. An interesting avenue for future research is the extension of the proposed bounded half-normal distribution to a regression framework. In such a setting, the location (e.g., via a transformation of the interval ( u , v ) ), the scale parameter σ , or the shape parameter b could be modeled as functions of covariates. This would allow practitioners to model bounded response variables that exhibit half-normal-like asymmetry while accounting for explanatory variables. Such an extension could be pursued within both classical and Bayesian inferential paradigms, potentially using maximum likelihood or Bayesian hierarchical models. The development of suitable link functions, estimation procedures, and diagnostics tailored to this bounded setting would form an important next step.

Author Contributions

Conceptualization, M.K., H.S.B., B.A. and M.M.; methodology, M.K., H.S.B., B.A. and M.M.; software, B.A. and M.M.; validation, M.K., H.S.B., B.A. and M.M.; formal analysis, M.K., H.S.B., B.A. and M.M.; investigation, M.K., H.S.B., B.A., M.M., S.M.A.A. and L.A.; resources, M.K., H.S.B., B.A., M.M., S.M.A.A. and L.A.; data curation, M.K., H.S.B., B.A. and M.M.; writing—original draft preparation, M.K., H.S.B., B.A. and M.M.; writing—review and editing, M.K., H.S.B., B.A., M.M., S.M.A.A. and L.A.; visualization, M.K., H.S.B., B.A., M.M., S.M.A.A. and L.A.; supervision, M.K., H.S.B., B.A., M.M., S.M.A.A. and L.A.; project administration, M.K., H.S.B., B.A., M.M., S.M.A.A. and L.A.; funding acquisition, S.M.A.A. and L.A. All authors have read and agreed to the published version of the manuscript.

Funding

This research work was funded by Umm Al-Qura University, Saudi Arabia under grant number: 25UQU4310037GSSR09.

Data Availability Statement

The data supporting the findings of this study are cited throughout the manuscript.

Acknowledgments

The authors extend their appreciation to Umm Al-Qura University, Saudi Arabia for funding this research work through grant number: 25UQU4310037GSSR09.

Conflicts of Interest

The authors declare no conflicts of interest.

Appendix A. Quantile Function R-Code Using the Algorithm 1

Mathematics 13 01740 i001

References

  1. Lachos, V.H.; Ghosh, P.; Arellano-Valle, R.B. Likelihood based inference for skew-normal independent linear mixed models. Stat. Sin. 2010, 20, 303–322. [Google Scholar]
  2. Meeker, W.Q.; Escobar, L.A.; Pascual, F.G. Statistical Methods for Reliability Data; John Wiley & Sons: Hoboken, NJ, USA, 2021. [Google Scholar]
  3. Daher, W.; Aydilek, H.; Saleeby, E.G. Insider trading with different risk attitudes. J. Econ. 2020, 131, 123–147. [Google Scholar] [CrossRef]
  4. Nadarajah, S. Some truncated distributions. Acta Appl. Math. 2009, 106, 105–123. [Google Scholar] [CrossRef]
  5. Johnson, N.L.; Kotz, S.; Balakrishnan, N. Continuous Multivariate Distributions; Wiley: New York, NY, USA, 1972; Volume 7. [Google Scholar]
  6. Barr, D.R.; Sherrill, E.T. Mean and variance of truncated normal distributions. Am. Stat. 1999, 53, 357–361. [Google Scholar] [CrossRef]
  7. Burkardt, J. The truncated normal distribution. Dep. Sci. Comput. Website Fla. State Univ. 2014, 1, 58. [Google Scholar]
  8. Chattamvelli, R.; Shanmugam, R. Arcsine Distribution. In Continuous Distributions in Engineering and the Applied Sciences-Part I; Springer: Berlin/Heidelberg, Germany, 2021; pp. 57–68. [Google Scholar]
  9. Arnold, B.C. Pareto distribution. In Wiley StatsRef: Statistics Reference Online; John Wiley & Sons: Hoboken, NJ, USA, 2014; pp. 1–10. [Google Scholar]
  10. González-Hernández, I.J.; Méndez-González, L.C.; Granillo-Macías, R.; Rodríguez-Muñoz, J.L.; Pacheco-Cedeño, J.S. A new generalization of the uniform distribution: Properties and applications to lifetime data. Mathematics 2024, 12, 2328. [Google Scholar] [CrossRef]
  11. Muhammad, M. A new three-parameter model with support on a bounded domain: Properties and quantile regression model. J. Comput. Math. Data Sci. 2023, 6, 100077. [Google Scholar] [CrossRef]
  12. Sun, J.; Kong, M.; Pal, S. The Modified-Half-Normal distribution: Properties and an efficient sampling scheme. Commun. Stat.—Theory Methods 2023, 52, 1591–1613. [Google Scholar] [CrossRef]
  13. Olmos, N.M.; Varela, H.; Bolfarine, H.; Gómez, H.W. An extension of the generalized half-normal distribution. Stat. Pap. 2014, 55, 967–981. [Google Scholar] [CrossRef]
  14. Bakouch, H.S.; Nik, A.S.; Asgharzadeh, A.; Salinas, H.S. A flexible probability model for proportion data: Unit-half-normal distribution. Commun. Stat.-Case Stud. Data Anal. Appl. 2021, 7, 271–288. [Google Scholar] [CrossRef]
  15. Bosch-Badia, M.T.; Montllor-Serrats, J.; Tarrazon-Rodon, M.A. Risk analysis through the half-normal distribution. Mathematics 2020, 8, 2080. [Google Scholar] [CrossRef]
  16. De la Cruz, R.; Salinas, H.S.; Meza, C. Reliability estimation for stress-strength model based on Unit-half-normal distribution. Symmetry 2022, 14, 837. [Google Scholar] [CrossRef]
  17. Ahmadi, K.; Akbari, M.; Raqab, M.Z. Objective Bayesian estimation for the differential entropy measure under generalized half-normal distribution. Bull. Malays. Math. Sci. Soc. 2023, 46, 39. [Google Scholar] [CrossRef] [PubMed]
  18. Sief, M.; Liu, X.; Abd El-Raheem, A.E.R.M. Inference for a constant-stress model under progressive type-I interval censored data from the generalized half-normal distribution. J. Stat. Comput. Simul. 2021, 91, 3228–3253. [Google Scholar] [CrossRef]
  19. Altman, D.G. Construction of age-related reference centiles using absolute residuals. Stat. Med. 1993, 12, 917–924. [Google Scholar] [CrossRef] [PubMed]
  20. Nik, A.S.; Chesneau, C.; Bakouch, H.S.; Asgharzadeh, A. A new truncated (0, b)-F family of lifetime distributions with an extensive study to a submodel and reliability data. Afr. Mat. 2023, 34, 3. [Google Scholar] [CrossRef]
  21. Tanner, M.A. Tools for Statistical Inference; Springer: Berlin/Heidelberg, Germany, 1993; Volume 3. [Google Scholar]
  22. Luke, Y.L. Special Functions and Their Approximations: V. 2; Academic Press: Boca Raton, FL, USA, 1969; Volume 4. [Google Scholar]
  23. Prudnikov, A.P.; Brychkov, I.A.; Marichev, O.I. Integrals and Series: Direct Laplace Transforms; CRC Press: Boca Raton, FL, USA, 1986. [Google Scholar]
  24. Prudnikov, A. Integrals and Series; Routledge: London, UK, 2018. [Google Scholar]
  25. Mathai, A.M.; Saxena, R.K.; Haubold, H.J. The H-Function: Theory and Applications; Springer Science & Business Media: Berlin/Heidelberg, Germany, 2009. [Google Scholar]
  26. R Core Team. R: A Language and Environment for Statistical Computing; R Foundation for Statistical Computing: Vienna, Austria, 2010. [Google Scholar]
  27. Sisson, S.A.; Fan, Y.; Beaumont, M. Handbook of Approximate Bayesian Computation; CRC Press: Boca Raton, FL, USA, 2018. [Google Scholar]
  28. Palestro, J.J.; Sederberg, P.B.; Osth, A.F.; Van Zandt, T.; Turner, B.M. Likelihood-Free Methods for Cognitive Science; Springer: Berlin/Heidelberg, Germany, 2018. [Google Scholar]
  29. Alzaatreh, A.; Famoye, F.; Lee, C. Weibull-Pareto distribution and its applications. Commun. Stat.—Theory Methods 2013, 42, 1673–1691. [Google Scholar] [CrossRef]
  30. Muhammad, M.; Suleiman, M.I. The transmuted exponentiated U-quadratic distribution for lifetime modeling. Sohag J. Math 2019, 6, 19–27. [Google Scholar]
  31. Fonseca, M.; Franca, M. A Influoencia da Fertilidade do Solo e Caracterizacao da Fixacao Biologica de N2 Para o Crescimento de Dimorphandra Wilsonii Rizz. Master’s Thesis, Universidade Federal de Minas Gerais, Belo Horizonte, Brazil, 2007. [Google Scholar]
  32. Dasgupta, R. On the distribution of burr with applications. Sankhya B 2011, 73, 1–19. [Google Scholar] [CrossRef]
Figure 1. Plot of density function of Y distribution for different values of σ at u = 1 and b = 6 .
Mathematics 13 01740 g001
Figure 2. Plots of the sensitivity analysis on σ as b increases in (iiii). This indicates that beyond a certain threshold, increase in b have a diminishing impact on σ .
Mathematics 13 01740 g002
Figure 3. Flowchart describing step by step of the likelihood-free-like algorithm.
Mathematics 13 01740 g003
Figure 4. Plots of the fitted density of the simulated data with initial guess (left) and optimal values (right) of the σ ^ and b ^ .
Mathematics 13 01740 g004
Figure 5. Plots of the fitted density (left), and fitted CDF (right) of the proposed model for the first data set.
Mathematics 13 01740 g005
Figure 6. Plots of the empirical and proposed model box plots (left), and the quantile-quantile plot (right) of the proposed model for the first data set.
Mathematics 13 01740 g006
Figure 7. Plots of the fitted density (left), and fitted CDF (right) of the proposed model for the second data set.
Mathematics 13 01740 g007
Figure 8. Plots of the empirical and proposed model box plots (left), and the quantile-quantile plot (right) of the proposed model for the second data set.
Mathematics 13 01740 g008
Table 1. Indicators of Y with different set of parameters.
Indicator σ = 1 , b = 10 σ = 2 , b = 4 σ = 1.8 , b = 2 σ = π , b = π σ = 3 , b = 2 σ = 9 , b = 3 σ = 0.75 , b = 0.05
CV0.69586300.56512010.49648270.48360540.43353080.34996440.192012
CS0.72062970.1487482−0.1613313−0.2220628−0.4703052−0.9528335−2.509737
CK3.03531712.14375322.07570652.09403082.27337353.09054429.860044
Table 2. Some possible real roots of z in a unit domain for some vales of σ .
Sample SizeParametersActual ValuesInitial Estimates of b 0 , σ 0 Optimal Estimates of b ^ , σ ^
50 σ 0.50.43310.4623
b5.011.00945.5732
CvM 0.12220.0338
Table 3. MLEs, L, AIC, BIC, CAIC, KS, AD, and CvM for the first data set.
ModelMLEsLAICBICCAICKSADCvM
Proposed Model σ ^ = 0.1465 201.02−398.04−392.34−397.950.08330.12090.0156
b ^ = 0.5479
WP v ^ = 0.3999 196.82−387.64−379.09−387.450.07420.74140.1130
w ^ = 3.3299
θ ^ = 0.0400
Pw θ ^ = 1.3010 166.55−329.10−323.39−329.010.21691.57570.2611
λ ^ = 0.2810
MuIII α ^ = 99.3839 123.60−241.21−232.65−241.010.31810.85620.1568
β ^ = 0.0094
θ ^ = 0.3800
HN σ ^ = 0.1509 149.21−296.41−293.56−296.380.63571.23010.2022
TEU λ ^ = 0.9722 75.3985−142.79−131.39−142.470.30781.79360.2863
γ ^ = 1.6520
a ^ = 0.0490
b ^ = 0.2800
Table 4. MLEs, L, AIC, BIC, CAIC, KS, AD, and CvM for the second data set.
ModelMLEsLAICBICCAICKSADCvM
Proposed Model σ ^ = 0.3116 59.18 114.36 −110.54−114.100.15380.11220.0161
b ^ = 0.4929
WP v ^ = 0.0936 41.72−77.44−71.69−76.910.21862.93530.4999
w ^ = 3.0749
θ ^ = 0.0190
Pw θ ^ = 1.1757 57.44−110.87−107.05−110.620.14631.18980.1592
λ ^ = 0.3210
MuIII α ^ = 85.2215 43.52−81.03−75.39−80.510.26270.56090.0949
β ^ = 0.0105
θ ^ = 0.4200
HN σ ^ = 0.1819 48.9371−95.87−93.96−95.790.54711.09720.1689
TEU λ ^ = 0.7716 2.81042.379210.02733.26810.27703.55150.6581
γ ^ = 1.5599
a ^ = 0.0190
b ^ = 0.3200
Disclaimer/Publisher’s Note: The statements, opinions and data contained in all publications are solely those of the individual author(s) and contributor(s) and not of MDPI and/or the editor(s). MDPI and/or the editor(s) disclaim responsibility for any injury to people or property resulting from any ideas, methods, instructions or products referred to in the content.