Article

SFPFMformer: Short-Term Power Load Forecasting for Proxy Electricity Purchase Based on Feature Optimization and Multiscale Decomposition

1
Metrology Center of State Grid Jibei Electric Power Co., Ltd., Beijing 100045, China
2
College of Artificial Intelligence, Nanjing Agricultural University, Nanjing 211800, China
3
Labs of Advanced Data Science and Service, Nanjing Agricultural University, Nanjing 211800, China
*
Author to whom correspondence should be addressed.
Mathematics 2025, 13(10), 1584; https://doi.org/10.3390/math13101584
Submission received: 14 April 2025 / Revised: 9 May 2025 / Accepted: 9 May 2025 / Published: 12 May 2025

Abstract

:
Short-term load forecasting is important for proxy electricity purchasing in the electricity spot trading market. In this paper, a model SFPFMformer for short-term power load forecasting is proposed to address the issue of balancing accuracy and timeliness. In SFPFMformer, the random forest algorithm is applied to select the most important attributes, which reduces redundant attributes and improves performance and efficiency; then, multiple timescale segmentation is used to extract load data features from multiple time dimensions to learn feature representations at different levels. In addition, fusion time location encoding is adopted in Transformer to ensure that the model can accurately capture time-position information. Finally, we utilize a depthwise separable convolution block to extract features from power load data, which efficiently captures the pattern of change in load. We conducted extensive experiment on real datasets, and the experimental results show that in 4 h prediction, the RMSE, MAE, and MAPE of our model are 1128.69, 803.91, and 2.63%, respectively. For 24 h forecast, the RMSE, MAE and MAPE of our model are 1190.51, 897.26, and 2.97%, respectively. Compared with existing methods, such as Informer, Autoformer, ETSformer, LSTM, and Seq2seq, our model has better precision and time performance for short-term power load forecasting for proxy spot trading.

1. Introduction

Building a new power system using an artificial intelligence technique is an essential means to achieve the goal of carbon peaking and carbon neutrality [1]. For building a new power system, proxy electricity purchasing helps to build a clean, efficient, safe, and low-carbon power market, and proxy electricity purchase is an important way of enabling power market transactions [2].
Proxy electricity purchasing refers to the process where electricity retail companies act as agents for end-users, procuring electricity through medium- and long-term market transactions [3] and spot market transactions [4], and then selling the electricity to users. In order to ensure a stable power supply and avoid waste and loss, short-term power load forecasting in the spot market needs high accuracy and timeliness [5,6]. Power load forecasting can be classified as univariate forecasting [7,8] and multivariate forecasting [9,10]. Multivariate forecasting of power load series is carried out based on historical power load data and the factors influencing power load data, which is a more challenging issue than univariate forecasting [11].
In recent years, deep learning-based algorithms have centered on data for decision-making and actions, capturing the correlations among influencing factors in multivariate prediction and enhancing the prediction effect [12,13,14]. For example, methods such as Support Vector Machine (SVM) [15], Extreme Learning Machines [16], Recurrent Neural Networks (RNNs) [17], LSTM [18,19] and other deep learning methods provide technical support for the accurate prediction of power load.
Despite the advantages of existing methods in multivariate forecasting, the above short-term power load forecasting methods have the following issues: (1) The extraction of time series features from power load data is inadequate; (2) There is a limitation of time duration; the power load forecasting in the spot market is for the next day, while the real-time spot market is for 4 h of the day. Moreover, the trend in power load at different hours within a day presents a large difference, making it difficult to balance the accuracy of forecasts for two different time periods; (3) Due to the close proximity of proxy electricity purchase spot trading to the electricity consumption time and the need to participate in spot market trading in a short period of time, the better the time performance, the more conducive it is to decision-making; therefore, time issues need to be considered.
In order to solve the above issues, we propose a model for Short-term power load Forecasting in spot trading of Proxy electricity purchase based on Feature optimization and Multiscale decomposition called SFPFMformer. In this study, the combination of multi-scale feature extraction and depthwise separable convolution, fused temporal localization coding, and random forest-based feature selection and optimization are unique innovations. These innovations are not only technically novel, but also significantly improve the accuracy and timeliness of short-term power load forecasting in practice.
The main contributions of our study can be summarized as follows:
(1) We screen out the factors that have a significant impact on short-term load forecasting using the random forest algorithm, and further optimize feature selection by calculating the importance score of the features.
(2) The load data features of different time dimensions are extracted by multi-time scale segmentation technology. The proposed method is able to capture both short-term fluctuations and long-term trends, thus achieving better prediction results on different timescales.
(3) A fusion time location coding is innovatively proposed. The global time coding and local position coding are combined to capture the global time information and local position information of power load sequence data at the same time.
(4) Deep separable convolution is innovatively introduced into the Transformer model, which effectively enhances the Transformer’s ability to capture local features of a time series. At the same time, the computational complexity is reduced, the efficiency of multiscale feature extraction is improved, and the accuracy and timeliness of the model in short-term power load forecasting are significantly enhanced.
(5) We conducted comparative experiments on real datasets. By comparing the Mean Square Error (MSE), Mean Absolute Error (MAE), and time performance, we verified the effectiveness of the proposed model.

2. Related Work

Power load forecasting methods mainly comprise traditional regression-based forecasting methods, machine learning-based methods, and deep learning-based methods. Bishnu et al. [20] conducted power load forecasting using an autoregressive integrated moving average model on the basis of clustering the data and achieved good results. Magalhaes et al. [21] proposed a short-term power load forecasting method based on optimized random forest and optimal feature selection, which can effectively perform load forecasting. Abumohsenet et al. [22] used LSTM, GRU, and RNN deep learning algorithms to accurately predict the power load to optimize power system performance, reduce operating costs, and achieve efficient resource allocation.
In recent years, some researchers have improved the accuracy and efficiency of load prediction by deep feature extraction of power load data. Xu et al. [23] combined a seasonal decomposition algorithm with manual feature engineering to extract the periodic and random characteristics of power load, thereby enhancing the accuracy of load forecasting and the scalability of the model. Ren et al. [24] conducted feature selection using the Maximum Information Coefficient and proposed a stacked ensemble learning method based on deep reinforcement learning and model fusion, which improved the accuracy of load forecasting.
Transformer and its improved algorithms have been used for load forecasting. Liu et al. [25] proposed a new time series forecasting model called iTransformer; by reversing the dimensions of the Transformer architecture, they improved the performance of load forecasting. Xue et al. [26] proposed a model called CARD, which improves the accuracy and robustness of time series predictions by introducing channel alignment attention and token mixing modules, as well as a new robust loss function. Zhang et al. [27] proposed a Transformer model named Crossformer, which leverages cross-dimensional dependencies for multivariate time series forecasting and effectively improves forecasting performance. Zhou et al. [28] proposed a model FEDformer combining a seasonal-trend decomposition method and a frequency-enhanced Transformer to improve the accuracy of time series prediction and reduce the computational cost.
Considering the multiscale features of data in load forecasting can improve prediction accuracy. Wang et al. [29] proposed the TimeMixer model to analyze the characteristics of time series in a multiscale hybrid perspective, and achieved excellent performance in long-term and short-term prediction tasks, including power datasets. Zhao et al. [30] extracted multiscale features by expanding convolution and fuse features with a residual structure to improve prediction accuracy. Ye et al. [31] put forward a hierarchical graph structure to be combined with extended convolution for capturing scale-specific correlations among time series.
However, existing methods still face limitations in extracting multiscale features and fusing time-local information from power load data, resulting in room for improvement in both prediction accuracy and computational efficiency. Therefore, this paper proposes an SFPFMformer model, which enhances the accuracy of short-term power load forecasting by integrating multi-timescale partitioning, fused time-local encoding, depthwise separable convolution, and Transformer.

3. Short-Term Power Load Forecasting Research Process and Principles

3.1. Proxy Electricity Purchase Study

3.1.1. Introduction to Proxy Electricity Purchase

Proxy electricity purchase refers to electricity sales companies in power market-oriented transactions as agents who can not directly participate in market transactions of the user to buy electricity. Electricity sales companies are engaged in medium- and long-term transactions and spot transactions to forecast the power load [32]. The purchase of electricity by electricity sales companies mainly includes medium-term and long-term market transactions and spot market transactions, which mainly comprise the following five steps:
(1) The electricity sales company conducts medium-term and long-term power load forecasts and obtains the results of power load forecasting before purchasing electricity on behalf of the company;
(2) The results of the medium-term and long-term power load forecasting are used to determine the more stable power demand in the medium-term and long-term future time periods and to purchase power through the medium-term and long-term market;
(3) Short-term electricity load forecasting is conducted close to the date of consumption and consists of a 24 h forecast for the day-ahead spot market and a 4 h forecast for the real-time spot market;
(4) Supplemental power is purchased through the spot market when the amount of power traded in the medium-term and long-term market does not meet the amount of power expected from short-term power load forecasting;
(5) An electricity-selling company sells the purchased electricity to purchasing customers and completes the purchasing process.

3.1.2. Short-Term Power Load Forecasting Process

In this study, short-term power load forecasting is carried out by considering the needs of different transaction durations in the proxy purchased power spot market [33]. In short-term power load forecasting, the process begins with selection of the influencing factors via the random forest algorithm. After that, the duration of the electricity load data to be predicted in the proxy electricity purchase spot trading is determined. Subsequently, the multiple timescale segmentation module in SFPFMformer is utilized to acquire power load data at different timescales. Then, the power load data features are extracted through the depthwise separable convolutional block. Finally, the power load data for the required duration is predicted.

3.2. Random Forest-Based Selecting of Power Load Influencing Factors

In the multivariable prediction of short-term power load, there are significant differences in the degree of influence of different characteristics on power load, such as meteorological parameters and time-related parameters. Thus, selection of suitable characteristic variables is crucial for improving the accuracy and efficiency of prediction [34]. Through effective feature selection methods, key factors that have a high correlation with power load and a significant impact on the prediction results can be screened out from numerous features. These key factors can reflect the variation law of the power load more accurately, enabling the prediction model to focus more on the core information and reduce interference by irrelevant factors at the same time.
However, due to the different action mechanisms and influence ranges of each feature, there are obvious differences in their weight distributions. In complex multivariate scenarios, traditional feature selection methods may have difficulty in comprehensively and accurately evaluating the importance of features. If the feature screening is not precise enough, irrelevant factors will not only increase the complexity of the model and prolong the calculation time, but may also reduce the prediction accuracy [35]. The random forest [36] algorithm has unique advantages in dealing with multivariate data and evaluating the importance of features. It can comprehensively consider the role of each feature in the model and provide a more scientific and accurate ranking of feature importance. Therefore, we consider adopting the random forest algorithm for feature selection.
In this research, we select the important factors that have an impact on the short-term power load forecast by using random forest to calculate the importance scores of the influencing factors, and calculate the importance scores of the influencing factors by disrupting the influencing factors. Finally, relevant features are selected by setting an importance threshold. The process of feature selection using random forest is shown in Figure 1.
As shown in Figure 1, for each influence factor P j in the influence factors P 1 , P 2 , ..., P d , assuming that the random forest contains decision trees, in the process of establishing the random forest through the self-sampling method of sampling, the set of power loads that are not sampled is O. Using each decision tree to predict the power load data in O and calculate the Mean Square Error (MSE) [37], the set of power loads after disrupting the actual corresponding values of the influence factors in O is O P j . Each decision tree is used again to predict the power load data in O P j and to calculate the Mean Squared Error (MSE). The larger the increase in the average MSE of all decision trees, the more important the influencing factors are, as shown in Equation (1):
V P j = 1 N T r e e i = 1 N T r e e { M S E ( O P j i ) M S E ( O i ) } .
where V P j is the importance score of the influencing factor P j , i is the decision tree counting index, M S E ( O P j i ) is the mean square error of predicting the load data of O P j by the i decision tree, and M S E ( O i ) is the mean square error of predicting the load data of O by the i decision tree. The s influencing factors selected by random forest as attributes of the power load are A 1 , A 2 , ..., A d , where A s is the influences ranked s in terms of the importance score.

3.3. SFPFMformer Model Structure

The i-th attribute sequence of length n + l 1 for the defined historical time period is shown in Equation (2), the attribute sequence of length n + l 1 is shown in Equation (3), and the sequence of the power load data is shown in Equation (4):
A 1 : n + l 1 i = { a 1 i , a 2 i , , a n + l 1 i }
A 1 : n + l 1 = { A 1 : n + l 1 1 , A 1 : n + l 1 2 , , A 1 : n + l 1 s }
Y 1 : n + l 1 = { y 1 , y 2 , , y n + l 1 }
where a j i denotes the attribute data, and the sequence of attributes and the sequence of power load data comprises the power load sequence as Z 1 : n + l 1 = { A 1 : n + l 1 , Y 1 : n + l 1 } , and y i is the power load data.
The SFPFMformer model architecture is shown in Figure 2, where the model contains a total of five parts: multiple timescale segmentation, input embedding, encoder, decoder, and output module. Additionally, the convolutional block that incorporates the depthwise separable convolution is positioned between the encoder’s multi-head attention mechanism and the feed-forward network.

3.3.1. Multiple Timescale Segmentation

Since the power load data change periodically and show different trends in different time periods, there are certain shortcomings in using standard time models such as LSTM and GRU for feature extraction [38]. These standard time models typically operate on a single timescale. Long time steps are required to capture long-term trends, which makes it easy to ignore short-term local details, and it is difficult to balance short-term local patterns and long-term trends. Moreover, the gating mechanism of these models is rather complex, leading to higher training costs.
Multi-time scale analysis can extract features at multiple resolutions, allowing the model to learn data at multiple levels, enhancing the accuracy and robustness of the prediction, and improving the overall performance of the model [39]. Therefore, this study obtains different scale data through multi-timescale segmentation, learns feature representations at different scales and abstraction levels, and captures the short-term and long-term dependencies of time series. Specifically, by setting sliding windows with different lengths and step sizes, the original time series is sampled at multiple scales, which further enhances the comprehensive performance ability of short-term prediction and long-term trend judgment of the model [
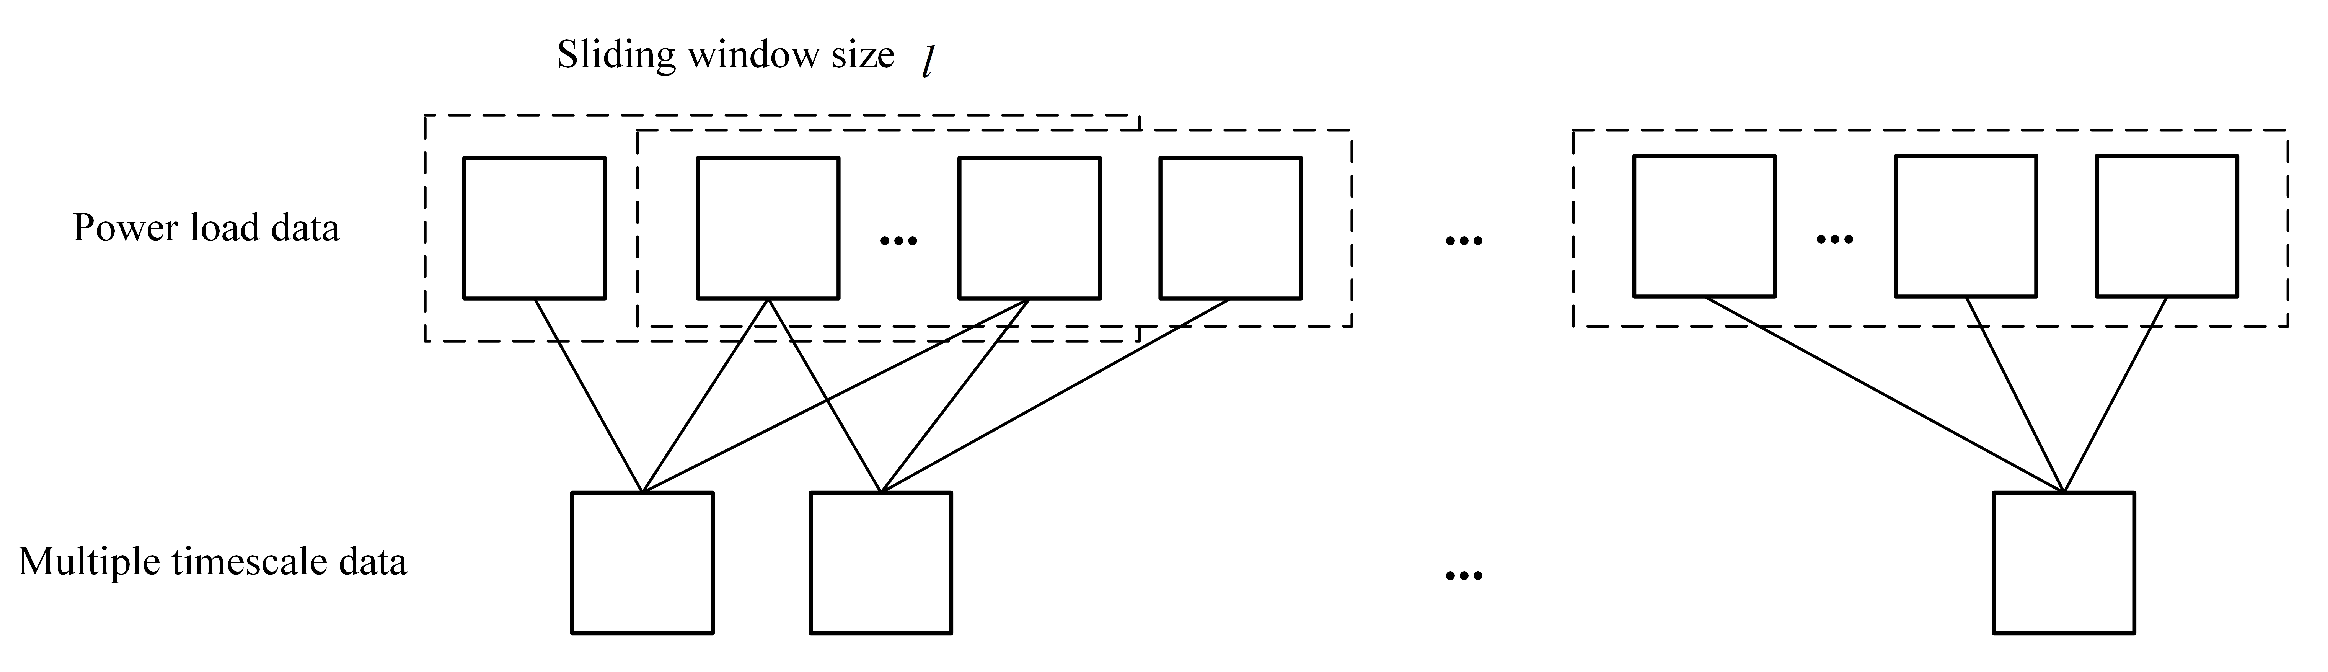
40]. The multi-timescale segmentation method proposed in this paper is shown in Figure 3.
As can be seen from Figure 3, the multiple timescale segmentation uses a sliding window to obtain the power load data for consecutive time periods, and the power load data within the window is averaged to obtain the multi-timescale data, which is calculated as shown in Equation (5):
y ˜ i = y i l + 1 + y i l + 2 + + y i l
where y i is the power load data, l is the window size, and l is the multi-timescale data obtained from the segmentation; the specific formula for multi-timescale data segmentation of Y 1 : n + l 1 is shown in Equation (6):
Y l : n + l 1 = M u l t i ( Y 1 : n + l 1 )
where M u l t i ( ) is the multiple timescale segmentation.
In this paper, two multi-timescale segmentation results are obtained, namely, medium timescale and high timescale. The window size l in the medium timescale stage is 4, and the window size l in the high timescale stage is 7. The medium timescale sequence of length n is shown in Equation (7):
Y l : n + l 1 m i d = { y ˜ l , y ˜ l + 1 , , y ˜ n + l 1 }
where Y l : n + l 1 m i d is the medium timescale sequence. The high timescale sequence of length n is shown in Equation (8):
Y l : n + l 1 h i g h = { y ˜ l , y ˜ l + 1 , , y ˜ n + l 1 }
In Equation (8), Y l : n + l 1 h i g h is the the high timescale sequence. Then, the multi-timescale segmentation of the power load data is carried out through the moving average method, as shown in Equation (9):
Z 1 : n + l 1 = { A 1 : n + l 1 , Y 1 : n + l 1 m i d , Y 1 : n + l 1 h i g h , Y 1 : n + l 1 }
where Z 1 : n + l 1 is the power load sequence obtained after multi-timescale segmentation.
The power load sequence is embedded as the input. At the encoder side, the input is a power load sequence of length n from the historical time period Z l : n + l 1 . At the decoder side, the input is a power load sequence of length n 2 from the historical time period Z n + l + 1 2 : n + l 1 .

3.3.2. Input Embedding

For the input embedding [41] of Z l : n + l 1 , the location and time information of the power load is obtained by fusion time localization encoding during the input embedding process. The fusion time localization encoding contains local position encoding and global time encoding to obtain the local position and global time information of the power load data, respectively. Local position encoding is used to help the model extract the relative positions between the power load data; the specific equations of local position coding for y i are shown in Equations (10) and (11):
P E ( y i , 2 j ) = s i n ( i 1000 2 j d m o d e l )
P E ( y i , 2 j + 1 ) = c o s ( i 1000 2 j d m o d e l )
where d m o d e l denotes the vector dimension, j denotes the dimension of the vector dimension, the local positional encoding uses s i n ( ) for even dimensions and c o s ( ) for odd dimensions, and the coded information of all the dimensions of y i makes up the local position coding of y i . The local position coding is relative position information which helps the model to extract local dependencies, but it is not possible to obtain the temporal information of the power load data to extract temporal correlations, so the global time encoding proposed in Informer [42] is introduced.
Global time encoding considers the actual time information of the power load data, and for the time corresponding to the power load data y i , extracts its exact time information. Assuming that the time corresponding to the power load data is “26 December 2017 11:30”, the number of days in the year before 26 December 2017, the number of days in the month before the 26 December, the number of days in the week before which the 26th is located, 11:00 and 30:00 are all extracted from the vector representation, and the vector representation is [359, 25, 1, 11, 30].
The power load data values, local position encoding and global time encoding in the power load sequence Z l : n + l 1 are converted into a vector fusion of dimension d m o d e l to be embedded into the encoder as shown in Equation (12):
X ( Z l : n + l 1 ) = D E ( Z l : n + l 1 ) + P E ( Z l : n + l 1 ) + G E ( Z l : n + l 1 )
where D E ( Z l : n + l 1 ) is the embedding value of the power load sequence Z l : n + l 1 , P E ( Z l : n + l 1 ) is the local position encoded embedding of the power load sequence Z l : n + l 1 , G E ( Z l : n + l 1 ) is the global time encoded embedding of the power load sequence Z l : n + l 1 , and X ( Z l : n + l 1 ) is the input embedding result of the power load sequence Z l : n + l 1 .

3.3.3. Encoder

(1) Multi-head attention mechanism
The results of the input embedding are fed to the encoder, which first performs the attention computation by means of the multi-head attention mechanism [43]. The dimension for d k , query Q, and key K, and the dimension for d v value V provide input to the attention mechanism. The dot product of the query and all keys is computed, dividing by d k for scaling, obtaining the weights of the values through the function, and multiplying by V, as shown in Equation (13).
A t t e n t i o n ( Q , K , V ) = S o f t m a x ( Q K T d k ) V
The multi-head attention mechanism projects the query Q, the key K, and the value V multiple times to d k , and the d k and d v dimensions, with different learned linear projections, respectively, where the number of heads is h, d k , and d v calculated as in Equation (14):
d k = d v = d m o d e l h
At each projection level of query, key, and value, the attention function is executed in parallel to generate d v dimensional output values, which are concatenated and projected again to obtain the final value. The specific formula for joining different levels of attention and projecting them again is shown in Equation (15):
M u l t i H e a d ( Q , K , V ) = C o n c a t ( h e a d 1 , h e a d 2 , , h e a d h ) W O
where h e a d i = A t t e n t i o n ( Q W i Q , K W i K , Q V i V ) , W i Q R d m o d e l  ×  d k , W i K R d m o d e l  ×  d k and W i V R d m o d e l  ×  d v are the learning parameters of the ith head, C o n c a t ( ) is the connection, W O R h d v  ×  d m o d e l is the learnable parameter in the projection of the connection, and M u t i l H e a d ( ) is the computation of the multi-head attention.
(2) Residuals and layer normalization
After completing the computation of the multiple attention, residual and layer normalization [44] is carried out. To achieve the residual, the input and output of the previous layer are summed. Then, layer normalization is performed on the residual results. The specific formula for residual and layer normalization is shown in Equation (16),
X a t t e n t i o n = L a y e r N o r m ( X ( Z l : n + l 1 ) + S L ( X ( Z l : n + l 1 ) ) ) .
where X ( Z l : n + l 1 ) is the input of the layer before residual and layer normalization, S L ( X ( Z l : n + l 1 ) is the output of the layer before residual and layer normalization, L a y e r N o r m ( ) denotes layer normalization, and X a t t e n t i o n R n × d m o d e l is the output of the completed attention computation with residual and layer normalization.
(3) Depthwise separable convolutional block
Convolutional neural networks have efficient feature extraction ability and can be used for power load time series feature extraction [
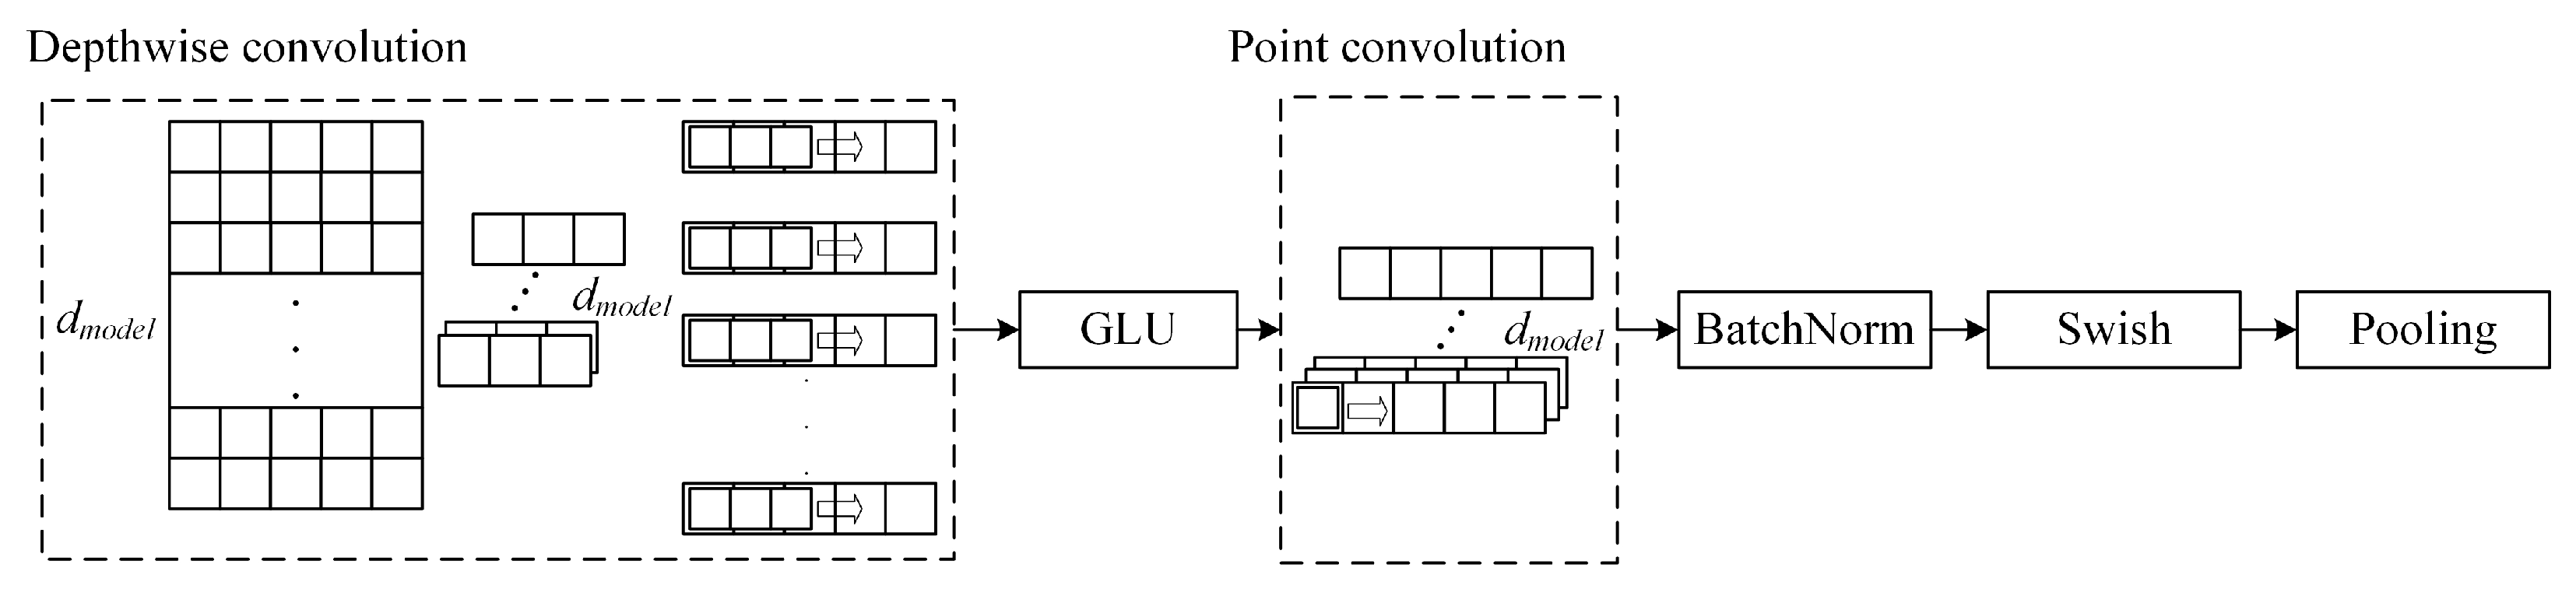
45]. Depthwise separable convolution is a kind of convolutional neural network, containing a depthwise convolutional layer for depth extraction and a pointwise convolutional layer for point extraction, which can be extracted in the direction of the channel and the point of the power load time series features. Deep convolution performs convolution operations on each input channel separately and is able to effectively capture local temporal dependencies. Pointwise convolutions (1 × 1 convolutions) perform feature mixing on the channel dimension and are able to fuse features from different channels to capture more complex feature combinations.
In this paper, we construct a convolutional block containing depthwise separable convolution, which mainly contains depthwise convolution, GLU activation, pointwise convolution, BatchNorm, Swish activation, and pooling, and the structure of the depthwise separable convolutional block is shown in Figure 4.
As can be seen from Figure 4, in the depthwise separable convolution block, the deep features are first extracted through the depthwise convolution in the channel direction by the convolution operation; that is, each dimension of the data is convolved separately, and its specific formula is shown in Equation (17):
X d e e p c o v = D e e p C o v ( p e r m u t e ( X a t t e n t i o n ) ) .
where X a t t e n t i o n R n × d m o d e l is the output after attention computation and residual and layer normalization, p e r m u t e ( X a t t e n t i o n ) is the transposition of X a t t e n t i o n , D e e p C o v ( ) is the channel-by-channel convolution computation, and X d e e p c o v R d m o d e l × n is the output after depthwise convolution.
The activation is performed with the G L U function, which has a gate mechanism that helps the network to better capture long-term dependencies in the sequence data; the specific formula for the G L U function is shown in Equation (18):
X G L U = G L U ( X a t t e n t i o n ) = A s i g m o i d ( B ) .
where X d e e p c o v R d m o d e l  ×  n is the input, A R d m o d e l  ×  n 2 and B R d m o d e l  ×  n 2 are the two parts of X d e e p c o v split evenly, s i g m o i d ( B ) represents the sigmoid activation of B, ⨂ is the Hadamard product operation, and X d e e p c o v R d m o d e l  ×  n 2 is the output of GLU activation.
After the deep features are extracted and activated, a one-dimensional convolution with a convolution kernel size of 1 is used to perform a point-by-point operation in the point direction, which is given by Equation (19):
X w i s e c o v = W i s e C o v ( X G L U ) .
In Equation (19), X w i s e c o v R d m o d e l  ×  n 2 is the output after point-by-point convolution, and the W i s e C o v ( X G L U ) means pointwise convolution on X G L U .
Using BatchNorm to normalize X w i s e c o v to avoid gradient explosion, BatchNorm is normalized on a batch basis. Taking x i in one of the batches as an example, the specific formula of BatchNorm normalized on x i is shown in Equation (20):
x i = x i μ τ σ τ 2 + ε γ + β .
where μ τ is the batch mean, σ τ is the standard deviation, ε is the value that avoids 0 in the denominator, γ and β are the affine change indices, and the output after BatchNorm is X B a t c h N o r m R d m o d e l  ×  n 2 .
The S w i s h activation is used for gradient smoothing to avoid jumping output values. The function of S w i s h activation is shown in Equation (30):
X s w i s h = f ( X B a t c h N o r m ) = X B a t c h N o r m s i g m o i d ( X B a t c h N o r m ) .
In Equation (30), X s w i s h R d m o d e l  ×  n 2 is the output of X B a t c h N o r m R d m o d e l  ×  n 2 after Swish activation. Finally, the pooling layer is used to compress the extracted features and generate more important feature information to improve the generalization ability, and the depthwise separable convolutional block output X D S C R d m o d e l  ×  n 4 .
Assume that in the power load data, the sequence length is T, the number of input channels is C in , the number of output channels is C out , and the convolution kernel size is K. In time-series feature extraction, the time complexity of standard convolution is represented in Equation (22):
O standard = T · C in · C out · K
where O standard is the complexity of the traditional convolution. Each convolution operation requires traversing both the kernel size K and sequence length T.
The time complexity of depthwise convolution and pointwise convolution is calculated in the following way:
O depthwise = T · C in · K
O pointwise = T · C in · C out
where O depthwise is the complexity of the depthwise convolution, O pointwise is the complexity of the pointwise convolution. The total time complexity of depthwise separable convolution is represented in Equation (25):
O sep = O depthwise + O pointwise = T · C in · ( K + C out )
where O sep is the total time complexity of the depthwise separable convolution. When C and K are large, the time complexity of traditional convolution is significantly higher than that of depth-separable convolution. Therefore, depthwise separable convolution has obvious advantages in time efficiency, which can reduce the computational load and accelerate the training and inference speed of the model.
(4) Feed-forward network
Each encoder and decoder contains a fully connected feed-forward network, which consists of two linear transformations with different parameters and a R e L U activation in the middle [46]. The specific formula for the output of the depthwise separable convolutional block to be computed by the feed-forward network is shown in Equation (26):
F F N ( X D S C ) = m a x ( 0 , X D S C W 1 + b 1 ) W 2 + b 2 .
where X D S C R d m o d e l  ×  n 4 is the output of the depthwise separable convolutional block, W 1 and W 2 are the weights of the feed-forward network, and b 1 and b 2 are the biases.

3.3.4. Decoder and Output

The decoder contains three sub-layers, the masked multi-head attention layer, the multi-head attention layer, and the feed-forward network layer. Similar to the encoder, residual connections are used around each sub-layer followed by. layer normalization, The key divergence in the decoder is the masked multi-head attention mechanism, which masks the true value of the power load data to ensure that the prediction for the current time can only be dependent on power loads prior to the current time [47]. The feature vector output from the decoder is linearized to output the final power load data prediction y n + l , y n + l + 1 , ..., y 2 n + l 1 .

4. Experimental Results and Analysis

4.1. Experimental Setup

4.1.1. Experimental Environment

The experimental environment is the Windows 11 system, with 8G RAM, Intel(R) Xeon(R) CPU @ 2.30 GHz, and the algorithm is implemented using PyTorch 1.11.0 framework and Python 3.7.

4.1.2. Datasets

(1) Dataset I is the power dataset for the Tetouan region in the UCI Machine Learning Repository [48], which has a sampling frequency of 10 min. In this paper, we use time, temperature, humidity, wind speed, general diffuse flow, diffusive flow, and region 1 power load data for a total of 4320 data points from 1 December 2017 0:00 to 30 December 2017 23:50.
(2) Dataset II comprises data relating to the 2016 national electrician mathematical modeling contest (https://xs.xauat.edu.cn/info/1208/2122.htm), accessed on 4 January 2025. A question in the power load forecasting using datasets involves a sampling frequency of 15 min. In this paper, region 2 is selected from 1 December 2014 0:00 to 31 December 2014 23:45, with a total of 2976 records.
The datasets of the training dataset and testing dataset are split according to a ratio of 8:2 for training and evaluating our model. On dataset I, the time range for the training set is 1 December 2017 0:00 to 24 December 2017 5:50, and the time range for the test set is 24 December 2017 6:00 to 30 December 2017 23:50. For dataset II, the load data in the range of 1 December 2014 0:00 to 25 December 2014 9:00 are selected as the training set, and the load data in the range of 25 December 2014 9:15 to 31 December 2014 23:45 are selected as the test set.
In order to better understand the characteristics of the measured time series, we provide the time series plots of the training sets in the two datasets in Figure 5.
From Figure 5a,b, we can see that the power load of the two datasets shows obvious periodic fluctuations, with daily periodicity characteristics, and the load values change significantly in different time periods, reflecting the regularity of daily electricity demand. This periodicity helps the model to capture and learn latent patterns in the data.

4.1.3. Evaluation Indicators

This paper evaluates the accuracy and timeliness of the model in predicting power load data. Although R 2 indicates a good data fit, it cannot accurately reflect the predictive performance of time series tasks. The Mean Square Error (MSE) [37] and Mean Absolute Error (MAE) [49] are more general and amenable to calculation. MAPE presents errors as percentages, which is convenient for comparing data of different magnitudes, while RMSE [37] can highlight large deviations and maintain consistent dimensions. Therefore, we choose RMSE, MAE, and RMSE to evaluate the accuracy of the prediction. The calculation methods of these indicators are shown in Equations (27)–(21):
MSE = 1 n i = 1 n ( y i y i ) 2 ,
MAE = 1 n i = 1 n | y i y i | ,
RMSE = 1 n i = 1 n ( y i y i ) 2
MAPE = 1 n i = 1 n y i y i y i × 100 %
where y i are the real power load data, y i are the predicted power load data, and n is the predicted data length. The training time and testing time of the model are used to evaluate the temporal performance of the model.

4.1.4. Model Hyperparameters

In this paper, the hyperparameters of the model are tuned for predicting the power load data, and the parameters that make the model predict better are selected. The number of training generations is 10, the optimizer selected is the Adam optimizer, the number of batches is 32, the number of encoders is 2, the number of decoders is 1, and the learning rate is 0.0001. In addition, this research carried out load forecasting mainly in a rolling fashion for 4 h and 24 h window lengths, with the model forecasting for each time point included in the different forecast lengths.

4.2. Attributes Selected Experiments

Before forecasting the power load data, this paper uses random forest to calculate the importance scores of each attribute in dataset I and selects the attributes with higher importance scores. Random forest calculates the importance scores of five attributes including temperature, humidity, wind speed, general diffuse flow, and diffuse flow, and the results of the importance scores are shown in Figure 6.
As can be seen from Figure 6, the importance scores of each attribute on power load forecasting are different, and the higher the importance score of the attributes, the greater the impact on power load data forecasting. We select the three attributes that have an importance score greater than 0.15 for short-term power load forecasting.

4.2.1. Attributes Accuracy Experiments

We examine the effect of random forest selection on the accuracy of period power load forecasts by comparing the accuracy of power load forecasts in dataset I. The short-term power load forecasts obtained from the model using full attributes versus random forest selected attributes are shown in Table 1.
As shown in Table 1: (1) The MSE and MAE values for 4 h power load data prediction with full attributes are 0.0567 and 0.1741, respectively, and the MSE and MAE values for 24 h power load data prediction are 0.0374 and 0.1510, respectively; (2) The MSE and MAE values of the 4 h power load data predicted by random forest selection were 0.0427 and 0.1462, respectively, and the MSE and MAE values of the 24 h power load data predicted were 0.0353 and 0.1458, respectively; (3) Compared with the prediction of 4 h power load data using all attributes, the MSE and MAE values using the method after random forest selection decreased by 24.69% and 16.03%, respectively, and the MSE and MAE values of 24 h power load data decreased by 5.62% and 3.44%, respectively.
These results indicate that the accuracy of short-term power load prediction using random forest-selected attributes is better than that using all attributes to predict short-term power load data.

4.2.2. Attributes with Time Performance Experiments

We examine the effect of random forest attribute selection on the temporal performance of short-term electricity load forecasting by comparing the times taken for electricity load forecasting. Table 2 shows a comparison of the temporal performance of electricity load forecasting when the model uses all attributes and the attributes are selected by random forest.
As shown in Table 2, the following findings regarding the training and testing times of power load data are presented:
(1) When dealing with the 4 h power load data with full attributes, the training time was 380.9568 s, while the testing time was 4.2611 milliseconds. For the 24 h power load data using the selected attributes, the training and testing times were 1329.1508 s and 14.7601 milliseconds, respectively.
(2) In the case of using random forest-selected attributes for the 4 h power load data, the training and testing times were 364.5474 s and 3.9848 milliseconds, respectively. For the 24 h power load data, the corresponding training and testing times remained the same as those using the selected attributes, i.e., 1329.1508 s and 14.7601 milliseconds.
(3) Comparing the use of full attributes, the training and testing times for the 4 h power load data were reduced by 4.31% and 6.48%, respectively. Similarly, for the 24 h power load data, the training and testing times were reduced by 3.89% and 3.44%, respectively.
These results further demonstrate that the efficiency of the model can be enhanced when random forest selection properties are used in power load forecasting

4.3. Comparison Experiments on Dataset I

On dataset I, the SFPFMformer model proposed in this paper was compared with Transformer [50], Informer [42], Autoformer [51], ETSformer [52], Seq2seq [53], and LSTM [19] for short-term power load forecasting.

4.3.1. Comparison of Power Load Forecasting Accuracy

In order to better understand the absolute prediction accuracy of the model, different from the normalized values mentioned above, this study conducted experiments based on the power load values of the original scale. The obtained MAPE, MAE, and RMSE results are shown in the following Table 3.
As shown in Table 3, (1) in terms of 4 h forecasting, the RMSE value of SFPFMformer for forecasting electricity load data is 1128.69, which is 20.53%, 12.57%, 78.17%, 42.17%, 38.42%, and 29.40% lower compared to Transformer, Informer, Autoformer, ETSformer, Seq2seq, and LSTM, respectively, and the MAE value is 803.91, which is 23.34%, 17.07%, 78.51%, 45.89%, 39.44%, and 30.00% lower compared to Transformer, Informer, Autoformer, ETSformer, Seq2seq, and LSTM, respectively. In addition, the MAPE of the method proposed in this paper is 2.63%, which is the lowest among all the methods.
(2) For 24 h forecasting, the RMSE value of SFPFMformer for forecasting power load data is 1190.51, which is 41.26%, 39.75%, 48.89%, 42.95%, 25.54%, and 24.87% lower compared to Transformer, Informer, Autoformer, ETSformer, Seq2seq, and LSTM, respectively, and the MAE value is 897.26, which is 43.86%, 41.48%, 51.92%, 47.93%, 24.86%, and 24.75% lower compared to Transformer, Informer, Autoformer, ETSformer, Seq2seq, and LSTM, respectively. Similarly, the proposed method has the lowest MAPE of 2.97% among all the methods.
The MSE and MAE values of SFPFMformer for predicting the 4 h and 24 h power load data are lower than those of Transformer, Informer, Autoformer, ETSformer, Seq2seq, and LSTM for predicting power load data, and the accuracy is optimal.

4.3.2. Comparison of Power Load Forecasting Time Performance

The time performance of power load data prediction using different methods is shown in Table 4, which shows the training time and test time of each method for 4 h and 24 h load prediction.
From Table 4, we can draw the following conclusions: (1) In terms of 4 h forecasting, the training time of SFPFMformer is 364.5474 s, which is 33.62%, 29.13%, 60.69%, 22.36%, 14.10%, and 3.68% lower compared to Transformer, Informer, Autoformer, ETSformer, Seq2seq, and LSTM, respectively, and the testing time is 3.9848 ms, which is 19.35%, 27.14%, 66.61%, 90.09%, 11.39%, and 8.85% lower compared to Transformer, Informer, Autoformer, ETSformer, Seq2seq, and LSTM, respectively.
(2) For 24 h forecasting, the training time of SFPFMformer is 1277.4766 s, which is 26.48%, 22.46%, 57.94%, 17.41%, 4.53%, and 5.16% lower compared to Transformer, Informer, Autoformer, ETSformer, Seq2seq, and LSTM, respectively, and the testing time is 14.2520 ms, which is 21.85%, 27.49%, 69.07%, 79.09%, 27.00%, and 16.26% lower compared to Transformer, Informer, Autoformer, ETSformer, Seq2seq, and LSTM, respectively.
The training time and testing time of SFPFMformer in terms of 4 h and 24 h forecasting are less than the training time and testing time of Transformer, Informer, Autoformer, ETSformer, Seq2seq, and LSTM, which are optimal in terms of time performance.

4.4. Comparison Experiments on Dataset II

Experiments are carried out on dataset II and compared with other methods, which verify the applicability of the proposed method in domestic power load forecasting and can be used in power purchasing business. The MAS and MSE of short-term power load forecasting on dataset II by different methods are shown in Table 5, and the time performance of short-term power load forecasting by different methods is shown in Table 6.
From Table 5, conclusions can be drawn that: (1) In terms of 4 h forecasting, the RMSE value of SFPFMformer for forecasting power load data is 273.26, which is 10.22%, 67.36%, 41.79%, 19.74%, and 2.69% lower compared to Transformer, Autoformer, ETSformer, Seq2seq, and LSTM, respectively; the MAE value is 188.39, which is 12.89%, 68.33%, 48.03%, 11.57%, and 11.08% lower compared to Transformer, Autoformer, ETSformer, Seq2seq, and LSTM respectively. In addition, the MAPE of the proposed method is 2.75%, which is the second best among all the methods.
(2) For 24 h forecasting, the RMSE value of SFPFMformer for forecasting power load data is 292.37, which is 4.32%, 39.19%, 57.97%, 22.55%, and 20.98% lower compared to Transformer, Informer, Autoformer, ETSformer, and Seq2seq respectively, and the MAE value is 221.82, which is 4.31%, 38.87%, 58.46%, 52.23%, 18.06%, and 4.75% lower compared to Transformer, Informer, Autoformer, ETSformer, Seq2seq, and LSTM, respectively. The MAPE is 3.76%, which is the smallest among all the methods.
From Table 6, we can see that: (1) For 4 h prediction, the training time of SFPFMformer is 193.1914 s, which is 22.67%, 28.82%, 63.09%, 2.58%, 0.72%, and 1.67% lower compared to Transformer, Informer, Autoformer, ETSformer, Seq2seq, and LSTM, respectively; the testing time is 3.1729 ms, which is 0.75%, 29.11%, 66.51%, 89.28%, 47.26%, and 35.33% lower compared to Transformer, Informer, Autoformer, ETSformer, Seq2seq, and LSTM, respectively; (2) In the 24 h prediction scenario, the training time of SFPFMformer is 590.4930 s, which is 26.70%, 28.64%, 59.24%, 12.72%, 9.57%, and 5.92% shorter than that of Transformer, Informer, Autoformer, ETSformer, Seq2seq, and LSTM, respectively. The testing time is 9.6516 milliseconds, which is 21.09%, 34.26%, 69.96%, 79.57%, 23.62%, and 16.83% shorter than that of the above-mentioned models, respectively.
The SFPFMformer demonstrates remarkable efficacy in short-term power load forecasting on the domestic power load dataset, outperforming other comparative methods. This outcome indicates that the SFPFMformer is well suited for short-term power load forecasting within the domestic proxy power purchase business.

4.5. Ablation Experiments

In this paper, ablation experiments were conducted on dataset I to verify the role of each module in the prediction. The ablation experiments were conducted on dataset I to compare the results of the original model and those after the removal of different modules. The multi-time-scale segmentation of the model was denoted as SFPFformer, the local location code of the model was denoted as SFPFMLformer, and the global time code of the model was denoted as SFPFMGformer. The removed model depth separable convolution block is denoted as SFPFMDformer.

4.5.1. Experiments on the Accuracy of the Ablation Model

In this study, different modules of the power load data prediction model were removed to test the effect of each module on the forecasting accuracy of the power load data of the model. Table 7 shows the RMSE and MAE values of the ablation experiment under the 4 h and 24 h power load prediction scenarios.
As shown in Table 7, we can draw conclusions that: (1) In the scenario of 4 h power load prediction, compared with the SFPFformer, SFPFMLformer, SFPFMGformer, and SFPFMDformer methods, the MAE of the model proposed in our study decreased by 5%, 18.23%, 12.93%, and 14.51%, respectively, and the RMSE decreased by 6.15%, 26.76%, 16.44%, and 10.54%, respectively. Considering both MAE and RMSE, our method achieved the best results; (2) When making a 24 h forecast, compared with the other several methods, the MAE decreased by 2.53%, 13.33%, 18.81%, and 20.29%, respectively, and the RMSE decreased by 2.96%, 5.64%, 9.06%, and 20.00%, respectively. Similarly, our method achieved the best results.
The above experimental results prove the effectiveness of each module in the model of this paper in improving the model’s prediction performance, demonstrating the superiority of the method proposed in this paper.

4.5.2. Experiments on the Time Performance of the Ablation Model

The effect of each module on the temporal performance of SFPFMformer for predicting power load data is detected by removing different modules of the model for predicting power load data; the temporal performance of the ablation model for predicting power load data is shown in Table 8. Table 8 demonstrates the training time and testing time of this SFPFMformer with the ablation model for 4 h and 24 h power load data.
As shown in Table 8, we can draw conclusions that: (1) After removing the multi-timescale division, the training time of the model for 4 h power load data is reduced by 0.22%, and the training time and testing time for 24 h power load data are reduced by 0.56% and 0.26%, respectively. After ablating the global time encoding and the local positional encoding, the difference between the training time and testing time of the model and the method of this paper for the 4 h power load data is smaller, which indicates that the multiple timescale division and fusion time localization encoding do not cause a more serious time burden; (2) When the deeply separable volume blocks are removed, the time taken for the model to train and test on 4 h power load data rises by 23.24% and 25.31% respectively. Similarly, for 24 h power load data, the increase in training and testing times is 34.36% and 36.73%, respectively. Although incorporating the deep separable volume block lengthens the computational time initially, this block effectively extracts representative features. As a result, it lessens the computational burden during the model’s subsequent processing. The trade-off between these two factors reveals that after adding the deep separable volume block, overall time consumption is reduced. Moreover, this time-performance advantage is even more pronounced when dealing with 24 h power load data.

4.6. Effectiveness Illustration for Short-Term Power Load Forecasting

Power load forecasting is performed for 4 h and 24 h corresponding to the length of real-time spot market transactions and day-ahead spot market transactions in proxy power purchase to demonstrate the prediction effect of SFPFMformer.
The effect of SFPFMformer in forecasting 4 h power load data within 0:00–3:59 on 25 December 2017 in dataset I is shown in Figure 7a, and the effect of forecasting 24 h power load data within 0:00–23:59 on 25 December 2017 is shown in Figure 7b. Figure 8a presents the performance of SFPFMformer in forecasting 4 h power load data within 0:00–3:59 on 26 December 2014 in dataset II, and Figure 8b shows its performance in forecasting the 24 h power load data within 0:00–23:59 on 26 December 2014.
As can be seen from Figure 7 and Figure 8, the method used in this paper predicts the 4 h and 24 h power load data on dataset I and dataset II to be closer to the actual power load data with better prediction effect, which can provide a reference for the power transaction between the real-time spot market and the day-ahead spot market in the proxy electricity purchase.

4.7. Discussion

Through experiments on two datasets, we verified the performance of the model in this paper. To analyze and discuss these results more comprehensively, we need to consider the advantages and limitations of the model and how it compares with other methods.
(1) In this study, the random forest algorithm was used for feature selection, which significantly improved the prediction accuracy and reduced the computational complexity. Experimental results show that the prediction performance of the model is improved after using random forest selection.
(2) Through multi-timescale analysis, the model can deal with both long-term and short-term dependencies. At the same time, the fusion of depthwise separable convolutional blocks and temporal position coding further enhances the feature extraction ability of the model, thereby improving the prediction effect of the model.
(3) In order to verify the function of each part of the model, the function of each module proposed in this paper is verified by ablation experiments. Through analysis of the experimental results, it can be verified that each module of the proposed method has a corresponding effect, and deleting the corresponding module will affect the performance of the model.
(4) The model proposed in this study still has some limitations. First, multi-timescale segmentation and depthwise separable convolutional blocks can lead to growth in the training time of the model when dealing with large-scale datasets. Future research can explore more efficient feature extraction methods to further reduce computational complexity.

5. Conclusions and Future Work

In order to meet the demand of power broker purchasing power in the spot market, this study proposed the SFPFMformer model for short-term power load forecasting. The factors that have a significant impact on short-term load forecasting are screened out by the random forest algorithm. Multi-time-scale segmentation technology is used to achieve the collaborative modeling of the long-term trend and short-term fluctuation in power load data. In addition, the depthwise separable convolutional block and fusion coding technology are introduced to further enhance the feature extraction ability of the model. The experimental results show that compared with existing methods, the proposed model shows obvious advantages in prediction accuracy and time efficiency, which is of great significance for realizing the goal of proxy power purchase in the spot market.
However, the method proposed in this paper has limitations for processing large-scale datasets due to the model’s high computational complexity. Therefore, future research will focus on optimizing the model architecture and exploring more efficient training algorithms, which includes investigating lightweight prediction models and utilizing parallel computing techniques to improve time performance.

Author Contributions

Conceptualization, C.Q.; methodology, C.Q.; data curation, Y.F.; writing Original draft, Y.F.; software, Y.F.; reviewing and editing, J.W., X.M. and P.Y.; supervision, P.Y. All authors have read and agreed to the published version of the manuscript.

Funding

This work is supported by Jiangsu Province Postgraduate Practice and Innovation Program (No. SJCX23-0203).

Data Availability Statement

This paper uses public datasets. The original data presented in the study are openly available. Dataset I is the power dataset of the Tetouan region in the UCI machine learning repository. Dataset II comprises data relating to the 2016 national electrician mathematical modeling contest (https://xs.xauat.edu.cn/info/1208/2122.htm).

Conflicts of Interest

The authors declare that there are no conflict of interest.

References

  1. Wang, J.; Xue, Y.; Sun, B.; Ma, R.; Chen, S. Design of Market Load Control Mechanism for New Power System. J. Phys. Conf. Ser. 2023, 2598, 012004. [Google Scholar] [CrossRef]
  2. Hu, Y.; Han, L.; Zhang, J.; Yu, J.; Shi, H.; Xu, N.; Cui, F.; Luo, G. A Model for Regional Grid-Agent Power Purchase Business in China Electricity Grid. In Proceedings of the 2023 4th International Conference on Management Science and Engineering Management (ICMSEM 2023), Nanchang, China, 2–4 June 2023; Atlantis Press: Paris, France, 2023; pp. 987–1002. [Google Scholar]
  3. Wu, Y.; Wu, J.; De, G. Research on Trading Optimization Model of Virtual Power Plant in Medium- and Long-Term Market. Energies 2022, 15, 759. [Google Scholar] [CrossRef]
  4. Wang, H.; Cai, X.; Lu, X.; Yang, Z.; Dong, J.; Ma, Y.; Yang, J. A novel load-side settlement mechanism based on carbon emission flow in electricity spot market. Energy Rep. 2023, 9, 1057–1065. [Google Scholar] [CrossRef]
  5. Mei, S.; Tan, Q.; Trivedi, A.; Srinivasan, D. A two-step optimization model for virtual power plant participating in spot market based on energy storage power distribution considering comprehensive forecasting error of renewable energy output. Appl. Energy 2024, 376, 124234. [Google Scholar] [CrossRef]
  6. Wang, L.; Wei, M.; Yang, H.; Li, J.; Li, S.; Fei, Y. Optimization Model of Electricity Spot Market Considering Pumped Storage in China. J. Phys. Conf. Ser. 2022, 2401, 012041. [Google Scholar] [CrossRef]
  7. Maitra, B. Univariate forecasting of Indian exchange rates: A comparison. Int. J. Comput. Econ. Econom. 2015, 5, 272–288. [Google Scholar] [CrossRef]
  8. Davidescu, A.A.; Apostu, S.A.; Paul, A. Comparative Analysis of Different Univariate Forecasting Methods in Modelling and Predicting the Romanian Unemployment Rate for the Period 2021–2022. Entropy 2021, 23, 325. [Google Scholar] [CrossRef]
  9. Yu, H.; Li, T.; Yu, W.; Li, J.; Huang, Y.; Wang, L.; Liu, A. Regularized graph structure learning with semantic knowledge for multi-variates time-series forecasting. In Proceedings of the 31st International Joint Conference on Artificial Intelligence, Vienna, Austria, 23–29 July 2022; pp. 2362–2368. [Google Scholar]
  10. Wang, H.; Peng, J.; Huang, F.; Wang, J.; Chen, J.; Xiao, Y. Multi-scale local and global context modeling for long-term series forecasting. In Proceedings of the International Conference on Learning Representations, Kigali, Rwanda, 1–5 May 2023. [Google Scholar]
  11. Hou, M.; Liu, Z.; Sa, G.; Wang, Y.; Sun, J.; Li, Z.; Tan, J. Parallel Multi-Scale Dynamic Graph Neural Network for Multivariate Time Series Forecasting. In Proceedings of the BPRA International Conference on Pattern Recognition, Nashville, TN, USA, 11–15 June 2025. [Google Scholar]
  12. Shrivastava, D.R.; Siddiqui, S.A.; Verma, K.; Singh, S.; Alotaibi, M.A.; Malik, H.; Nassar, M.E. A novel synchronized data-driven composite scheme to enhance photovoltaic (pv) integrated power system grid stability. Energy Rep. 2024, 11, 895–907. [Google Scholar] [CrossRef]
  13. Uyanik, T.; Bakar, N.N.A.; Kalenderli, Ö.; Arslanoǧlu, Y.; Guerrero, J.M.; Lashab, A. A Data-Driven Approach for Generator Load Prediction in Shipboard Microgrid: The Chemical Tanker Case Study. Energies 2023, 16, 5092. [Google Scholar] [CrossRef]
  14. Alrashidi, A.; Qamar, A.M. Data-Driven Load Forecasting Using Machine Learning and Meteorological Data. Comput. Syst. Sci. Eng. 2023, 44, 1973–1988. [Google Scholar] [CrossRef]
  15. Madhur, C.; Sheifali, G.; Mamatha, S. Short-Term Electric Load Forecasting Using Support Vector Machines. Electrochem. Soc. Trans. 2022, 107, 9731. [Google Scholar]
  16. Zou, H.; Yang, Q.; Chen, J.; Chai, Y. Short-term Power Load Forecasting Based on Phase Space Reconstruction and EMD-ELM. J. Electr. Eng. Technol. 2023, 18, 3349–3359. [Google Scholar] [CrossRef]
  17. Rahman, A.; Srikumar, V.; Smith, A.D. Predicting electricity consumption for commercial and residential buildings using deep recurrent neural networks. Appl. Energy 2018, 212, 372–385. [Google Scholar] [CrossRef]
  18. Huang, S.; Shen, J.; Lv, Q.; Zhou, Q.; Yong, B. A Novel NODE Approach Combined with LSTM for Short-Term Electricity Load Forecasting. Future Internet 2022, 15, 22. [Google Scholar] [CrossRef]
  19. Xu, C.; Li, C.; Zhou, X. Interpretable LSTM Based on Mixture Attention Mechanism for Multi-Step Residential Load Forecasting. Electronics 2022, 11, 2189. [Google Scholar] [CrossRef]
  20. Nepal, B.; Yamaha, M.; Yokoe, A.; Yamaji, T. Electricity load forecasting using clustering and ARIMA model for energy management in buildings. Jpn. Archit. Rev. 2020, 3, 62–76. [Google Scholar] [CrossRef]
  21. Magalhaes, B.; Bento, P.; Pombo, J.; do Rosario Calado, M.; Mariano, S. Short-Term Load Forecasting Based on Optimized Random Forest and Optimal Feature Selection. Energies 2024, 17, 1926. [Google Scholar] [CrossRef]
  22. Abumohsen, M.; Owda, A.Y.; Owda, M. Electrical Load Forecasting Using LSTM, GRU, and RNN Algorithms. Energies 2023, 16, 2283. [Google Scholar] [CrossRef]
  23. Xu, H.; Hu, F.; Liang, X.; Zhao, G.; Abugunmi, M. A Framework for Electricity Load Forecasting Based on Attention Mechanism Time Series Depthwise Separable Convolutional Neural Network. Energy 2024, 299, 131258. [Google Scholar] [CrossRef]
  24. Ren, X.; Tian, X.; Wang, K.; Yang, S.; Chen, W.; Wang, J. Enhanced Load Forecasting for Distributed Multi-Energy System: A Stacking Ensemble Learning Method with Deep Reinforcement Learning and Model Fusion. Energy 2025, 319, 135031. [Google Scholar] [CrossRef]
  25. Liu, Y.; Hu, T.; Zhang, H.; Wu, H.; Wang, S.; Ma, L.; Long, M. Itransformer: Inverted Transformers Are Effective for Time Series Forecasting. In Proceedings of the International Conference on Learning Representations, Vienna, Austria, 7–11 May 2024. [Google Scholar]
  26. Wang, X.; Zhou, T.; Wen, Q.; Gao, J.; Ding, B.; Jin, R. CARD: Channel Aligned Robust Blend Transformer for Time Series Forecasting. Comput. Res. Repos. 2024, 2305, 12095. [Google Scholar]
  27. Zhang, Y.; Yan, J. Crossformer: Transformer Utilizing Cross-Dimension Dependency for Multivariate Time Series Forecasting. In Proceedings of the International Conference on Learning Representations, Kigali, Rwanda, 1–5 May 2023. [Google Scholar]
  28. Zhou, T.; Ma, Z.; Wen, Q.; Wang, X.; Sun, L.; Jin, R. FEDformer: Frequency Enhanced Decomposed Transformer for Long-term Series Forecasting. In Proceedings of the 39th International Conference on Machine Learning (ICML 2022), Baltimore, MD, USA, 17–23 July 2022; Volume 2201, p. 12740. [Google Scholar]
  29. Wang, S.; Wu, H.; Shi, X.; Hu, T.; Luo, H.; Ma, L.; Zhang, J.Y.; Zhou, J. TimeMixer: Decomposable Multiscale Mixing for Time Series Forecasting. arXiv 2024, arXiv:2405.14616. [Google Scholar]
  30. Zhao, J.; Cheng, P.; Hou, J.; Fan, T.; Han, L. Short-term Load Forecasting of Multi-scale Recurrent Neural Networks Based on Residual Structure. Concurr. Comput. Pract. Exp. 2023, 35, e7551. [Google Scholar] [CrossRef]
  31. Ye, J.; Liu, Z.; Du, B.; Sun, L.; Li, W.; Fu, Y.; Xiong, H. Learning the Evolutionary and Multi-scale Graph Structure for Multivariate Time Series Forecasting. In Proceedings of the ACM SIGKDD Conference on Knowledge Discovery and Data Mining, Washington, DC, USA, 14–18 August 2022. [Google Scholar]
  32. Xu, Z.; Wang, Y.; Dong, R.; Li, W. Research on Multi-Microgrid Power Transaction Process Based on Blockchain Technology. Electr. Power Syst. Res. 2022, 213, 108649. [Google Scholar] [CrossRef]
  33. Kord, H.; Samouei, P. Coordination of Humanitarian Logistic Based on the Quantity Flexibility Contract and Buying in the Spot Market under Demand Uncertainty Using NSGA-II and NRGA Algorithms. Expert Syst. Appl. 2023, 214, 119187. [Google Scholar] [CrossRef]
  34. Hassaballah, E.G.; Keshta, H.E.; Abdel-Latif, K.M.; Ali, A.A. A Novel Strategy for Real-time Optimal Scheduling of Grid-Tied Microgrid Considering Load Management and Uncertainties. Energy 2024, 299, 131419. [Google Scholar] [CrossRef]
  35. Ma, H.; Peng, T.; Zhang, C.; Ji, C.; Li, Y.; Nazir, M.S. Developing an evolutionary deep learning framework with random forest feature selection and improved flow direction algorithm for NOx concentration prediction. Eng. Appl. Artif. Intell. 2023, 123, 106367. [Google Scholar] [CrossRef]
  36. Khan, M.; Haroon, M. Ensemble Random Forest and Deep Convolutional Neural Networks in Detecting and Classifying the Multiple Intrusions from Near Real-Time Cloud Datasets. In Proceedings of the USENIX Security Symposium, Philadelphia, PA, USA, 14–16 August 2024. [Google Scholar]
  37. Zhu, S.; Zheng, J.; Ma, Q. MR-Transformer: Multiresolution Transformer for Multivariate Time Series Prediction. IEEE Trans. Neural Netw. Learn. Syst. 2025, 36, 171–1183. [Google Scholar] [CrossRef]
  38. Zhang, J.; Zheng, S.; Cao, W.; Bian, J.; Li, J. Warpformer: A Multi-scale Modeling Approach for Irregular Clinical Time Series. In Proceedings of the 29th ACM SIGKDD Conference on Knowledge Discovery and Data Mining, Long Beach, CA, USA, 6–10 August 2023. [Google Scholar]
  39. Chen, P.; Zhang, Y.; Cheng, Y.; Shu, Y.; Wang, Y.; Wen, Q.; Yang, B.; Guo, C. Pathformer: Multi-scale Transformers with Adaptive Pathways for Time Series Forecasting. arXiv 2024, arXiv:2402.05956. [Google Scholar]
  40. Shabani, M.A.; Abdi, A.H.; Meng, L.; Sylvain, T. Scaleformer: Iterative Multi-scale Refining Transformers for Time Series Forecasting. Comput. Res. Repos. 2023, 2206, 04038. [Google Scholar]
  41. Ilbert, R.; Odonnat, A.; Feofanov, V.; Virmaux, A.; Paolo, G.; Palpanas, T.; Redko, I. SAMformer: Unlocking the Potential of Transformers in Time Series Forecasting with Sharpness-Aware Minimization and Channel-Wise Attention. arXiv 2024, arXiv:2402.10198. [Google Scholar]
  42. Zhou, H.; Zhang, S.; Peng, J.; Zhang, S.; Li, J.; Xiong, H.; Zhang, W. Informer: Beyond efficient transformer for long sequence time-series forecasting. In Proceedings of the 35th Association for the Advancement of Artificial Intelligence (AAAI), Virtually, 2–9 February 2021; pp. 11106–11115. [Google Scholar]
  43. Li, Z.; Li, L.; Chen, J.; Wang, D. A Multi-Head Attention Mechanism Aided Hybrid Network for Identifying Batteries’ State of Charge. Energy 2023, 286, 129504. [Google Scholar] [CrossRef]
  44. Xu, Y. Financial Time Series Forecasting Based on Long-Short Term Memory, Complete Ensemble Empirical Mode Decomposition with Adaptive Noise and Batch Normalization. Sci. Technol. Eng. Chem. Environ. Prot. 2024, 10, 61173. [Google Scholar] [CrossRef]
  45. Zhao, Z.; Yun, S.; Jia, L.; Guo, J.; Meng, Y.; He, N.; Li, X.; Shi, J.; Yang, L. Hybrid VMD-CNN-GRU-based Model for Short-Term Forecasting of Wind Power Considering Spatio-Temporal Features. Eng. Appl. Artif. Intell. 2023, 121, 105982. [Google Scholar] [CrossRef]
  46. Chen, Y.; Liu, S.; Yang, J.; Jing, H.; Zhao, W.; Yang, G. A Joint Time-frequency Domain Transformer for Multivariate Time Series Forecasting. Neural Netw. 2024, 176, 106334. [Google Scholar] [CrossRef]
  47. Liu, Z.; Cao, Y.; Xu, H.; Huang, Y.; He, Q.; Chen, X.; Tang, X.; Liu, X. Hidformer: Hierarchical Dual-Tower Transformer Using Multi-Scale Mergence for Long-Term Time Series Forecasting. Expert Syst. Appl. 2024, 239, 122412. [Google Scholar] [CrossRef]
  48. Salam, A.; Hibaoui, A.E. Comparison of Machine Learning Algorithms for the Power Consumption Prediction : - Case Study of Tetouan city. In Proceedings of the 2018 6th International Renewable and Sustainable Energy Conference (IRSEC), Rabat, Morocco, 5–8 December 2018; pp. 1–5. [Google Scholar]
  49. Shao, Z.; Wang, F.; Xu, Y.; Wei, W.; Yu, C.; Zhang, Z.; Yao, D.; Sun, T.; Jin, G.; Cao, X.; et al. Exploring Progress in Multivariate Time Series Forecasting: Comprehensive Benchmarking and Heterogeneity Analysis. IEEE Trans. Knowl. Data Eng. 2025, 37, 291–305. [Google Scholar] [CrossRef]
  50. Peng, R.; Kun, D.; Xu, L.; Jing, W. Short-term load forecasting based on CEEMDAN and Transformer. Electr. Power Syst. Res. 2023, 214, 108885. [Google Scholar]
  51. Huang, Y.; Wu, Y. Short-Term Photovoltaic Power Forecasting Based on a Novel Autoformer Model. Symmetry 2023, 15, 238. [Google Scholar] [CrossRef]
  52. Woo, G.; Liu, C.; Sahoo, D.; Kumar, A.; Hoi, S. ETSformer: Exponential smoothing transformers for time-series forecasting. arXiv 2023, arXiv:2202.01381. [Google Scholar]
  53. Kim, I.; An, H.; Kim, W. Development and Validation of Intelligent Load Control for VRF Air-Conditioning System with Deep Learning Based Load Forecasting. J. Build. Eng. 2024, 98, 111017. [Google Scholar] [CrossRef]
Figure 1. Random forests are used for the feature selection process.
Mathematics 13 01584 g001
Figure 2. Structure diagram of SFPFMformer.
Mathematics 13 01584 g002
Figure 3. Diagram of power load multiple timescale segmentation.
Mathematics 13 01584 g003
Figure 4. Structure diagram of depthwise separable convolutional block.
Mathematics 13 01584 g004
Figure 5. Time series plot of the datasetI and datasetII.
Mathematics 13 01584 g005
Figure 6. Attribute’s importance score of dataset I.
Mathematics 13 01584 g006
Figure 7. Performance of this method in predicting 4 h and 24 h power load data on dataset I.
Mathematics 13 01584 g007
Figure 8. Performance of this method in predicting 4-h and 24-h power load data on dataset II.
Mathematics 13 01584 g008
Table 1. Accuracy of SFPFMformer in power load prediction using different attributes.
Attributes4 h24 h
MSEMAEMSEMAE
All attributes0.05670.17410.03740.1510
Selected attributes0.04270.14620.03530.1458
Table 2. Time performance of SFPFMformer in power load prediction using different attributes.
Attributes4 h24 h
Training Time/sTesting Time/msTraining Time/sTesting Time/ms
All attributes380.95684.26111329.150814.7601
Selected attributes364.54743.98481277.476614.2520
Table 3. RMSE, MAE, and MAPE of different methods for forecasting power load on dataset I.
Method4 h24 h
RMSEMAEMAPERMSEMAEMAPE
Proposed1128.69803.912.63%1190.51897.262.97%
Transformer1420.211048.643.30%2026.601598.174.87%
Informer1290.99969.443.17%1975.951533.284.69%
Autoformer5169.503740.6812.02%2329.571866.335.83%
ETSformer1951.651485.994.77%2086.741723.295.27%
Seq2seq1832.931327.574.18%1598.911194.113.60%
LSTM1598.691148.223.62%1584.641192.493.76%
Table 4. The time performance of different models in 4 h and 24 h power load forecasting on dataset I.
Method4 h24 h
Training Time/sTesting Time/msTraining Time/sTesting Time/ms
Proposed364.54743.98481277.476614.2520
Transformer549.16034.94091737.558918.2373
Informer514.40295.46931647.605919.6551
Autoformer927.291011.93513037.400746.0714
ETSformer469.516840.20701546.854868.1427
Seq2seq424.39224.49691338.093819.5223
LSTM378.47024.37191346.915017.0202
Table 5. RMSE, MAE, and MAPE of different methods for forecasting power load on dataset II.
Method4 h24 h
RMSEMAEMAPERMSEMAEMAPE
Proposed273.26188.392.75%292.37221.823.76%
Transformer304.38216.264.33%305.57231.823.87%
Informer263.45186.592.47%480.75362.894.77%
Autoformer837.11594.8713.07%695.60534.016.87%
ETSformer469.52362.535.57%377.48464.315.84%
Seq2seq340.45213.033.78%369.99270.694.02%
LSTM280.83211.873.42%279.01232.893.83%
Table 6. The time performance of different models in 4 h and 24 h power load forecasting on dataset II.
Method4 h24 h
Training Time/sTesting Time/msTraining Time/sTesting Time/ms
Proposed193.19143.1729590.49309.6516
Transformer249.81913.1969805.534512.2316
Informer271.40974.4760827.536514.6804
Autoformer523.42019.47451448.599032.1280
ETSformer198.300429.5969676.580047.2400
Seq2seq194.59406.0164652.966612.6364
LSTM196.46954.9062627.660011.6042
Table 7. RMSE and MAE of ablation model in forecasting power load.
Method4 h24 h
RMSEMAERMSEMAE
Proposed1128.69803.911190.51897.26
SFPFformer1202.65846.221226.87920.53
SFPFMLformer1541.08983.141261.611035.26
SFPFMGformer1350.75923.291309.111049.55
SFPFMDformer1261.61920.531388.141125.66
Table 8. The time performance of different ablation models in 4 h and 24 h power load forecasting.
Method4 h24 h
Training Time/sTesting Time/msTraining Time/sTesting Time/ms
Proposed364.54743.98481277.476614.2520
SFPFformer363.73083.99631270.320114.2151
SFPFMLformer363.46363.94091276.758414.1160
SFPFMGformer366.82924.02301278.616714.7000
SFPFMDformer448.46065.00481709.208719.4503
Disclaimer/Publisher’s Note: The statements, opinions and data contained in all publications are solely those of the individual author(s) and contributor(s) and not of MDPI and/or the editor(s). MDPI and/or the editor(s) disclaim responsibility for any injury to people or property resulting from any ideas, methods, instructions or products referred to in the content.

