Abstract
The study analyses the hidden relationship between transport and ICT use for an extensive sample of 26,500 EU citizens. To that aim, a fuzzy clustering Eco-extended apostle model is applied to both latent variables: interurban transport trips and ICT use. The interurban long-distance trip (LDT) latent variable is measured by four different indicators (long- and medium-distance trips for work and leisure in the past twelve months), and the ICT use is based on a ten-item scale that provides information on different transport modes. The fuzzy Eco-extended apostle model is compared with the classical apostle model, translating the satisfaction and loyalty dimensions to our case. The fuzzy clustering model shows that most EU citizens are similar to the representative citizen who moved and used ICT at very low rates (56.5 and 50.4 per cent, respectively). The classical apostle model shows that the quadrants low LDT–high ICT and low LDT–low ICT are more represented by 38.5 and 35.2 per cent, respectively. However, the Eco-extended apostle model reinforces the results of the quadrant of low LDT–low ICT (40.22%) but softens those obtained in the quadrant of low LDT–high ICT (21.01%). Interesting insights of the effects of gender, age, education, and employment status are discussed.
Keywords:
interurban transport; ICT use; fuzzy logic; fuzzy clustering; apostle model; fuzzy clustering Eco-extended apostle model MSC:
62A86
1. Introduction
All transport systems, especially air transport, have developed more or less sophisticated tools based on the use of information and communication technologies (ICTs). Gössling [1] raised the question of whether ICT affects the transport sector’s growth, structure, and sustainability. Salomon [2] was the first to observe that transport and telecommunication technology are interrelated. After a review, he concluded that many previous studies focused on the substitution relationship between transportation and telecommunications, a relationship that was often viewed as the most desirable one by transport planners. Nevertheless, the relationships are usually complex, and telecommunications modify the transport behaviour of individuals and organizations, impacting citizens’ lifestyles.
Kwan et al. [3] contended that the interaction between ICT and human activity/travel behaviour has become a paramount issue in transportation research in recent years. Researchers have found that there was an ample set of mutual non-exclusive relationships between the use of ICT and activity and travel patterns in space–time dimensions. The authors found that the interaction between ICT and transport is highly complex, and describing it simply by substitution and/or generation is not enough. The earliest studies belonged mainly to the sphere of teleworking. For example, Saxena and Mokhtarian [4] found that there was an increase in the share of close-to-home activities performed by teleworkers on those days on which they did not travel to the office. The topic lately received an interest revival because of the COVID-19 pandemic, as the corona crisis changed habits from regular work to working from home. Kogus et al. [5] analyse the impact of the pandemic on telecommuting, trying to answer whether, at the end of the crisis, teleworking will become a reality for most citizens or whether working at offices will resume at the pre-pandemic figures.
Besides teleworking, the relationship between e-shopping and ICT use also captured the researchers’ attention in the past. Farag et al. [6] found that online searching positively affects the frequency of shopping trips and online buying. E-shopping is task-oriented for some and leisure-oriented for others. Urban residents shop online more often than suburban residents due to better internet connection. In-store shopping is more frequent for those with more shopping opportunities within 10 min by bike.
Thomopoulos et al. [7] evaluated the potential synergies between ICT use and transport on the grounds that accurate and timely information is highly valued in transport. Transport apps and infrastructure in hubs like railway stations, airports, car parks, bus stations, and stops have increased ICT use. A significant number of passengers are using these travel apps in the majority of transport systems and transport modes, either for getting on-time information or booking and paying for some transport sharing systems. The authors concluded that ICT use and transport will be essential in the near future due to the technological developments foreseen in the so-called Internet of Things.
Considering the boomed interest in studying the relationship between ICT use and long-distance transport (LDT), this study aims to gain deeper insights and clarity into the complex relationship between ICT use and long-distance transport (LDT). To that aim, this study employs an alternative and novel research method that analyses the relationship between ICT use and LDT. Thus, it is possible to provide deeper insights into how ICT use influences LDT patterns beyond traditional quantitative methods, offering a framework for analysing subjective or loosely defined concepts in transport research.
Our study intentionally avoids formulating a prior hypothesis about the relationship between ICT use and LDT due to three reasons: (1) The relationship between these variables at the EU level is relatively unexplored, lacking robust empirical evidence to support a pre-defined hypothesis. Speculating without such grounding could introduce bias and limit the scope of discovery. (2) The study is primarily exploratory, aiming to uncover the hidden and complex relationship between these variables. By avoiding a pre-existing hypothesis, we remain open to various potential relationships and unexpected patterns that might emerge from the analysis. (3) Both ICT use and LDT are complex and multifaceted concepts, requiring a careful consideration of their underlying components. Analysing them as latent variables allows us to capture the nuances and variations within each, leading to a more comprehensive understanding of the hidden interaction between them which is unknown and complex.
The methodology employs fuzzy sets and fuzzy clustering methods to develop a fuzzy Eco-extended apostle model to analyse the LDT and ICT dimensions across the following four quadrants: (1) low LDT–low ICT use; (2) high LDT–low ICT use; (3) low LDT–high ICT use; and (4) high LDT–high ICT use. Then, conditional probabilities are obtained using a bootstrap method to analyse positive and negative associations with individual sociodemographic traits. The analysis conducted has led to the discovery of insightful results that can be used to build a sturdy framework for future studies. The framework will be useful in analysing the intricate relationship between LDT and ICT use to test new hypotheses. The dataset provides valuable insights that can be used to improve our understanding of how LDT and ICT use are interrelated. The results will help researchers in designing better experiments and studies that can shed more light on the topic.
2. Theoretical Framework and Literature Review
2.1. Long- and Medium-Distance Trips
Magdolen et al. [8] contended that LDT trips are less studied than regular and everyday commuting travel, where the number of studies is more abundant. The authors concluded that the knowledge of LDT trips is still low and the lack of studies is mainly based on the existing difficulty of collecting data, as LDT trips are characterized by their irregular nature. The authors investigated the discrepancies between LDT and people’s everyday mobility in major German cities. They analysed how German citizens compensated for the LDT climate impact with sustainable behaviour in their everyday mobility.
Nevertheless, there is no consensus defining LDT trips, and the definition basically depends on the context and the type of information that is available. Dargay and Clark [9] defined LDT trips in Great Britain using 150 miles (one way) as a threshold that separated two categories of LDT trips. The dataset based on the British NTS constrained the definition of LDT trips to those whose distance is 50 miles or more (one way). The authors estimated different models taking into account transport mode (car, rail, coach, and air), travel purpose (business, commuting, leisure, holiday, and VFR) and trip length (<150 miles and 150+ miles one way). Magdolen et al. [8] defined LDT as trips with a one-way distance exceeding 100 km. On other occasions, as in [10], LDT trips are based on the interurban travel demand obtained for a particular year of the trips made at the domestic level between the capital provinces of the country.
Kuhnimhof et al. [11] discussed available national household survey data on long-distance travel (LDT), concluding that mobility diary surveys capture journeys up to 200 km, while LDT surveys capture travel beyond 400 km. LDT data are needed for multiple stakeholders such as policymakers, transportation planners, airline and railway managers, and, in general, all the transport service suppliers. However, LDT data availability is often insufficient and unsatisfactory because of the limited financial budgets of public administrations.
The EU launched several projects to correct the drawback of the lack of available LDT data. Ahern et al. [12] examined the National Travel Surveys (NTSs) in different countries of the EU, identifying some general differences among the methods, the scope, the geographical coverage, and the additional information included in the survey. The authors concluded that the comparison of travel patterns across the EU is limited by the variety of methods and the type and format of the data. In addition, there were a significant number of countries which did not administer any NTS during the past 10 years, and some others did not share the datasets with third parties.
Despite the fact that NTS do not always provide comparable data referring to individual LDT, they usually suffer less than other approaches such as mobile phone tracking or credit card payments to generate a piece of more homogenous information that can be used to analyse intra-zone mobility, origins, destinations, and trip purpose. Thus, it is possible to model individual LDT choices at the national or supra-national level. Kuhnimhof et al. [11] provided a synthesis of the characteristics of five common NTSs implemented in Europe: France, Germany, Switzerland, Sweden, and the UK. The authors concluded that as LDT trips exceeding a certain distance range are usually associated with staying a number of days away from home, the reporting days to minimize the non-response answers should include a long period of time such as the past year or the past summer, or as they worded this issue “Tell me about your long-distance travel in the last x weeks. (p. 19)” The authors found that there is some variability in the definition of LDT (80, 100, or 300 km) and the reporting period (two weeks to one year).
Stopher and Greaves [13] contended that NTS inaccuracies are common because some of the non-respondent households are mainly characterized by travelling more than the average household. In fact, the households do not respond to the survey because either they are difficult to contact as they are absent from the home or because they see the survey task as being significantly time-consuming for the number of trips that need to be reported. The authors added that the estimation of more sophisticated travel demand models will procure more difficulties in the area of data collection in NTSs, concluding that diary survey datasets are rapidly becoming a thing of the past, and proposing as new alternatives the use of GPS datasets, panel surveys, continuous measurement surveys, and dataset fusion.
Fekih et al. [14] found that mobile phone networks can be used to track individual travel behaviour at a low cost. Interestingly, it is possible to accurately determine the spatial and temporal dimensions of the individuals’ whereabouts. Thus, big data based on the mobile phone passive information provide a promising and low-cost source for acquiring information that can be used in travel demand models.
NTSs suffered from other different problematic areas like underrepresented trips such as those related to special events. For example, trips related to the Summer Olympic Games in which spectators travel long distances to the major venues located in the main city where the events are held are usually not covered by the NTS [15]. The associated problems could be resolved by specific data collection methodologies that take into account the diversity of the events, in which special event surveys need to be complemented by a combination of attendance and gate counts by time periods. Special event categories are obtained according to seven salient characteristics: (1) predicted attendance; (2) event frequency; (3) venue type; (4) start and end time; (5) one or multiple days; (6) day(s) of the week; and (7) event market area that determines to what extent the event is local, regional, national, or international. The survey should include the following questions: (1) origin of the trip and destination when the event is over; (2) mode choice; (3) party size; (4) length of stay; (5) household size; (6) household income; and (7) vehicle availability.
Breyer et al. [16] contended that classification methods applicable to mobile phone data are not easily adapted from the existing methods applied to GPS-datasets, as the datasets based on the mobile phone information are typically noisier and of lower resolution in space and time than that based on GPS information. Therefore, the authors compared different classification methods applied to mobile phone information, using a labelled dataset containing 255 trips in only two OD pairs to train and evaluate the classification correction methods. They found that two of the geometric-based methods provide less reliable results than those obtained by the supervised methods.
Andersson et al. [17] did recognize that NTSs suffered from low response rates that could compromise the validity of travel demand models, as data collection based on GPS tracking systems is not absent from low response rates. For this reason, the authors contended that mobile phone datasets in travel demand modelling are gaining the researchers’ attention. However, mobile phone data often lack relevant information about socio-economic and demographic characteristics of travellers. Thus, the characteristics and the type of information included in mobile phone datasets differ greatly from those obtained in NTS or GPS survey administrations. Andersson and her colleagues were the first to estimate a mode choice model based only on a mobile phone dataset where the nature of the dataset did not provide information about the travel mode used in an LDT trip. The authors extended the identification model proposed by Breyer et al. [16], estimating with a probability the transport mode chosen (air, road, or railways) by passengers in a set of long-distance trips.
2.2. ICT Use
Gössling [1] reviewed the relationship between ICT applications and transport behaviour, finding that the first studies discussing comprehensively the relationship were Wagner et al. [18] and Banister and Stead [19]. Nevertheless, since then, ICT applications have increasingly evolved with the evolution of smartphones, which are nowadays a regular tool passengers use for different purposes such as navigation in road transport, ticketing purchases in urban and interurban transport modes, or for online live information about the expected waiting time at bus stops.
According to Wagner et al. [18] and Banister and Stead [19], the relationship between ICT and transport behaviour is unclear as two opposite effects could arise. Firstly, ICT could stimulate travel as new transport opportunities become available. Secondly, it could also lead to the substitution of travel as more and more tasks can be carried out from remote locations. Van Wee [20] highlighted the substitution pattern, especially for young generations, in which the decrease in car use, also known as peak car or peak travel, can be partly explained due to a transition towards more ICT-based activity patterns and accessibility.
According to the analysis conducted by Mokhtarian [21], the impact of travel generation effects appears to be as significant as the substitution effects. In other words, the factors that encourage travel, such as personal preferences and social norms, are just as crucial as the factors that discourage it, such as the cost of transportation or limited resources. This finding highlights the complexity of travel behaviour and the need for a comprehensive approach to understanding and managing it. A number of reasons for that are that ‘not all activities have an ICT counterpart’; ‘even when an ICT alternative exists in theory, it may not be practically feasible or desirable’; ‘Travel carries a positive utility’; ‘Not all uses of ICT constitute a travel replacement’; ‘ICT saves time and/or money for other activities associated to transport’; ‘ICT permits travel to be sold more cheaply’; ‘ICT increases the efficiency of the transportation system, making travel more attractive’; ‘Personal ICT use can increase the productivity and/or enjoyment of travel time’; ‘ICT directly stimulates additional travel’; ‘ICT is an engine driving the increasing globalisation of commerce that is facilitated by the reverse logistics’; and ‘ICT facilitates shifts to more decentralised and lower-density land use patterns’.
Lyons [22] contended that the relationship between ICT use and transport behaviour is more complex than the simple dichotomy between substitution and generation effects. It is true that ICT-based activities such as e-working, e-retailing, e-learning, e-physician, and e-exercising will reduce the travel to offices, shops, schools, academies, universities, medical centres, hospitals, gyms, and sports facilities. Thus, the travel time saved from these trips can be used for additional activities that can incur other travel needs and use, so the net effects are unclear. In our study, we will explore how ICT use is associated with interurban trips for work and leisure, clustering the individuals into four different categories.
E-activities were not commonly available until the appearance of the smartphone in 2007, so the older generations are not as used to participating in them as the digital natives in their twenties. For that reason, we expect that young generations will display high ICT use in comparison with the older generations. Van Wee [20] discussed how this same fact could speculatively explain the decreasing levels of car use of the less car-oriented young generations. He speculated on how much ICT-based activities could reduce average travel time, breaking the theory of constant travel time budgets. It is difficult to predict the net result, but, in our opinion, the constant travel time budget may still be valid if calculated annually.
Gössling [1] found the following dimensions in the analysis of ICT use and transport behaviour: (1) travel information, planning, and routing; (2) sharing; (3) e-work; (4) payment and price comparisons; (5) safety; (6) convenience; (7) space and distribution; (8) health; and (9) mobility. The latent variable used to measure ICT use in our study is more related to the first, fourth, and sixth dimensions. Car drivers do often use navigation systems such as the popular portable Garmin or TomTom devices, smartphone apps like Google or Waze, or integrated vehicle systems. Most of the systems are nowadays provided with live information that recalculates the best route alternative in the case of severe congestion or disruptions.
This section ends with a topic that would explain the complementarity between ICT use and travel demand, namely, that ‘ICT increases the efficiency of the transportation system, making travel more attractive’. Bak and Borkowski [23] analysed public transport (PT) systems, concluding that a key driver for improving the service resided in implementing smartphone e-ticketing. Smart ticketing facilitates passengers’ travelling without a paper ticket, and this technology is also common in railways and metros worldwide. Graham [24] analysed the main transport payment systems, discussing payment technologies ranging from smartphone applications to electronic toll collectors. Some payment systems can be implemented in all the transport modes that coexist in a region, enabling the passengers’ payment for tolls, PT, and shared rides. Martín-Domingo and Martín [25] analysed the adoption of mobile internet by airports, finding that most of the studied airports offered flight status notifications, and four airports really were innovators by providing dedicated smartphone apps. Airlines also offer many e-services to current and potential passengers through the internet or smartphone apps, the most popular being ticket purchases and online boarding passes [26].
3. Research and Analysis Methodology
3.1. Data Collection
The dataset was collected from a survey administered by TRT Trasporti e Territorio and IPSOS Italy for the Joint Research Centre–Institute for Perspective and Technological Studies (JRC-IPTS). The survey aimed to explore various aspects related to transportation in Europe. It focused on two key areas: (1) everyday mobility; and (2) long-distance trips covering distances of over 300 km and up to 1000 km, and over 1000 km, categorised by purpose and mode of transportation used within the previous 12 months. The overall objective was to collect comparable information on transport mobility at the EU level, overcoming the limitations in various national surveys regarding scope and definitions.
The survey also focused on ICT use and other policy-relevant issues, such as whether the passengers have substituted some trips to their workplaces or to their preferred shops with e-working or e-shopping. The type of information needed did not exist at the EU level. In order to gather valuable insights, a comprehensive survey instrument was meticulously developed and administered using the Computer Aided Web Interview (CAWI) methodology in June 2018.
The survey was conducted in all 28 European countries, with a sample size of 1000 individuals in each country. Cyprus, Luxembourg, and Malta had a sample size of 500 each, totalling 26,500 respondents. The sample selection process for the surveys involved the random selection of participants from the IPSOS panels in each country. These panels are maintained and monitored on a consistent basis to ensure that the participants are representative of the general population and are willing to participate in the survey. The sample quotas for each survey were established based on various socio-economic characteristics, including age, gender, employment status, and educational level. These quotas aimed to ensure that the sample was representative of the population being studied. By taking these factors into account, the surveys were able to provide accurate and reliable data on the attitudes and opinions of the population being surveyed.
Table 1 shows that the sample was more represented by women (51.00%) than by men (49.00%). Regarding age groups, respondents aged 75 years or older form the smallest category, representing only 0.46%. The next least represented age group are those between 66 and 75 years, accounting for 4.10% of the respondents, followed by those between 56 and 65 years, representing 12.57%. The remaining age groups have more balanced representation, with each group accounting for more than 20% of the respondents. Our sample consists primarily of educated individuals, as over 84% hold a high school degree or higher. It can be observed that the majority of the sample is composed of full-time employed individuals (60.20%) along with those who work part-time (10.74%). Retirees account for 9.40% of the sample.

Table 1.
Survey socio-demographic characteristics (n and %).
3.2. Interurban Trips and ICT Use Latent Variables
The latent variable of interurban trips was analysed based on four different indicators that measure the number of trips taken for work or leisure purposes over long distances (more than 1000 km) or medium distances (more than 300 km but less than 1000 km) in the previous twelve months. To ensure the accuracy of the responses, a map link was provided to respondents who were unsure about the exact distance of their trips. Moreover, a confirmation check was included for responses that exceeded five trips, which helped to prevent any potential errors or exaggerations. The answer format for each of the indicators was based on the number of trips taken in each category during the previous twelve months. This detailed analysis will provide valuable insights for measuring the latent variable that proxies the interurban travel patterns of the respondents at the EU level.
Regarding the ICT use latent variable, the following ten items were included in the questionnaire: (1) in-vehicle navigation system; (2) mobile phone map and/or navigation application; (3) online flight ticket purchasing; (4) online flight check-in; (5) flight ticket purchasing application; (6) flight check-in application; (7) online public transport ticket purchasing; (8) public transport ticket purchasing application; (9) online/mobile access to live public transport schedule information; and (10) interoperable onboard device to pay road tolls.
A first screen of the ICT module was presented to respondents, explaining to them the meaning of each of the categories. For example, in the case of the ‘mobile phone map and/or navigation application’, the following explanation was provided in the questionnaire: application for smartphones that allows route planning for travelling by foot, car, bike or with public transportation and may receive a live update on traffic conditions. The answer format for all the items was based on a full four-point semantic scale, as follows: 1. Never; 2. Sometimes; 3. Often; and 4. Always.
3.3. TOPSIS and Fuzzy Hybrid Analysis
Figure 1 contains the flowchart that condenses the relative information of the proposed methodology. It can be seen that the methodology starts from the input matrices obtained from the dataset for the latent variables LDT and ICT use. This section provides the basic information needed for the methods employed in the first part of the figure that appears as the fuzzy hybrid analysis which will provide the synthetic indicators of both latent variables.
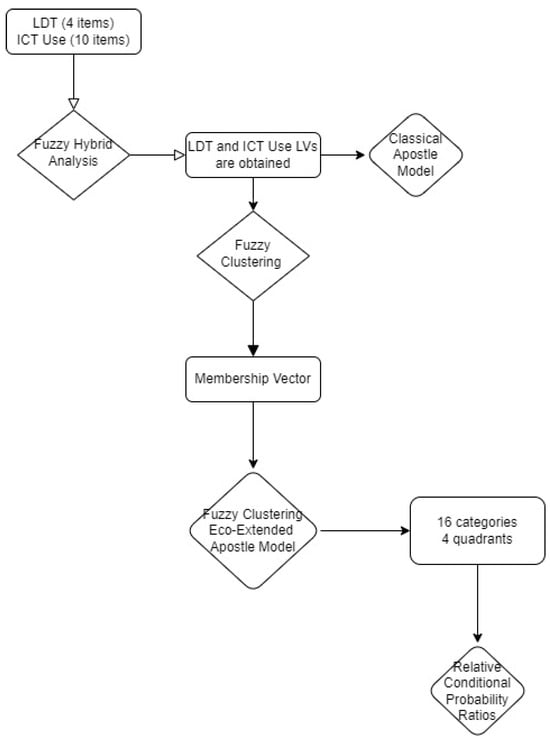
Figure 1.
Flowchart for visualising the research methodology.
We first apply the Technique for Order Preference by Similarity to Ideal Solution (TOPSIS) [27,28], which is still one of the most employed multi-criteria decision-making (MCDM) techniques, to the four-component vector that provides the information of the interurban transport trips.
Then, we obtain the ideal solutions that are going to be based on the respondents who travel the most and the least of the whole sample. The ideal solutions can be obtained as follows:
where the matrix V represents the number of interurban long-distance and medium-distance trips that each respondent made for work and leisure in the previous twelve months, i goes from 1 to the sample total (26,500), and j stands for each four-component of the set of interurban trips.
Thus, a TOPSIS synthetic interurban transport trip indicator (LDT-TOPSIS index) is obtained for each respondent taking a second step, which now calculates the Euclidean distance between each four-component observation and the ideal solutions (A+ and A−), and then compares the relative distances, as follows:
Similarly, the ICT use latent variable synthetic indicator is obtained but now using a fuzzy hybrid approach that adequately handles the vagueness of the information provided by the responses given to the ICT use module. First, the semantic ordinal scales are converted into triangular fuzzy numbers (TFNs), as the information provided by answers such as sometimes and often is intrinsically vague.
The triangular fuzzy numbers are parameterized using a triplet with the following membership function :
In this study, we transform the four-point semantic scale provided by the respondents in TFNs into the universe of discourse within the interval (0, 100) as follows: (1) never (0, 0, 50); (2) sometimes (30, 50, 70); (3) often (50, 70, 90); and (4) always (70, 100, 100). In each of the categories, it can be seen that the intersection of two consecutive TFNs is not empty which is the essence of the application of the fuzzy set theory. The same type of conversion has already been applied in [29,30]. The TOPSIS method can be adapted to the case of TFNs to obtain a synthetic index indicator for the ICT use latent variable as in [29,31].
3.4. The Fuzzy Clustering Method
The fuzzy clustering Eco-extended apostle model has already been applied by Indelicato and Martín [30] to study national identity, and by Martín et al. [31] to study the impartiality of public service provision. The method is based on the application of a fuzzy clustering technique that obtains the three-cluster solution for which the representative respondents are usually interpreted as the positive, negative, and intermediate profiles. The profiles are derived from the synthetic indicators that were obtained in the previous steps. For example, in analysing interurban trips, the three-cluster solution can be interpreted as high-frequent, low-frequent, and intermediate-frequent travellers, and the respective profiles are those who have the highest, lowest, and median values of the LDT-TOPSIS indicator.
The fuzzy clustering analysis is applied to study both latent variables LDT and ICT use. Therefore, for each latent variable and respondent, a membership function that determines the degree of similarity between each respondent and the specific representative respondent discussed above is obtained [32]. The fuzzy clustering algorithm is an extension of the bag grouping algorithm introduced by Leisch [33], and interested readers can consult [34,35,36] to get more insights from the method. The C-means fuzzy algorithm for fuzzy data is expressed as follows (Fuzzy Clustering in Figure 1):
We follow the same notation as Martín, Moreira and Román [37], where represents the fuzzy distance squared between the ith respondent i, , where the vector represents the TFN assigned to the information provided by the ith respondent. On the other hand, represents the TFN provided by the representative respondent of the cth cluster; is the square Euclidean distance between the centres of the TFN vectors of the respondent and the representative respondent of the cluster; and are the Euclidean squared distances between the extreme left and right components of the TFN vectors of the respondent and the representative respondent of the cluster, respectively; are suitable weights for the centre and extreme components for the blurred distance considered; is a weighted exponent that controls the blur of the partition obtained; and gives the degree of membership of the ith resident in the cth cluster. The parameterization of the method is based on the following selection m = 1.5, and w1 = w2 = 0.5. The Lagrangian minimization problem is solved to obtain the membership function for each respondent given by the solution uic. The membership function vector synthesizes the resemblance degree of each respondent with respect to the selected representative for each cluster (Membership Vector in Figure 1). The discussion of cluster validation and cluster profiles is omitted, and interested readers are referred again to [34,35,36].
3.5. The Fuzzy Clustering Eco-Extended Apostle Model
Jones and Sasser [38], from the Harvard Business School, introduced the classical apostle model. The model assumed that customer satisfaction was an antecedent of loyalty. Schaefer [39] transferred the “classical apostle model” into biology by transforming the classical axes of satisfaction and loyalty into habitats and species. Thus, the original categories labelled as deserters, mercenaries, hostages, and apostles were more appropriately reclassified using ecological terms. (Classical Apostle Model in Figure 1). More recently, a similar approach has been used to analyse national identity using as main axes the ethnic and civic latent variables [30].
This approach can be used to analyse the relationship between any two latent variables. Researchers only need to transfer the logic of the old clients’ pair of latent variables, such as loyalty–satisfaction, into the new two axes of interest. Indelicato and Martin [30] also extended the classical apostle model using synthetic indicators that measure each latent variable through the membership function obtained by applying the fuzzy clustering technique, amplifying the four categories into sixteen.
Similarly to previous studies, the original axes of satisfaction and loyalty are transformed as follows: LDT and ICT use take the role of satisfaction and loyalty, respectively. Thus, the model will classify different LDT–ICT use patterns: (1) low LDT–low ICT use; (2) high LDT–low ICT use; (3) low LDT–high ICT use; and (4) high LDT–high ICT use.
Figure 2 shows the classical four quadrants explained above through the latent variable synthetic indicators LDT-TOPSIS and ICT use. Thus, the deserters quadrant (south-west) can be seen now as the group of citizens who do not travel very much and do not use ICT frequently. Similarly, the northeast quadrant (apostles) is characterised by those citizens who travel and use ICT very much. According to the literature review, these two quadrants can be seen as examples of a complementary use of ICT and transport. However, the southeast (high LDT and low ICT use) and northwest quadrants (low LDT and high ICT use) are characterised by those citizens who do not seem to use ICT as a complement when they are travelling.
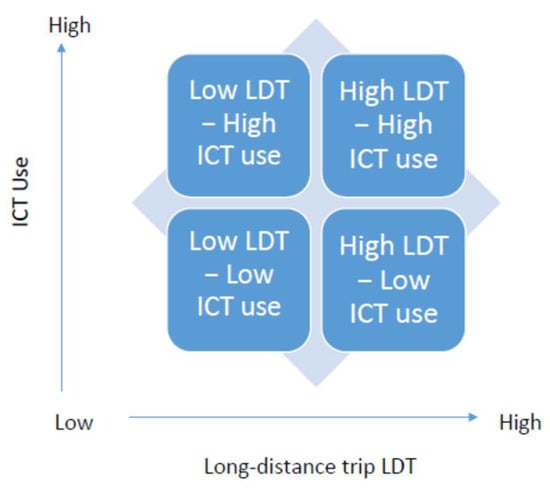
Figure 2.
Apostle model applied to interurban transport trips and ICT use.
As explained in Indelicato and Martín [30], a limitation of the classical apostle method is that the taxonomy of the citizens near the average latent variable values for both dimensions is unclear. Researchers would expect to have a clear distinction between each of the quadrants, and in some cases, the distances between the observed data are certainly low. Therefore, the authors propose a new method which is based on the membership function obtained for each latent variable after applying the fuzzy clustering algorithm. This new method is named the alpha fuzzy clustering Eco-extended apostle method, and it aims to reduce the potential blur area that exists around the average values area.
Let us assume that is a vector that contains the membership function for the citizen i obtained with the three-cluster fuzzy clustering method explained above. We define the following function for each vector m:
Without loss of generality, the function can be applied to any membership function to provide four categories for each citizen. Let us assume that the vector coordinates represent the similarity to the positive, negative, and intermediate clusters representative of the latent variable under study. In the case of the LDT latent variable, this would correspond to the following profiles: the citizen that travels the most, the citizen that travels the least, and the citizen that travels an intermediate number of trips. The original model with the four classical categories has been expanded to a model with sixteen categories, where the pure categories are now located in the corner quadrant positions [(1, 1), (4, 1), (1, 4), and (4, 4)]. The alpha selection depends on the research interest, but it has to be greater than 0.5. However, if researchers want to analyse some of the corner categories, the alpha value can be between 0.6 and 0.8, but if researchers want to analyse the behaviour of all citizens, the 0.5 value is highly recommended (Fuzzy Clustering Eco-Extended Apostle Model in Figure 1).
3.6. Relative Conditional Probability Ratios
This section on methodology ends with the presentation of the relative conditional probability ratio approach. The analysis of whether two events are independent is empirically tested by the estimation of the confidence intervals of the mentioned ratios. Thus, it would be possible to analyse to what extent, for example, some covariates such as gender, age, employment status, or education have a positive (driver) or negative (barrier) effect on the probability of belonging with more or less intensity to some of the categories obtained by the fuzzy clustering Eco-extended apostle model.
From a theoretical point of view, it is known that two events A and B are independent if and only if:
Thus, the conditional probability ratios can be calculated for each pair (category, covariate) of the categories and covariates of research interest. Thus, the method is based on the calculus of the following ratios:
When the ratios denoted by A and B are significantly greater than one, it indicates a positive association between A and B, showing that they are not independent. Similarly, when the ratios are lower than one, A and B are negatively associated. The relationship between the LDT and ICT use categories and other sociodemographic categories of citizens can be analysed with this approach.
The ratios of Equation (7) are obtained for 1000 bootstrap subsamples obtained with replacement (Relative Conditional Probability Ratios in Figure 1). Bootstrap is a statistical tool that is widely used for statistical inference. The concept behind this method is that we can estimate the accuracy of a statistic of interest by calculating subsamples from a sample that closely represents the population from which it was derived [40]. When there is doubt regarding the validity and accuracy of the usual distributive assumptions and asymptotic results, bootstrapping is a useful technique. Bootstrap is a non-parametric method that allows us to calculate estimated standard errors, confidence intervals, and hypothesis tests [41].
4. Results
4.1. Interurban Transport Trips and ICT Use
The fuzzy clustering method is based on the respondents’ representative profiles obtained from the latent variable synthetic indicators for the highest, lowest, and median values. Table 2 displays three profiles in these cases, each named after the degree of interurban travelling and ICT use indicated by the corresponding indicators: (1) high, (2) low, and (3) intermediate. Respondents who answered the highest figures on the scale correspond to the citizen with the highest synthetic indicator for both latent variables. Thus, the profile of the representative citizen is characterised by those who travel the most and use ICT very frequently. On the other hand, the “low” profile represents those citizens who travel the least and use ICT infrequently. Finally, the intermediate profile is represented by the citizen who has the median position with respect to both latent variables and can be considered a representative of the average citizen in the EU.
Table 2.
Fuzzy cluster profiles.
Analysing the profiles of the interurban trip latent variable, it can be seen that the profiles for the three clusters show remarkably different behaviour for each of them. There is a citizen who has travelled more than 40 times in each of the four categories of interurban transport trips. The profile for those who travelled the least is found for citizens who do not travel any trip in any of the four categories. The intermediate profile is characterised by a traveller who made two trips between 300 and 1000 km for leisure or personal motives.
Regarding ICT use, it can be seen that the profile of the citizen who represents the high cluster is characterised by always using all the options of ICT use in transportation. The low cluster is represented by a citizen who never uses any ICT option. The intermediate cluster is represented by a citizen who always uses smartphones for navigation aid on the roads and for buying tickets and check-in processes in air transport, as well as interoperable on-board devices to pay road tolls. At the same time, this citizen does not frequently use online services and never uses any option for PT.
Figure 3 displays two ternary figures representing the distribution of respondents’ use of ICT for transport and travel frequency. The analysis of the figures reveals that the transport and ICT use behaviours are very different. It can be seen that the interurban transport trips (Figure 3a) show less heterogeneity than the ICT use (Figure 3b). The spread of the points in the first figure seems to be in a line that goes from the highest LDT to the midpoint of the side of the triangle, joining the vertices of the one that makes the least number of trips and the one that makes an average number of trips. The aggregate of the membership function shows that only 0.6% of citizens are similar to the citizen who has the highest LDT, 56.5% are similar to the one who does not make any interurban trip longer than 300 km, and 42.9% are similar to the citizen who makes two trips between 300 and 1000 km for leisure or personal motives.
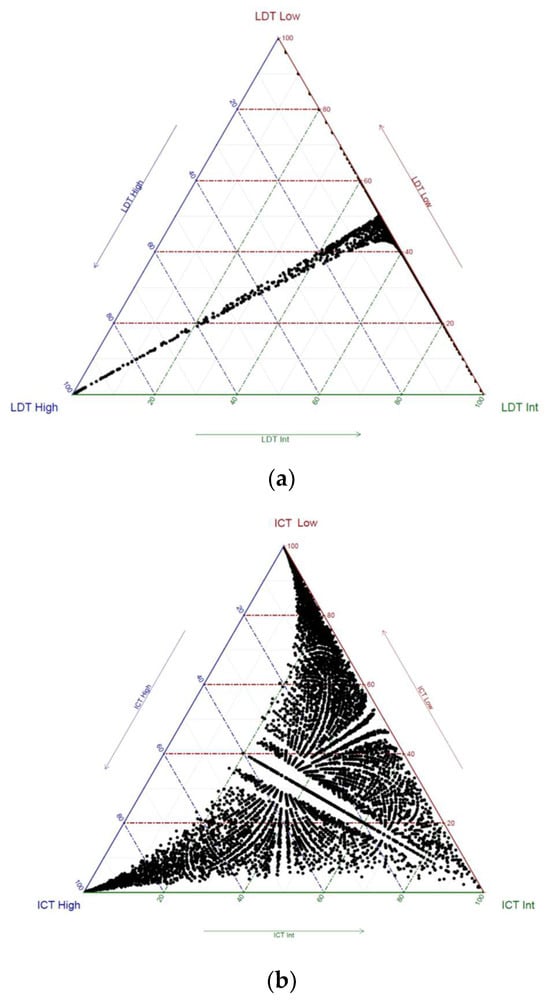
Figure 3.
Fuzzy clustering ternary graphs. (a) Interurban transport trips (LDT); (b) ICT use.
Figure 3b, on the other hand, represents the ICT use latent variable. It can be seen now that the membership function is more widespread than in the previous LDT case. High, low, and intermediate transport ICT users are now represented by 19.8%, 50.4%, and 29.8%, respectively. Thus, to our surprise, it can be concluded that only 20 per cent of the EU population uses ICT for transport on most occasions.
4.2. The Classical vs. the Fuzzy Clustering Eco-Extended Apostle Model
In this study, the apostles would be those who travel more and use ICT for transport more frequently, and the deserters would be those who neither travel nor use ICT frequently. In addition, the other two categories—hostages and mercenaries—are represented by “low LDT and high ICT use” and “high LDT and low ICT use”.
As seen in Figure 2, travel patterns and ICT adoption for transportation vary significantly among different citizens. The classical and the extended apostle models will categorise different travellers according to the two latent variables studied. The subjacent hypothesis that can be assessed is whether (in)frequent travellers are also (less)more tech-savvy and utilise ICT tools like the options considered in the study (less)more frequently. The models will also permit the analysis of those travellers who do not adopt ICT for transport purposes or those who use ICT but are not frequent travellers.
Applying the classical apostle model using the TOPSIS and the fuzzy hybrid methods, we obtain that the most represented category is that of low LDT and high ICT use with 38.5 per cent of the sample, followed by low LDT and low ICT use with 35.2 per cent, and by high LDT and high ICT use with 16.8 per cent. The group with the least representation is that of high LDT and low ICT use, which is only represented by 9.5 per cent of the sample (Figure 4).
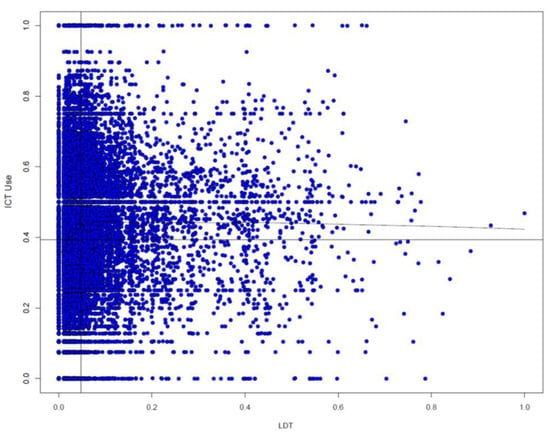
Figure 4.
Classical apostle model for interurban transport trips (LDT) and ICT use.
Nevertheless, results change substantially when applying the fuzzy clustering Eco-extended apostle model, as the most represented group is now low LDT and low ICT use with 40.2 per cent of the sample, followed by high LDT and low ICT use with 24.8 per cent of the sample, and by low LDT and high ICT use with 21.0 per cent of the sample. The least represented group is now that of high LDT and high ICT use with 14 per cent of the sample.
Overall, 39.7 per cent of the sample changed category when the extended apostle model was applied. The analysis of the correspondence function determines that a large group of citizens is classified by the classical apostle model as low LDT and high ICT users that the extended apostle model better classifies as low LDT and low ICT users. Regarding the pure categories, the extended model shows that the most represented group is that of low LDT and low ICT use with 18.1 per cent of the sample.
4.3. The Analysis of Gender, Age, Education, and Employment Status on the Relationship between Interurban Transport LDT and ICT Use
The results section ends with the analysis of relative conditional probability ratios of each of the categories found by the fuzzy clustering Eco-extended apostle model and the covariates studied, namely, gender, age, education, and employment status. The ninety-five per cent confidence interval is calculated for each pair of events, for example, male and low LDT and low ICT use, resampling the whole sample one thousand times, and dropping 50 individuals in each draw. Table 3 shows the confidence intervals for all the categories of the covariates and Eco-extended apostle quadrants.
Table 3.
Conditional probability ratios (95 per cent confidence intervals).
The interpretation of the table is straightforward. For example, the confidence interval of the conditional probability ratio for males and low LDT and low ICT use is obtained from the percentiles 2.5 and 97.5 of the distribution of the ratios obtained with the bootstrap method shown in the table (0.976, 0.977). These values represent the lower and upper bound of the 95 per cent confidence interval. Thus, it can be concluded that there is a negative association between being male and belonging to the category of low LDT and low ICT use. Following the same reasoning, results also show a negative association between males belonging to the category of low LDT and high ICT use. In addition, the positive association of males is found for belonging to the categories of high LDT for both types of ICT use, high and low. For females, we obtain the symmetric results that show a negative association for belonging to the high LDT categories, and a positive relationship for belonging to the low LDT categories.
Analysing the age covariate, the results show that the most positive relationship is seen in the oldest generation (those whose age is greater than 75) for belonging to the category low LDT and low ICT use, and also to the category low LDT and high ICT use. In addition, the most negative associations are seen again for the oldest generation and their belonging to the category of high LDT. Other remarkable negative associations are also found for those whose ages are between 66 and 75 and between 56 and 65 for belonging to the category of high LDT and high ICT use.
Regarding the educational level and employment status, the results show that the most negative associations are found for being in the category of high LDT and high ICT use for unemployed citizens and for those with primary and secondary educational levels. In contrast, the most positive associations are found for the citizens with university studies who belong with more probability to the high LDT and high ICT use, and for those who are unemployed and have only primary studies who belong with more probability to the category of low LDT and high ICT use.
In some cases, it can be seen that one is contained in the confidence interval, and it can be concluded that events A and B are independent. This is the case for the youngest generation (25 years old or younger) and those whose age is between 66 and 75, and their belonging to the category of high LDT and low ICT use. These are the only two exceptions in all the events under analysis. For the rest of the cases, it can be concluded that there exists a positive or negative association between the categories of the covariates analysed and each category of the quadrants determined by the Eco-extended apostle model. Thus, the results show that gender, age, education, and employment status significantly affect the categories determined by LDT and ICT use.
5. Discussion
To our knowledge, this is the first study analysing the relationship between interurban transport trips and ICT use in the EU. For this reason, it is difficult to compare the results obtained in the study with previous research. Nevertheless, some of the results will be partly compared, at least by analysing LDT or ICT use patterns.
In the sample, there was a citizen who travelled more than 40 times in each of the four categories used to analyse interurban transport trips, which is evidently a rare case that can only be explained by the LDT of particular professions such as salesmen, ambassadors, or Euro parliamentarians. This outlier profile causes the aggregate average values of the membership function of the fuzzy clustering analysis for the latent variable to be only represented by 0.6% of citizens for the high LDT cluster. However, the sample population is more similar to those who do not make any trip longer than 300 km during a year, as it is represented by 56.5 per cent of the population.
This unbalanced behaviour between a minority, who travel a lot, and a majority, who do not make any trips, has also been found in previous studies. Aultman-Hall [42] found that the definition of long-distance travel is particularly blurred because there are many different distance thresholds that have been used in the past such as the 50-, 75-, or 100-miles threshold. This fact has created even more confusion than the verbatim definition based on the intercity “out-of-town” trips, which can involve overnight stays or not. Long-distance travel trips usually have large standard deviations, i.e., long-distance travel is highly variable. Frei et al. [43] concluded that the long-distance travel thresholds should be chosen between 75 and 100 km. Our study includes long-distance trips using two more distant categories than the thresholds mentioned above. The only comparable figures are shown in [11], where the authors summarised the number of long-distance trips above 400 km per person per year in 16 European countries, finding the highest and lowest figures in Sweden (1.4) and Portugal (0.2), respectively.
We find that the intermediate profile is characterised by a traveller who made two trips between 300 and 1000 km for leisure or personal motives. LaMondia et al. [44] defined purpose-based long-distance travel using the main purpose of the trip, such as work travel, leisure, and personal travel. Dargay and Clark [9] proposed other categories such as business, commuting, holiday, leisure, and visiting friends and relatives. Analysing travellers who occasionally travel long distances by coach, Van Acker et al. [45] found that 68 per cent of the sample were travelling for leisure or to visit friends or family, so it can be inferred that the intermediate profile concurs with these results.
The ICT use profiles also differ substantially according to each of the clusters. We find that high, low, and intermediate transport ICT users are now represented by 19.8%, 50.4%, and 29.8%, respectively. It is surprising that almost fifty per cent of the sample never uses any ICT option and that the intermediate profile was mainly characterised by not using any ICT option for public transport. It is beyond the scope of the current study, but the last result could be explained by the spatial heterogeneity of the sample in which some of the respondents might not even use public transport for their commuting daily needs. In addition, Bak and Borkowski [23] also found a similar result of a large group of non-ICT users. Aultman-Hall [42] concluded that future modelling would be based on two separate datasets that split travel into daily trips from the regular residence and a series of long-distance trips performed in the previous year.
As discussed in the literature review, ICT use was first perceived as a potential driver to reduce long-distance travel, but this has also been largely disputed [46]. Senbil and Kitamura [47] contended that the impact of ICT on long-distance travel suffers from complex interactions where four potential outcomes such as substitution, complementarity, modification, and neutrality could be observed. However, to our knowledge, the relationship between long-distance travel and ICT use has not been previously analysed in the literature. However, in a daily context, Jamal and Habib [48] found a limited impact (neutrality) of ICT use on the number of travel trips performed but a significant impact on deciding the departure times.
The fuzzy clustering Eco-extended apostle model finds that the most represented group is low LDT and low ICT use with 40.2 per cent of the sample, and interestingly, the least represented group is that of high LDT and high ICT use with 14 per cent of the sample. Thus, it seems that a majority group travel long-distance trips and use ICT transport options very scarcely in comparison with a minority group of citizens who travel and use ICT very frequently. The other two quadrants (low LDT and high ICT use vs. high LDT and low ICT use) are represented by a lower number of citizens. Speculatively, we can think of some respondents who very frequently use ICT options such as navigation systems or PT apps for their daily needs and who do not travel on long-distance trips.
Regarding the relationship of the socio-demographic characteristics such as gender, age, education, and employment status, we have already mentioned that comparison is made on each different latent variable under study: interurban transport trips and ICT use. Aultman-Hall [42] reported similar results to those obtained here for the LDT latent variable. Thus, older individuals tend to travel less, while men’s travel for work exceeds that of women, and, additionally, travel frequency increases with higher income and education levels. Jamal and Habib [48] found that age is negatively associated with ICT use for trip planning, concurring with our results.
New ICT alternatives are improving the options to travel long-distance in the EU, and this is particularly suitable for the younger generation, who have more opportunities to make new trips that were not so available in the past. Dargay and Clark [9] described long-distance travel in Great Britain, finding that income is one of the most important drivers, i.e., more wealthy citizens travel more than less affluent citizens. Kuhnimhof et al. [11] analysed the number of annual trips in some European countries, finding that the number of trips above 400 km varied significantly from country to country: 1.4 trips per year (Sweden), 1 (Germany and France), 0.9 (Great Britain, Switzerland, Finland, and Denmark), 0.8 (Ireland, Netherlands, Belgium, and Luxembourg), 0.6 (Spain and Austria), 0.3 (Greece), and 0.2 (Portugal). The results are aligned with the previous comment on the dependence on income, and can also be used to explain the obtained results on education, income, and employment status in our study.
6. Conclusions
This study analysed the hidden relationship between interurban transport and ICT use by a representative sample of EU citizens. We used sophisticated methods based on the fuzzy set theory to better handle the vague information provided in the answer format of the survey employed for the analysis. Two methods, the classical apostle model and the fuzzy clustering Eco-extended apostle model, were used to analyse the relationship between the two latent variables under study. Both methods appear to be suitable for the analysis of the categorical, Likert-scale variables used in the survey. The fuzzy approach handles the underlying uncertainty successfully and reduces the dimensionality of the dataset in an efficient manner.
This study breaks new ground by offering the first-ever analysis of its kind, paving the way for exciting future research. Its unique contributions lie in two key areas. First, this study employs a thoughtful dataset at the EU level, analysing two important latent variables, namely, LDT and ICT use. Second, the study utilizes cutting-edge methods (fuzzy hybrid analysis, fuzzy clustering, fuzzy clustering Eco-extended apostle model, and relative conditional probabilities) to analyse the relationship between both latent variables. This novel approach provides deeper insights than traditional methods and sets a precedent for future studies to adopt and adapt these techniques for further exploration.
The fuzzy clustering methods found that a minority group were responsible for the highly frequent long-distance travel in the EU, that a majority group do not make any type of these trips, and, in addition, that an important large group represents moderate long-distance travel characterised by a low figure of trips between 300 and 1000 km for leisure and personal motives. Aultman-Hall [42] named this minority group of citizens the “global mobile elite”. Ten items were analysed to study transport ICT adoption for navigation aid, PT, air transport, and toll collection. The cluster similarities were more spread than for the LDT case, but extreme values for the high and low ICT use were also found.
Our results showed that the low LDT and low ICT use category was more represented by females, older generations, low educational levels, and unemployed, part-time employed, or retired citizens. This category can be named digital-phobic settlers. Czepkiewicz et al. [49] studied five different explanation factors that determine long-distance travel ranging from socio-economic and demographic characteristics to lifestyles and social networks, and found that all the aspects affect travel activity. However, long-distance international travel was mainly determined by a cosmopolitan attitude and adequate language skills. Moreover, the high LDT and high ICT use category was positively associated with males, younger generations, higher educational levels, and full-time employed citizens. These results were partly found for each individual latent variable by other previous studies.
Besides being a first attempt to study the relationship between long-distance interurban transport and ICT transport adoption, this study is not exempt from a number of limitations that need to be addressed in future research. Firstly, the analysis might be partly determined by the existing outliers, probably due to the peculiar observations of ambassadors, EU parliamentarians, or salesmen in the survey of long-distance interurban transport. This analysis could be better addressed by making the distribution discrete by joining the numeric observation in a fixed number of categories such as 5- or 7-point scales. Secondly, another point to consider is that the Eco-extended apostle model, which uses fuzzy clustering, is based on an alpha coefficient of 0.5. However, exploring the adoption of other alpha parameters can help in analysing the robustness of the results, and it can also provide a deeper understanding of the pure categories. Thirdly, in light of the COVID-19 pandemic, the prevalence of ICT use has significantly grown, dominating daily activities such as e-commerce, e-work, and e-entertainment. This considerable surge in ICT usage may also impact other non-routine activities, such as the long-distance interurban transport (LDT). Consequently, the potential effects of this increased reliance on ICT on LDT and other non-routine activities could prove to be a fascinating research topic worthy of further investigation. Finally, this study only considered four socioeconomic variables, and it would be interesting to examine how other factors, like the country and city size of citizens, as well as their attitudes towards climate change, could also impact the relationship between LDT and ICT use.
Author Contributions
Conceptualisation, P.C., J.C.M. and C.R.; methodology, J.C.M.; software, J.C.M. and C.R.; validation, P.C., J.C.M. and C.R.; investigation, P.C., J.C.M. and C.R.; data curation, P.C., J.C.M. and C.R.; writing—original draft preparation, P.C., J.C.M. and C.R.; writing—review and editing, P.C., J.C.M. and C.R. All authors have read and agreed to the published version of the manuscript.
Funding
This research received no external funding.
Data Availability Statement
The data presented in this study are available on request from the corresponding author.
Conflicts of Interest
The authors declare no conflicts of interest.
References
- Gössling, S. ICT and Transport Behavior: A Conceptual Review. Int. J. Sustain. Transp. 2018, 12, 153–164. [Google Scholar] [CrossRef]
- Salomon, I. Telecommunications and Travel Relationships: A Review. Transp. Res. Part A Gen. 1986, 20, 223–238. [Google Scholar] [CrossRef]
- Kwan, M.P.; Dijst, M.; Schwanen, T. The Interaction between ICT and Human Activity-Travel Behavior. Transp. Res. Part A Policy Pract. 2007, 41, 121–124. [Google Scholar] [CrossRef]
- Saxena, S.; Mokhtarian, P.L. The Impact of Telecommuting on the Activity Spaces of Participants. Geogr. Anal. 1997, 29, 124–144. [Google Scholar] [CrossRef]
- Kogus, A.; Brůhová Foltýnová, H.; Gal-Tzur, A.; Shiftan, Y.; Vejchodská, E.; Shiftan, Y. Will COVID-19 Accelerate Telecommuting? A Cross-Country Evaluation for Israel and Czechia. Transp. Res. Part A Policy Pract. 2022, 164, 291–309. [Google Scholar] [CrossRef] [PubMed]
- Farag, S.; Schwanen, T.; Dijst, M.; Faber, J. Shopping Online and/or in-Store? A Structural Equation Model of the Relationships between e-Shopping and in-Store Shopping. Transp. Res. Part A Policy Pract. 2007, 41, 125–141. [Google Scholar] [CrossRef]
- Thomopoulos, N.; Givoni, M.; Rietveld, P. ICT for Transport: Opportunities and Threats. In ICT for Transport: Opportunities and Threats; Edward Elgar Publishing: Cheltenham, UK, 2015; pp. 1–316. ISBN 9781783471294. [Google Scholar]
- Magdolen, M.; von Behren, S.; Chlond, B.; Vortisch, P. Long-Distance Travel in Tension with Everyday Mobility of Urbanites—A Classification of Leisure Travellers. Travel Behav. Soc. 2022, 26, 290–300. [Google Scholar] [CrossRef]
- Dargay, J.M.; Clark, S. The Determinants of Long Distance Travel in Great Britain. Transp. Res. Part A Policy Pract. 2012, 46, 576–587. [Google Scholar] [CrossRef]
- Martín, J.C.; Nombela, G. Microeconomic Impacts of Investments in High Speed Trains in Spain. Ann. Reg. Sci. 2007, 41, 715–733. [Google Scholar] [CrossRef]
- Kuhnimhof, T.; Collet, R.; Armoogum, J.; Madre, J.L. Generating Internationally Comparable Figures on Long-Distance Travel for Europe. Transp. Res. Rec. 2009, 2105, 18–27. [Google Scholar] [CrossRef]
- Ahern, A.; Weyman, G.; Redelbach, M.; Schulz, A.; Akkermans, L.; Vannacci, L. OPTIMISM Deliverable 2.1: Gather and Analyze National Travel Statistics; European Commission FP7 Project: FP7-284892-OPTIMISM; European Commission: Brussels, Belgium, 2012. [Google Scholar]
- Stopher, P.R.; Greaves, S.P. Household Travel Surveys: Where are We Going? Transp. Res. Part A Policy Pract. 2007, 41, 367–381. [Google Scholar] [CrossRef]
- Fekih, M.; Bonnetain, L.; Furno, A.; Bonnel, P.; Smoreda, Z.; Galland, S.; Bellemans, T. Potential of Cellular Signaling Data for Time-of-Day Estimation and Spatial Classification of Travel Demand: A Large-Scale Comparative Study with Travel Survey and Land Use Data. Transp. Lett. 2022, 14, 787–805. [Google Scholar] [CrossRef]
- Kuppam, A.; Copperman, R.; Lemp, J.; Rossi, T.; Livshits, V.; Vallabhaneni, L.; Jeon, K.; Brown, E. Special Events Travel Surveys and Model Development. Transp. Lett. 2013, 5, 67–82. [Google Scholar] [CrossRef]
- Breyer, N.; Gundlegard, D.; Rydergren, C. Travel Mode Classification of Intercity Trips Using Cellular Network Data. Transp. Res. Procedia 2021, 52, 211–218. [Google Scholar] [CrossRef]
- Andersson, A.; Engelson, L.; Börjesson, M.; Daly, A.; Kristoffersson, I. Long-Distance Mode Choice Model Estimation Using Mobile Phone Network Data. J. Choice Model. 2022, 42, 1–11. [Google Scholar] [CrossRef]
- Wagner, P.; Banister, D.; Dreborg, K.; Eriksson, A.; Stead, D.; Weber, K.M.; Zoche, P.; Beckert, B.; Joisten, M.; Hommels, A.; et al. Impacts of ICTs on Transport and Mobility (ICTRANS). In (ICTRANS) Technical Report EUR 21058 EN; European Commission, Joint Research Centre: Brussels, Belgium, 2003. [Google Scholar]
- Banister, D.; Stead, D. Impact of Information and Communications Technology on Transport. Transp. Rev. 2004, 24, 611–632. [Google Scholar] [CrossRef]
- Wee, B. van Peak Car: The First Signs of a Shift towards ICT-Based Activities Replacing Travel? A Discussion Paper. Transp. Policy 2015, 42, 1–3. [Google Scholar] [CrossRef]
- Mokhtarian, P.L. If Telecommunication Is Such a Good Substitute for Travel, Why Does Congestion Continue to Get Worse? Transp. Lett. 2009, 1, 1–17. [Google Scholar] [CrossRef]
- Lyons, G. Viewpoint: Transport’s Digital Age Transition. J. Transp. Land Use 2014, 8, 1–19. [Google Scholar] [CrossRef]
- Bak, M.; Borkowski, P. Young Transport Users’ Perception of ICT Solutions Change. Soc. Sci. 2019, 8, 222. [Google Scholar] [CrossRef]
- Graham, D. Electronic Toll Collections and Smart City Payments. In Integrated Electronic Payment Technologies for Smart Cities; Springer International Publishing: Cham, Switzerland, 2023; pp. 25–45. [Google Scholar]
- Martin-Domingo, L.; Martín, J.C. Airport Mobile Internet an Innovation. J. Air Transp. Manag. 2016, 55, 102–112. [Google Scholar] [CrossRef]
- Díaz, E.; Martín-Consuegra, D. A Latent Class Segmentation Analysis of Airlines Based on Website Evaluation. J. Air Transp. Manag. 2016, 55, 20–40. [Google Scholar] [CrossRef]
- Tzeng, G.H.; Huang, J.J. Multiple Attribute Decision Making: Methods and Applications; Springer: New York, NY, USA, 2011; ISBN 9781439861585. [Google Scholar]
- Masud, A.S.M.; Ravi Ravindran, A. Multiple Criteria Decision Making; McGraw-Hill: New York, NY, USA, 2008; ISBN 9781420091830. [Google Scholar]
- Leon, S.; Martín, J.C. A Fuzzy Segmentation Analysis of Airline Passengers in the U.S. Based on Service Satisfaction. Res. Transp. Bus. Manag. 2020, 37, 100550. [Google Scholar] [CrossRef]
- Indelicato, A.; Martín, J.C. Are Citizens Credentialist or Post-Nationalists? A Fuzzy-Eco Apostle Model Applied to National Identity. Mathematics 2022, 10, 1978. [Google Scholar] [CrossRef]
- Martín, J.C.; Moreira, P.; Román, C. The Unstudied Effects of Wording and Answer Formats in the Analysis of Impartiality in Public Service Provision. PLoS ONE 2023, 18, e0288977. [Google Scholar] [CrossRef] [PubMed]
- Kruse, R.; Döring, C.; Lesot, M. Fundamentals of Fuzzy Clustering. In Advances in Fuzzy Clustering and its Applications; Wiley: Hoboken, NJ, USA, 2007; pp. 1–30. ISBN 9780470027608. [Google Scholar]
- Leisch, F. Bagged Clustering. Working Paper 51. SFB Adaptive Information Systems and Modelling in Economics and Management Science; WU Vienna University of Economics and Business: Vienna, Austria, 1999. [Google Scholar]
- D’Urso, P.; De Giovanni, L.; Disegna, M.; Massari, R. Bagged Clustering and Its Application to Tourism Market Segmentation. Expert Syst. Appl. 2013, 40, 4944–4956. [Google Scholar] [CrossRef]
- D’Urso, P.; Disegna, M.; Massari, R.; Osti, L. Fuzzy Segmentation of Postmodern Tourists. Tour. Manag. 2016, 55, 297–308. [Google Scholar] [CrossRef]
- D’Urso, P.; Disegna, M.; Massari, R.; Prayag, G. Bagged Fuzzy Clustering for Fuzzy Data: An Application to a Tourism Market. Knowledge-Based Syst. 2015, 73, 335–346. [Google Scholar] [CrossRef]
- Martín, J.C.; Moreira, P.; Román, C. A Hybrid-Fuzzy Segmentation Analysis of Residents’ Perception towards Tourism in Gran Canaria. Tour. Econ. 2020, 26, 1282–1304. [Google Scholar] [CrossRef]
- Jones, T.O.; Sasser, W.E. Why Satisfied Customers Defect. IEEE Eng. Manag. Rev. 1998, 26, 16–26. [Google Scholar] [CrossRef]
- Schaefer, V. Nature’s Apostles: A Model for Using Ecological Restoration to Teach Ecology. Am. Biol. Teach. 2013, 75, 417–419. [Google Scholar] [CrossRef]
- Davison, A.C.; Hinkley, D.V.; Young, G.A. Recent Developments in Bootstrap Methodology. Stat. Sci. 2003, 18, 141–157. [Google Scholar] [CrossRef]
- Hesterberg, T. Bootstrap. Wiley Interdiscip. Rev. Comput. Stat. 2011, 3, 497–526. [Google Scholar] [CrossRef]
- Aultman-Hall, L. Incorporating Long-Distance Travel into Transportation Planning in the United States; National Center for Sustainable Transportation: Davis, CA, USA, 2018. [Google Scholar]
- Frei, A.; Kuhnimhof, T.; Axhausen, K.W. Long-Distance Travel in Europe Today: Experiences with a New Survey; Arbeitsberichte Verkehrs-und Raumplanung: Zürich, Switzerland, 2010. [Google Scholar]
- LaMondia, J.J.; Aultman-Hall, L.; Greene, E. Long-Distance Work and Leisure Travel Frequencies Ordered Probit Analysis across Non-Distance-Based Definitions. Transp. Res. Rec. 2014, 2413, 1–12. [Google Scholar] [CrossRef]
- Van Acker, V.; Kessels, R.; Palhazi Cuervo, D.; Lannoo, S.; Witlox, F. Preferences for Long-Distance Coach Transport: Evidence from a Discrete Choice Experiment. Transp. Res. Part A Policy Pract. 2020, 132, 759–779. [Google Scholar] [CrossRef]
- Dal Fiore, F.; Mokhtarian, P.L.; Salomon, I.; Singer, M.E. “Nomads at Last”? A Set of Perspectives on How Mobile Technology May Affect Travel. J. Transp. Geogr. 2014, 41, 97–106. [Google Scholar] [CrossRef]
- Senbil, M.; Kitamura, R. The Use of Telecommunications Devices and Individual Activities Relationships. In Proceedings of the Transportation Research Board 82nd Annual Meeting, Washington, DC, USA, 12–16 January 2003; pp. 1–38. [Google Scholar]
- Jamal, S.; Habib, M.A. Investigation of the Use of Smartphone Applications for Trip Planning and Travel Outcomes. Transp. Plan. Technol. 2019, 42, 227–243. [Google Scholar] [CrossRef]
- Czepkiewicz, M.; Heinonen, J.; Næss, P.; Stefansdóttir, H. Who Travels More, and Why? A Mixed-Method Study of Urban Dwellers’ Leisure Travel. Travel Behav. Soc. 2020, 19, 67–81. [Google Scholar] [CrossRef]
Disclaimer/Publisher’s Note: The statements, opinions and data contained in all publications are solely those of the individual author(s) and contributor(s) and not of MDPI and/or the editor(s). MDPI and/or the editor(s) disclaim responsibility for any injury to people or property resulting from any ideas, methods, instructions or products referred to in the content. |
© 2024 by the authors. Licensee MDPI, Basel, Switzerland. This article is an open access article distributed under the terms and conditions of the Creative Commons Attribution (CC BY) license (https://creativecommons.org/licenses/by/4.0/).