
Allocating Benefits Due to Shared Resources Using Shapley Value and Nucleolus in Dynamic Network Data Envelopment Analysis

Abstract
1. Introduction
2. Literature Review
2.1. Dynamic DEA with Network Structure
2.2. Resource Sharing
2.3. Cooperative Games in the DEA Field

| Paper | Area | Objective | Game Approach | DEA Model | DMU | Inputs | Outputs | Link/ Stages |
|---|---|---|---|---|---|---|---|---|
| [61] | - | Allocating or imputing benefits | Shapley value and Nucleolus | CCR | - | - | - | - |
| [65] | - | Resource allocation | Shapley value and Nucleolus | CCR | - | - | - | - |
| [66] | - | Propose a cross-efficiency game | Shapley value | Cross efficiency | 5 | 3 | 2 | - |
| [67] | - | Importance of variables in DEA | Shapley value | Radial DEA | 8 | 6 | 2 | - |
| [68] | - | Investigate the benefits of sharing data among DMUs | Shapley value, Nucleolus, and τ-value | Cost DEA | 12 | 2 | 2 | - |
| [69] | - | Stable payoff allocation | Nucleolus | DEA production game | 3 | 2 | 2 | - |
| [70] | Energy | Increase DEA discrimination | Shapley value | MODEA | 20 | 13 | 3 | - |
| [63] | - | Resource allocation | Shapley value | CCR | 12 | 3 | 2 | - |
| [71] | Banks | Efficient DMU evaluation | Shapley value | Super efficiency | 14 | 3 | 3 | - |
| [3] | Paper Industry and Ports | Resource allocation | Shapley value | MILP DEA VRS | 8/28 | 4 | 2/3 | - |
| [72] | Banks | Efficient DMU evaluation | Shapley value | CCR | 14 | 3 | 2 | - |
| [59] | Energy | Resource allocation | Shapley value and Nucleolus | Cross efficiency | 4 | 4 | 3 | - |
| [62] | Banks | Resource allocation | Shapley value | Cross efficiency | 18 | 3 | 3 | - |
| [73] | Health | Fully ranking DMUs | Core and Shapley value | Cross efficiency | 288 | 3 | 4 | - |
| [74] | Environment | Cost savings allocation | Shapley value | CCR | 6 | 3 | 2 | - |
| [75] | Transportation | Fully ranking DMUs | Shapley Value | Cross efficiency | 9 | 7 | 2 | - |
| [76] | Manufacturing | Resource allocation | Nucleolus | Cross efficiency | 10 | 4 | 2 | - |
| [77] | Energy | Efficient DMU evaluation | Shapley value | Cross efficiency | 31 | 5 | 4 | - |
| [2] | - | Resource allocation | Shapley value | NDEA | 10 | 3 | 1 | 2/3 |
| [78] | Energy/Environment | Increase DEA discrimination | Shapley value | Cross-efficiency DEA Game | 17 | 1 | 13 | - |
| [79] | Environment | Resource allocation/target setting | Nucleolus | DDF DEA | 31 | 3 | 2 | - |
| [80] | Banks | Cost allocation | Shapley value | CCR | 5 | 2 | 1 | - |
| [60] | Banks | Resource/cost allocation | Nucleolus | NDEA | 27 | 3 | 2 | 3/2 |
| [81] | Cities development | Composite indicator construction | Shapley value | DEA Game | 13 | 1 | 68 | - |
| [82] | Banks | Efficient DMU evaluation | Shapley value | CCR | 14 | 3 | 2 | - |
| [83] | Environment | Resource allocation/target setting | Shapley value | Zero-sum DEA | 9 | 2 | 1 | - |
| [84] | Logistics/Environment | Resource allocation | Shapley value | CRS, VRS, and MRS DEA | 23 | 5 | 7 | - |
| [85] | Supply chain | Profit allocation | Shapley value and Nucleolus | Double level NDEA | 15 | 4 | 4 | 4 |
| [54] | Transportation | Resource allocation | Core, Shapley value, and Nucleolus | Parallel DEA | 8 | 5 | 3 | 3 |
| [55] | Hotel | Resource allocation | Shapley value | Parallel DEA | 7 | 3 | 2 | 2 |
| [86] | Mineral resources | Community partition | Shapley value | Revenue DEA | 31 | 2 | 3 | - |
| Torres and Ramos | - | Resource sharing and additional profit allocation | Shapley value and Nucleolus | DNDEA | 10 | 6 | 3 | 3/3 |
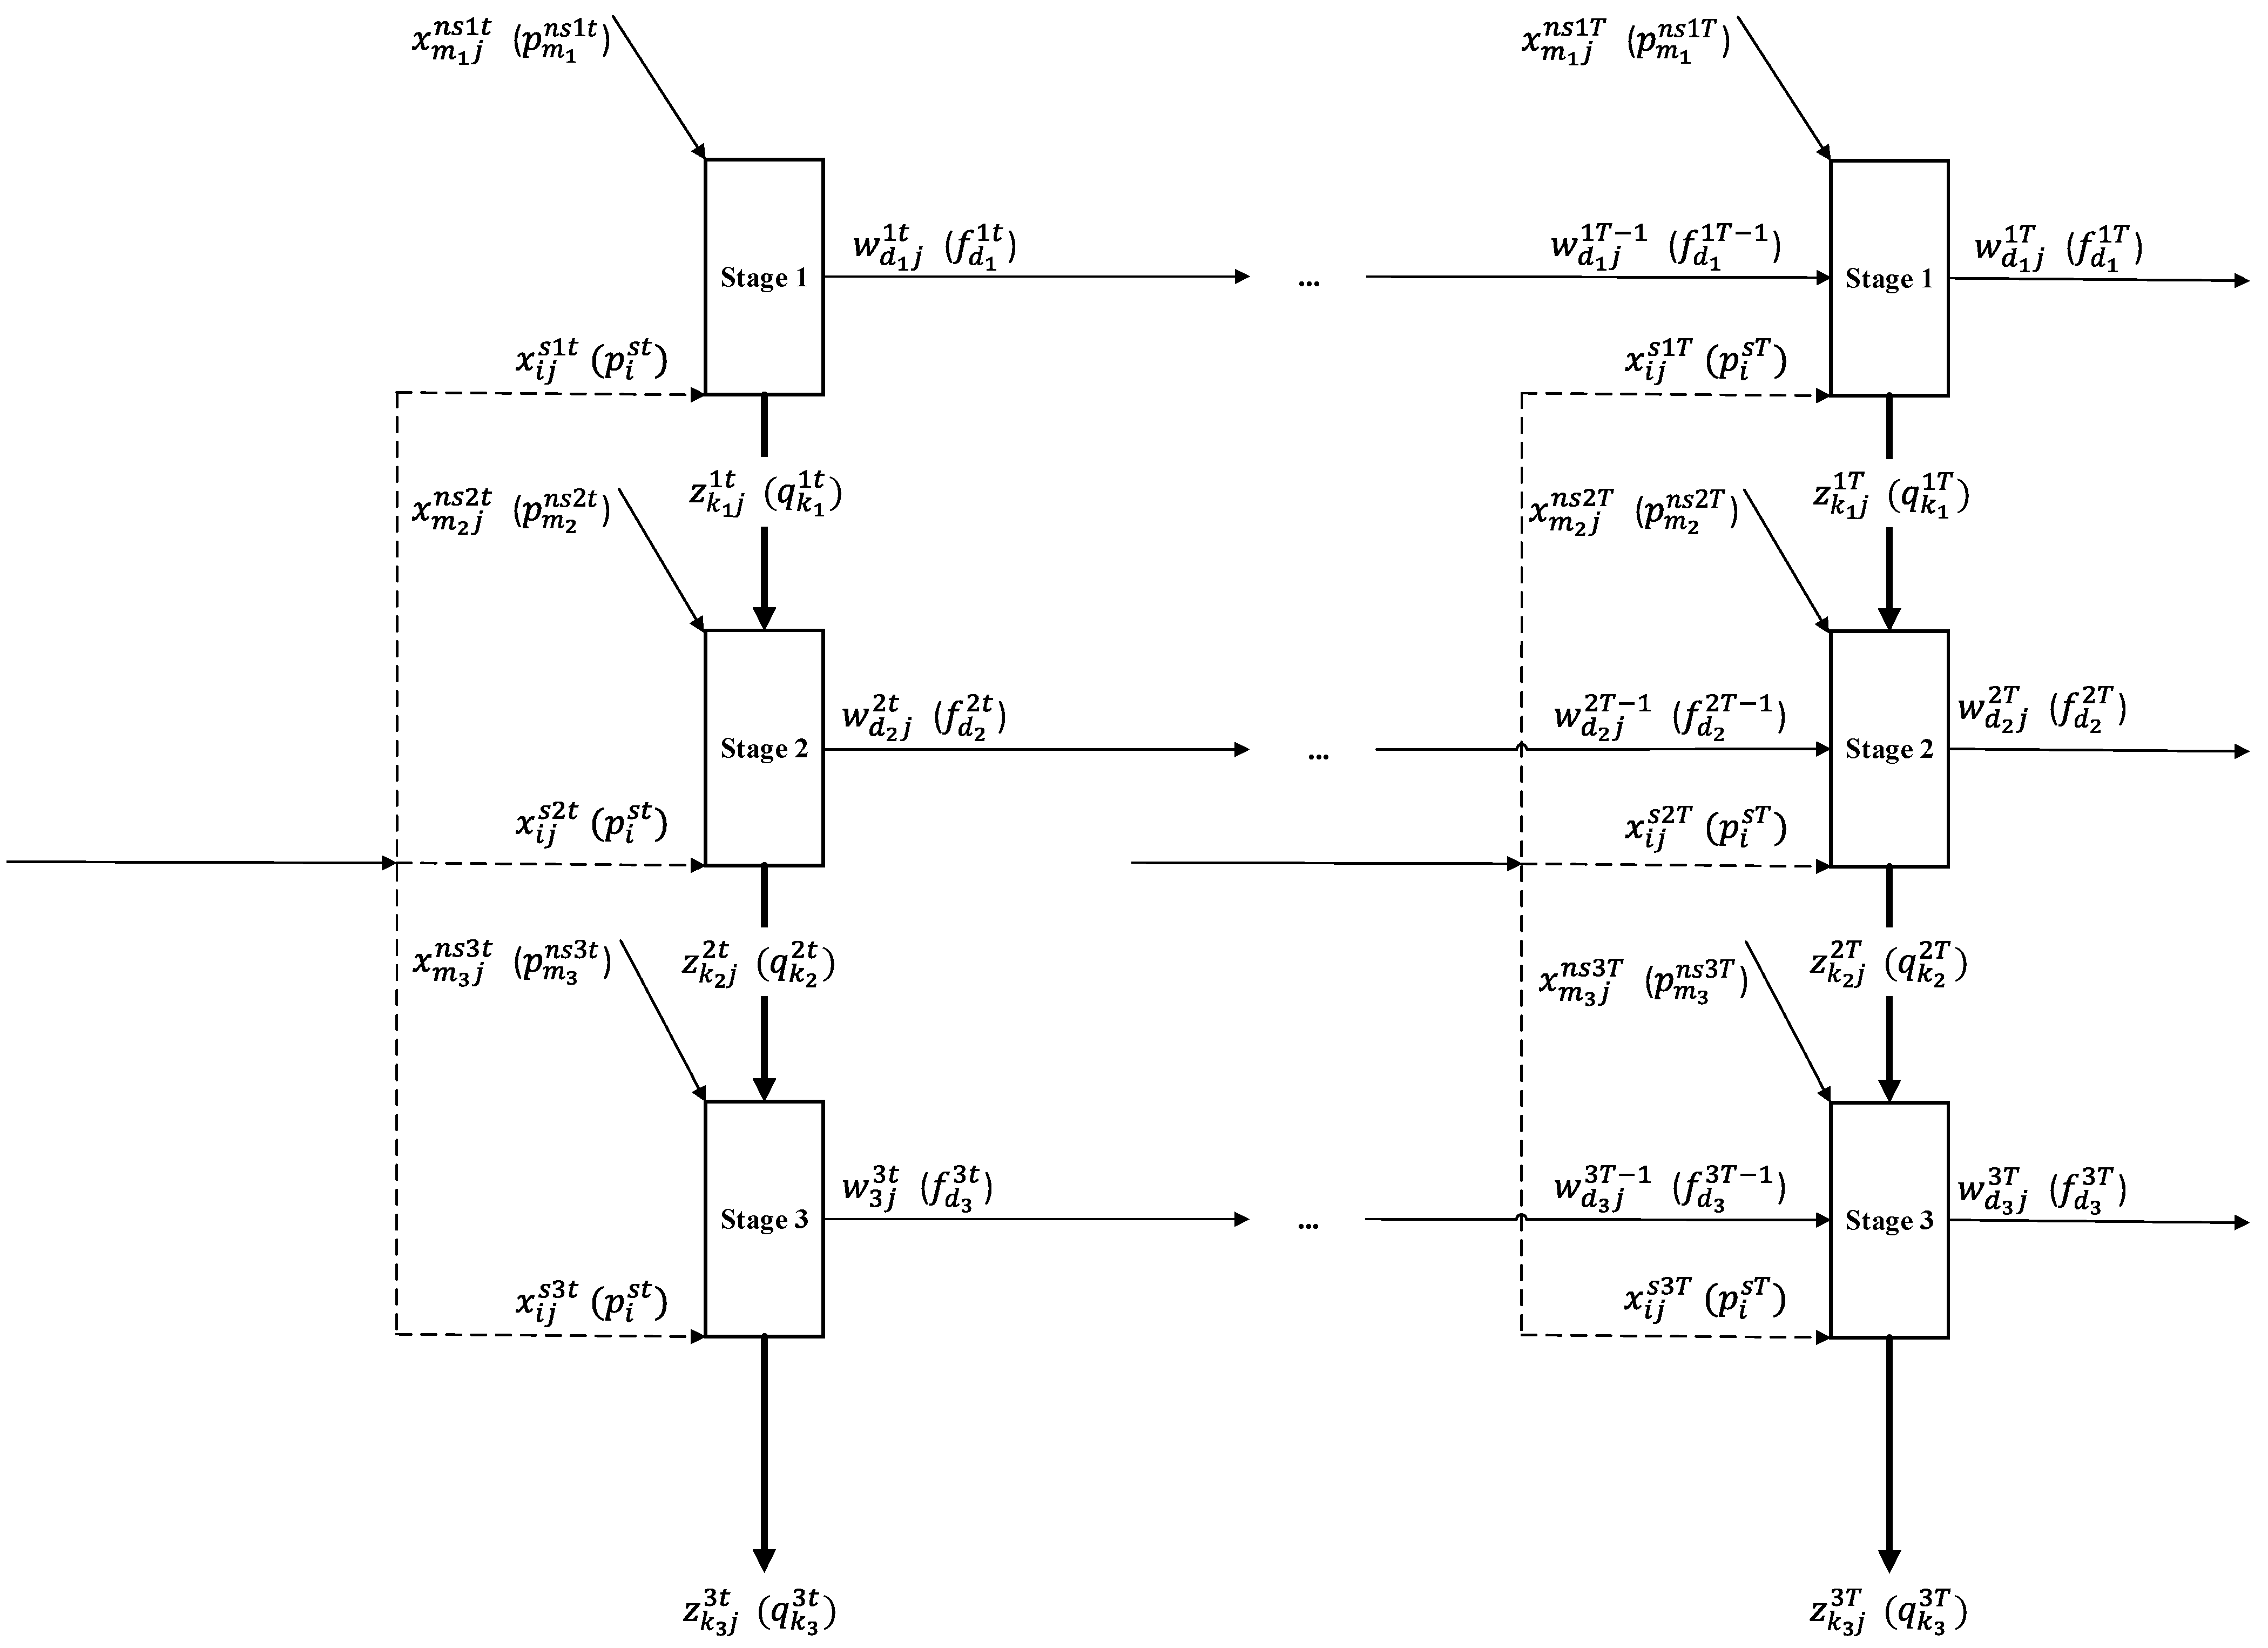
3. Resource Sharing in a Dynamic DEA Model with a Three-Stage Network
3.1. Analysis of the Pre-Collaboration between Stages
3.2. Post-Collaboration and Coalitions
3.3. Payoff Allocation Using Shapley Value and Nucleolus
4. Numerical Example
- Free carry-overs;
- Fixed carry-overs.
4.1. Characteristic Functions
4.2. Payoff Allocation with Shapley Value and Nucleolus
5. Conclusions
Author Contributions
Funding
Data Availability Statement
Acknowledgments
Conflicts of Interest
References
- An, Q.; Wen, Y.; Chu, J.; Chen, X. Profit Inefficiency Decomposition in a Serial-Structure System with Resource Sharing. J. Oper. Res. Soc. 2019, 70, 2112–2126. [Google Scholar] [CrossRef]
- An, Q.; Wen, Y.; Ding, T.; Li, Y. Resource Sharing and Payoff Allocation in a Three-Stage System: Integrating Network DEA with the Shapley Value Method. Omega 2019, 85, 16–25. [Google Scholar] [CrossRef]
- Wu, J.; Zhu, Q.; Cook, W.D.; Zhu, J. Best Cooperative Partner Selection and Input Resource Reallocation Using DEA. J. Oper. Res. Soc. 2016, 67, 1221–1237. [Google Scholar] [CrossRef]
- Charnes, A.; Cooper, W.W.; Rhodes, E. Measuring the Efficiency of Decision Making Units. Eur. J. Oper. Res. 1978, 2, 429–444. [Google Scholar] [CrossRef]
- Imanirad, R.; Cook, W.D.; Zhu, J. Partial Input to Output Impacts in DEA: Production Considerations and Resource Sharing among Business Subunits. Nav. Res. Logist. 2013, 60, 190–207. [Google Scholar] [CrossRef]
- Castelli, L.; Pesenti, R.; Ukovich, W. A Classification of DEA Models When the Internal Structure of the Decision Making Units Is Considered. Ann. Oper. Res. 2010, 173, 207–235. [Google Scholar] [CrossRef]
- Liu, J.; Lu, L.; Lu, W. Research Fronts in Data Envelopment Analysis. Omega 2016, 58, 33–45. [Google Scholar] [CrossRef]
- Tone, K.; Tsutsui, M. Network DEA: A Slacks-Based Measure Approach. Eur. J. Oper. Res. 2009, 197, 243–252. [Google Scholar] [CrossRef]
- Ma, J.; Qi, L.; Deng, L. Additive Centralized and Stackelberg DEA Models for Two-Stage System with Shared Resources. Int. Trans. Oper. Res. 2020, 27, 2211–2229. [Google Scholar] [CrossRef]
- Li, L.; Dai, Q.; Huang, H.; Wang, S. Efficiency Decomposition with Shared Inputs and Outputs in Two-Stage DEA. J. Syst. Sci. Syst. Eng. 2016, 25, 23–38. [Google Scholar] [CrossRef]
- Avilés-Sacoto, S.V.; Cook, W.D.; Güemes-Castorena, D.; Zhu, J. Measuring Efficiency in DEA in the Presence of Common Inputs. J. Oper. Res. Soc. 2020, 71, 1710–1722. [Google Scholar] [CrossRef]
- Imanirad, R.; Cook, W.D.; Aviles-Sacoto, S.V.; Zhu, J. Partial Input to Output Impacts in DEA: The Case of DMU-Specific Impacts. Eur. J. Oper. Res. 2015, 244, 837–844. [Google Scholar] [CrossRef]
- Tone, K.; Tsutsui, M. Dynamic DEA with Network Structure: A Slacks-Based Measure Approach. Omega 2014, 42, 124–131. [Google Scholar] [CrossRef]
- Soltanzadeh, E.; Omrani, H. Dynamic Network Data Envelopment Analysis Model with Fuzzy Inputs and Outputs: An Application for Iranian Airlines. Appl. Soft Comput. J. 2018, 63, 268–288. [Google Scholar] [CrossRef]
- Moreno, P.; Lozano, S. Super SBI Dynamic Network DEA Approach to Measuring Efficiency in the Provision of Public Services. Int. Trans. Oper. Res. 2018, 25, 715–735. [Google Scholar] [CrossRef]
- Yan, Q.; Zhao, F.; Wang, X.; Yang, G.; Baležentis, T.; Streimikiene, D. The Network Data Envelopment Analysis Models for Non-Homogenous Decision Making Units Based on the Sun Network Structure. Cent. Eur. J. Oper. Res. 2019, 27, 1221–1244. [Google Scholar] [CrossRef]
- Gharakhani, D.; Toloie Eshlaghy, A.; Fathi Hafshejani, K.; Kiani Mavi, R.; Hosseinzadeh Lotfi, F. Common Weights in Dynamic Network DEA with Goal Programming Approach for Performance Assessment of Insurance Companies in Iran. Manag. Res. Rev. 2018, 41, 920–938. [Google Scholar] [CrossRef]
- Chao, S.L.; Yu, M.M.; Hsieh, W.F. Evaluating the Efficiency of Major Container Shipping Companies: A Framework of Dynamic Network DEA with Shared Inputs. Transp. Res. Part A Policy Pract. 2018, 117, 44–57. [Google Scholar] [CrossRef]
- Zhou, X.; Xu, Z.; Chai, J.; Yao, L.; Wang, S.; Lev, B. Efficiency Evaluation for Banking Systems under Uncertainty. Omega 2019, 85, 68–82. [Google Scholar] [CrossRef]
- An, Q.; Meng, F.; Xiong, B.; Wang, Z.; Chen, X. Assessing the Relative Efficiency of Chinese High-Tech Industries: A Dynamic Network Data Envelopment Analysis Approach. Ann. Oper. Res. 2020, 290, 707–729. [Google Scholar] [CrossRef]
- Shapley, L. A Value for N-Person Games. Ann. Math. Stud. 1953, 28, 307–318. [Google Scholar]
- Schmeidler, D. The Nucleolus of a Characteristic Function Game. SIAM J. Appl. Math 1969, 17, 1163–1170. [Google Scholar] [CrossRef]
- Lozano, S.; Hinojosa, M.A.; Mármol, A.M.; Borrero, D.V. DEA and Cooperative Game Theory. In Handbook of Operations Analytics Using Data Envelopment Analysis; Springer: Berlin/Heidelberg, Germany, 2016; pp. 215–239. ISBN 9781489977052. [Google Scholar]
- Kao, C. Network Data Envelopment Analysis: A Review. Eur. J. Oper. Res. 2014, 239, 1–16. [Google Scholar] [CrossRef]
- Avkiran, N.K.; McCrystal, A. Intertemporal analysis of organizational productivity in residential aged care networks: Scenario analyses for setting policy targets. Health Care Manag. Sci. 2014, 17, 113–125. [Google Scholar] [CrossRef]
- Lozano, S. Technical and Environmental Efficiency of a Two-Stage Production and Abatement System. Ann. Oper. Res. 2017, 255, 199–219. [Google Scholar] [CrossRef]
- Kawaguchi, H.; Tone, K.; Tsutsui, M. Estimation of the Efficiency of Japanese Hospitals Using a Dynamic and Network Data Envelopment Analysis Model. Health Care Manag. Sci. 2014, 17, 101–112. [Google Scholar] [CrossRef]
- Mariz, F.B.A.R.; Almeida, M.R.; Aloise, D. A Review of Dynamic Data Envelopment Analysis: State of the Art and Applications. Int. Trans. Oper. Res. 2018, 25, 469–505. [Google Scholar] [CrossRef]
- Färe, R.; Grosskopf, S.; Whittaker, G. Network DEA II. In Data Envelopment Analysis: A Handbook on the Modeling of Internal Structures and Networks; Springer: Berlin/Heidelberg, Germany, 2014; Volume 208, pp. 307–327. ISBN 9780387452814. [Google Scholar]
- Chao, C.M.; Yu, M.M.; Wu, H.N. An Application of the Dynamic Network Dea Model: The Case of Banks in Taiwan. Emerg. Mark. Financ. Trade 2015, 51, S133–S151. [Google Scholar] [CrossRef]
- Khushalani, J.; Ozcan, Y.A. Are Hospitals Producing Quality Care Efficiently? An Analysis Using Dynamic Network Data Envelopment Analysis (DEA). Socioecon. Plann. Sci. 2017, 60, 15–23. [Google Scholar] [CrossRef]
- Chen, C.M. A Network-DEA Model with New Efficiency Measures to Incorporate the Dynamic Effect in Production Networks. Eur. J. Oper. Res. 2009, 194, 687–699. [Google Scholar] [CrossRef]
- See, K.F.; Md Hamzah, N.; Yu, M.M. Metafrontier Efficiency Analysis for Hospital Pharmacy Services Using Dynamic Network DEA Framework. Socioecon Plann. Sci. 2021, 78, 101044. [Google Scholar] [CrossRef]
- Fukuyama, H.; Weber, W.L. Measuring Japanese Bank Performance: A Dynamic Network DEA Approach. J. Product. Anal. 2015, 44, 249–264. [Google Scholar] [CrossRef]
- Losa, E.T.; Arjomandi, A.; Hervé Dakpo, K.; Bloomfield, J. Efficiency Comparison of Airline Groups in Annex 1 and Non-Annex 1 Countries: A Dynamic Network DEA Approach. Transp. Policy 2020, 99, 163–174. [Google Scholar] [CrossRef]
- Tran, C.-D. Efficiency of the Teaching-Industry Linkage in the Australian Vocational Education and Training. Empir. Res. Vocat. Educ. Train. 2021, 13, 11. [Google Scholar] [CrossRef]
- Lim, D.J.; Kim, M.S. Measuring Dynamic Efficiency with Variable Time Lag Effects. Omega 2022, 108, 102578. [Google Scholar] [CrossRef]
- Omrani, H.; Soltanzadeh, E. Dynamic DEA Models with Network Structure: An Application for Iranian Airlines. J. Air Transp. Manag. 2016, 57, 52–61. [Google Scholar] [CrossRef]
- Kalantary, M.; Farzipoor Saen, R. Assessing Sustainability of Supply Chains: An Inverse Network Dynamic DEA Model. Comput. Ind. Eng. 2019, 135, 1224–1238. [Google Scholar] [CrossRef]
- Chang, T.S.; Tone, K.; Wu, C.H. Nested Dynamic Network Data Envelopment Analysis Models with Infinitely Many Decision Making Units for Portfolio Evaluation. Eur. J. Oper. Res. 2021, 291, 766–781. [Google Scholar] [CrossRef]
- Lin, R.; Liu, Q. Multiplier Dynamic Data Envelopment Analysis Based on Directional Distance Function: An Application to Mutual Funds. Eur. J. Oper. Res. 2021, 293, 1043–1057. [Google Scholar] [CrossRef]
- Yu, M.M.; Chen, L.H.; Hsiao, B. Dynamic Performance Assessment of Bus Transit with the Multi-Activity Network Structure. Omega 2016, 60, 15–25. [Google Scholar] [CrossRef]
- Beasley, J.E. Determining Teaching and Research Efficiencies. J. Oper. Res. Soc. 1995, 46, 441–452. [Google Scholar] [CrossRef]
- Cook, W.D.; Hababou, M.; Tuenter, H. Multicomponent Efficiency Measurement and Shared Inputs in Data Envelopment Analysis: An Applicattion to Sales and Service Performance in Bank Branches. J. Product. Anal. 2000, 14, 209–224. [Google Scholar] [CrossRef]
- Cook, W.D.; Hababou, M. Sales Performance Measurement in Bank Branches. Omega 2001, 29, 299–307. [Google Scholar] [CrossRef]
- Jahanshahloo, G.R.; Amirteimoori, A.R.; Kordrostami, S. Measuring the Multi-Component Efficiency with Shared Inputs and Outputs in Data Envelopment Analysis. Appl. Math. Comput. 2004, 155, 283–293. [Google Scholar] [CrossRef]
- Zha, Y.; Liang, L. Two-Stage Cooperation Model with Input Freely Distributed among the Stages. Eur. J. Oper. Res. 2010, 205, 332–338. [Google Scholar] [CrossRef]
- Chen, Y.; Du, J.; David Sherman, H.; Zhu, J. DEA Model with Shared Resources and Efficiency Decomposition. Eur. J. Oper. Res. 2010, 207, 339–349. [Google Scholar] [CrossRef]
- Kao, C.; Hwang, S.N. Efficiency Decomposition in Two-Stage Data Envelopment Analysis: An Application to Non-Life Insurance Companies in Taiwan. Eur. J. Oper. Res. 2008, 185, 418–429. [Google Scholar] [CrossRef]
- Ma, J. A Two-Stage DEA Model Considering Shared Inputs and Free Intermediate Measures. Expert Syst. Appl. 2015, 42, 4339–4347. [Google Scholar] [CrossRef]
- Bian, Y.; Hu, M.; Xu, H. Measuring Efficiencies of Parallel Systems with Shared Inputs/Outputs Using Data Envelopment Analysis. Kybernetes 2015, 44, 336–352. [Google Scholar] [CrossRef]
- Toloo, M.; Emrouznejad, A.; Moreno, P. A Linear Relational DEA Model to Evaluate Two-Stage Processes with Shared Inputs. Comput. Appl. Math. 2017, 36, 45–61. [Google Scholar] [CrossRef]
- Wu, J.; Xiong, B.; An, Q.; Sun, J.; Wu, H. Total-Factor Energy Efficiency Evaluation of Chinese Industry by Using Two-Stage DEA Model with Shared Inputs. Ann. Oper. Res. 2017, 255, 257–276. [Google Scholar] [CrossRef]
- Wen, Y.; Hu, J.; An, Q.; Gong, Y. Gain Measurement and Payoff Allocation for the Internal Resource Sharing Based on DEA Approach. J. Oper. Res. Soc. 2022, 74, 1105–1117. [Google Scholar] [CrossRef]
- Wen, Y.; Hu, J.; An, Q.; Ang, S. Cooperative Performance Evaluation among Homogeneous Parallel Decision Making Units with Coalition Structures. Comput. Ind. Eng. 2022, 168, 108103. [Google Scholar] [CrossRef]
- Yu, M.M.; Lin, E.T.J. Efficiency and Effectiveness in Railway Performance Using a Multi-Activity Network DEA Model. Omega 2008, 36, 1005–1017. [Google Scholar] [CrossRef]
- Banker, R.D. A Game Theoretic Approach to Measuring Efficiency. Eur. J. Oper. Res. 1980, 5, 262–266. [Google Scholar] [CrossRef]
- Banker, R.D.; Charnes, A.; Cooper, W.W.; Clarke, R. Constrained Game Formulations and Interpretations for Data Envelopment Analysis. Eur. J. Oper. Res. 1989, 40, 299–308. [Google Scholar] [CrossRef]
- Zhang, W.; Wang, X.; Qi, T.; Wu, X. Transmission Cost Allocation Based on Data Envelopment Analysis and Cooperative Game Method. Electr. Power Compon. Syst. 2018, 46, 208–217. [Google Scholar] [CrossRef]
- An, Q.; Wang, P.; Shi, S. Fixed Cost Allocation for Two-Stage Systems with Cooperative Relationship Using Data Envelopment Analysis. Comput. Ind. Eng. 2020, 145, 106534. [Google Scholar] [CrossRef]
- Nakabayashi, K.; Tone, K. Egoist’s Dilemma: A DEA Game. Omega 2006, 34, 135–148. [Google Scholar] [CrossRef]
- Li, F.; Zhu, Q.; Liang, L. Allocating a Fixed Cost Based on a DEA-Game Cross Efficiency Approach. Expert Syst. Appl. 2018, 96, 196–207. [Google Scholar] [CrossRef]
- Yang, Z.; Zhang, Q. Resource Allocation Based on DEA and Modified Shapley Value. Appl. Math. Comput. 2015, 263, 280–286. [Google Scholar] [CrossRef]
- Emrouznejad, A.; Yang, G.-L. A Survey and Analysis of the First 40 Years of Scholarly Literature in DEA: 1978–2016. Socioecon. Plann. Sci. 2018, 61, 4–8. [Google Scholar] [CrossRef]
- Nakabayashi, K.; Sahoo, B.; Tone, K. Fair Allocation Based on Two Criteria:A DEA Game View of “Add Them up and Divide by Two”. J. Oper. Res. Soc. Jpn. 2009, 52, 131–146. [Google Scholar]
- Wu, J.; Liang, L.; Yang, F. Determination of the Weights for the Ultimate Cross Efficiency Using Shapley Value in Cooperative Game. Expert Syst. Appl. 2009, 36, 872–876. [Google Scholar] [CrossRef]
- Li, Y.; Liang, L. A Shapley Value Index on the Importance of Variables in DEA Models. Expert Syst. Appl. 2010, 37, 6287–6292. [Google Scholar] [CrossRef]
- Lozano, S. Information Sharing in DEA: A Cooperative Game Theory Approach. Eur. J. Oper. Res. 2012, 222, 558–565. [Google Scholar] [CrossRef]
- Lozano, S.; Hinojosa, M.A.; Mármol, A.M. Set-Valued DEA Production Games. Omega 2015, 52, 92–100. [Google Scholar] [CrossRef]
- Rezaee, M.J. Using Shapley Value in Multi-Objective Data Envelopment Analysis: Power Plants Evaluation with Multiple Frontiers. Int. J. Electr. Power Energy Syst. 2015, 69, 141–149. [Google Scholar] [CrossRef]
- Li, Y.; Xie, J.; Wang, M.; Liang, L. Super Efficiency Evaluation Using a Common Platform on a Cooperative Game. Eur. J. Oper. Res. 2016, 255, 884–892. [Google Scholar] [CrossRef]
- Hinojosa, M.A.; Lozano, S.; Borrero, D.V.; Mármol, A.M. Ranking Efficient DMUs Using Cooperative Game Theory. Expert Syst. Appl. 2017, 80, 273–283. [Google Scholar] [CrossRef]
- Omrani, H.; Shafaat, K.; Emrouznejad, A. An Integrated Fuzzy Clustering Cooperative Game Data Envelopment Analysis Model with Application in Hospital Efficiency. Expert Syst. Appl. 2018, 114, 615–628. [Google Scholar] [CrossRef]
- He, W.; Yang, Y.; Wang, Z.; Zhu, J. Estimation and Allocation of Cost Savings from Collaborative CO2 Abatement in China. Energy Econ. 2018, 72, 62–74. [Google Scholar] [CrossRef]
- Lin, Y.; Liu, W.L.; Wang, Y.M. An Integrated Approach Using Cross-Efficiency and Shapley Value in Performance Evaluation. Econ. Comput. Econ. Cybern. Stud. Res. 2019, 53, 209–224. [Google Scholar] [CrossRef]
- Li, Y.; Li, F.; Emrouznejad, A.; Liang, L.; Xie, Q. Allocating the Fixed Cost: An Approach Based on Data Envelopment Analysis and Cooperative Game. Ann. Oper. Res. 2019, 274, 373–394. [Google Scholar] [CrossRef]
- Omrani, H.; Shafaat, K.; Alizadeh, A. Integrated Data Envelopment Analysis and Cooperative Game for Evaluating Energy Efficiency of Transportation Sector: A Case of Iran. Ann. Oper. Res. 2019, 274, 471–499. [Google Scholar] [CrossRef]
- Omrani, H.; Amini, M.; Babaei, M.; Shafaat, K. Use Shapley Value for Increasing Power Distinguish of Data Envelopment Analysis Model: An Application for Estimating Environmental Efficiency of Industrial Producers in Iran. Energy Environ. 2020, 31, 656–675. [Google Scholar] [CrossRef]
- Li, F.; Emrouznejad, A.; Yang, G.L.; Li, Y. Carbon Emission Abatement Quota Allocation in Chinese Manufacturing Industries: An Integrated Cooperative Game Data Envelopment Analysis Approach. J. Oper. Res. Soc. 2020, 71, 1259–1288. [Google Scholar] [CrossRef]
- Meng, F.; Wu, L.; Chu, J. Allocating the Fixed Cost Based on Data Envelopment Analysis in View of the Shapley Value. Expert Syst. 2020, 37, e12539. [Google Scholar] [CrossRef]
- Omrani, H.; Fahimi, P.; Mahmoodi, A. A Data Envelopment Analysis Game Theory Approach for Constructing Composite Indicator: An Application to Find out Development Degree of Cities in West Azarbaijan Province of Iran. Socioecon. Plann. Sci. 2020, 69, 100675. [Google Scholar] [CrossRef]
- Banihashemi, S.A.; Khalilzadeh, M. A New Approach for Ranking Efficient DMUs with Data Envelopment Analysis. World J. Eng. 2020, 17, 573–583. [Google Scholar] [CrossRef]
- Li, Z.; Zhao, T.; Wang, J.; Cui, X. Two-Step Allocation of CO2 Emission Quotas in China Based on Multi-Principles: Going Regional to Provincial. J. Clean. Prod. 2021, 305, 127173. [Google Scholar] [CrossRef]
- Zhuang, Z.; Fu, S.; Lan, S.; Yu, H.; Yang, C.; Huang, G.Q. Research on Economic Benefits of Multi-City Logistics Development Based on Data-Driven Analysis. Adv. Eng. Inform. 2021, 49, 101322. [Google Scholar] [CrossRef]
- Wen, Y.; An, Q.; Hu, J.; Chen, X. DEA Game for Internal Cooperation between an Upper-Level Process and Multiple Lower-Level Processes. J. Oper. Res. Soc. 2022, 73, 1949–1960. [Google Scholar] [CrossRef]
- An, Q.; Wang, P.; Zeng, Y.; Dai, Y. Cooperative Social Network Community Partition: A Data Envelopment Analysis Approach. Comput. Ind. Eng. 2022, 172, 108658. [Google Scholar] [CrossRef]
- Peng, X.; Cui, H. Incentive Policy Research on the Excess Profit Allocation in Wind Power Projects Based on DEA Game. J. Energy Eng. 2016, 142, 04015019. [Google Scholar] [CrossRef]
- Lozano, S. DEA Production Games. Eur. J. Oper. Res. 2013, 231, 405–413. [Google Scholar] [CrossRef]
- Ratner, S.V.; Shaposhnikov, A.M.; Lychev, A.V. Network DEA and Its Applications (2017–2022): A Systematic Literature Review. Mathematics 2023, 11, 2141. [Google Scholar] [CrossRef]
- Camanho, A.S.; Silva, M.C.; Piran, F.S.; Lacerda, D.P. A Literature Review of Economic Efficiency Assessments Using Data Envelopment Analysis. Eur. J. Oper. Res. 2023, 315, 1–18. [Google Scholar] [CrossRef]
| Indexes | |
| Index of the jth DMU; | |
| Index of the tth period; | |
| Index of the lth stage; | |
| Index of the ith shared input between stages; | |
| Index of the mth specific input of stage ; | |
| Index of the kth output produced by stage ; | |
| Index of the dth carry-over connecting stage l between periods; | |
| Parameters | |
| /// | The unit price of the ith shared input in period t; the mth specific input of stage in period t; the kth output of the stage l in period t; the dth carry-over connecting stage l between consecutive periods t and t + 1; |
| /// | The ith shared input of DMU j for stage in period ; the specif input of DMU j for stage in period ; the kth output of DMU j for stage ; the dth carry-over connecting stage l between consecutive periods; |
| Coalition | |
| Variables | |
| / | Index of multiplier variable corresponding to the stage l in period t of DMU j before/after resource sharing; |
| /// | The index of ith shared input of DMU j for stage in period ; the specif input of DMU j for stage in period ; the kth output of DMU j for stage ; the dth carry-over connecting stage l between consecutive periods in the optimal situation before resource sharing; |
| /// | The index of ith shared input of DMU j for stage in period ; the specif input of DMU j for stage in period ; the kth output of DMU j for stage ; the dth carry-over connecting stage l between consecutive periods in the optimal situation after resource sharing. |
| t = 1 | DMU | 1 | 2 | 3 | 4 | 5 | 6 | 7 | 8 | 9 | 10 | Unit Price |
| Stage 1 | I = 2 | 18.49 | 11.42 | 11.18 | 5.56 | 1.86 | 13.74 | 5.48 | 21.79 | 9.06 | 3.01 | 9.99 |
| 1.53 | 3.91 | 11.05 | 2.29 | 21.63 | 1.36 | 1.02 | 1.15 | 7.10 | 9.11 | 8.58 | ||
| M = 1 | 15.95 | 7.26 | 10.11 | 2.85 | 8.44 | 1.53 | 12.90 | 3.54 | 6.91 | 12.34 | 1.56 | |
| K = 1 | 23.23 | 17.36 | 26.98 | 1.28 | 12.93 | 13.29 | 10.68 | 20.68 | 20.71 | 8.59 | 0 | |
| C = 1 | 18.91 | 21.81 | 13.70 | 21.54 | 19.58 | 20.87 | 11.97 | 10.30 | 27.70 | 21.84 | 10.8 | |
| Stage 2 | I = 2 | 1.68 | 2.64 | 11.29 | 3.97 | 18.63 | 2.17 | 7.35 | 1.23 | 2.81 | 2.61 | 9.99 |
| 6.58 | 12.00 | 2.22 | 8.39 | 4.25 | 10.06 | 14.52 | 1.23 | 16.89 | 9.62 | 8.58 | ||
| M = 1 | 1.02 | 2.13 | 3.87 | 2.35 | 1.64 | 1.12 | 2.06 | 1.81 | 1.32 | 1.49 | 9.12 | |
| K = 1 | 14.62 | 16.91 | 18.63 | 6.62 | 16.96 | 12.85 | 16.64 | 11.94 | 20.01 | 13.57 | 0 | |
| C = 1 | 28.51 | 13.77 | 7.70 | 22.37 | 15.82 | 22.53 | 3.16 | 23.58 | 14.63 | 21.97 | 6.29 | |
| Stage 3 | I = 2 | 2.13 | 17.10 | 1.28 | 5.40 | 3.01 | 19.08 | 4.17 | 1.01 | 4.22 | 6.72 | 9.99 |
| 10.10 | 3.93 | 9.40 | 1.44 | 2.99 | 2.20 | 1.56 | 18.11 | 1.02 | 2.35 | 8.58 | ||
| M = 1 | 4.10 | 1.15 | 3.42 | 3.26 | 1.46 | 2.32 | 2.29 | 1.09 | 1.55 | 2.41 | 2.52 | |
| K = 1 | 27.49 | 30.18 | 30.91 | 16.38 | 29.55 | 25.26 | 26.23 | 29.75 | 26.99 | 25.96 | 8.83 | |
| C = 1 | 1.04 | 23.46 | 12.42 | 3.32 | 12.67 | 29.62 | 22.34 | 13.30 | 6.88 | 24.74 | 8.73 | |
| t = 2 | DMU | 1 | 2 | 3 | 4 | 5 | 6 | 7 | 8 | 9 | 10 | Unit Price |
| Stage 1 | I = 2 | 11.94 | 7.29 | 25.28 | 2.09 | 20.78 | 26.41 | 22.70 | 8.59 | 10.03 | 26.50 | 8.8 |
| 4.89 | 30.69 | 6.13 | 2.58 | 22.67 | 12.02 | 7.35 | 8.25 | 4.61 | 27.63 | 8.39 | ||
| M = 1 | 17.57 | 14.04 | 28.81 | 29.01 | 22.96 | 28.59 | 3.72 | 11.87 | 30.48 | 20.35 | 1.84 | |
| K = 1 | 8.39 | 4.98 | 9.67 | 1.18 | 17.5 | 13.86 | 25.64 | 18.83 | 26.13 | 1.11 | 0 | |
| C = 1 | 8.52 | 23.22 | 26.73 | 26.71 | 5.12 | 1.91 | 3.90 | 21.40 | 16.44 | 20.52 | 5.05 | |
| Stage 2 | I = 2 | 21.30 | 13.26 | 16.05 | 29.10 | 19.11 | 7.24 | 30.54 | 30.34 | 16.93 | 28.41 | 8.8 |
| 30.01 | 15.08 | 14.53 | 24.70 | 29.58 | 21.23 | 19.42 | 11.96 | 27.53 | 6.30 | 8.39 | ||
| M = 1 | 4.16 | 25.72 | 3.49 | 28.40 | 4.18 | 18.73 | 23.48 | 2.16 | 12.55 | 8.86 | 7.32 | |
| K = 1 | 15.83 | 15.86 | 9.14 | 8.66 | 21.51 | 25.13 | 7.78 | 13.62 | 6.59 | 26.67 | 0 | |
| C = 1 | 24.31 | 25.60 | 10.23 | 22.51 | 14.51 | 24.27 | 4.72 | 23.14 | 2.35 | 7.28 | 4.20 | |
| Stage 3 | I = 2 | 30.03 | 22.52 | 19.62 | 4.71 | 14.20 | 20.77 | 26.30 | 24.07 | 2.91 | 28.97 | 8.8 |
| 30.48 | 13.06 | 17.31 | 22.21 | 11.21 | 27.25 | 25.71 | 23.98 | 8.05 | 18.67 | 8.39 | ||
| M = 1 | 4.65 | 5.02 | 27.26 | 21.91 | 12.51 | 18.44 | 4.94 | 25.56 | 13.19 | 28.10 | 1.95 | |
| K = 1 | 14.43 | 26.70 | 29.43 | 25.12 | 26.82 | 11.04 | 1.15 | 29.26 | 26.11 | 16.95 | 10.91 | |
| C = 1 | 15.00 | 20.76 | 28.94 | 16.62 | 8.74 | 5.63 | 7.00 | 10.51 | 20.76 | 13.26 | 9.69 |
| Case 1: Fixed Carry-Overs | ||||||||||
| Characteristic Function | DMU1 | DMU2 | DMU3 | DMU4 | DMU5 | DMU6 | DMU7 | DMU8 | DMU9 | DMU10 |
| 0.00 | 0.00 | 0.00 | 0.00 | 0.00 | 0.00 | 0.00 | 0.00 | 0.00 | 0.00 | |
| 0.00 | 0.00 | 0.00 | 0.00 | 0.00 | 0.00 | 0.00 | 0.00 | 0.00 | 0.00 | |
| 0.00 | 0.00 | 0.00 | 0.00 | 0.00 | 0.00 | 0.00 | 0.00 | 0.00 | 0.00 | |
| 162.29 | 204.46 | 228.36 | 433.21 | 766.91 | 804.75 | 307.40 | 0.00 | 200.69 | 0.00 | |
| 0.00 | 0.00 | 0.00 | 233.16 | 766.91 | 0.00 | 307.40 | 0.04 | 309.86 | 0.00 | |
| 0.00 | 389.88 | 0.00 | 254.81 | 766.91 | 850.96 | 307.40 | 0.00 | 168.36 | 0.00 | |
| 221.21 | 389.88 | 228.36 | 460.67 | 766.91 | 850.96 | 307.40 | 76.38 | 350.23 | 0.00 | |
| 58.92 | 185.42 | 0.00 | 27.46 | 0.00 | 46.20 | 0.00 | 76.38 | 149.54 | 0.00 | |
| 221.21 | 0.00 | 228.36 | 205.86 | 0.00 | 0.00 | 0.00 | 76.38 | 181.87 | 0.00 | |
| 221.21 | 389.88 | 228.36 | 227.51 | 0.00 | 850.96 | 0.00 | 76.34 | 40.38 | 0.00 | |
| Case 2: Free Carry-Overs | ||||||||||
| Characteristic Function | DMU1 | DMU2 | DMU3 | DMU4 | DMU5 | DMU6 | DMU7 | DMU8 | DMU9 | DMU10 |
| 0.00 | 0.00 | 0.00 | 0.00 | 0.00 | 0.00 | 0.00 | 0.00 | 0.00 | 0.00 | |
| 0.00 | 0.00 | 0.00 | 0.00 | 0.00 | 0.00 | 0.00 | 0.00 | 0.00 | 0.00 | |
| 0.00 | 0.00 | 0.00 | 0.00 | 0.00 | 0.00 | 0.00 | 0.00 | 0.00 | 0.00 | |
| 125.97 | 259.95 | 346.04 | 282.81 | 295.22 | 138.22 | 820.61 | 408.94 | 93.34 | 20.04 | |
| 0.00 | 1.10 | 477.91 | 0.00 | 356.45 | 138.22 | 0.00 | 408.94 | 170.68 | 42.04 | |
| 0.00 | 1.10 | 491.43 | 0.00 | 356.45 | 138.22 | 862.95 | 408.94 | 171.01 | 20.04 | |
| 125.97 | 259.95 | 491.43 | 282.81 | 532.88 | 138.22 | 862.95 | 408.94 | 171.01 | 45.73 | |
| 0.00 | 0.00 | 145.39 | 0.00 | 237.65 | 0.00 | 42.34 | 0.00 | 77.67 | 25.69 | |
| 125.97 | 258.85 | 0.00 | 282.81 | 176.43 | 0.00 | 0.00 | 0.00 | 0.00 | 25.69 | |
| 125.97 | 258.85 | 13.53 | 282.81 | 176.43 | 0.00 | 862.95 | 0.00 | 0.34 | 3.69 | |
| Case 1: Fixed Carry-Overs | ||||||||||
| Shapley Value | DMU 1 | DMU 2 | DMU 3 | DMU 4 | DMU 5 | DMU 6 | DMU 7 | DMU 8 | DMU 9 | DMU 10 |
| Stage 1 | 100.79 | 34.08 | 114.18 | 179.68 | 255.64 | 134.13 | 102.47 | 25.47 | 145.72 | 0.00 |
| Stage 2 | 100.79 | 229.02 | 114.18 | 190.51 | 255.64 | 559.60 | 102.47 | 25.45 | 74.97 | 0.00 |
| Stage 3 | 19.64 | 126.79 | 0.00 | 90.48 | 255.64 | 157.23 | 102.47 | 25.47 | 129.55 | 0.00 |
| Case 2: Free Carry-Overs | ||||||||||
| Shapley Value | DMU 1 | DMU 2 | DMU 3 | DMU 4 | DMU 5 | DMU 6 | DMU 7 | DMU 8 | DMU 9 | DMU 10 |
| Stage 1 | 62.98 | 129.79 | 137.33 | 141.40 | 167.42 | 46.07 | 136.77 | 136.31 | 44.00 | 18.91 |
| Stage 2 | 62.98 | 129.79 | 144.09 | 141.40 | 167.42 | 46.07 | 568.24 | 136.31 | 44.17 | 7.91 |
| Stage 3 | 0.00 | 0.37 | 210.02 | 0.00 | 198.03 | 46.07 | 157.94 | 136.31 | 82.84 | 18.91 |
| Case 1: Fixed Carry-Overs | ||||||||||
| Nucleolus | DMU 1 | DMU 2 | DMU 3 | DMU 4 | DMU 5 | DMU 6 | DMU 7 | DMU 8 | DMU 9 | DMU 10 |
| Stage 1 | 95.88 | 0.00 | 114.18 | 205.81 | 255.64 | 0.00 | 102.47 | 25.47 | 174.69 | 0.00 |
| Stage 2 | 95.88 | 297.17 | 114.18 | 227.46 | 255.64 | 827.86 | 102.47 | 25.47 | 33.19 | 0.00 |
| Stage 3 | 29.46 | 92.71 | 0.00 | 27.41 | 255.64 | 23.11 | 102.47 | 25.47 | 142.36 | 0.00 |
| Case 2: Free Carry-Overs | ||||||||||
| Nucleolus | DMU 1 | DMU 2 | DMU 3 | DMU 4 | DMU 5 | DMU 6 | DMU 7 | DMU 8 | DMU 9 | DMU 10 |
| Stage 1 | 62.99 | 129.98 | 110.84 | 141.41 | 157.22 | 46.07 | 0.00 | 136.31 | 31.00 | 21.94 |
| Stage 2 | 62.99 | 129.98 | 124.36 | 141.41 | 157.22 | 46.07 | 841.78 | 136.31 | 31.33 | 1.85 |
| Stage 3 | 0.00 | 0.00 | 256.23 | 0.00 | 218.45 | 46.07 | 21.17 | 136.31 | 108.67 | 21.94 |
Disclaimer/Publisher’s Note: The statements, opinions and data contained in all publications are solely those of the individual author(s) and contributor(s) and not of MDPI and/or the editor(s). MDPI and/or the editor(s) disclaim responsibility for any injury to people or property resulting from any ideas, methods, instructions or products referred to in the content. |
© 2024 by the authors. Licensee MDPI, Basel, Switzerland. This article is an open access article distributed under the terms and conditions of the Creative Commons Attribution (CC BY) license (https://creativecommons.org/licenses/by/4.0/).
Share and Cite
Torres, L.; Ramos, F.S. Allocating Benefits Due to Shared Resources Using Shapley Value and Nucleolus in Dynamic Network Data Envelopment Analysis. Mathematics 2024, 12, 698. https://doi.org/10.3390/math12050698
Torres L, Ramos FS. Allocating Benefits Due to Shared Resources Using Shapley Value and Nucleolus in Dynamic Network Data Envelopment Analysis. Mathematics. 2024; 12(5):698. https://doi.org/10.3390/math12050698
Chicago/Turabian StyleTorres, Lívia, and Francisco S. Ramos. 2024. "Allocating Benefits Due to Shared Resources Using Shapley Value and Nucleolus in Dynamic Network Data Envelopment Analysis" Mathematics 12, no. 5: 698. https://doi.org/10.3390/math12050698
APA StyleTorres, L., & Ramos, F. S. (2024). Allocating Benefits Due to Shared Resources Using Shapley Value and Nucleolus in Dynamic Network Data Envelopment Analysis. Mathematics, 12(5), 698. https://doi.org/10.3390/math12050698