Abstract
Shared resources are common among supply chain partners and also occur in multiple linked stages of an internal network. The sharing of these resources impacts the organization’s profits. This study is focused on the potential benefits of resource sharing on a three-stage network system and on the profit improvement allocation. Previous treatments concentrate on defining optimal proportions to allocate resources and disregard the impacts of allocations to promote cooperation and are limited to static evaluations. Data Envelopment Analysis performs the decision-making units (DMUs) efficiency measurement. Methodological advances have resulted in models that analyze their internal structure and temporal impacts on efficiency. We propose an integrated cooperative game and dynamic network DEA that considers known quantities of resources used in each stage and the time effects to optimize the system’s profit. Each DMU stage is a player, and we investigate performance before and after resource sharing. Using Shapley value and Nucleolus, it is possible to allocate the benefits obtained based on the marginal contributions of each stage, providing incentives to motivate and maintain cooperation. A numerical example is used to illustrate the method. The results confirm the identification of inefficient DMUs and that sharing resources allows for profit increase for all of them.
Keywords:
data envelopment analysis; dynamic models with network structure; Shapley value; Nucleolus; resource sharing MSC:
90C90; 90C05; 91A12; 91A35
1. Introduction
The sharing of resources—labor, machinery, capital, and raw materials—is common among partners in supply chains. Sharing can also be present among multiple linked stages of a single network system, such as a bank or a university [1,2]. Pooling and sharing common resources improve performance, efficiency, and profits due to the complementarity of resources [1,3] and synergy. In this context, the following question arises: how can performance be measured when using resources in the presence of these effects?
Several approaches are available to measure resource allocation performance, such as linear programming models, game-theoretical techniques, the Stochastic Frontier Approach, and Data Envelopment Analysis. Specifically, Ref. [4] initially proposed Data Envelopment Analysis (DEA), which consists of a non-parametric method for measuring the efficiency of decision-making units (DMUs) with multiple inputs and outputs.
However, the internal processes that define the DMU can be complex, and the assumption that all inputs impact all outputs should be abandoned [5]. Shared flows, multi-levels, and network models are among the DEA models that consider the internal structure of the DMUs [6].
The development of models with network structures stands out among the most relevant research fronts in the DEA literature [7]. Network DEA models (NDEA) aim to account for divisional efficiencies and overall efficiency in a unified framework [8]. In NDEA, there is an assumption that all inputs affect all outputs and intermediate outputs of the respective stage. In this context, it is possible to verify studies that consider beyond the previous statement and inserting in the analysis shared inputs between stages [9], shared outputs [10], common inputs [11], as well as partial inputs to partial outputs [12].
This diversity demonstrates the need for flexibility in modeling to represent and evaluate the network’s specificities accurately. The complementarity of resources and synergy can explain the increasing number of publications relating to network models and resource sharing.
Dynamic DEA models with network structure (DNDEA) check aspects related to the internal processes of DMUs and observe the dynamic change in the period efficiency and the dynamic change in the divisional efficiency of DMUs [13]. The development of this research front contemplates different approaches: fuzzy inputs and outputs [14], super SBI efficiency [15], non-homogeneous DMUs [16], and common weights [17]. However, the analysis of resource sharing is still incipient in the literature.
We can find a few practical examples of resource sharing in DNDEA. Ref. [18] proposed a two-stage situation to analyze the performance of container shipping companies. The stages correspond to the operating and marketing divisions that share expenses and employees. Ref. [19] developed a model to deal with uncertainty in banking systems. The authors considered a three-stage proposition with shared resources (employee salaries and fixed assets) and aimed to find optimal proportions of the shared resources. Ref. [20] presented a study concerning the Chinese high-tech industry in a framework that shares inputs and outputs between stages.
We developed a DNDEA model with shared resources among the three stages of the network structure over consecutive periods, considering a cooperative situation between the stages since they belong to the same DMU. The fair allocation of benefits is essential to promote cooperation between stages, mainly in an internal network structure, because the production of one stage may affect the production of other stages [2]. Therefore, these two factors justify the choice of the cooperative game approach.
We calculate optimal profits for each DMU before and after resource sharing. Then, we use payoff allocation methods to obtain its distribution between the DMU’s stages using the Shapley value [21] and Nucleolus [22]. The Shapley Value considers each player’s average contributions in different coalitions. The Nucleolus finds the degree of dissatisfaction of one coalition when a particular allocation is realized [23]. Therefore, we used both and compared their results.
Using cooperative game theory concepts to fairly allocate potential profits obtained by pooling resources in the DNDEA framework is a pioneer proposition in the literature. Our study promotes three main methodological contributions. First, we investigate the resource-sharing benefits in a DNDEA framework. Most papers that applied DEA to investigate resource-sharing used network models but disregarded the temporal impacts on efficiency. Second, we assume that the amount of shared input is known for each stage, differently from other studies that consider optimal proportions. Third, this development also fills a gap for the conjoint applications of DEA and game theory models because a three-stage system is analyzed, allocation rules are applied, and compared to allocate fairly the benefits obtained due to resource sharing. In the literature, the majority of game-theoretical DEA models are limited to just two players; therefore, developments for multiple stages in specific network structures are necessary [24].
The paper is organized as follows. Section 2 presents studies and relevant theoretical discussion regarding DNDEA, resource sharing, and combined DEA and Cooperative game theory approaches. Section 3 explains the proposed method. Then, we present a numerical example and its results in Section 4. Section 5 presents key findings, conclusions, and future work.
2. Literature Review
This section discusses three main subjects: dynamic DEA models with a network structure, resource sharing, and combined approaches of cooperative games and DEA.
2.1. Dynamic DEA with Network Structure
Network and dynamic DEA modeling are separately present in the literature and have received prominence due to their insights. However, expanding dynamic considerations for network systems is challenging [24,25]. Network modeling is the theoretical basis for analyzing the internal structure of the DMUs [26]. In contrast, the dynamic model explains the relationships between periods connected via carry-over variables [27,28].
DNDEA models can adequately represent the reality of DMUs via multiple dynamic stages connected by network structure links in each period analysis. This structure involves interacting with a finite number of static models [29,30]. The juxtaposition of these models allows conducting a thorough analysis by observing the change in the overall efficiency, the dynamic modification of the divisional efficiency, possible improvements, and efficiency estimates arising from a more comprehensive analysis where interactions between periods and between divisions are considered [13,25].
The distinct DNDEA models available in the literature make it possible to open the black box of traditional DEA models. They allow the consideration of the internal heterogeneous organizations of the DMUs, with divisions mutually connected by link variables and by the internal exchange in intermediate products [27,31].
The study of [32] is a pioneer proposition in DNDEA. The development incorporates the dynamic effects in the network structure to calculate the sub-decision-making units’ efficiency and the system’s efficiency. Other theoretical developments followed, and different theoretical–practical propositions arose in several segments: health [33], banks [34], transportation [35], education [36], research and development [37], and energy [13].
The diversity of theoretical and practical studies also allows for observing the proposition of new models based on different foundations of the DEA literature. Ref. [25] used the concept of range-adjusted measure. Ref. [13] applied slack-based measures (SBM) in their development and [38] considered the properties of network and dynamic relational models. Ref. [15] developed a super slack-based inefficiency model. Ref. [39] proposed an inverse SBM model. More recently, an additive model nested within a slacks-based measure (SBM) [40] and the employment of directional distances in a multiplicative model [41] represent new alternatives in the DNDEA framework.
In addition to models based on diverse mathematical foundations, there are also developments proposing alternatives to mitigate DEA limitations or to address specificities: models to deal with uncertainty in the inputs [14], for sharing inputs [18], for non-homogeneous DMUs [16], and using common weights for efficiency measuring [17].
This range of modeling, applications, and specificities demonstrates that, although recent, this branch of literature has received much attention and prominence among practitioners and researchers. One of the probable reasons for this is the set of information provided by the models: they identify the inefficiencies more precisely, provide metrics (slacks and projections) to improve efficiency.
Also, it is possible to point out some developments concerning shared inputs in the DNDEA framework. Ref. [42] considered sharing inputs between stages in multi-activities to evaluate bus traffic. Ref. [18] considered multiple shared inputs to evaluate shipping container companies. On the other hand, Ref. [20] expanded the previous considerations of sharing inputs and outputs simultaneously and the lagged effects of the consumption of inputs in a production system. Ref. [37] also considered shared intermediate measures to incorporate the impact of time lag effects when measuring efficiency.
The above studies can evaluate the efficiencies of the system and DMU’s divisions over several periods. There are also some alternatives to include resource sharing in the system structure. However, the discussion of shared resources is deepened and broader for network models. The discussion in DNDEA models is scarcer and previous developments are focused on two-stage networks.
2.2. Resource Sharing
Resource sharing may bring potential gains, and it exists not only among independent entities but also within a network structure system with multiple stages [2]. Ref. [43] was a precursor to the investigation of shared resources. The author considered the chemistry and physics departments in the United Kingdom and the shared resources used by the department’s research and teaching activities. The study proposes a non-linear model based on DEA to measure the department’s efficiency considering the two activities.
Ref. [44] investigated how to perform multi-component efficiency measurements for Canadian banks. The authors considered that bank branches divided their resources between two main processes (services and sales) and proposed a model for measuring the agency’s efficiency given all the activities. Ref. [45] extended this model via an additive DEA model and goal programming combination. Ref. [46] performed an analysis similar to [45] when considering multiple components to measure efficiency, with all parts involved in producing some outputs. This juxtaposition aims to consider non-volume-related activities and obtain the optimal division of shared resources. These studies demonstrate the relevance of considering the internal aspects of the DMU for the accurate measurement of efficiency.
In what concerns inputs shared between stages, a diversity of models with a network structure exists. Ref. [47] considered two serial stages that allocate inputs freely. The authors implement a noncooperative game theory approach to define the limits of stage efficiencies. Ref. [48] verified the sharing of inputs in two-stage serial network models and proposed a new approach to address intermediate products’ issues and share non-divisible inputs adequately. For the authors, models such as [45] would not be appropriate because the DMU does not have an internal network structure. Also, new models, since adaptations of other network models, such as [49], would make the approach highly non-linear.
Consequently, there is no guarantee of a globally optimal solution. Ref. [50] extended the development of [45] to simultaneously consider shared resources and the portion of the intermediate product used by the next stage. Ref. [51] carried out investigations similar to [50] focusing on allocating optimal proportions of shared inputs in systems with parallel stages. Ref. [52] proposed a multiplicative approach for a two-stage system with shared resources. The authors obtained a linearized model and discussed its application in banking and university efficiency.
Ref. [53] investigated the total-factor energy efficiency of Chinese industries with two types of inputs: energetic and non-energetic. The study verifies the sharing of non-energy inputs between the energy use and pollution treatment stages to identify the optimal allocation. Their model also considers specific inputs and specific and undesirable outputs in the second stage.
Refs. [1,2] assessed resource sharing in three-stage serial network models. The last focuses on benefits allocation obtained by the network stages when sharing resources with the aid of Shapley value, and the first deepens into the decomposition of profit inefficiency for a three-stage serial system. The authors decomposed the overall profit inefficiency into the product of technical profit inefficiency, resource sharing profit inefficiency, and free allocation profit inefficiency.
Refs. [54,55] also considered parallel subsystems of a DMU. The first approach focused on a system containing multiple non-homogeneous DMUs and parallel stages within each DMU. The authors create an internal resource-sharing DEA game and propose a new way to allocate the benefits. The results obtained are then compared with core, Nucleolus, and Shapley value. On the other hand, Ref. [55] developed a two-stage Shapley value to allocate increased profits due to resource sharing in a parallel system structure.
It is important to note that the four mentioned differ from the previously mentioned ones since they need to calculate optimal proportions for allocating these resources to each stage. Their studies assume known quantities of inputs for each stage and can benefit from pooling them together.
As previously mentioned, investigations of resource sharing for DNDEA models are still nascent in the literature. We can see some developments in [18,19,20,42]. Ref. [42] developed a multi-activity dynamic model with a network structure. The model based its considerations on the propositions of [13,56]. Shared inputs flow between two of the three investigated stages in the network. The object of analysis was 20 bus transit firms in Taiwan over three years.
Ref. [18] proposed a model to investigate shipping companies over three years. The authors applied a model to assess the efficiency of thirteen of the largest companies in the sector: two divisions, operational and marketing, share expenses, and employees. The authors point out that the modeling measures the companies’ efficiency stages while providing the optimal proportions for allocating the shared resources.
Ref. [19] dealt with uncertainty in the banking industry. The study is based on the hypothesis that the proposed model is solved by discovering optimal proportions of the shared resources. The authors considered a three-stage proposition with shared resources. To deal with uncertainty, the authors combined an SBM DNDEA proposition with Fuzzy Theory to investigate the three stages: capital organization, capital allocation, and capital profitability.
Ref. [20] presented a verification of the Chinese high-tech industry in a three-year analysis. The authors considered two stages, technology research and development and technology digestion and absorption, to investigate 29 Chinese regions. The framework simultaneously considers shared inputs, shared outputs, and the lagged effects of input consumption in a production system.
Despite the diversity of investigations and applications in the NDEA framework, studies covering the theme of resource sharing in DNDEA modeling still need to be explored in the literature. Cooperation is an effective strategy for increasing profits, reducing costs, and improving technologies for companies; it can also promote mutual learning and resource complementation, thereby improving their overall profitability [55].
Previous studies do not investigate the potential benefits of cooperation when a more complex internal network and several periods exist simultaneously. Game theory presents a suitable technique to perform such investigations, as discussed in the following section. We aim to mitigate this gap by combining a DNDEA model with cooperative games, an unprecedented literature proposal.
2.3. Cooperative Games in the DEA Field
The use of game theory to propose new methodologies models and help mitigate DEA limitations is not new. Refs. [57,58] are pioneer studies. After these studies, several other propositions integrating DEA and game theory can be verified in the literature for different purposes, using cooperative and noncooperative games.
The cooperative game theory assumes that each player performs best when they collaborate. It provides essential concepts, methods, and models used to assess the interaction of different agents in competitive markets and solve conflicts. Hence, notions like fairness and equity when finding allocations of the total amount the grand coalition can obtain are significant [23,59,60].
Ref. [23] stated that two main types of cooperative games apply in the DEA context: bargaining and transferable utility games (TU games). Using these games, we can address several DEA problems, such as defining common weights, defining variables relevant for efficiency measurement, efficiency decomposition, and obtaining consensus between criteria to evaluate performance. In the case of TU games, we must define solutions that select a set of allowable allocations for each game [23]. A key issue in achieving such cooperation is the fair allocation of potential gains arising from resource sharing [2].
Some methods are available in game theory literature to perform the allocation. We highlight the Nucleolus, core, and Shapley value. The core is a set of payoff allocations that satisfy individual and coalitional rationality, while the Nucleolus is the “center” of the core if it is non-empty or expresses its latent position in case it is empty [2].
The Nucleolus-based solution always exists and is unique [22]. The central concept related to the Nucleolus is excess, and it corresponds to the imputation that minimizes (lexicographically) the maximum excess when dealing with benefits: the excess measures the “degree of unhappiness” of a coalition but measures the “degree of happiness” when dealing with costs [61].
The Shapley value is an equitable distribution of coalition surplus [62]: an allocation plan for payoffs based on the players’ contribution [63]. The Shapley value [21] represents the average marginal contributions of the partners to the maximum output revenue from joint production [3], providing a unique solution. Therefore, this study will apply the Shapley Value and Nucleolus to distribute the incremental revenue obtained with resource sharing.
Table 1 details thirty-one studies with DEA and cooperative approaches that used Shapley value or Nucleolus. We show the area of application, the objective for joining DEA with a cooperative approach, the type of game approach, the type of DEA model, the number of DMUs, inputs, outputs, intermediate variables, and stages. Studies with no application are purely theoretical studies. Usually, these studies employ numerical examples to discuss results or prove the model’s applicability.
Table 1 shows that most studies are practical, confirming the applicability of the DEA and GT combination. The use of allocation methods and classic and cross-efficiency models are predominant. However, most recent studies investigate network models, a similar trend to the general literature of DEA [7]. We can observe that banks and energy represent the main areas of interest, which is also in line with the DEA literature. The banking area has the highest number of published papers, while energy represents a rising theme [64].
Regarding the objectives, the allocation of resources and the evaluation of efficient DMUs stand out. The combination of DEA and cooperative games in resource and cost allocations allows us to discuss how the share of such inputs impacts the DMU’s efficiency. In this sense, the use of distinct imputation techniques is in line with the diversity of the situations and areas investigated since the decision-maker should select the game solution depending on the context of the problem.
The work of [61] presents itself as one of the first to address the combination of DEA and GT under the cooperative perspective. The authors analyze a consensus problem when multiple criteria exist, and players must agree on the weights assigned to each criterion. They proposed two transferable utility games, Shapley value, Nucleolus, and a linear programming model to obtain a common set of weights. These weights provide aggregated scores close to the imputation. This new scheme for allocation was called the egoist’s dilemma by the authors.
Ref. [65] discussed a Japanese cultural maxim to adopt a middle ground between two propositions to avoid conflict. The authors discuss the issue under egoist’s dilemma propositions and consider assurance regions, Shapley value, and Nucleolus to prove the Add-div mentality as an OR application. Ref. [59] considered DEA and game theory to allocate transmission costs in the energy industry using Shapley value and Nucleolus.

Table 1.
Systematization of studies considering cooperative games in the DEA field.
Table 1.
Systematization of studies considering cooperative games in the DEA field.
| Paper | Area | Objective | Game Approach | DEA Model | DMU | Inputs | Outputs | Link/ Stages |
|---|---|---|---|---|---|---|---|---|
| [61] | - | Allocating or imputing benefits | Shapley value and Nucleolus | CCR | - | - | - | - |
| [65] | - | Resource allocation | Shapley value and Nucleolus | CCR | - | - | - | - |
| [66] | - | Propose a cross-efficiency game | Shapley value | Cross efficiency | 5 | 3 | 2 | - |
| [67] | - | Importance of variables in DEA | Shapley value | Radial DEA | 8 | 6 | 2 | - |
| [68] | - | Investigate the benefits of sharing data among DMUs | Shapley value, Nucleolus, and τ-value | Cost DEA | 12 | 2 | 2 | - |
| [69] | - | Stable payoff allocation | Nucleolus | DEA production game | 3 | 2 | 2 | - |
| [70] | Energy | Increase DEA discrimination | Shapley value | MODEA | 20 | 13 | 3 | - |
| [63] | - | Resource allocation | Shapley value | CCR | 12 | 3 | 2 | - |
| [71] | Banks | Efficient DMU evaluation | Shapley value | Super efficiency | 14 | 3 | 3 | - |
| [3] | Paper Industry and Ports | Resource allocation | Shapley value | MILP DEA VRS | 8/28 | 4 | 2/3 | - |
| [72] | Banks | Efficient DMU evaluation | Shapley value | CCR | 14 | 3 | 2 | - |
| [59] | Energy | Resource allocation | Shapley value and Nucleolus | Cross efficiency | 4 | 4 | 3 | - |
| [62] | Banks | Resource allocation | Shapley value | Cross efficiency | 18 | 3 | 3 | - |
| [73] | Health | Fully ranking DMUs | Core and Shapley value | Cross efficiency | 288 | 3 | 4 | - |
| [74] | Environment | Cost savings allocation | Shapley value | CCR | 6 | 3 | 2 | - |
| [75] | Transportation | Fully ranking DMUs | Shapley Value | Cross efficiency | 9 | 7 | 2 | - |
| [76] | Manufacturing | Resource allocation | Nucleolus | Cross efficiency | 10 | 4 | 2 | - |
| [77] | Energy | Efficient DMU evaluation | Shapley value | Cross efficiency | 31 | 5 | 4 | - |
| [2] | - | Resource allocation | Shapley value | NDEA | 10 | 3 | 1 | 2/3 |
| [78] | Energy/Environment | Increase DEA discrimination | Shapley value | Cross-efficiency DEA Game | 17 | 1 | 13 | - |
| [79] | Environment | Resource allocation/target setting | Nucleolus | DDF DEA | 31 | 3 | 2 | - |
| [80] | Banks | Cost allocation | Shapley value | CCR | 5 | 2 | 1 | - |
| [60] | Banks | Resource/cost allocation | Nucleolus | NDEA | 27 | 3 | 2 | 3/2 |
| [81] | Cities development | Composite indicator construction | Shapley value | DEA Game | 13 | 1 | 68 | - |
| [82] | Banks | Efficient DMU evaluation | Shapley value | CCR | 14 | 3 | 2 | - |
| [83] | Environment | Resource allocation/target setting | Shapley value | Zero-sum DEA | 9 | 2 | 1 | - |
| [84] | Logistics/Environment | Resource allocation | Shapley value | CRS, VRS, and MRS DEA | 23 | 5 | 7 | - |
| [85] | Supply chain | Profit allocation | Shapley value and Nucleolus | Double level NDEA | 15 | 4 | 4 | 4 |
| [54] | Transportation | Resource allocation | Core, Shapley value, and Nucleolus | Parallel DEA | 8 | 5 | 3 | 3 |
| [55] | Hotel | Resource allocation | Shapley value | Parallel DEA | 7 | 3 | 2 | 2 |
| [86] | Mineral resources | Community partition | Shapley value | Revenue DEA | 31 | 2 | 3 | - |
| Torres and Ramos | - | Resource sharing and additional profit allocation | Shapley value and Nucleolus | DNDEA | 10 | 6 | 3 | 3/3 |
They propose three criteria and develop and combine fairness and share index to evaluate the players’ satisfaction with the allocations.
Shapley value and Nucleolus were also employed separately. Ref. [87] combined DEA and Nucleolus to perform excess profit allocation in the wind energy scenario. The authors considered four players and six criteria to investigate the bundled transmission model of wind power in China. Ref. [76] combined cross-efficiency and Nucleolus to allocate fixed costs, developing a linear method that provides a single allocation and considers the strategic relations between the DMUs.
Ref. [79] considered Nucleolus to allocate carbon emission abatement quotas in Chinese industries, while [60] discussed the allocation of fixed costs in two-stage systems, applying to investigate the performance of Chinese banks. It is possible to verify that many studies used the Shapley value to the detriment of the Nucleolus. One reason can be related to the complexity of Nucleolus calculation in games with many players. When observing the objectives that led to the use of Shapley value, resource/cost allocation, evaluation of efficient DMUs, and increase in DEA discrimination stand out.
Concerning the objectives, the first one mainly addresses the allocation of fixed costs and profit excesses to evaluate partner resource sharing to select the best one for cooperation. Ref. [88] constructed DEA production games to investigate the benefits of information and resource sharing. The author discussed Owen’s set solution, Shapley value, Nucleolus, and τ-value to allocate the additional revenue. Ref. [3] investigated input reallocation and pooling resources to identify the best cooperative partner. Ref. [80] developed models to perform fixed cost allocation, evaluating coalitions before and after cost allocations and employing Shapley value to allocate the fixed cost.
Ref. [83] developed a two-stage procedure to allocate CO2 emission quotas in China. The Shapley value is used in the first step of the model to allocate quotas to the regions of China. Entropy method and a zero-sum DEA to complete the allocation for each province considered. Ref. [84] discussed the use of an alternative proposition of returns to scale in DEA, the medium returns-to-scale hypothesis, jointly with Shapley value to investigate cities regarding logistics economic efficiency.
Ref. [85] contemplated the argumentation of resource sharing in the case of upper-level processes and multiple lower-level processes. The discussion relates to situations such as a supplier and several manufacturers or one supplier and several retailers. The authors presented the situation from a cooperative perspective using distinct profit allocation methods (Shapley value and Nucleolus). They also discussed measures for the stability and acceptability of different allocations.
Refs. [54,55] examined resource sharing in systems composed of parallel subsystems. The first investigation uses data from transportation systems to investigate the impact of cooperation to allocate shared resources among the parallel subsystems. The study compares the allocation provided by core, Nucleolus, Shapley value, and a new approach based on prospect theory to discuss the benefits obtained due to cooperation. The second paper considers the hotel industry to address the impact of cooperation in cases where the number of subsidiaries is different among the DMUs. A two-step Shapley value procedure is used to discuss the impacts of cooperation on profit.
Contemplating the second purpose, refs. [71,72] proposed the construction of characteristic functions using the Shapley value to investigate efficient DMUs in the context of super efficiency. Ref. [73] developed a combination of fuzzy clustering, DEA, and game theory to fully rank a set of DMUs. Ref. [77] described a cross-efficiency-based approach to fully rank efficient DMUs.
Ref. [66] selected the Shapley value to obtain more precise ultimate average cross-efficiency scores regarding DEA discrimination. Ref. [67] chose this combination to measure the variables’ importance in DEA models. Ref. [70] proposed a multiobjective DEA model and Shapley value to investigate the relationship between the number of DMUs and the number of inputs and outputs to discriminate between DMUs more effectively. Ref. [81] employed the Shapley value to improve DEA performance to generate composite indicators in the presence of a higher number of sub-indicators. More recently, ref. [86] developed an algorithm based on Shapley value and DEA to aid in community detection in social network analysis.
Previous studies conducted investigations considering different network structures and methods to allocate the benefits of cooperation. To better clarify the applicability of the model presented in detail in the next section, we will discuss three applied studies that considered shared resources in different network structures. Ref. [55] proposed a shared resource approach to investigate hotel chains. The authors considered that each chain hotel contains a different number of subsidiary hotels that operate independently but are subject to the management of the same management team. Therefore, a parallel network was applied. Since the services provided are similar, the situation allows the sharing of employees among the subsidiaries, thus being the shared input in this case.
Ref. [54] addressed issues regarding inland transportation systems. The authors considered that each system contemplates road, rail, and inland waterway subsystems and that the subsystems use similar resources that can be shared and provide better system resource usage. Capital, general energy, and ordinary workers were considered the shared resources in this system. Both [54,55] developed economic analyses, considering resource prices and their sharing among parallel systems. Ref. [19] proposed a three-stage serial network to contemplate banking internal processes and adopted employees and fixed assets as common resources used by all the stages of the network. Although they performed a fuzzy technical efficiency analysis, the application of the study represents another situation where our proposition can be used.
Besides previous discussions, it is also possible to verify static analyses. That is, the models already developed cannot answer whether the benefits of cooperation remain when several periods are considered and what the possible impacts of one period are on the others. Thus, the current study develops a new set of dynamic models with a network structure (DNDEA) to answer this question. At the same time, the cooperative tools provided by game theory allow for the investigation of the obtainment of additional profits within the DMU’s internal network structure and propose an allocation that stimulates cooperation over time. To this end, we combined DNDEA, Shapley value, and the Nucleolus to conduct inquiries in a three-stage serial system.
In this context, it is also important to justify the choice of a three-stage system. The survey by [24] states and the recent study by [89] confirm that despite the growth of studies with NDEA models, most focus on models with only two stages. Furthermore, ref. [90] shows that network DEA is a growing field of research in the general efficiency literature. However, investigations of network models considering aspects of cost, profit, and revenue are rarer in economic efficiency assessments. Thus, by contemplating a network with three stages, the current study aims to contribute to the literature by providing a more complex analysis, thus portraying a more significant number of managerial realities.
3. Resource Sharing in a Dynamic DEA Model with a Three-Stage Network
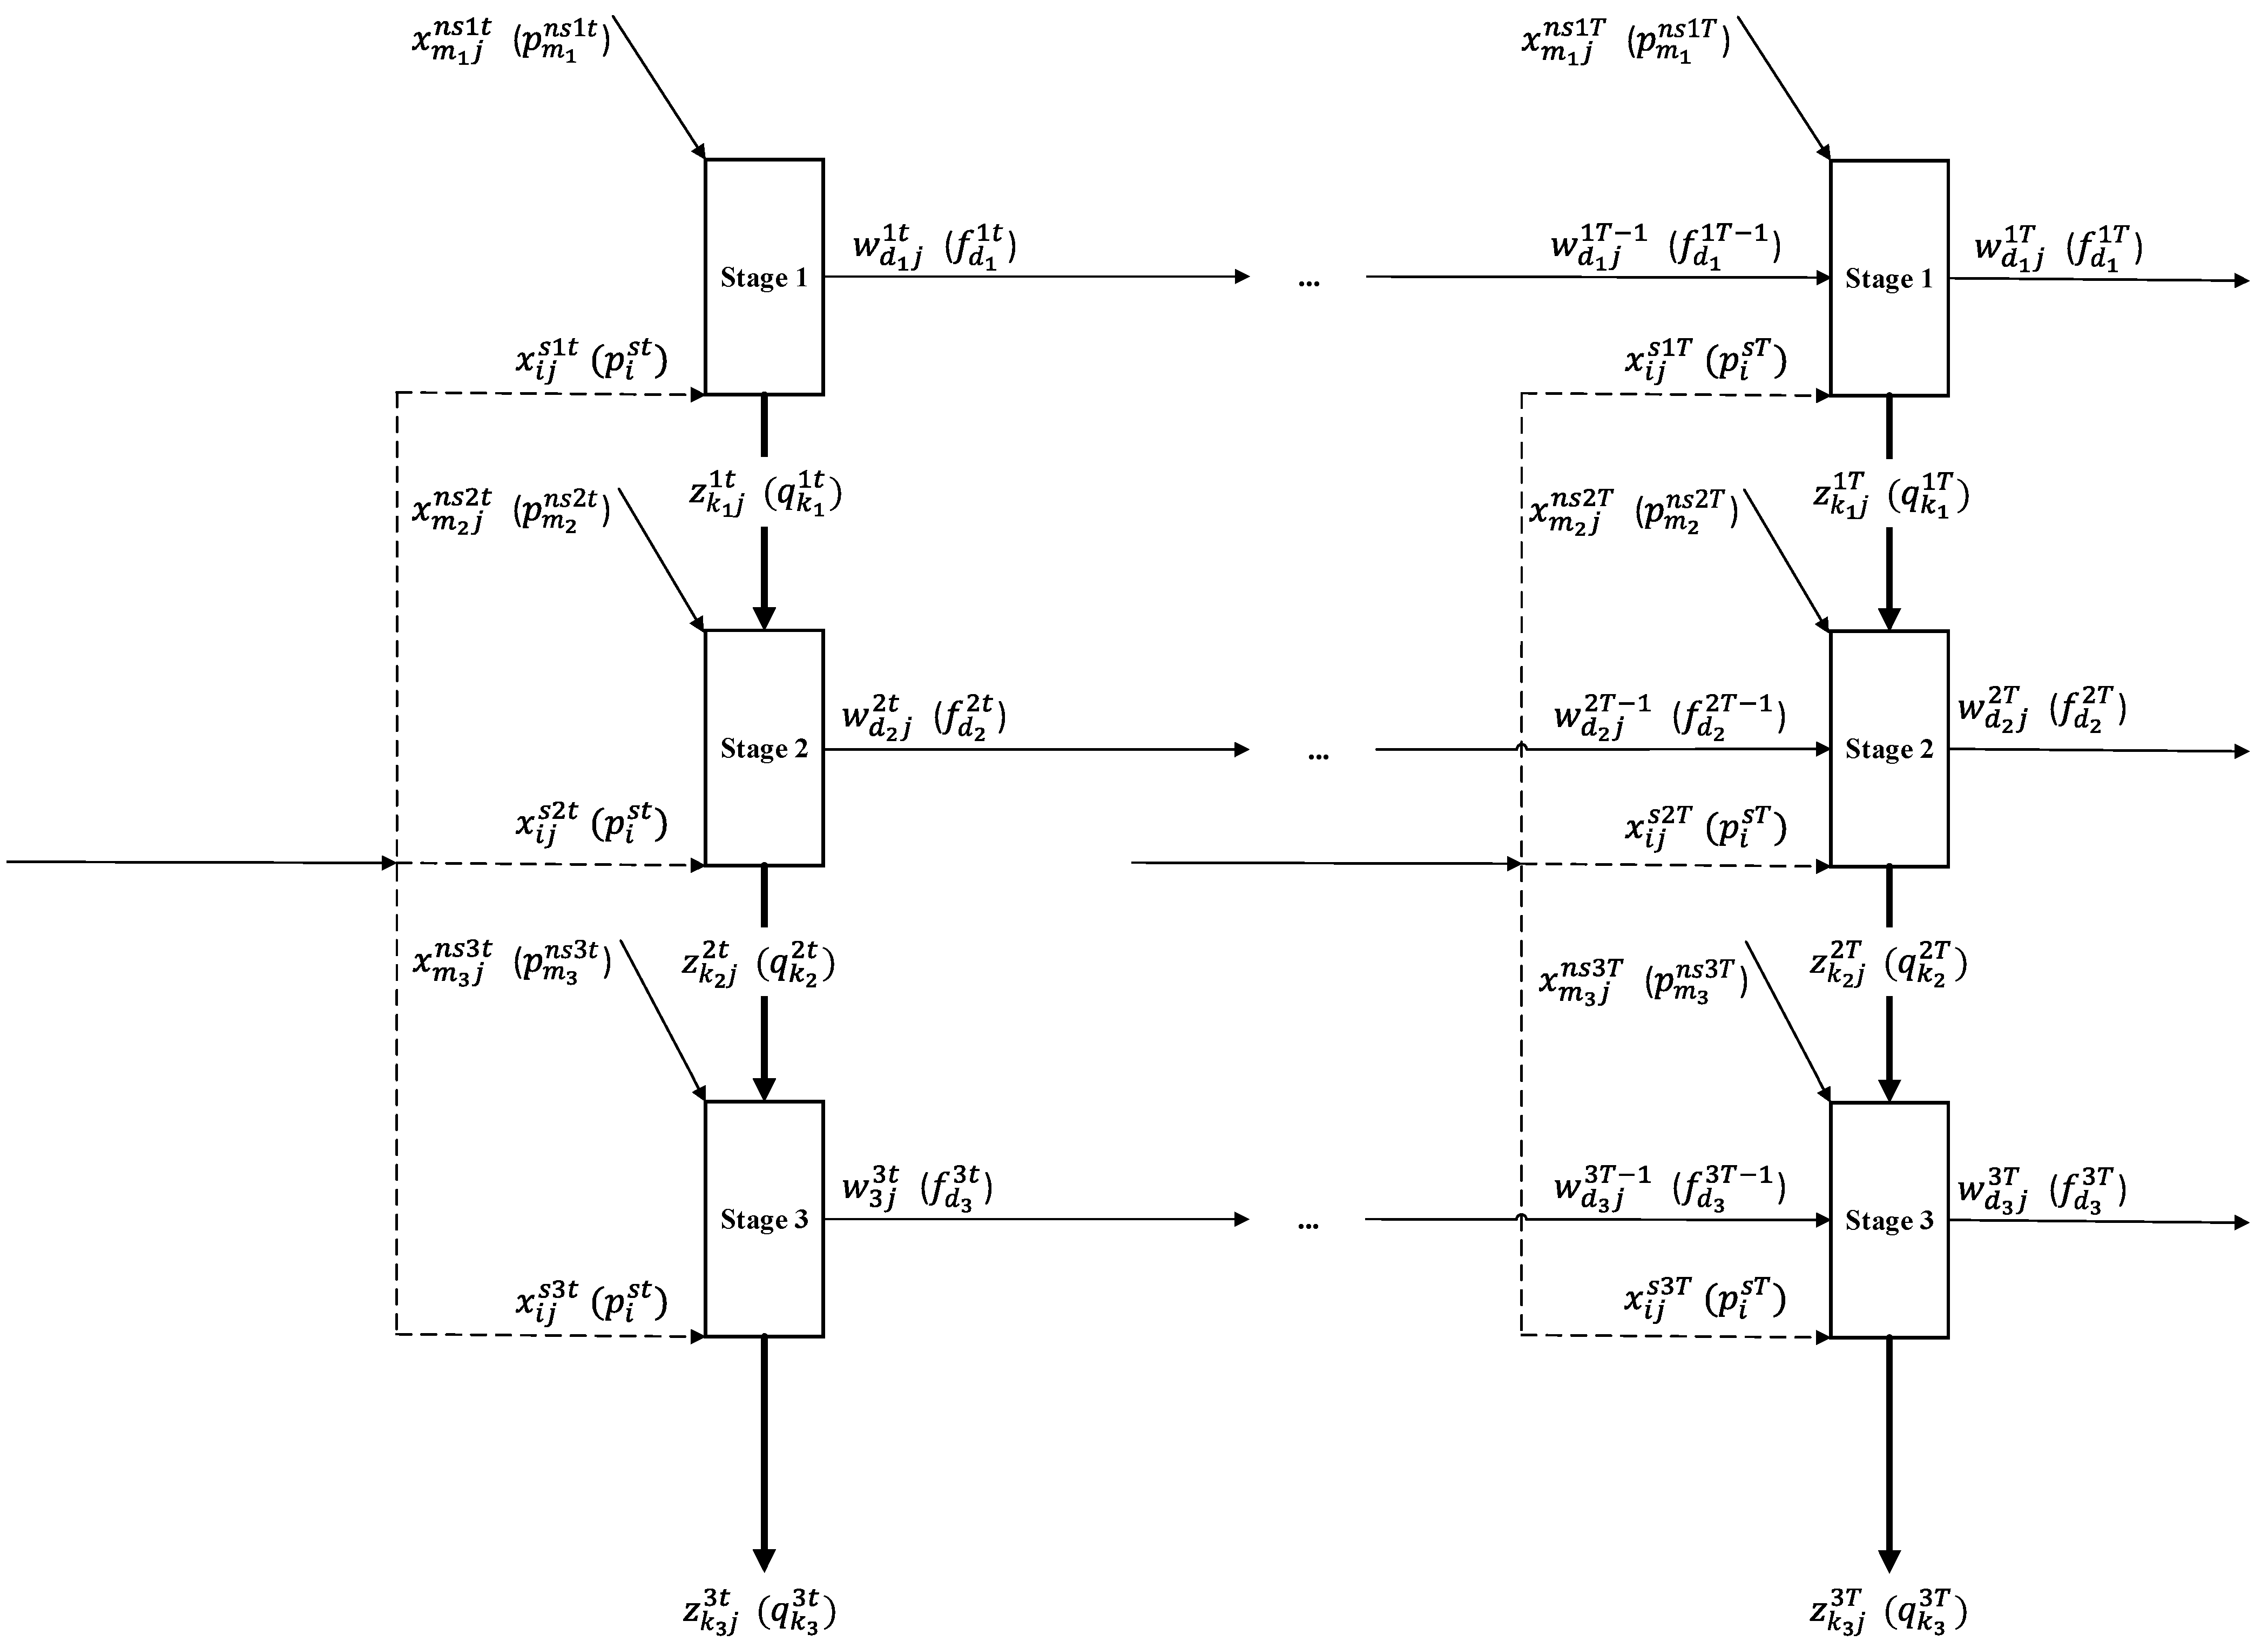
For our three-stage serial network over consecutive periods, Table 2 details the models’ indexes, parameters, and decision variables, while Figure 1 details the network structure.
Table 2.
Indexes, parameters, and variables of the model.
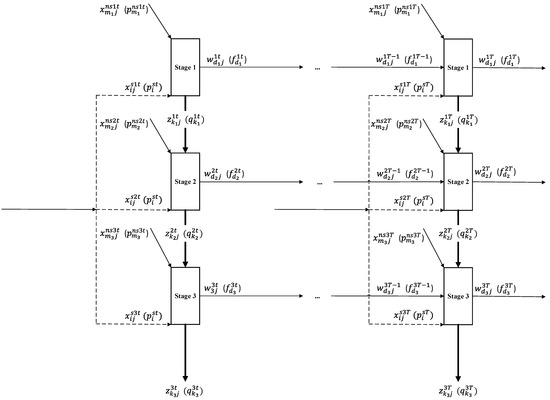
Figure 1.
The proposed three-stage series network.
3.1. Analysis of the Pre-Collaboration between Stages
In the structure of the DNDEA (Figure 1), each stage has specific inputs , and they can pool together similar shared inputs denoted as . We observe stages in a continuum between an initial period one and a final T. Carry-over () variables connect two consecutive periods. The different stages produce outputs consumed via the following stages: these outputs are links (), and the output of the last stage corresponds to the system’s output.
We consider that enterprises pursue profit maximization [2] profit improvement results from resource sharing. Model (1) obtains the profit before collaborating between stages (): it aims to identify the optimal configuration before resource sharing to use this information as a benchmark for the next step. It is solved n times.
It maximizes an objective function concerning the system’s profits, considering all DMU stages and all periods under evaluation. Constraints (1a) to (1f) ensure that the results are feasible. They are presented in a generic way to allow different types of links and carry-overs, as presented in the definition of the production set of [13]. The authors developed this generic representation to consider four categories of carry-overs (good, bad, fixed, and free) and links (inputs, outputs, free, and non-discretionary).
Subject to the following:
This general proposition considers the different types of carry-overs and links and provides flexibility to portray different scenarios, extending the methods to several research fronts. The restrictions (1c) and (1d) refer to the links: the first contemplates the link performance as outputs of division k in period t. At the same time, (1d) represents the performance as an input in the subsequent division in period t. Restrictions (1e) and (1f) refer to carry-overs: the first refers to the role as carry-overs from period t, (1f) as carry-overs to period t + 1.
Constraints (1g) and (1h) ensure that the values of the shared and exclusive inputs do not exceed the initial values. Constraints (1i) and (1j) ensure that the output levels of the stages (outputs and carry-overs) are at least the current ones. The constraint (1k) assumes variable returns to scale and can be removed from the model to account for constant returns to scale. Finally, (1l) ensures the non-negativity of the values.
3.2. Post-Collaboration and Coalitions
We consider that each of the three stages consists of a player. Defining three players makes it possible to identify possible forms of cooperation between the stages—the coalitions (S). Then, we will observe coalitions of one player ({1},{2},{3}), two players ({1,2},{1,3},{2,3}), and the grand coalition {1,2,3}. The characteristic function [v(S)] is the difference between the profits obtained by each DMU after and before the resource sharing, considering the different coalitions .
The single-player coalitions represent the initial situation in which the players act in isolation without sharing resources. The coalition of one player does not obtain any benefit; therefore, .
In the case of two-player coalitions, we have three possible combinations S = ({1,2}, {1,3}, {2,3}). Model (2) illustrates how to calculate profit after the coalition {1,2} forms. Idem for the other coalitions ({1,3},{2,3}).
Subject to the following:
This model uses the optimal values obtained from model 1 () to identify the model’s (2) optimal values of the decision variables. Similar to Model (1), restrictions (2a) to (2f) ensure that the values of the decision variables are feasible. Constraint (2g) demonstrates that stages 1 and 2 group their resources so that the total amount of shared resources is less significant than the current one.
Constraint (2h) assumes that the values of stage 3 shared inputs do not exceed the initial values; we adopt a similar assumption to calculate optimal profits obtained by other coalitions. Constraint (2i) ensures that exclusive inputs’ values do not exceed the initial values. Constraints (2j) and (2k) indicate variable returns to scale and non-negativity of the variables.
Via the resolution of Model (2), it is possible to obtain the post-collaboration profit of this coalition and calculate using the expression (3). The procedure to obtain must also be applied to obtain the values of , , and, consequently, and .
Model (4) allows us to obtain the profit values for the grand coalition (S = {1,2,3}). The main distinction between Model (2) and (4) considers all shared inputs as a single amount. Constraint (4g) aims to ensure that the total of inputs shared after the collaboration will be lower than in cases where it does not occur. The other constraints of Model (4) are identical to Model (2).
Subject to the following:
Via the resolution of Model (4), we obtain the post-collaboration profit of this coalition and calculate using the expression (5), which details the characteristic function of the grand coalition.
Also, it is possible to explore cases with and without carry-overs in the period zero . In situations where the initial carry-overs are present, we add the term to the objective function, and we insert the constraint ) in Model (1), Model (2) and Model (4). The type of signal used in the constraint depends on the type of carry-over present.
3.3. Payoff Allocation Using Shapley Value and Nucleolus
Expression (6) details the calculation of the Shapley value: represents the number of players in coalition , where comprises the number of players in the grand coalition. corresponds to the profit of stage l, which increased due to resource sharing. We calculate for all stages in all coalitions of all DMUs, and the Shapley value will identify the corresponding allocation for each stage participating in the coalition as to their contribution to increasing the system’s profit.
To calculate the Nucleolus, we must define the excess of a coalition concerning an allocation . Numerically, the excess can be expressed by
This expression portrays a degree of dissatisfaction with a coalition associated with the allocation . Then, we define a vector of ordered excesses , representing the excess of the coalitions in arranged in increasing magnitude, as shown in (8).
It must also be considered the lexicographic ordering of the vectors , i.e., if such as and . The imputation that minimizes this vector of non-increasing ordered excesses, according to the lexicographic order within the set of imputations, consists of the Nucleolus [23]. Considering the full imputation of the game equal to X, the Nucleolus is
4. Numerical Example
We consider ten DMUs and evaluate the three stages of these DMUs over two time periods, with two shared inputs, one exclusive input, one intermediate product, and one carry-over for each stage. The intermediate product of the last stage represents the final output of the system.
We must have at least one common input in each stage to verify the possibility of sharing resources and at least one intermediate product between the stages. At least one of the stages must have this variable to carry out a dynamic evaluation regarding the carry-over.
We generate all the values randomly in Excel 2020. Unit prices range from 1 to 11, while inputs, carry-overs, and intermediate products range from 1 to 31. The selected range of values ensures the random generation of values that will not impact results and follows the same guidelines adopted by [2].
The prices of intermediate products generated in the first and second stages are zero because they are consumed internally. In addition, the price of shared inputs was considered the same at all stages. Data are in Table 3.
Table 3.
Numerical data.
Regarding carry-overs, we consider two types: fixed and free carry-overs, as in [13]. These intermediate products follow the propositions of [2], which is in line with the free link case of [8]. The free link consideration is appropriate since the DNDEA models assess the internal structure of the DMU, and it is reasonable to say that the DMU generally has control over its internal network structure and production.
We base the choice to investigate two types of carry-over on the possibility that carry-overs represent aspects of infrastructure or productive resources, which may remain fixed for some time or require government permission to change. Thus, the analysis of fixed and free carry-overs allows investigation of the impacts of resource sharing in scenarios of total autonomy of the DMU (free carry-over) or partial autonomy (fixed carry-over).
To investigate the super additivity of the model, we propose two cases:
- Free carry-overs;
- Fixed carry-overs.
Despite using a numerical example to illustrate the model’s applicability, it is essential to mention that the approach applies to any three-stage system in which the prices and quantities of inputs and products are known. The studies illustrated in Section 2.3 address practical situations in which the evaluation of resource sharing can bring increased profits to organizations. However, unlike these studies, we contemplate a series of networks, including internal supply chain networks, which can help represent different realities.
4.1. Characteristic Functions
We use models (1), (2), and (4) to obtain the objective function values of the numerical example detailed in Table 2. Initially, Model (1) brings the profit values for each DMU before sharing resources. Afterward, we use Models (2) and (4) to calculate the coalition profits and obtain each DMU’s characteristic function values. Table 4 displays the results for the two cases.
Table 4.
Characteristic functions values of the two cases.
In Table 4, to consist of characteristic function values for the coalitions, representing the increase in profit gained from sharing resources between the stages of the DMU. Thus, the DMU is efficient when we verify null values because there is no profit increase even with sharing resources.
We observe that only DMU 10 in case 1 was efficient. It is also possible to notice that in all cases, there are a large number of non-zero values for the coalitions , , , and , indicating that the sharing of resources between DMU stages over consecutive periods can increase system profits. When observing the results of the coalitions, it is possible to state that the occurrence of two main results, the best values of the characteristic function are from the grand coalition, or the grand coalition and another coalition of two players tie for the best results. However, for no case investigated, another coalition performed better than the grand coalition.
This analysis shows that for all investigated scenarios, this game is super additive . For example, consider ; we need to verify that . From Section 3.2, , and then becomes . In Section 3.2, we define , and since is equal for both cases, it is necessary to prove that . The optimal solution for Model (2) is . For each , and , so we infer that in each period . Conjointly with constraint (4h), and if it is valid for each period, it will also be true for the entire horizon. The remaining constraints in Model (4) are similar to Model (2), so it is possible to conclude that the optimal solution for Model (2) is feasible in Model (4). It is also true that the objective function of Model (4) is the highest profit achievable by the system. Then, . The discussion is also valid for the other coalitions.
For all the cases, the coalitions’ characteristic function values minus the individual stages’ values are in Table 4. These results align with [2] when verifying that sharing resources can increase profits. It is important to note that even in cases where there is no total autonomy of the DMUs, the DMUs are limited in a certain way, and the model returns super-addictive results. The proposed approach reinforces that this practice, over time, provides positive results, both for the stages and the system.
4.2. Payoff Allocation with Shapley Value and Nucleolus
Now, we use the Shapley value and Nucleolus to allocate the benefits arising from cooperation between the stages of the DMUs. We observe that the sum of each column of Table 5 and Table 6 corresponds to the grand coalition value illustrated in demonstrating that the result obtained by the system corresponds to the sum of the results obtained by the stages.
Table 5.
Shapley value of the stages in the two scenarios.
Table 6.
Nucleolus of the stages in the two scenarios.
In Table 5, we see that some stages have zero profit. This result can portray two situations, and the first corresponds to cases similar to DMU 10 in case 1. In this circumstance, the DMU is efficient, and sharing resources between the stages does not benefit the system.
The other situation is illustrated by DMU 1 in case 2 and DMU 3 in case 1. We remember that the Shapley value measures the average marginal benefit that the player adds to the coalition’s profit. The stage’s addition does not provide any additional increase for cases like this. It is possible to verify this by observing that equals . For these cases, entering the third stage when forming the grand coalition does not increase profit. Thus, the null result of the Shapley value was expected and is in line with the definition of the allocation method and conceptual background.
Table 6 displays the Nucleolus values. Initially, we can observe that the Shapley value and the Nucleolus allocations are the same for some cases. The first consists of efficient DMUs since all coalitions have characteristic functions with a value equal to zero.
The second case consists of situations where all two-player coalitions and the grand coalition have the same value. For these cases, , minimizing dissatisfaction is assigning values equal to the players, which must correspond to one-third of . Otherwise, the lexicographical order in the excess vector would be inverted, and this allocation would be different, not corresponding to the definition of the Nucleolus. We verify this situation for DMUs 5 and 7 in case 1.
The third case occurs when one of the two-player coalitions has a value equal to the grand coalition, and the others have zero value, such as DMU 3 in case 1. For these two cases, and . Thus, to satisfy the conditions of the Nucleolus definition, the grand coalition’s value must be divided equally between the parties that make up the coalition of two players of equal value.
The differences can be explained by how each method defines fairness for the other allocations. The Nucleolus-based allocation plan first addresses the least happy coalition; intuitively, benefiting the least coalition is a generous philosophy and will cause less resistance to organizations’ implementation of the allocation plan [76]. On the other hand, the Shapley value considers the marginal contribution of each player to the coalition.
In the specific profit case, the payoff allocation results give managers a direction to prioritize efforts to obtain the best possible outcome. For the current issue, the discussion of these allocations takes place in a fictitious example. For real situations, the decision-maker knowing in depth the analyzed context, will choose which best meets their needs.
5. Conclusions
Resource sharing consists of a way to improve organizational performance. The current study developed an integrated proposition of DNDEA and cooperative approaches of game theory, namely Shapley value and Nucleolus, to explore resource sharing in a three-stage network structure considering multiple periods.
Joint developments of DEA and game theory have been in the literature since the 1980s. However, combining the techniques to investigate the benefits of sharing resources in complex network structures is scarce when contemplating the temporal aspects.
Thus, the current study fills a gap in the literature when considering resource sharing in DNDEA models. Few studies address this topic, and most identify optimal proportions to divide and share resources. Our proposition differs because it assumes that the stages have a known quantity of resources and that pooling them together will benefit the internal stages and the entire DMUs.
With the aid of Shapley value and Nucleolus, the allocation of benefits arising from sharing is carried out. Therefore, we develop models to calculate pre- and post-collaboration profits between the stages of DMUs. A numerical example containing 10 DMUs acting over two time periods validates the proposition.
The results confirm the benefits of resource sharing over time via the super additivity verified in the characteristic functions. Using Shapley value and Nucleolus, it is possible to allocate the benefits obtained based on the marginal contributions of each stage, providing incentives to motivate and maintain cooperation between the stages of the organization over time.
In addition to contributing to the theoretical developments of DEA and game theory, this study provides advances by considering a case with three stages perceived as players since there is a preponderance in the literature of cases with only two players.
One significant limitation of our research should be pointed out. We highlight the lack of data to apply in a real case. As discussed by [90], access to actual data to develop analyses with resources represents a barrier in this field.
Several directions can advance the current development. Initially, the extension of the method to contemplate more stages is a relevant direction to be followed. The use of algorithms, heuristics, or metaheuristics may be relevant to deal with or bypass the increment of complexity that is expected with the player’s numbers increase or with the increase in DMUs in the sample. Although the increase in scale of the proposed game-theoretical model does not challenge the underlying assumptions adopted in this study, it is essential to notice that to solve the model, we must run each linear programming model n times, and the increase in stages leads to an increase in coalitions number. This increase is exponential (). Therefore, the extension to consider more players will probably require additional computation support.
Since an economic efficiency assessment was performed, it is possible to use some sort of value of preference information, establishing that some combinations of inputs (and/or outputs) are better than others rather than resource/product prices. In this case, it will be essential to observe if some bounded rationality can play a role in adding heterogeneity to the decision-making units.
Simultaneously investigating the cooperation between the internal structures of the DMUs and between the DMUs can be an alternative to obtain even better results. Another direction that could be followed is to extend the considerations to identify the resource-sharing boundary conditions within which the proposed game may be operational and valid. Finally, verifying noncooperative aspects in the network structure considering multiple periods can contribute to the literature.
Author Contributions
L.T.: Conceptualization, Methodology, Investigation, Writing—Original Draft; F.S.R.: Writing—Review and Editing, Supervision. All authors have read and agreed to the published version of the manuscript.
Funding
This research was financed in part by the Coordenação de Aperfeiçoamento de Pessoal de Nível Superior—Brasil (CAPES)—Finance Code 001 and by the Conselho Nacional de Desenvolvimento Científico e Tecnológico–Brasil (CNPq) grant number “PQ 311334/2019-9”.
Data Availability Statement
Data are contained within the article.
Acknowledgments
The authors would like to thank the support by the Coordenação de Aperfeiçoamento de Pessoal de Nível Superior—Brasil (CAPES—Coordination for the Improvement of Higher Education Personnel)—Finance Code 001 and Conselho Nacional de Desenvolvimento Científico e Tecnológico—Brasil (CNPq—Conselho Nacional de Desenvolvimento Científico e Tecnológico) grant number “PQ 311334/2019-9”.
Conflicts of Interest
The authors declare no conflicts of interest.
References
- An, Q.; Wen, Y.; Chu, J.; Chen, X. Profit Inefficiency Decomposition in a Serial-Structure System with Resource Sharing. J. Oper. Res. Soc. 2019, 70, 2112–2126. [Google Scholar] [CrossRef]
- An, Q.; Wen, Y.; Ding, T.; Li, Y. Resource Sharing and Payoff Allocation in a Three-Stage System: Integrating Network DEA with the Shapley Value Method. Omega 2019, 85, 16–25. [Google Scholar] [CrossRef]
- Wu, J.; Zhu, Q.; Cook, W.D.; Zhu, J. Best Cooperative Partner Selection and Input Resource Reallocation Using DEA. J. Oper. Res. Soc. 2016, 67, 1221–1237. [Google Scholar] [CrossRef]
- Charnes, A.; Cooper, W.W.; Rhodes, E. Measuring the Efficiency of Decision Making Units. Eur. J. Oper. Res. 1978, 2, 429–444. [Google Scholar] [CrossRef]
- Imanirad, R.; Cook, W.D.; Zhu, J. Partial Input to Output Impacts in DEA: Production Considerations and Resource Sharing among Business Subunits. Nav. Res. Logist. 2013, 60, 190–207. [Google Scholar] [CrossRef]
- Castelli, L.; Pesenti, R.; Ukovich, W. A Classification of DEA Models When the Internal Structure of the Decision Making Units Is Considered. Ann. Oper. Res. 2010, 173, 207–235. [Google Scholar] [CrossRef]
- Liu, J.; Lu, L.; Lu, W. Research Fronts in Data Envelopment Analysis. Omega 2016, 58, 33–45. [Google Scholar] [CrossRef]
- Tone, K.; Tsutsui, M. Network DEA: A Slacks-Based Measure Approach. Eur. J. Oper. Res. 2009, 197, 243–252. [Google Scholar] [CrossRef]
- Ma, J.; Qi, L.; Deng, L. Additive Centralized and Stackelberg DEA Models for Two-Stage System with Shared Resources. Int. Trans. Oper. Res. 2020, 27, 2211–2229. [Google Scholar] [CrossRef]
- Li, L.; Dai, Q.; Huang, H.; Wang, S. Efficiency Decomposition with Shared Inputs and Outputs in Two-Stage DEA. J. Syst. Sci. Syst. Eng. 2016, 25, 23–38. [Google Scholar] [CrossRef]
- Avilés-Sacoto, S.V.; Cook, W.D.; Güemes-Castorena, D.; Zhu, J. Measuring Efficiency in DEA in the Presence of Common Inputs. J. Oper. Res. Soc. 2020, 71, 1710–1722. [Google Scholar] [CrossRef]
- Imanirad, R.; Cook, W.D.; Aviles-Sacoto, S.V.; Zhu, J. Partial Input to Output Impacts in DEA: The Case of DMU-Specific Impacts. Eur. J. Oper. Res. 2015, 244, 837–844. [Google Scholar] [CrossRef]
- Tone, K.; Tsutsui, M. Dynamic DEA with Network Structure: A Slacks-Based Measure Approach. Omega 2014, 42, 124–131. [Google Scholar] [CrossRef]
- Soltanzadeh, E.; Omrani, H. Dynamic Network Data Envelopment Analysis Model with Fuzzy Inputs and Outputs: An Application for Iranian Airlines. Appl. Soft Comput. J. 2018, 63, 268–288. [Google Scholar] [CrossRef]
- Moreno, P.; Lozano, S. Super SBI Dynamic Network DEA Approach to Measuring Efficiency in the Provision of Public Services. Int. Trans. Oper. Res. 2018, 25, 715–735. [Google Scholar] [CrossRef]
- Yan, Q.; Zhao, F.; Wang, X.; Yang, G.; Baležentis, T.; Streimikiene, D. The Network Data Envelopment Analysis Models for Non-Homogenous Decision Making Units Based on the Sun Network Structure. Cent. Eur. J. Oper. Res. 2019, 27, 1221–1244. [Google Scholar] [CrossRef]
- Gharakhani, D.; Toloie Eshlaghy, A.; Fathi Hafshejani, K.; Kiani Mavi, R.; Hosseinzadeh Lotfi, F. Common Weights in Dynamic Network DEA with Goal Programming Approach for Performance Assessment of Insurance Companies in Iran. Manag. Res. Rev. 2018, 41, 920–938. [Google Scholar] [CrossRef]
- Chao, S.L.; Yu, M.M.; Hsieh, W.F. Evaluating the Efficiency of Major Container Shipping Companies: A Framework of Dynamic Network DEA with Shared Inputs. Transp. Res. Part A Policy Pract. 2018, 117, 44–57. [Google Scholar] [CrossRef]
- Zhou, X.; Xu, Z.; Chai, J.; Yao, L.; Wang, S.; Lev, B. Efficiency Evaluation for Banking Systems under Uncertainty. Omega 2019, 85, 68–82. [Google Scholar] [CrossRef]
- An, Q.; Meng, F.; Xiong, B.; Wang, Z.; Chen, X. Assessing the Relative Efficiency of Chinese High-Tech Industries: A Dynamic Network Data Envelopment Analysis Approach. Ann. Oper. Res. 2020, 290, 707–729. [Google Scholar] [CrossRef]
- Shapley, L. A Value for N-Person Games. Ann. Math. Stud. 1953, 28, 307–318. [Google Scholar]
- Schmeidler, D. The Nucleolus of a Characteristic Function Game. SIAM J. Appl. Math 1969, 17, 1163–1170. [Google Scholar] [CrossRef]
- Lozano, S.; Hinojosa, M.A.; Mármol, A.M.; Borrero, D.V. DEA and Cooperative Game Theory. In Handbook of Operations Analytics Using Data Envelopment Analysis; Springer: Berlin/Heidelberg, Germany, 2016; pp. 215–239. ISBN 9781489977052. [Google Scholar]
- Kao, C. Network Data Envelopment Analysis: A Review. Eur. J. Oper. Res. 2014, 239, 1–16. [Google Scholar] [CrossRef]
- Avkiran, N.K.; McCrystal, A. Intertemporal analysis of organizational productivity in residential aged care networks: Scenario analyses for setting policy targets. Health Care Manag. Sci. 2014, 17, 113–125. [Google Scholar] [CrossRef]
- Lozano, S. Technical and Environmental Efficiency of a Two-Stage Production and Abatement System. Ann. Oper. Res. 2017, 255, 199–219. [Google Scholar] [CrossRef]
- Kawaguchi, H.; Tone, K.; Tsutsui, M. Estimation of the Efficiency of Japanese Hospitals Using a Dynamic and Network Data Envelopment Analysis Model. Health Care Manag. Sci. 2014, 17, 101–112. [Google Scholar] [CrossRef]
- Mariz, F.B.A.R.; Almeida, M.R.; Aloise, D. A Review of Dynamic Data Envelopment Analysis: State of the Art and Applications. Int. Trans. Oper. Res. 2018, 25, 469–505. [Google Scholar] [CrossRef]
- Färe, R.; Grosskopf, S.; Whittaker, G. Network DEA II. In Data Envelopment Analysis: A Handbook on the Modeling of Internal Structures and Networks; Springer: Berlin/Heidelberg, Germany, 2014; Volume 208, pp. 307–327. ISBN 9780387452814. [Google Scholar]
- Chao, C.M.; Yu, M.M.; Wu, H.N. An Application of the Dynamic Network Dea Model: The Case of Banks in Taiwan. Emerg. Mark. Financ. Trade 2015, 51, S133–S151. [Google Scholar] [CrossRef]
- Khushalani, J.; Ozcan, Y.A. Are Hospitals Producing Quality Care Efficiently? An Analysis Using Dynamic Network Data Envelopment Analysis (DEA). Socioecon. Plann. Sci. 2017, 60, 15–23. [Google Scholar] [CrossRef]
- Chen, C.M. A Network-DEA Model with New Efficiency Measures to Incorporate the Dynamic Effect in Production Networks. Eur. J. Oper. Res. 2009, 194, 687–699. [Google Scholar] [CrossRef]
- See, K.F.; Md Hamzah, N.; Yu, M.M. Metafrontier Efficiency Analysis for Hospital Pharmacy Services Using Dynamic Network DEA Framework. Socioecon Plann. Sci. 2021, 78, 101044. [Google Scholar] [CrossRef]
- Fukuyama, H.; Weber, W.L. Measuring Japanese Bank Performance: A Dynamic Network DEA Approach. J. Product. Anal. 2015, 44, 249–264. [Google Scholar] [CrossRef]
- Losa, E.T.; Arjomandi, A.; Hervé Dakpo, K.; Bloomfield, J. Efficiency Comparison of Airline Groups in Annex 1 and Non-Annex 1 Countries: A Dynamic Network DEA Approach. Transp. Policy 2020, 99, 163–174. [Google Scholar] [CrossRef]
- Tran, C.-D. Efficiency of the Teaching-Industry Linkage in the Australian Vocational Education and Training. Empir. Res. Vocat. Educ. Train. 2021, 13, 11. [Google Scholar] [CrossRef]
- Lim, D.J.; Kim, M.S. Measuring Dynamic Efficiency with Variable Time Lag Effects. Omega 2022, 108, 102578. [Google Scholar] [CrossRef]
- Omrani, H.; Soltanzadeh, E. Dynamic DEA Models with Network Structure: An Application for Iranian Airlines. J. Air Transp. Manag. 2016, 57, 52–61. [Google Scholar] [CrossRef]
- Kalantary, M.; Farzipoor Saen, R. Assessing Sustainability of Supply Chains: An Inverse Network Dynamic DEA Model. Comput. Ind. Eng. 2019, 135, 1224–1238. [Google Scholar] [CrossRef]
- Chang, T.S.; Tone, K.; Wu, C.H. Nested Dynamic Network Data Envelopment Analysis Models with Infinitely Many Decision Making Units for Portfolio Evaluation. Eur. J. Oper. Res. 2021, 291, 766–781. [Google Scholar] [CrossRef]
- Lin, R.; Liu, Q. Multiplier Dynamic Data Envelopment Analysis Based on Directional Distance Function: An Application to Mutual Funds. Eur. J. Oper. Res. 2021, 293, 1043–1057. [Google Scholar] [CrossRef]
- Yu, M.M.; Chen, L.H.; Hsiao, B. Dynamic Performance Assessment of Bus Transit with the Multi-Activity Network Structure. Omega 2016, 60, 15–25. [Google Scholar] [CrossRef]
- Beasley, J.E. Determining Teaching and Research Efficiencies. J. Oper. Res. Soc. 1995, 46, 441–452. [Google Scholar] [CrossRef]
- Cook, W.D.; Hababou, M.; Tuenter, H. Multicomponent Efficiency Measurement and Shared Inputs in Data Envelopment Analysis: An Applicattion to Sales and Service Performance in Bank Branches. J. Product. Anal. 2000, 14, 209–224. [Google Scholar] [CrossRef]
- Cook, W.D.; Hababou, M. Sales Performance Measurement in Bank Branches. Omega 2001, 29, 299–307. [Google Scholar] [CrossRef]
- Jahanshahloo, G.R.; Amirteimoori, A.R.; Kordrostami, S. Measuring the Multi-Component Efficiency with Shared Inputs and Outputs in Data Envelopment Analysis. Appl. Math. Comput. 2004, 155, 283–293. [Google Scholar] [CrossRef]
- Zha, Y.; Liang, L. Two-Stage Cooperation Model with Input Freely Distributed among the Stages. Eur. J. Oper. Res. 2010, 205, 332–338. [Google Scholar] [CrossRef]
- Chen, Y.; Du, J.; David Sherman, H.; Zhu, J. DEA Model with Shared Resources and Efficiency Decomposition. Eur. J. Oper. Res. 2010, 207, 339–349. [Google Scholar] [CrossRef]
- Kao, C.; Hwang, S.N. Efficiency Decomposition in Two-Stage Data Envelopment Analysis: An Application to Non-Life Insurance Companies in Taiwan. Eur. J. Oper. Res. 2008, 185, 418–429. [Google Scholar] [CrossRef]
- Ma, J. A Two-Stage DEA Model Considering Shared Inputs and Free Intermediate Measures. Expert Syst. Appl. 2015, 42, 4339–4347. [Google Scholar] [CrossRef]
- Bian, Y.; Hu, M.; Xu, H. Measuring Efficiencies of Parallel Systems with Shared Inputs/Outputs Using Data Envelopment Analysis. Kybernetes 2015, 44, 336–352. [Google Scholar] [CrossRef]
- Toloo, M.; Emrouznejad, A.; Moreno, P. A Linear Relational DEA Model to Evaluate Two-Stage Processes with Shared Inputs. Comput. Appl. Math. 2017, 36, 45–61. [Google Scholar] [CrossRef]
- Wu, J.; Xiong, B.; An, Q.; Sun, J.; Wu, H. Total-Factor Energy Efficiency Evaluation of Chinese Industry by Using Two-Stage DEA Model with Shared Inputs. Ann. Oper. Res. 2017, 255, 257–276. [Google Scholar] [CrossRef]
- Wen, Y.; Hu, J.; An, Q.; Gong, Y. Gain Measurement and Payoff Allocation for the Internal Resource Sharing Based on DEA Approach. J. Oper. Res. Soc. 2022, 74, 1105–1117. [Google Scholar] [CrossRef]
- Wen, Y.; Hu, J.; An, Q.; Ang, S. Cooperative Performance Evaluation among Homogeneous Parallel Decision Making Units with Coalition Structures. Comput. Ind. Eng. 2022, 168, 108103. [Google Scholar] [CrossRef]
- Yu, M.M.; Lin, E.T.J. Efficiency and Effectiveness in Railway Performance Using a Multi-Activity Network DEA Model. Omega 2008, 36, 1005–1017. [Google Scholar] [CrossRef]
- Banker, R.D. A Game Theoretic Approach to Measuring Efficiency. Eur. J. Oper. Res. 1980, 5, 262–266. [Google Scholar] [CrossRef]
- Banker, R.D.; Charnes, A.; Cooper, W.W.; Clarke, R. Constrained Game Formulations and Interpretations for Data Envelopment Analysis. Eur. J. Oper. Res. 1989, 40, 299–308. [Google Scholar] [CrossRef]
- Zhang, W.; Wang, X.; Qi, T.; Wu, X. Transmission Cost Allocation Based on Data Envelopment Analysis and Cooperative Game Method. Electr. Power Compon. Syst. 2018, 46, 208–217. [Google Scholar] [CrossRef]
- An, Q.; Wang, P.; Shi, S. Fixed Cost Allocation for Two-Stage Systems with Cooperative Relationship Using Data Envelopment Analysis. Comput. Ind. Eng. 2020, 145, 106534. [Google Scholar] [CrossRef]
- Nakabayashi, K.; Tone, K. Egoist’s Dilemma: A DEA Game. Omega 2006, 34, 135–148. [Google Scholar] [CrossRef]
- Li, F.; Zhu, Q.; Liang, L. Allocating a Fixed Cost Based on a DEA-Game Cross Efficiency Approach. Expert Syst. Appl. 2018, 96, 196–207. [Google Scholar] [CrossRef]
- Yang, Z.; Zhang, Q. Resource Allocation Based on DEA and Modified Shapley Value. Appl. Math. Comput. 2015, 263, 280–286. [Google Scholar] [CrossRef]
- Emrouznejad, A.; Yang, G.-L. A Survey and Analysis of the First 40 Years of Scholarly Literature in DEA: 1978–2016. Socioecon. Plann. Sci. 2018, 61, 4–8. [Google Scholar] [CrossRef]
- Nakabayashi, K.; Sahoo, B.; Tone, K. Fair Allocation Based on Two Criteria:A DEA Game View of “Add Them up and Divide by Two”. J. Oper. Res. Soc. Jpn. 2009, 52, 131–146. [Google Scholar]
- Wu, J.; Liang, L.; Yang, F. Determination of the Weights for the Ultimate Cross Efficiency Using Shapley Value in Cooperative Game. Expert Syst. Appl. 2009, 36, 872–876. [Google Scholar] [CrossRef]
- Li, Y.; Liang, L. A Shapley Value Index on the Importance of Variables in DEA Models. Expert Syst. Appl. 2010, 37, 6287–6292. [Google Scholar] [CrossRef]
- Lozano, S. Information Sharing in DEA: A Cooperative Game Theory Approach. Eur. J. Oper. Res. 2012, 222, 558–565. [Google Scholar] [CrossRef]
- Lozano, S.; Hinojosa, M.A.; Mármol, A.M. Set-Valued DEA Production Games. Omega 2015, 52, 92–100. [Google Scholar] [CrossRef]
- Rezaee, M.J. Using Shapley Value in Multi-Objective Data Envelopment Analysis: Power Plants Evaluation with Multiple Frontiers. Int. J. Electr. Power Energy Syst. 2015, 69, 141–149. [Google Scholar] [CrossRef]
- Li, Y.; Xie, J.; Wang, M.; Liang, L. Super Efficiency Evaluation Using a Common Platform on a Cooperative Game. Eur. J. Oper. Res. 2016, 255, 884–892. [Google Scholar] [CrossRef]
- Hinojosa, M.A.; Lozano, S.; Borrero, D.V.; Mármol, A.M. Ranking Efficient DMUs Using Cooperative Game Theory. Expert Syst. Appl. 2017, 80, 273–283. [Google Scholar] [CrossRef]
- Omrani, H.; Shafaat, K.; Emrouznejad, A. An Integrated Fuzzy Clustering Cooperative Game Data Envelopment Analysis Model with Application in Hospital Efficiency. Expert Syst. Appl. 2018, 114, 615–628. [Google Scholar] [CrossRef]
- He, W.; Yang, Y.; Wang, Z.; Zhu, J. Estimation and Allocation of Cost Savings from Collaborative CO2 Abatement in China. Energy Econ. 2018, 72, 62–74. [Google Scholar] [CrossRef]
- Lin, Y.; Liu, W.L.; Wang, Y.M. An Integrated Approach Using Cross-Efficiency and Shapley Value in Performance Evaluation. Econ. Comput. Econ. Cybern. Stud. Res. 2019, 53, 209–224. [Google Scholar] [CrossRef]
- Li, Y.; Li, F.; Emrouznejad, A.; Liang, L.; Xie, Q. Allocating the Fixed Cost: An Approach Based on Data Envelopment Analysis and Cooperative Game. Ann. Oper. Res. 2019, 274, 373–394. [Google Scholar] [CrossRef]
- Omrani, H.; Shafaat, K.; Alizadeh, A. Integrated Data Envelopment Analysis and Cooperative Game for Evaluating Energy Efficiency of Transportation Sector: A Case of Iran. Ann. Oper. Res. 2019, 274, 471–499. [Google Scholar] [CrossRef]
- Omrani, H.; Amini, M.; Babaei, M.; Shafaat, K. Use Shapley Value for Increasing Power Distinguish of Data Envelopment Analysis Model: An Application for Estimating Environmental Efficiency of Industrial Producers in Iran. Energy Environ. 2020, 31, 656–675. [Google Scholar] [CrossRef]
- Li, F.; Emrouznejad, A.; Yang, G.L.; Li, Y. Carbon Emission Abatement Quota Allocation in Chinese Manufacturing Industries: An Integrated Cooperative Game Data Envelopment Analysis Approach. J. Oper. Res. Soc. 2020, 71, 1259–1288. [Google Scholar] [CrossRef]
- Meng, F.; Wu, L.; Chu, J. Allocating the Fixed Cost Based on Data Envelopment Analysis in View of the Shapley Value. Expert Syst. 2020, 37, e12539. [Google Scholar] [CrossRef]
- Omrani, H.; Fahimi, P.; Mahmoodi, A. A Data Envelopment Analysis Game Theory Approach for Constructing Composite Indicator: An Application to Find out Development Degree of Cities in West Azarbaijan Province of Iran. Socioecon. Plann. Sci. 2020, 69, 100675. [Google Scholar] [CrossRef]
- Banihashemi, S.A.; Khalilzadeh, M. A New Approach for Ranking Efficient DMUs with Data Envelopment Analysis. World J. Eng. 2020, 17, 573–583. [Google Scholar] [CrossRef]
- Li, Z.; Zhao, T.; Wang, J.; Cui, X. Two-Step Allocation of CO2 Emission Quotas in China Based on Multi-Principles: Going Regional to Provincial. J. Clean. Prod. 2021, 305, 127173. [Google Scholar] [CrossRef]
- Zhuang, Z.; Fu, S.; Lan, S.; Yu, H.; Yang, C.; Huang, G.Q. Research on Economic Benefits of Multi-City Logistics Development Based on Data-Driven Analysis. Adv. Eng. Inform. 2021, 49, 101322. [Google Scholar] [CrossRef]
- Wen, Y.; An, Q.; Hu, J.; Chen, X. DEA Game for Internal Cooperation between an Upper-Level Process and Multiple Lower-Level Processes. J. Oper. Res. Soc. 2022, 73, 1949–1960. [Google Scholar] [CrossRef]
- An, Q.; Wang, P.; Zeng, Y.; Dai, Y. Cooperative Social Network Community Partition: A Data Envelopment Analysis Approach. Comput. Ind. Eng. 2022, 172, 108658. [Google Scholar] [CrossRef]
- Peng, X.; Cui, H. Incentive Policy Research on the Excess Profit Allocation in Wind Power Projects Based on DEA Game. J. Energy Eng. 2016, 142, 04015019. [Google Scholar] [CrossRef]
- Lozano, S. DEA Production Games. Eur. J. Oper. Res. 2013, 231, 405–413. [Google Scholar] [CrossRef]
- Ratner, S.V.; Shaposhnikov, A.M.; Lychev, A.V. Network DEA and Its Applications (2017–2022): A Systematic Literature Review. Mathematics 2023, 11, 2141. [Google Scholar] [CrossRef]
- Camanho, A.S.; Silva, M.C.; Piran, F.S.; Lacerda, D.P. A Literature Review of Economic Efficiency Assessments Using Data Envelopment Analysis. Eur. J. Oper. Res. 2023, 315, 1–18. [Google Scholar] [CrossRef]
Disclaimer/Publisher’s Note: The statements, opinions and data contained in all publications are solely those of the individual author(s) and contributor(s) and not of MDPI and/or the editor(s). MDPI and/or the editor(s) disclaim responsibility for any injury to people or property resulting from any ideas, methods, instructions or products referred to in the content. |
© 2024 by the authors. Licensee MDPI, Basel, Switzerland. This article is an open access article distributed under the terms and conditions of the Creative Commons Attribution (CC BY) license (https://creativecommons.org/licenses/by/4.0/).