Abstract
In the era of self-media, the spontaneity and anonymity of information dissemination have led to a surge in rumors, posing significant challenges to cybersecurity. This paper introduces a novel dual-layer rumor control model for studying collaborative rumor-debunking efforts. Utilizing mathematical modeling and simulation methods, we propose key thresholds for rumor propagation from both theoretical and simulation perspectives, and explore optimal methods for rumor control. Our model is validated with real data from actual cases, confirming its accuracy and the effectiveness. The study shows that without intervention, rumors will spread rapidly. Both constant and dynamically optimized control significantly slow down the spread of rumors. However, dynamic optimization control significantly reduces control costs compared to fixed control schemes. Moreover, we find that controlling only the media layer is insufficient. These findings highlight the importance of meticulous approaches to rumor control in the digital age.
Keywords:
collaborative debunking strategy; public refutation; information distortion; propagation efficacy; optimal control MSC:
49K15
1. Introduction
A rumor is unverified information circulated across communication channels, impacting areas such as epidemic prevention, public policy, social events, medical health, and natural phenomena. In today’s ‘self-media era’, rumor dissemination is faster and more extensive, amplifying its societal harm. Rumor spread can have adverse effects on the online environment and social stability and erode trust in traditional media and government institutions. Effective control of rumors is of paramount importance.
Research on rumor spread predominantly employs mathematical modeling. The study of rumor propagation models can be categorized into three stages: classical offline interpersonal network models, social network models incorporating various influencing factors, and heterogeneous models that integrate network structure and contextual factors.
Classical offline interpersonal network models draw inspiration from epidemic disease spreading due to similarities in mechanisms and dissemination objects [1]. Notable models such as DK [2] and MT [3] have been widely applied to predict rumor spread in small-scale social networks characterized by word-of-mouth communication, laying the theoretical foundation for subsequent rumor propagation models. Regarding social network models that account for diverse influencing factors, researchers have developed isomorphic models from various perspectives. These models consider elements like opinion leaders, repetitive retweeting behaviors [4,5], public biases [6], user experiences [7], multilingual contexts [8], and uncertain propagation environments [9,10] to analyze critical nodes and pathways. In the realm of heterogeneous network rumor propagation models, researchers have devised models that account for the diverse nature of social networks. For instance, Shioda et al. [11] explored the specific effects of strong information correlation on the Twitter platform, while Zhao et al. [12] introduced a novel rumor propagation model based on scale-free networks.
The inhibitory effect of media on rumor spreading cannot be ignored, Zhao et al. [13] specifically studied the effect of positive and negative media reports on rumor spreading, and they established a new class of rumor-spreading model. In addition, rumor screening and anti-rumor behaviors of the public have also been studied. Xiao et al. [14] proposed a rumor propagation dynamics model based on evolutionary games and anti-rumor information, proving that rumors are not only influenced by anti-rumor information but also by user behaviors and psychological factors. Zhu et al. [15] established a reaction–diffusion rumor propagation model by considering a non-smooth control function to reflect government and media refutation of rumor propagation. Pan et al. [16] comprehensively considered population- and media-debunking mechanisms and established a class of rumor propagation model. Zhong et al. [17] similarly considered the population’s refutation behavior of rumor and designed a randomized sedation scheme to suppress rumor propagation. The above models gradually improve the research on rumor propagation in social networks, and to a certain extent, reflect the propagation characteristics of public opinion information, as well as the process of public opinion propagation under external intervention or considering the influence of a person’s own psychology and behavior. The above models have studied the dynamics of rumors from the perspective of public refutation or media rumor debunking alone, but the responses of the public and media to rumors are two-sided, and the two are coupled with each other and work together. However, there is no rumor propagation model that integrates public refutation and media behavior.
Many articles have discussed optimal control [18,19,20,21,22,23,24,25,26,27,28,29,30,31,32,33], with Ding, Li, et al. [20] establishing the Controlled Rumor–Truth Spreading Model, which considers the isolation of rumor spreaders and the effects of time. They used the variational method to obtain optimal control quantities and conducted simulations. Conversely, Xupeng Luo, Haijun Jiang, et al. [30] considered the multilingual environment and intervention mechanism, establishing the I2SR rumor propagation model. They obtained optimal control conditions using Pontryagin’s minimum principle. However, none of the above-mentioned articles fully consider media control.
Few works consider the role of the media in guiding the spread of rumors, let alone simultaneously considering the public’s refutation behavior of rumors. Therefore, this paper focuses on the coupled propagation between a virtual layer with media intervention and a social network layer that incorporates public refutation. The main contributions of this paper are as follows:
- A two-layer rumor propagation model under the coupling of virtual and real layers is established by comprehensively considering the propagation and clarification of rumors by the media and the propagation and refutation of rumors by the public;
- We analyze the dynamic behavior of the control model and propose optimal control schemes. Theoretical proofs demonstrate the existence and stability of equilibrium points in the model, along with the expression for the optimal control strategy;
- Based on real case data, we verify the accuracy of the model and the effectiveness of the collaborative control strategy through simulation experiments. By comparing experimental data, we demonstrate that the cost under the collaborative rumor debunking strategy is significantly lower than that under a single control strategy.
The rest of the paper is organized as follows. Section 2 deals with the modeling and preparation. The establishment of equilibrium points and their stability analysis are studied in Section 3. The optimal control of the model is given in Section 4. In Section 5, the simulation analysis of the model in conjunction with a real case is given.
2. Model Formulation
In the modern era, a large number of social groups acting as media join in the spread of rumors, and their guiding effect is extremely obvious. As the main body of rumor dissemination, a person’s subjective judgment on rumors also has a great influence on rumor dissemination. Considering the above factors, a virtual reality two-layer rumor propagation model is established, where the virtual layer (V) denotes the network constructed by media such as virtual online social network platforms like Facebook, TikTok, etc., which spreads or clarifies the rumors through the form of articles, videos, etc., and the real layer (R) denotes the social network constructed by real human beings, such as friends, family members, colleagues, etc., through language, text messages, etc., which is used to share or refute rumors.
2.1. Establishment of the Virtual Layer (V)
The media in the virtual layer (V) are classified into three types, namely, silent media (Silent Media), which denotes unpublished media related to the event, rumor-spreading media (Rumor-spreading Media), which denotes media that spreads rumor-related opinions, and rumor-refuting media (Rumor-refuting Media), which denotes media that spreads rumor-refuting media. At a certain moment, each type of media may be in one of the above three states, and the specific transition relationship is shown in Figure 1.
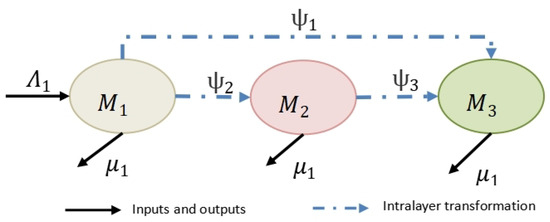
Figure 1.
Relationships between Media in Virtual layer V.
Next, we provide a detailed description of the specific dissemination process of the V-layer and its corresponding parameters. First of all, each individual or section of the public can create independently and thus have the nature of media, or can stop creating and withdraw from the dissemination platform. Therefore, there are always inputs and outputs in the V-layer, and we assume that newly registered media enter the V-layer with probability , and existing media exit the V-layer with probability . Secondly, the media can not identify the truth of a rumor on first learning about it, so there are two possible transformation states: rumor spreading and rumor refuting. Therefore, we assume that silent media transform into rumor-refuting media with probability , and transform into rumor-spreading media with probability . In addition, rumor-spreading media may change their viewpoints under the influence of positive information from rumor-refuting media, and we assume that the conversion rate is .
2.2. Establishment of the Real Layer (R)
The sections of the public in the Reality (R) layer are classified into five types, namely, Unknowns S (Suspicious), a section of the public that indicates susceptibility to unknown rumors, Information Disseminators H (Hesitate), a section of the public that indicates known information and disseminates information directly without thinking, Rumor Spreaders (Infective), a section of the public that indicates known information and spreads rumors with a negative attitude, Rumor Debunkers (Independent), a section of the public that indicates that information is known and spreads disinformation in a positive manner, and Silent R (Reticent), a section of the public that expresses a loss of interest in a topic and no longer makes relevant statements. At a certain moment, each section of the public may be in one of the above five states, and the specific transformation relationship is shown in Figure 2.
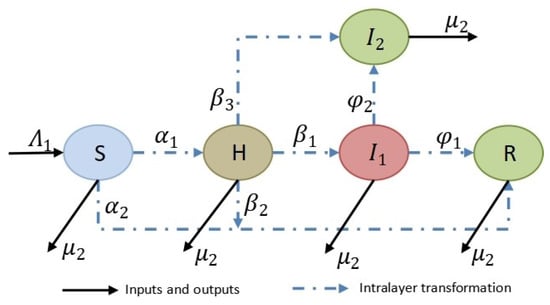
Figure 2.
Relationships between sections of the public in Reality layer R.
Next, we give a detailed description of the specific propagation process of the R layer and its corresponding parameters. Firstly, because the subjective judgment of human beings and the degree of interest in the event will be changed by external influences, the sections of the public will change dynamically over time. Therefore, there are inputs and outputs in the R layer at all times, and we assume that the newly joined unknowns enter the R layer with probability and the already existing sections of the public exit the system with probability . Secondly, most rumors do not have the nature of rumors when they are initially spread, but are spread only as information. Therefore, we assume that the unknowns, when exposed to the information, may either disseminate the information directly without thinking or remain silent because they are not interested in the information. Therefore, we assume that the probability that the unknowns will be transformed into information disseminators is and the probability that they will be transformed into silencers is . In addition, information disseminators may develop a deterministic attitude towards information after being influenced by rumors spreading in real social networks. Therefore, we assume that the probability that a information disseminator will transform into a rumor spreader is , the probability that he/she will transform into a rumor debunker is , and the probability that he/she will transform into a silencer is . Finally, rumor spreaders may change their negative attitudes or lose interest in rumors over time or for their own reasons after being positively influenced by rumor debunkers in real social networks. Therefore, we assume that the probability of a rumor spreader changing to a rumor debunker is and the probability of changing to a silencer is .
2.3. The Coupling between the Virtual Layer and Real Layer
Based on the above propagation criteria, the following kinetic equations for this model are obtained:
The specific transformational relationships of the model are shown in Figure 3.
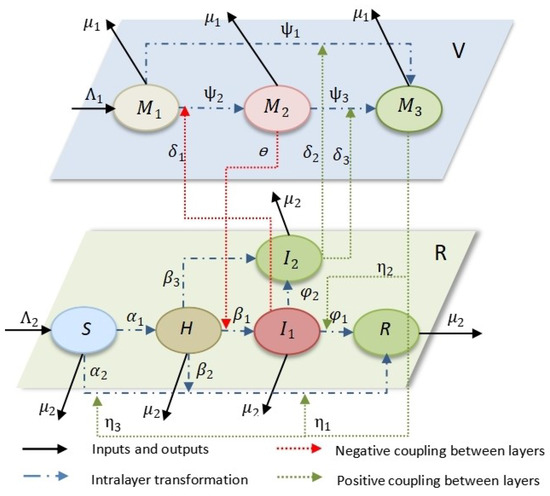
Figure 3.
transformation relationships.
Based on the above analysis, the state transitions in social networks under virtual reality are obtained. The parameters in the model and the meanings of their representations are shown in Table 1.

Table 1.
Parameters and implications in the model.
Remark 1.
In Dong et al. [18], a two-layer model of rumor propagation considering media intervention was developed. The difference between the model developed in this paper and [18] is that the role of public refutation is also considered, which makes the developed model more complex but more practical.
The initial values of the model satisfy: , , , , , ,
Let
From model (1) and Equation (2), we can obtain:
And:
Let
From model (1) and Equation (4), we can obtain:
And:
Therefore, the dynamics of the model will be discussed in the following areas:
3. Dynamic Analysis
In this section, we analyze the existence and stability of equilibrium points to understand the impact of collaborative rumor-debunking strategies on the dynamics of multiple rumor propagation.
3.1. Existence of Equilibrium Points
In order to calculate the equilibrium points of model (1), we need to solve the following system of equations,
Through calculating, model (1) exists five equilibrium points as follows:
- (1)
- (2)
- (3)
- (4)
- (5)
Remark 2.
In comparison to rumor propagation models [4,5,8,12], our control model (1) has added three equilibrium points . In particular, the appearance of equilibrium point is caused by the hesitation mechanism, while the appearance of equilibrium points and is the result of the propagation and refutation of the the virtual layer.
3.2. Stability Analysis of Equilibrium Points
In model (1), it is evident that the equilibrium points , and are all points without rumor spreaders. Therefore, we can collectively refer to them as Rumor-Free Equilibrium Points (RFEP). By proving the stability of these Rumor-Free Equilibrium Points, we can assess the control effectiveness of collaborative debunking strategies.
Theorem 1.
The RFEP of model (1) is asymptotically stable for < 1 and unstable for > 1.
Proof.
Due to the local stability of the RFEP, is related to the eigenvalues of the corresponding Jacobian matrix J(), and the Jacobian matrix at the rumor-free equilibrium is as follows:
.
By a simple calculation, the characteristic equation of ) is obtained according to
The characteristic roots of the equation thus obtained are:
Eight eigenvalues are obtained. To render them all negative, additional constraints on , , are necessary. This is achieved by rearranging terms such that all unknown parameters appear to the left of the ‘less than’ sign, with the right side being 1. This entire left-hand side of the resulting inequality is termed the thresholds , , :
This shows that there are negative real parts only when satisfy , and . By the Hartman–Grobman Theorem, it can be judged that is asymptotically stable for and unstable for . □
Theorem 2.
The RFEP of model (1) is asymptotically stable for < 1 and unstable for > 1.
Proof.
Due to the local stability of the RFEP, is related to the eigenvalues of the corresponding Jacobian matrix J(), and the Jacobian matrix at the rumor-free equilibrium is as follows:
where
.
By a simple calculation, the characteristic equation of ) is obtained according to
The characteristic roots of the equation thus obtained are:
Through calculation and employing the same method as in Theorem 1, we have determined the threshold value:
, , , . This shows that there are negative real parts only when satisfy and . Furthermore, when , has at least one positive real part. Therefore, it can be judged that is asymptotically stable for and unstable for . □
Theorem 3.
The RFEP of model (1) is asymptotically stable for < 1 and unstable for > 1.
Proof.
Due to the local stability of the RFEP, is related to the eigenvalues of the corresponding Jacobian matrix J(), and the Jacobian matrix at the rumor-free equilibrium is as follows:
where
By a simple calculation, the characteristic equation of ) is obtained according to
The characteristic roots of the equation thus obtained are:
Through calculation and employing the same method as in Theorem 1, we have determined the threshold value: ,
This shows that there are negative real parts only when satisfy , and . Furthermore, when , has at least one positive real part. Therefore, it can be judged that is asymptotically stable for and unstable for . □
Theorem 4.
The RFEP of model (1) is asymptotically stable for < 1 and unstable for > 1.
Proof.
Due to the local stability of the RFEP, is related to the eigenvalues of the corresponding Jacobian matrix J(), and the Jacobian matrix at the rumor-free equilibrium is as follows:
where
By a simple calculation, the characteristic equation of is obtained according to
The characteristic roots of the equation thus obtained are:
Through calculation and employing the same method as in Theorem 1, we have determined the threshold value:
This shows that there are negative real parts only when satisfy , and . Furthermore, when , has at least one positive real part. Therefore, it can be judged that is asymptotically stable for and unstable for . □
Remark 3.
Theorems 1–4 establish criteria for the stability of the four equilibrium points. When < 0 and < 1, at least one equilibrium point among the four is stable, indicating that rumors naturally fade away without the need for intervention strategies. However, when λ > 0 and R > 1, rumors persist in spreading, necessitating the implementation of control strategies. Furthermore, upon comparing these four criteria, it becomes evident that and . From this perspective, we can conclude that collaborative debunking strategies reduce the original spreading threshold of the traditional rumor propagation model. Consequently, collaborative debunking strategies play a significant inhibitory role in the context of rumor propagation.
4. Optimal Control Problems
By incorporating an optimal control approach, the spread of rumors over an expected period of time can be effectively controlled at minimal cost. In the model, we add three control variable, , , and . The control variable represents efforts to curb the spread of rumors, including measures such as imposing bans on sections of the public spreading rumors and prohibiting large-scale gathering of people offline to spread rumors. The expression represents the level of ability of rumor spreaders to convert information disseminators into rumor spreaders by spreading rumors, and reduces the ability of rumor spreaders to guide rumor spreading by adding controls. The control variables denote the control and clarification of rumors, including measures such as the government strengthening the supervision of platforms and urging the clarification of rumors, the rumor-dispelling media seizing cyberspace to enhance the power of public opinion guidance, and the implementation of measures such as criticizing, educating, and severely punishing sections of the public that spread rumors and cause serious social harm.
Therefore, the control model with the specific control intensities mentioned above can be described as:
with initial condition as in the following , , , , , , ,
We define vectors:
And there is:
The objective function is:
where , , and are cost coefficients for optimal control, is the start time, and is the end time. Our goal is to find an optimal control quantity that minimizes the value of .
The Hamiltonian function of the control problem can be described as:
, where denotes the concomitant function. Based on the above discussion, we reach the following conclusions. Optimal control problems allow for a unique optimal solution
, where t ranges from . Furthermore, there are conditions for: .
Thus, we obtain the optimal immune control strategy as:
The transverse condition is . The corresponding covariance function satisfies the auxiliary equation: Therefore, we obtain:
5. Numerical Simulaton
In this section, we will verify the accuracy of the model, the dynamic behavior of the model, and the effectiveness of the optimal control strategy through simulation experiments.
5.1. Real Data Fitting
In this study, we take the data relating to the “Hu Xinyu disappearance case” obtained from “Baidu Index” as an example. By fitting the system parameters of the model (1) (with specific parameter values as listed in the 6th column of Table 2) in the ratio of 4:1, we obtain simulation curves for rumor spreaders I1 based on the model, as shown by the red curve in Figure 4. Upon comparison with the real data represented by orange scattered points in Figure 4, it is evident that the trends of the two datasets are consistent. Therefore, model (1) can effectively predict real rumor propagation behavior.

Table 2.
Simulation parameters for each equilibrium point.
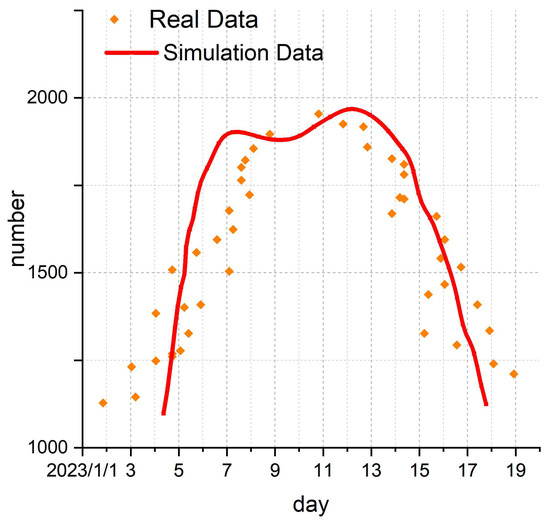
Figure 4.
Graph of rumor spreader curves for and scatter fit to real data.
5.2. Stability of Equilibrium Points
In order to verify the stability of the different equilibrium points in Section 3, we performed numerical simulations for each equilibrium point using the system parameters in Table 2.
Based on the data in Table 2, we can generate the following simulation plots.
From the plots in Figure 5, Figure 6, Figure 7, Figure 8 and Figure 9, we can conclude that at each equilibrium point, the system can eventually converge to a constant value. Therefore, the stability of each equilibrium point derived in Section 3 can be proved.
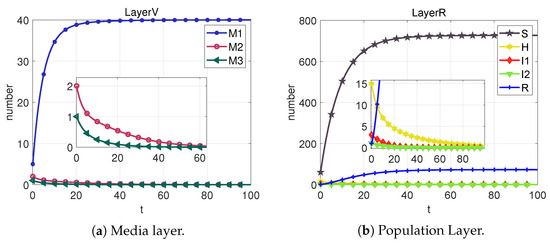
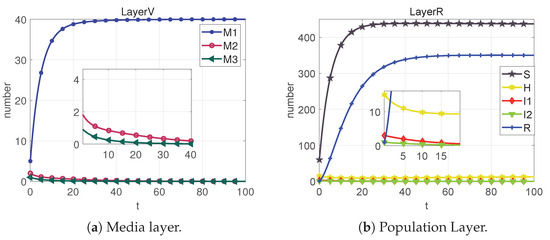
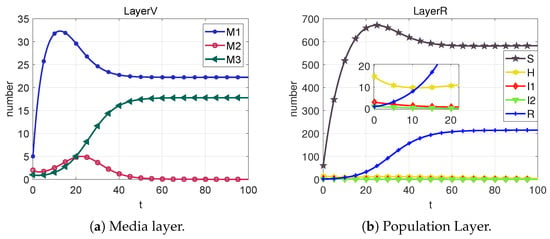
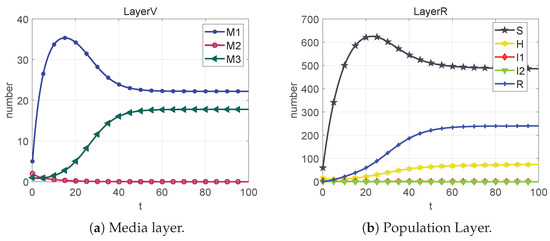
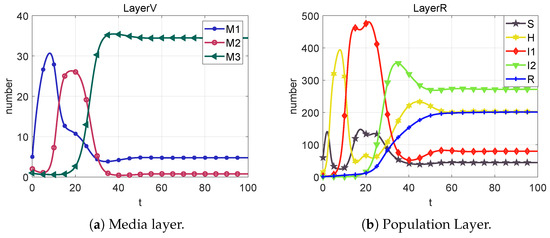
Figure 9.
Based on the sixth column of Table 2, we can calculate that . From Figure 9, we can obtain that the system cannot reach the rumor-free equilibrium point (neither I1 nor M2 eventually converge to 0) when R < 1 is not satisfied. However, each section of the public eventually converges to a number that is not 0, which we call the local equilibrium point .
5.3. Optimal Control
In Section 4, we added three control quantities , , and to the system. In order to investigate what effects these control quantities have on the system state and other control quantities, the simulation values are given here to introduce the following nine cases:
- Case 1: When the added control quantities , , and , we get Figure 9;
- Case 2: When the added control quantities , , and , we get Figure 10;
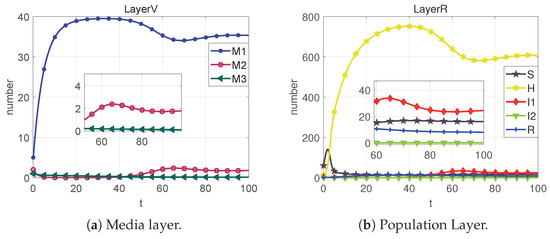 Figure 10. State change diagrams and control variable diagrams for case 2.
 - Case 3: When the added control quantities , , and , we get Figure 11;
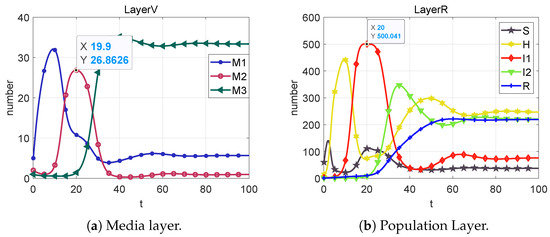 Figure 11. State change diagrams and control variable diagrams for case 3.
 - Case 4: When the added control quantities , , and , we get Figure 12;
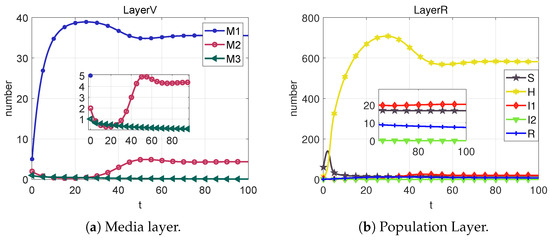 Figure 12. State change diagrams and control variable diagrams for case 4.
 - Case 5: When the added control quantities , , and , we get Figure 13;
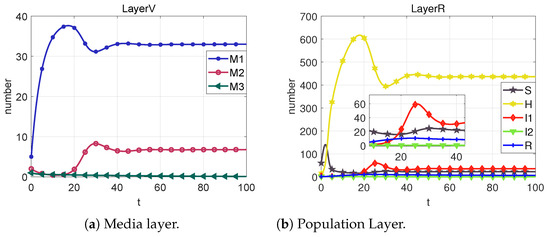 Figure 13. State change diagrams and control variable diagrams for case 5.
 - Case 6: When the added control quantities , , and , we get Figure 14;
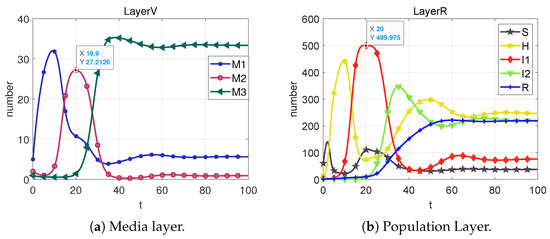 Figure 14. State change diagrams and control variable diagrams for case 6.
 - Case 7: When the added control quantities , , and , we get Figure 15;
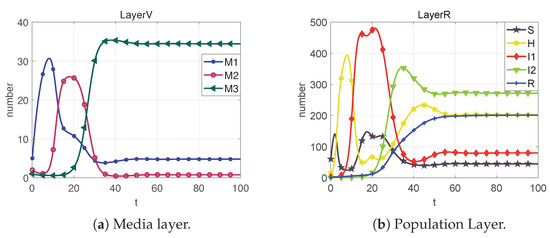 Figure 15. State change diagrams and control variable diagrams for case 7.
 - Case 8: When the added control quantity , , and , we get Figure 16;
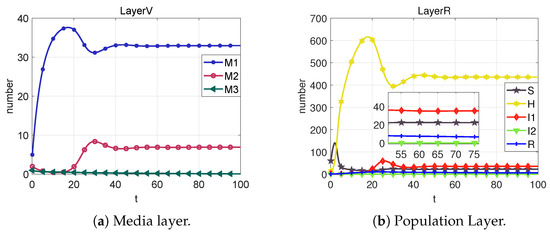 Figure 16. State change diagrams and control variable diagrams for case 8.
 - Case 9: When the added control quantities , , and , we get Figure 17.
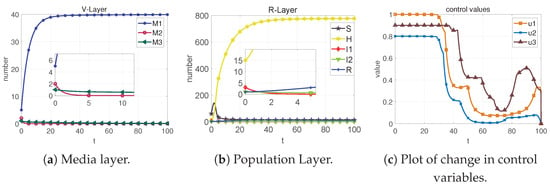 Figure 17. State change diagrams and control variable diagrams for case 9.
Remark 4.
The average of the optimal values of each control quantity can be obtained by simulation as: , , .
According to Table 3, we can obtain the statistical graphs of the various components of the control strategy optimization metrics under different cases shown in Figure 18. We use the control strategy optimization metric to measure the control capability of each control case. That is, the cases with different controls added (Cases 2–9) are compared with the case without controls added (Case 1) to find the corresponding ratio. Thus, it can be concluded that the larger the ratio, the better the control method.

Table 3.
Simulation values under different controls.

Figure 18.
Statistical graphs of control strategy optimization metrics of the various components in the objective function under different cases. (a) Control strategy optimization metrics plot for the part. (b) Control strategy optimization metrics plot for the part. (c) Control strategy optimization metrics plot for the sum of the components.
From Case 1, it is evident that, in the absence of any control measures applied to the system, rumors exhibit an initial burst of eruption, spreading rapidly. Contrasting Case 2 and Case 9, the optimal control strategy indicates that imposing robust control during the initial eruption phase and subsequently reducing the control intensity after the rumor subsides is more effective than maintaining a constant control throughout. The optimal control strategy has a 98.83% reduction compared to the constant control strategies. Importantly, the dynamic optimal control approach (Case 9) significantly elevates the level of rumor management.
Moreover, we can clearly derive from the statistics shown in Figure 18 that Case 7 has the lowest total control indicator compared to the other control cases, and thus, we can conclude that the control of the media layer alone does not curb the spread of rumors very well.
6. Conclusions
In this paper, we establish a two-layer rumor propagation model that considers the impact of the virtual layer on the external orientation of the real layer and the reciprocal influence of the real layer on the virtual one. Additionally, we incorporate the combined effect of rumor debunking by the media and the public and propose a mechanism for this collaborative effort. Utilizing this novel model, we analyze the existence and stability of various equilibrium points, theoretically substantiate the stability of these points through linearization methods, and deduce the threshold value of the rumor propagation process by calculation. This threshold delineates the suppression of rumor spreading under the collaborative efforts of the media and the public. Furthermore, we implement three different control measures into the model, reflecting pragmatic control methods, and calculate the specific expression of the optimal control. Finally, to verify the accuracy of the above analysis of equilibrium point theory and to study the suppression effect of different control measures on rumor spreading, we render a visualization of the optimization indices of the control strategy under different control scenarios through simulation.
Our findings reveal that while solitary debunking endeavors by either the media or the public can suppress the spread of rumors, a collaborative debunking approach by both can more effectively inhibit the spread of rumors. Specifically, our simulation experiments demonstrate that the cost of the non-cooperative constant control strategy is the lowest at 20.7491 (case 4), while the cost for the cooperative constant control strategy is 14.9430. However, the cost for the optimal control strategy is significantly lower at 0.1745 (case 9), representing a 98.83% reduction compared to the constant control strategies. These results offer more effective methods and strategies for preventing and intervening in the spread of rumors.
Author Contributions
Conceptualization, X.Z., Y.Z. and Y.P.; methodology, X.Z. and Y.Z.; software, Y.Z. and Y.X.; validation, X.Z., Y.Z. and J.X.; formal analysis, Y.P., J.X. and Y.X.; investigation, Y.P., J.X. and Y.X.; resources, X.Z., Y.Z. and Y.P.; data curation, Y.P., J.X. and Y.X.; writing—original draft preparation, Y.Z. and J.X.; writing—review and editing, X.Z., Y.Z., J.X., Y.X. and Y.P.; visualization, Y.Z., Y.X. and Y.P.; supervision, X.Z., Y.X. and Y.P.; project administration, X.Z., Y.P. and Y.X.; funding acquisition, Y.X. All authors have read and agreed to the published version of the manuscript.
Funding
This research was funded by the National Social Science Fund of China, project No. 21BSH023.
Data Availability Statement
No data were used to support this study.
Conflicts of Interest
The authors declare no conflicts of interest. The funders had no role in the design of the study; in the collection, analyses, or interpretation of data; in the writing of the manuscript; or in the decision to publish the results.
References
- Kermack, W.O.; McKendrick, A.G. A contribution to the mathematical theory of epidemics. R. Soc. 1927, 115, 0950–1207. [Google Scholar] [CrossRef]
- Dietz, K. Epidemics and rumors: A survey. J. R. Stat. Soc. Ser. 1967, 130, 505–528. [Google Scholar] [CrossRef]
- Goffman, W.; Newill, V. Generalization of epidemic theory. Nature 1964, 204, 225–228. [Google Scholar] [CrossRef] [PubMed]
- Yin, F.L.; Xia, X.Y.; Zhang, X.J.; Zhang, M.J.; Lv, J.H.; Wu, J.H. Modelling the dynamic emotional information propagation and guiding the public sentiment in the Chinese Sinamicroblog. Appl. Math. Comput. 2021, 396, 125884. [Google Scholar] [CrossRef]
- Lin, F.; Wu, Z.L.; Shao, X.Y.; Tang, X.Y.; Liang, T.Y.; Wu, J.H. Topic-a cluster of relevant messages-propagation dynamics: A modeling study of the impact of user repeated forwarding behavior. Appl. Math. Comput. 2022, 127, 107819. [Google Scholar] [CrossRef]
- Roshani, F.; Naimi, Y. Effects of degree-biased transmission rate and nonlinear infectivity on rumor spreading in complex social networks. Phys. Rev. E 2012, 85, 036109. [Google Scholar] [CrossRef] [PubMed]
- Ding, X.J.; Li, M.Y.; Tian, Y.; Jiang, M. RBOTUE: Rumor Blocking Considering Outbreak Threshold and User Experience. IEEE Trans. Eng. Manag. 2022. early access. [Google Scholar] [CrossRef]
- Li, J.R.; Jiang, H.J.; Yu, Z.Y. Dynamical analysis of rumor spreading model in homogeneous complex networks. Appl. Math. Comput. 2019, 359, 374–385. [Google Scholar] [CrossRef]
- Chen, X.; Zhao, L. The optimal event-triggered impulsive control of a stochastic rumor spreading model incorporating time delay using the particle swarm optimization algorithm. J. Frankl. Inst. 2023, 360, 4695–4718. [Google Scholar] [CrossRef]
- Huo, L.; Dong, Y. Dynamics and near-optimal control in a stochastic rumor propagation model incorporating media coverage and Lévy noise. Chin. Phys. B 2022, 31, 030202. [Google Scholar] [CrossRef]
- Shioda, S.; Nakajima, Y. Information spread across social network services with users’ information indifference behavior. IEEE Comput. Sci. Electron. Eng. Conf. 2019. [Google Scholar] [CrossRef]
- Zhao, D.; Sun, J.; Tan, J.W.; Dong, Y. An extended SEIR model considering homepage effect for the information propagation of online social networks. Phys. A Stat. Mech. Appl. 2018, 512, 1019–1031. [Google Scholar] [CrossRef]
- Zhao, M.; Chen, W.X.; Song, Q.K. A Modeling Study of Rumor Propagation Considering the Effects of Media Coverage. Appl. Math. Mech. 2018, 12, 1400–1410. [Google Scholar] [CrossRef]
- Xiao, Y.P.; Chen, D.Q.; Wei, S.H.; Li, Q.; Wang, H.H.; Xu, M. Rumor propagation dynamic model based on evolutionary game and anti-rumor. Nonlinear Dyn. 2019, 95, 523–539. [Google Scholar] [CrossRef]
- Ke, Y.; Zhu, L.; Wu, P. Dynamics of a reaction-diffusion rumor propagation model with non-smooth control. Appl. Math. Comput. 2022, 435, 127478. [Google Scholar] [CrossRef]
- Pan, W.; Yan, W.; Hu, Y. Dynamic analysis of a SIDRW rumor propagation model considering the effect of media reports and rumor refuters. Nonlinear Dyn. 2023, 111, 3925–3936. [Google Scholar] [CrossRef]
- Zhong, X.; Yang, Y.; Deng, F. Rumor Propagation Control with Anti-Rumor Mechanism and Intermittent Control Strategies. IEEE Trans. Comput. Soc. Syst. 2023. early access. [Google Scholar] [CrossRef]
- Dong, Y.; Huo, L.; Zhao, L. An improved two-layer model for rumor propagation considering time delay and event-triggered impulsive control strategy. Chaos Solitons Fractals 2022, 164, 112711. [Google Scholar] [CrossRef]
- Liu, G.; Tan, Z.; Liang, Z.; Chen, H.; Zhong, X. Fractional Optimal Control for malware Propagation in the Internet of Underwater Things. IEEE Internet Things J. 2021. early access. [Google Scholar] [CrossRef]
- Ding, L.; Hu, P.; Guan, Z.; Li, T. An Efficient Hybrid Control Strategy for Restraining Rumor Spreading. IEEE Trans. Syst. Man Cybern. Syst. 2021, 51, 2168–2216. [Google Scholar] [CrossRef]
- Yang, Y.; Liu, G.; Liang, Z.; Chen, H.; Zhu, L. Hybrid control for malware propagation in rechargeable WUSN and WASN: From knowledge-driven to data-driven. Chaos Solitons Fractals 2023, 173, 113703. [Google Scholar] [CrossRef]
- Zhong, X.; Luo, C.; Dong, X.; Bai, D.; Liu, G.; Xie, Y.; Peng, Y. Stochastic Stabilization of Dual-Layer Rumor Propagation Model with Multiple Channels and Rumor-Detection Mechanism. Entropy 2023, 25, 1192. [Google Scholar] [CrossRef] [PubMed]
- Guo, H.; Yan, X. Dynamic modeling and simulation of rumor propagation based on the double refutation mechanism. Inf. Sci. 2023, 630, 385–402. [Google Scholar] [CrossRef]
- Li, J.; Jiang, H.; Mei, X.; Hu, C.; Zhang, G. Dynamical analysis of rumor spreading model in multi-lingual environment and heterogeneous complex networks. Inf. Sci. 2020, 536, 391–408. [Google Scholar] [CrossRef]
- Ma, X.; Shen, S.; Zhu, L. Complex dynamic analysis of a reaction-diffusion network information propagation model with non-smooth control. Inf. Sci. 2023, 622, 1141–1161. [Google Scholar] [CrossRef]
- Mei, X.; Zhang, Z.; Jiang, H. Dynamical Analysis of Hyper-ILSR Rumor Propagation Model with Saturation Incidence Rate. Entropy 2023, 25, 805. [Google Scholar] [CrossRef] [PubMed]
- Zhang, Z.; Mei, X.; Jiang, H.; Luo, X.; Xia, Y. Dynamical analysis of Hyper-SIR rumor spreading model. Appl. Math. Comput. 2023, 446, 127887. [Google Scholar] [CrossRef]
- Chen, J.; Ma, H.; Yang, S. SEIOR Rumor Propagation Model Considering Hesitating Mechanism and Different Rumor-Refuting Ways in Complex Networks. Mathematics 2023, 11, 283. [Google Scholar] [CrossRef]
- Ding, H.; Xie, L. Simulating rumor spreading and rebuttal strategy with rebuttal forgetting: An agent-based modeling approach. Phys. A 2023, 612, 128488. [Google Scholar] [CrossRef]
- Luo, X.; Jiang, H.; Chen, S.; Li, J. Stability and optimal control for delayed rumor-spreading model with nonlinear incidence over heterogeneous networks. Chin. Phys. B 2023, 32, 058702. [Google Scholar] [CrossRef]
- Zeng, L.; Tang, M.; Liu, Y. The impacts of the individual activity and attractiveness correlation on spreading dynamics in time-varying networks. Commun. Nonlinear Sci. Numer. Simul. 2023, 122, 107233. [Google Scholar] [CrossRef]
- Jin, T.; Zhu, Y.; Shu, Y.; Cao, J.; Yan, H.; Jiang, D. Uncertain optimal control problem with the first hitting time objective and application to a portfolio selection model. J. Intell. Fuzzy Syst. 2023, 44, 1585–1599. [Google Scholar] [CrossRef]
- Zhu, Y.; Qian, P.; Su, F.; Xu, J. WeChat users’ debunking strategies in response to COVID-19 conspiracy theories: A mixed-methods study. Sage J. Home 2022, 28, 1060–1082. [Google Scholar] [CrossRef]
Disclaimer/Publisher’s Note: The statements, opinions and data contained in all publications are solely those of the individual author(s) and contributor(s) and not of MDPI and/or the editor(s). MDPI and/or the editor(s) disclaim responsibility for any injury to people or property resulting from any ideas, methods, instructions or products referred to in the content. |
© 2024 by the authors. Licensee MDPI, Basel, Switzerland. This article is an open access article distributed under the terms and conditions of the Creative Commons Attribution (CC BY) license (https://creativecommons.org/licenses/by/4.0/).